The cryo-EM structure of the human uromodulin filament core reveals a unique assembly mechanism
- Institute of Molecular Biology & Biophysics, ETH Zurich, Switzerland
- Cryo-EM Knowledge Hub (CEMK), ETH Zurich, Switzerland
- Institute of Physiology, University of Zurich, Switzerland
- Translational and Clinical Research Institute, Faculty of Medical Sciences, Newcastle University, Central Parkway, United Kingdom
- Division of Nephrology, UCLouvain Medical School, Belgium
Figures
Figure 1 with 5 supplements
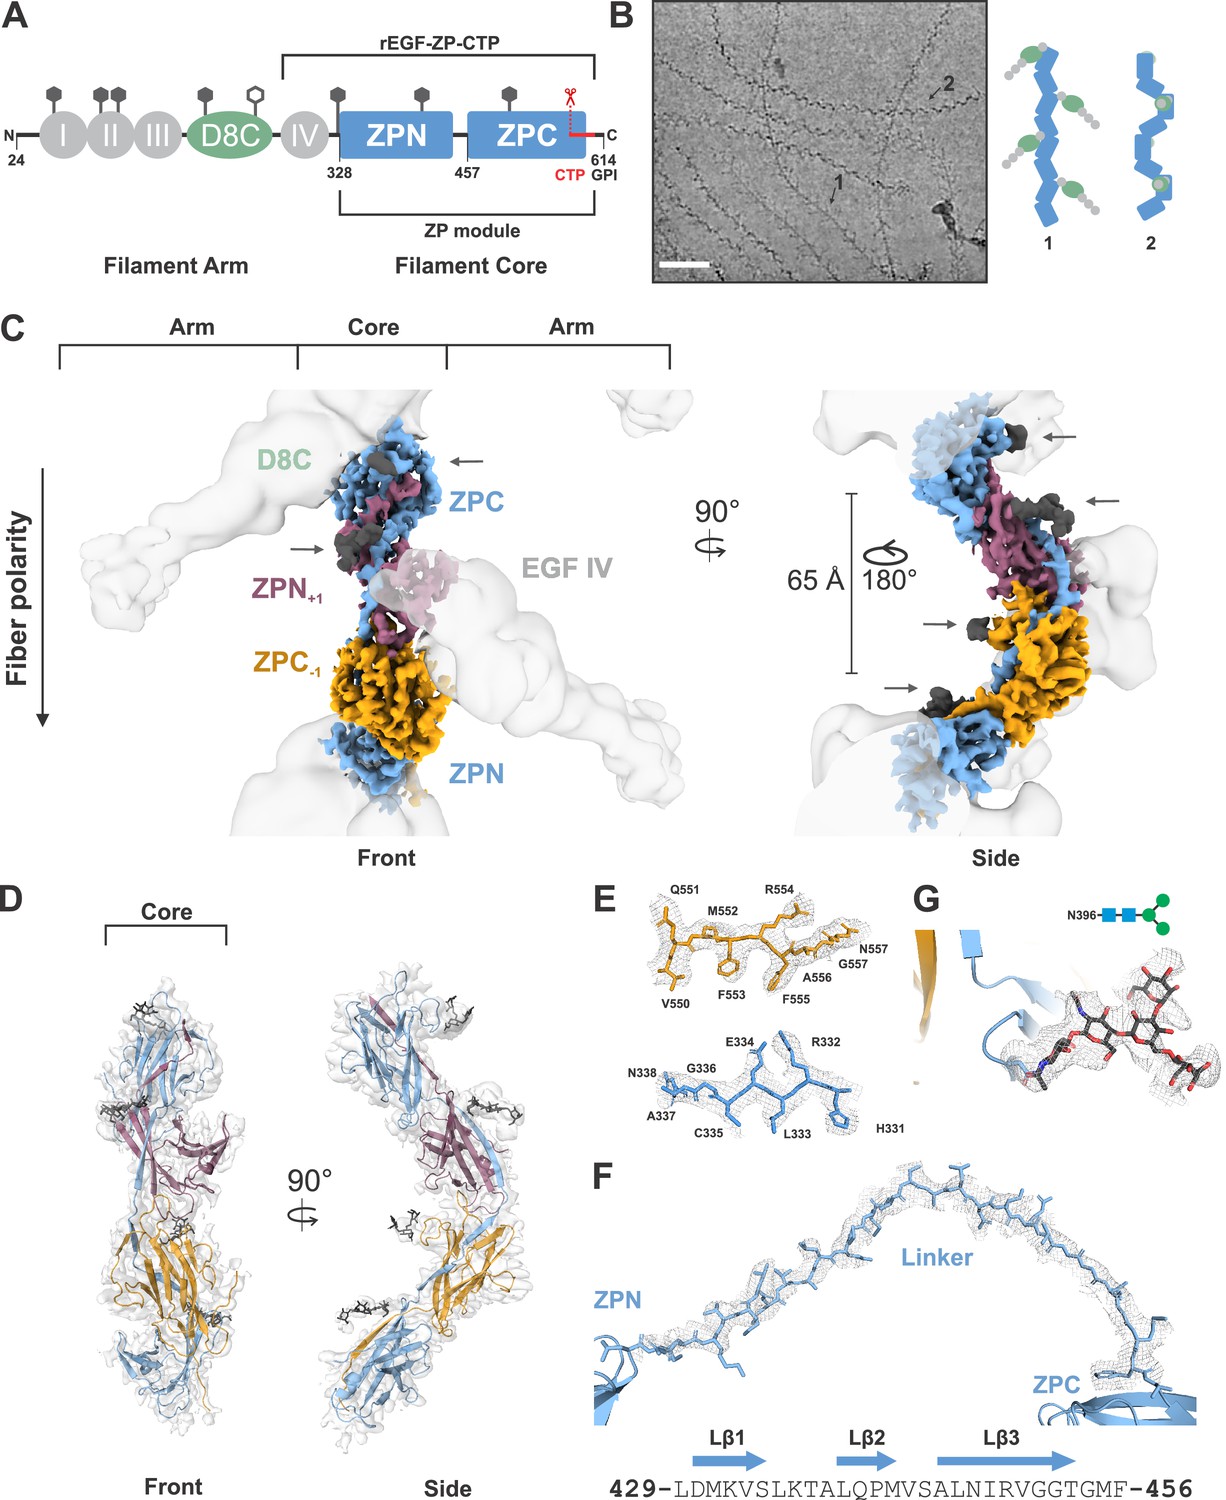
Cryo-EM structure of the human UMOD filament core.
(A) Domain architecture of the membrane-anchored pro-UMOD monomer, composed of 4 EGF-like domains (I-IV, gray), the cysteine-rich D8C domain (green), and the bipartite ZP module (ZPN and ZPC, blue). The fold of the C-terminal ZPC subdomain is extended by the GPI-anchored, C-terminal pro-peptide (CTP, red) that is cleaved by hepsin as a prerequisite of UMOD polymerization. The hepsin cleavage site (peptide bond 587‒588) is indicated by scissors. The previously crystallized UMOD segment rEGF-ZP-CTP is also indicated. The positions of the eight verified N-glycosylation sites in mature UMOD filaments are indicated above the respective domains as hexagons (filled hexagons: complex type N-glycan; open hexagon: high mannose type N-glycan). Amino acid numbering according to pre-pro-UMOD including signal sequence. (B) Representative cryo-electron micrograph showing the two major views of UMOD filaments: front view (1) and side view (2). Scale bar: 50 nm. Schematic representations of the subdomain organization of these two views are shown on the right. (C) Segmented Coulomb potential map of the mature ZP module in the filament, shown over the low-pass filtered reconstruction (at ~9 Å resolution, gray). The extended linker connecting ZPN and ZPC of the blue ZP module complements the folds of ZPN of the following and ZPC of the preceding ZP modules, (ZPN+1 and ZPC-1; plum and gold, respectively) by β-sheet complementation. The map features show a helical rise of 65 Å and a twist of 180°. The locations of the EGF IV and D8C domains from the filament arms are also indicated. The resolved N-glycan map features (dark grey) are indicated with arrows. (D) Front and side views of the refined model of the filament core within the obtained high-resolution cryo-EM map. Resolved monosaccharide units of N-glycans are shown as gray stick models. (E) Detailed view of the map features at selected regions in ZPN (blue) and ZPC (gold), illustrating the quality of the final cryo-EM model. (F) Contiguous Coulomb potential map (mesh) around the extended linker segment that harbors the β-strands Lβ1‒Lβ3. Lβ1 and Lβ2 complement the ZPC fold of the preceding UMOD subunit, and Lβ3 complements ZPN of the following UMOD subunit. (G) Coulomb potential map around the core pentasaccharide of the complex type N-glycan attached to N396 in ZPN. Blue squares: N-acetylglucosamine; green circles: mannose.
Figure 1—figure supplement 1

Cryo-EM data evaluation for UMOD filaments.
(A) Fourier shell correlation (FSC) curves for the final high-resolution map from cryoSPARC including masked and ‘corrected’ half-maps (3.47 Å at 0.143 FSC cut-off) and FSC curves for the refined model versus final map (3.99 Å at 0.5 FSC cut-off). FSC cut-off values are shown as black dotted lines. (B) FSC curves for the final map from cisTEM (4.70 Å at 0.143 FSC cut-off, ‘corrected’). Half-map FSCs where calculated in cryoSPARC v2. (C) Local resolution of the masked central part of the high-resolution cryoSPARC map used for the asymmetric unit of ZP module model building and refinement. (D) Local resolution of the masked cisTEM map used for the full ZP module refinement. (E) Local resolution visualization of the high-resolution cryoSPARC map in the asymmetric unit. (F) Local resolution visualization of the cisTEM map. (G) Angular distribution plot from the high-resolution cryoSPARC map. Two preferred orientations are at ~20° and ~105°. (H) Distinct UMOD projections, including the rotation angles shown for the 3D volume projections (upper) and 2D classes (lower) indexed by the angular distribution in (B). Front and side views are the most observed orientations, as indicated in Figure 1. Glycans are indicated with white arrows.
Figure 1—figure supplement 2
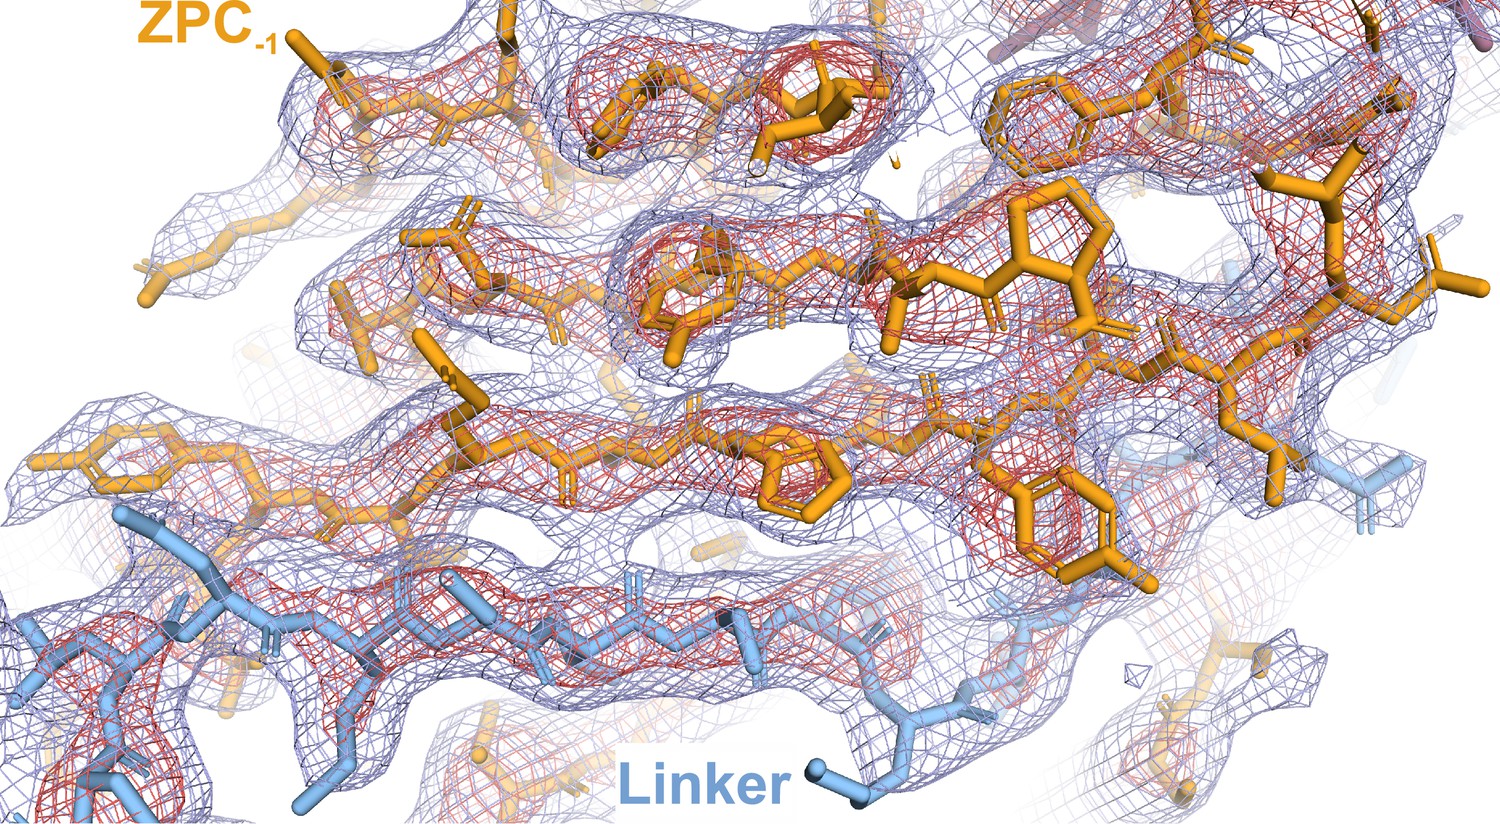
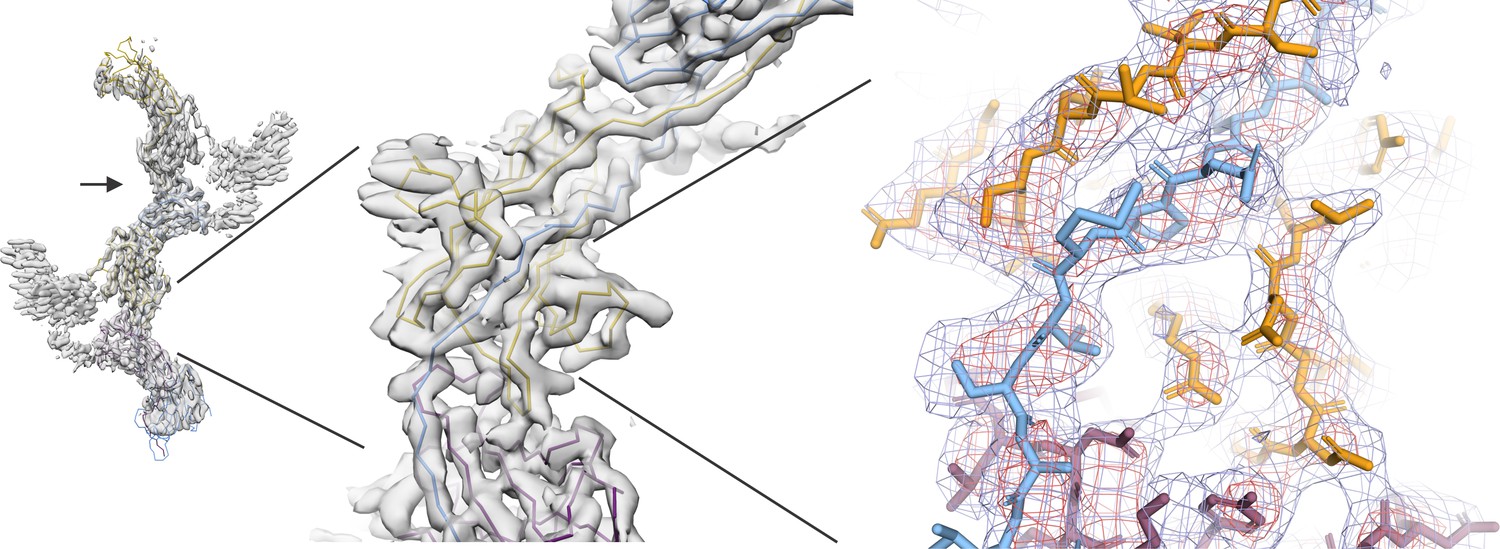
Representative image of the high-resolution cryoSPARC Coulomb potential map fitted with the asymmetric unit (AU) UMOD model.
Detailed view of the Coulomb potential map illustrating the quality of the main chain fitting. The Coulomb potential is visualized as a mesh at two different contour levels: 18 and 10 σ (red and blue, respectively). The linker region (ZPN, blue) spans the adjacent ZPC (gold), complementing the fold.
Figure 1—figure supplement 3
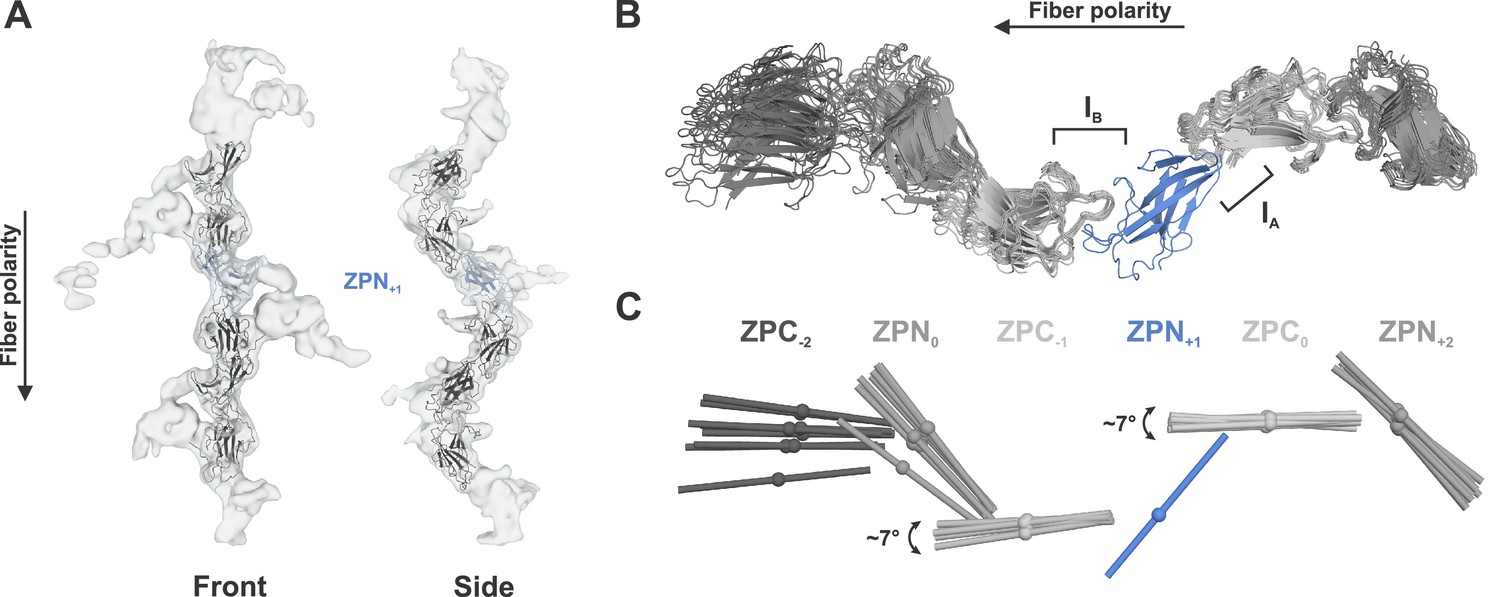
Flexibility analysis of native UMOD filaments.
(A) Individual ZP subdomains were rigid body docked into 3D class averages from different cryo-EM refinement packages (cryoSPARC and cisTEM). Once fitted, the positions of the subdomains were saved relative to one another to create a single UMOD polymer. A representative fit for the cisTEM map is shown, with the map in gray, individual ZP subdomains in black or blue (ZPN used for alignment). Four 3D class averages from cryoSPARC and five 3D class averages from cisTEM were used. (B) Models fitted into 3D class averages were aligned on the ZPN+1 subunit (blue). (C) Flexibility between the individual ZP subdomains is visualized as the maximum angle between subdomains at the same position, measured by comparing the fitted axes in Chimera. The farther from the aligned subdomain, the greater the observed ranges of relative angles, as the angular difference propagates along the chain.
Figure 1—video 1
Cryo-EM map of a native UMOD filament.
Identified surface N-glycans are highlighted (complex-type, blue; high mannose, green).
Figure 1—video 2
3D variability analysis of UMOD filaments.
Results of 3D Variability (3DVA) analysis performed in cryoSPARC on ~723,000 particles. Particles were subjected to 10-dimentional analysis and two major distinct movements identified by the 3DVA analysis are shown as Variability component 1 (A) and 2 (B). Maps generated by 3DVA are shown at the minimum (blue) and maximum (red) values of each variability component. (A) Component one describes the yaw and pitch movement of UMOD filament along the filament axis similar to the movement described by the 3D classification. Major motion axes are indicated with dotted lines. (B) Component two resolved the UMOD elongation movement along the filament axis.
Figure 2 with 2 supplements
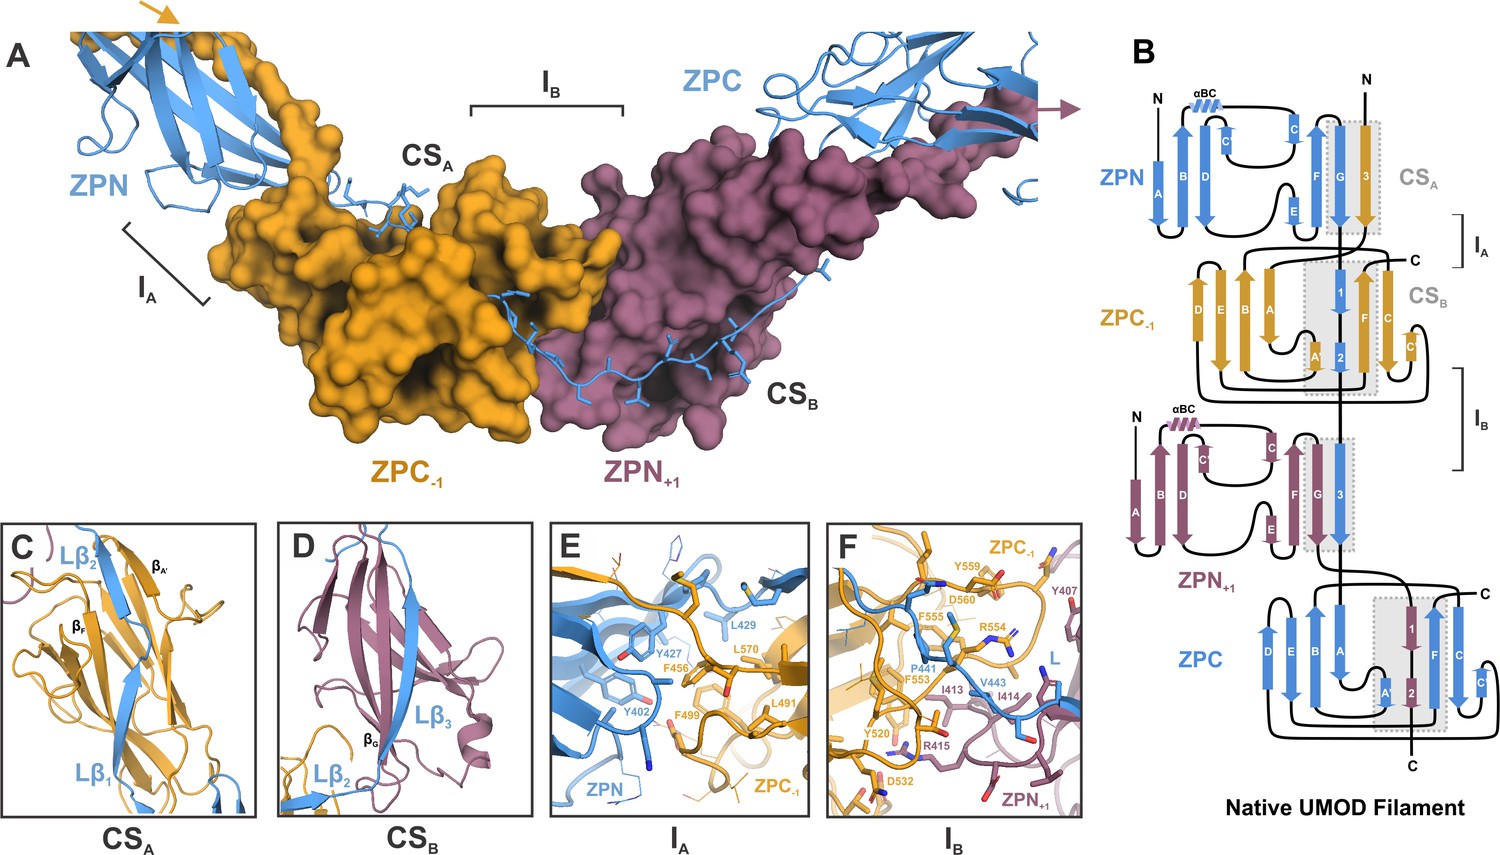
Inter-molecular β-sheet complementation in the ZP subdomains results in extensive interactions between neighboring subunits in the UMOD filament.
(A) Cartoon representation of the ZP module of subunit n (blue) in complex with subdomain ZPN+1 (plum) and the subdomain ZPC-1 (gold) as surface representations. The total length of the polypeptide backbone of the extended 28-residue linker between ZPN and ZPC (stick representation) is approximately 103 Å. The β-sheet complementation sites CSA, between the linker strands Lβ1/Lβ2 and ZPC‒1, and CSB, between linker strand Lβ3 and ZPN+1, as well as the interfaces between the subdomains ZPN and ZPC-1 (interface IA) and ZPN+1 and ZPC (interface IB) are indicated. (B) Topology model indicating secondary structure elements of mature UMOD filaments based on the solved cryo-EM structure. (C) Complementation site A (CSA): the linker strands Lβ1 and Lβ2 complement the incomplete fold of ZPC-1 by interacting with its strand βF and βA’, respectively. (D) Complementation site B (CSB): the linker strand Lβ3 complementing the fold of ZPN+1 by interaction with its strand βG.(E) Interface A (IA) between ZPNn (blue) and ZPC‒1 (gold) showing extensive intermolecular hydrophobic interactions between the subdomains. Residues forming the interface are shown as sticks and labeled with the corresponding residue numbers (same color code as in A). (F) Interface B (IB) between ZPC‒1 (gold), ZPN+1 (plum) and the linker peptide (blue) is stabilized by electrostatic and hydrophobic interactions. Loops of the ZP subdomains meet as a coupler with the linker spanning across.
Figure 2—figure supplement 1
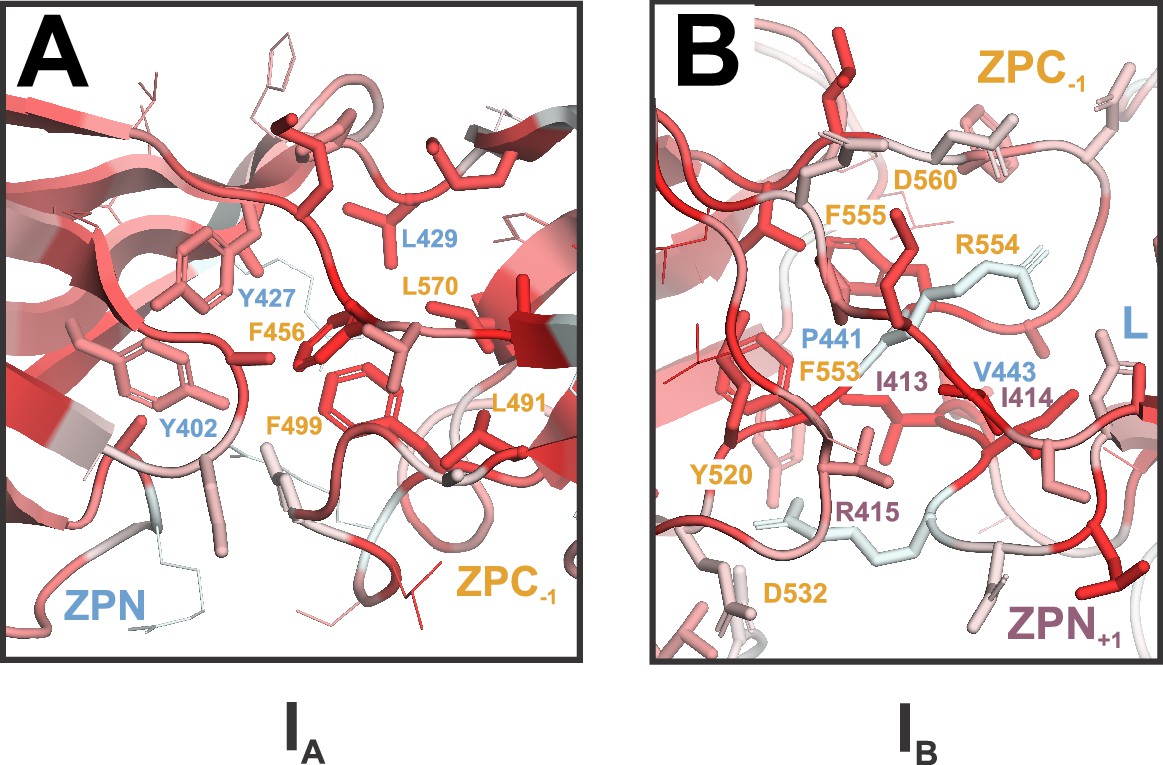
UMOD ZP module interfaces are stabilized by hydrophobic packing.
(A) Interface A (IA) colored by hydrophobicity of residues (based on the Eisenberg scale of hydrophobicity; dark red = most hydrophobic, white = least hydrophobic). Residue labels are colored by subdomain (as in Figure 2). (B) Interface B (IB) colored by hydrophobicity of residues, as in (A). Residue labels are colored by subdomain (as in Figure 2).
Figure 2—figure supplement 2
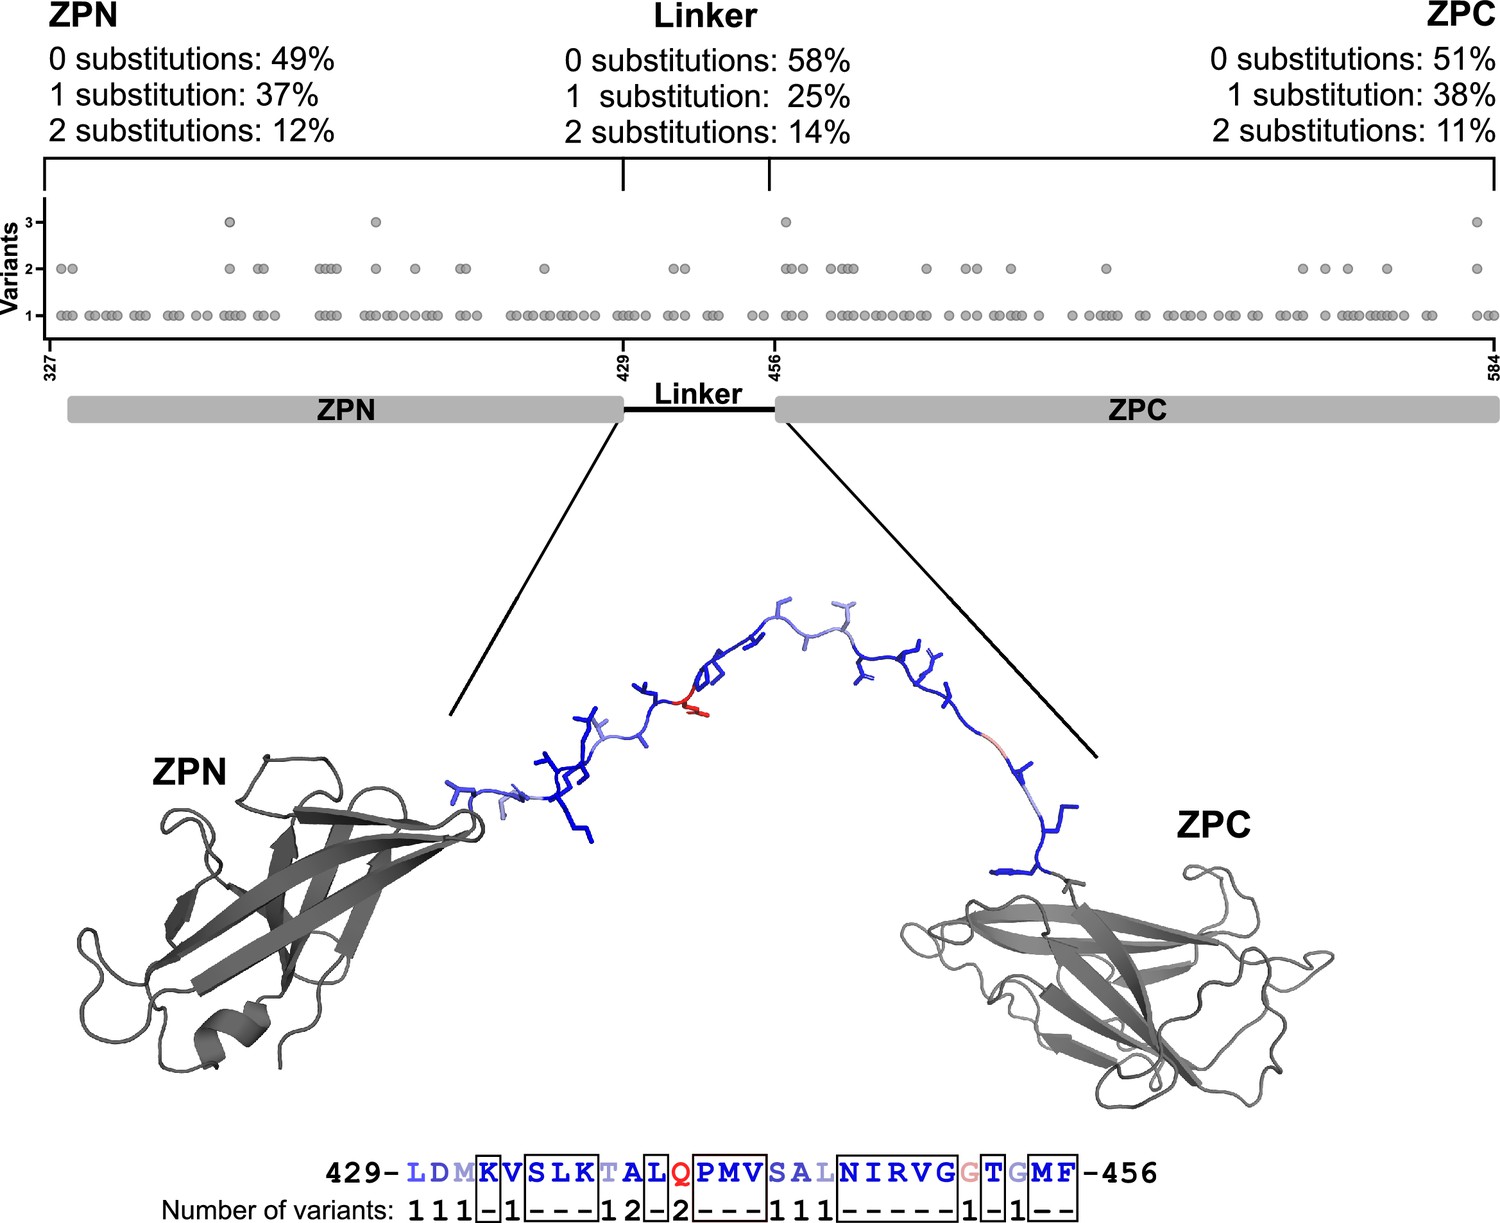
gnomAD zero variance residues of the mature UMOD fiber linker region.
Residues along the ZP linker are not highly variant in the gnomAD database of 125,748 exomes and 15,708 genomes from unique unrelated individuals with high-quality sequence data (Karczewski et al., 2020). The linker residues between ZPN and ZPC of a UMOD subunit are shown as sticks and colored according to their score on a normalized PAM250 matrix. The complete amino acid sequence of the linker (UMOD residues 429‒456) is indicated below the structure of the UMOD monomer. Residues that show no variance within the gnomAD cohort are depicted in dark blue and boxed. Increasing variance, weighted according to the PAM250 matrix for allowed amino acid substitutions, is colored along a normalized spectrum from dark blue to dark red. ZPN and ZPC subdomains are shown in gray. The variance for each section of the ZP module is indicated above.
Figure 3 with 2 supplements
Comparison of ZP module structure in the native filament to that in the crystal structure of rEGF-ZP-CTP.
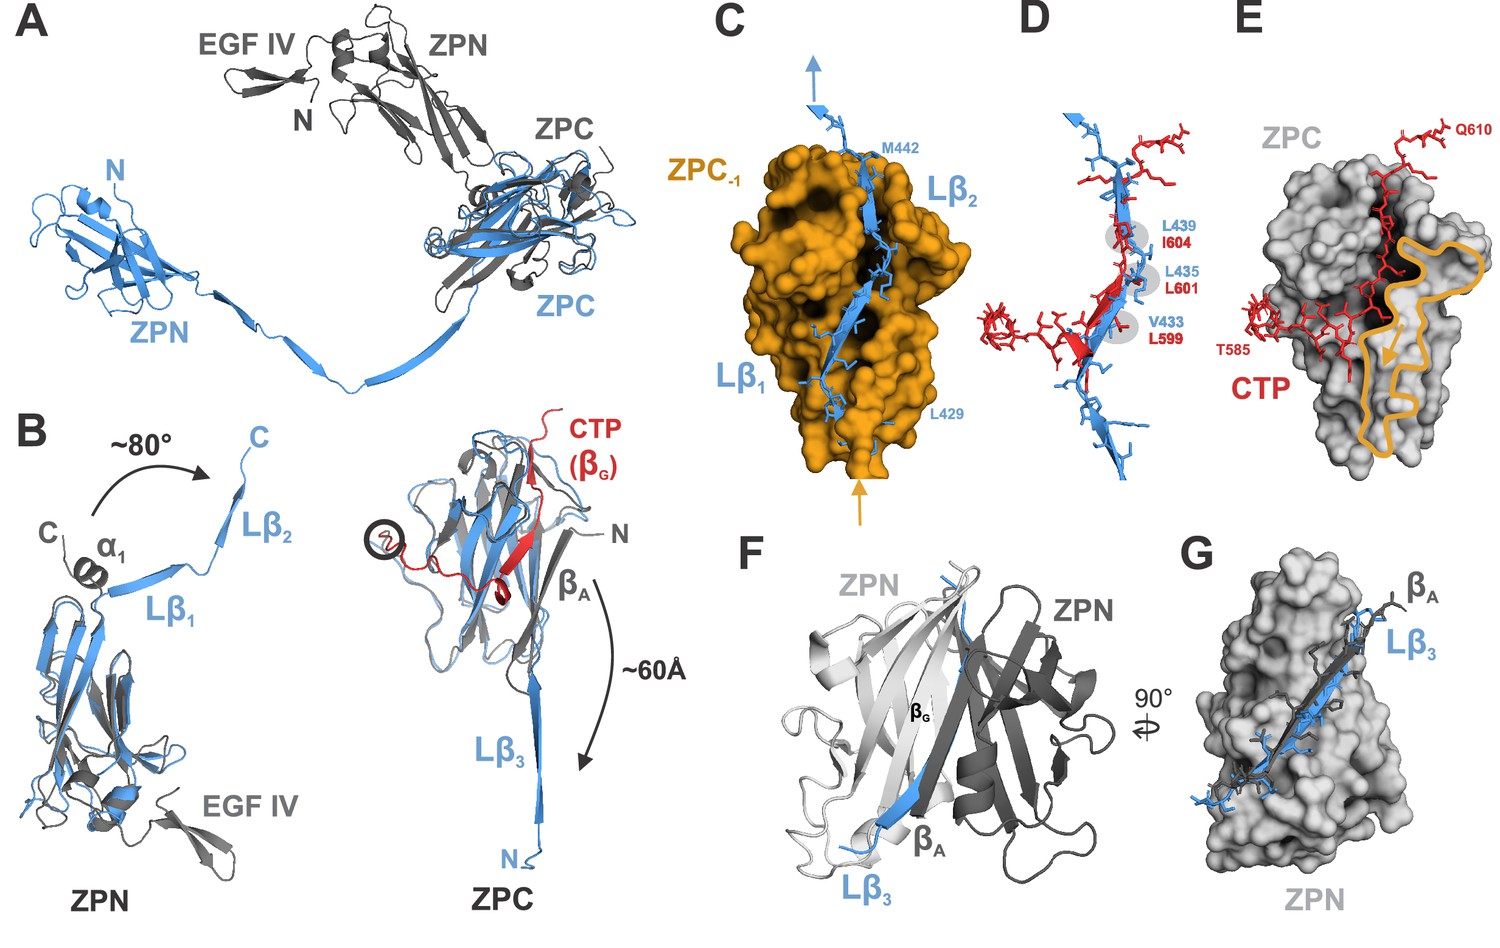
(A) Superposition of the structure of the ZP module in the rEGF-ZP-CTP homodimer (gray, PDB: 4WRN) with the solved cryo-EM structure of the mature ZP module in the filament (blue). Both structures were aligned via the ZPC subdomains. In the filament, the ZPN subdomain is shifted away from the ZPC subdomain of the same subunit by ~60 Å. (B) Rearrangement of secondary structure elements in ZPN and ZPC forming the extended linker upon UMOD polymerization compared to rEGF-ZP-CTP. The cryo-EM model of mature UMOD core is shown in blue, and the X-ray structure of rEGF-ZP-CTP (PDB: 4WRN) in gray. The CTP (absent in the mature filament) is highlighted in red. Left: The α-helical segment at the C-terminus of ZPN in pro-UMOD forms the linker strands Lβ1 and Lβ2 in the mature filament. Right: The N-terminal ZPC β-strand (βA) in pro-UMOD forms the strand Lβ3 in the extended linker of the mature filament. The CTP (red), providing the last ZPC β-strand (βG) in pro-UMOD. The hepsin cleavage site in pro-UMOD is circled. (C) Surface representation of the ZPC subdomain (gold) with the two complementing strands Lβ1 and Lβ2 from the following subunit. Labeled residues indicate the beginning and the end of Lβ1-2. (D) Superposition of the C-terminal pro-peptide forming pro-UMOD ZPC strand βG (red) with the linker strands Lβ1 and Lβ2 (blue) that occupy the same hydrophobic groove in the polymer ZPC. Similar or identical hydrophobic β-strand sidechains are bound to the hydrophobic sidechain pockets in ZPC (grey) in both structures. (E) Binding groove of pro-UMOD CTP (red, sticks) on the ZPC (gray surface). The N-terminal ZPC strand βA (yellow outline) limits the size of the binding pocket. The βA strand is flipped out upon conformational change from pro-UMOD mature UMOD (then Lβ3). (F) Structure of the crystallized ZPN homodimer of pro-UMOD (PDB: 4WRN). The N-terminal strand βA of each ZPN subdomain interacts with the C-terminal βG strand of the opposite ZPN. (G) In the UMOD polymer, ZPN βG interacts with linker strand Lβ3 (blue) instead, which occupies the same position as strand βA (black) from the apposing subunit in the dimer.
Figure 3—figure supplement 1
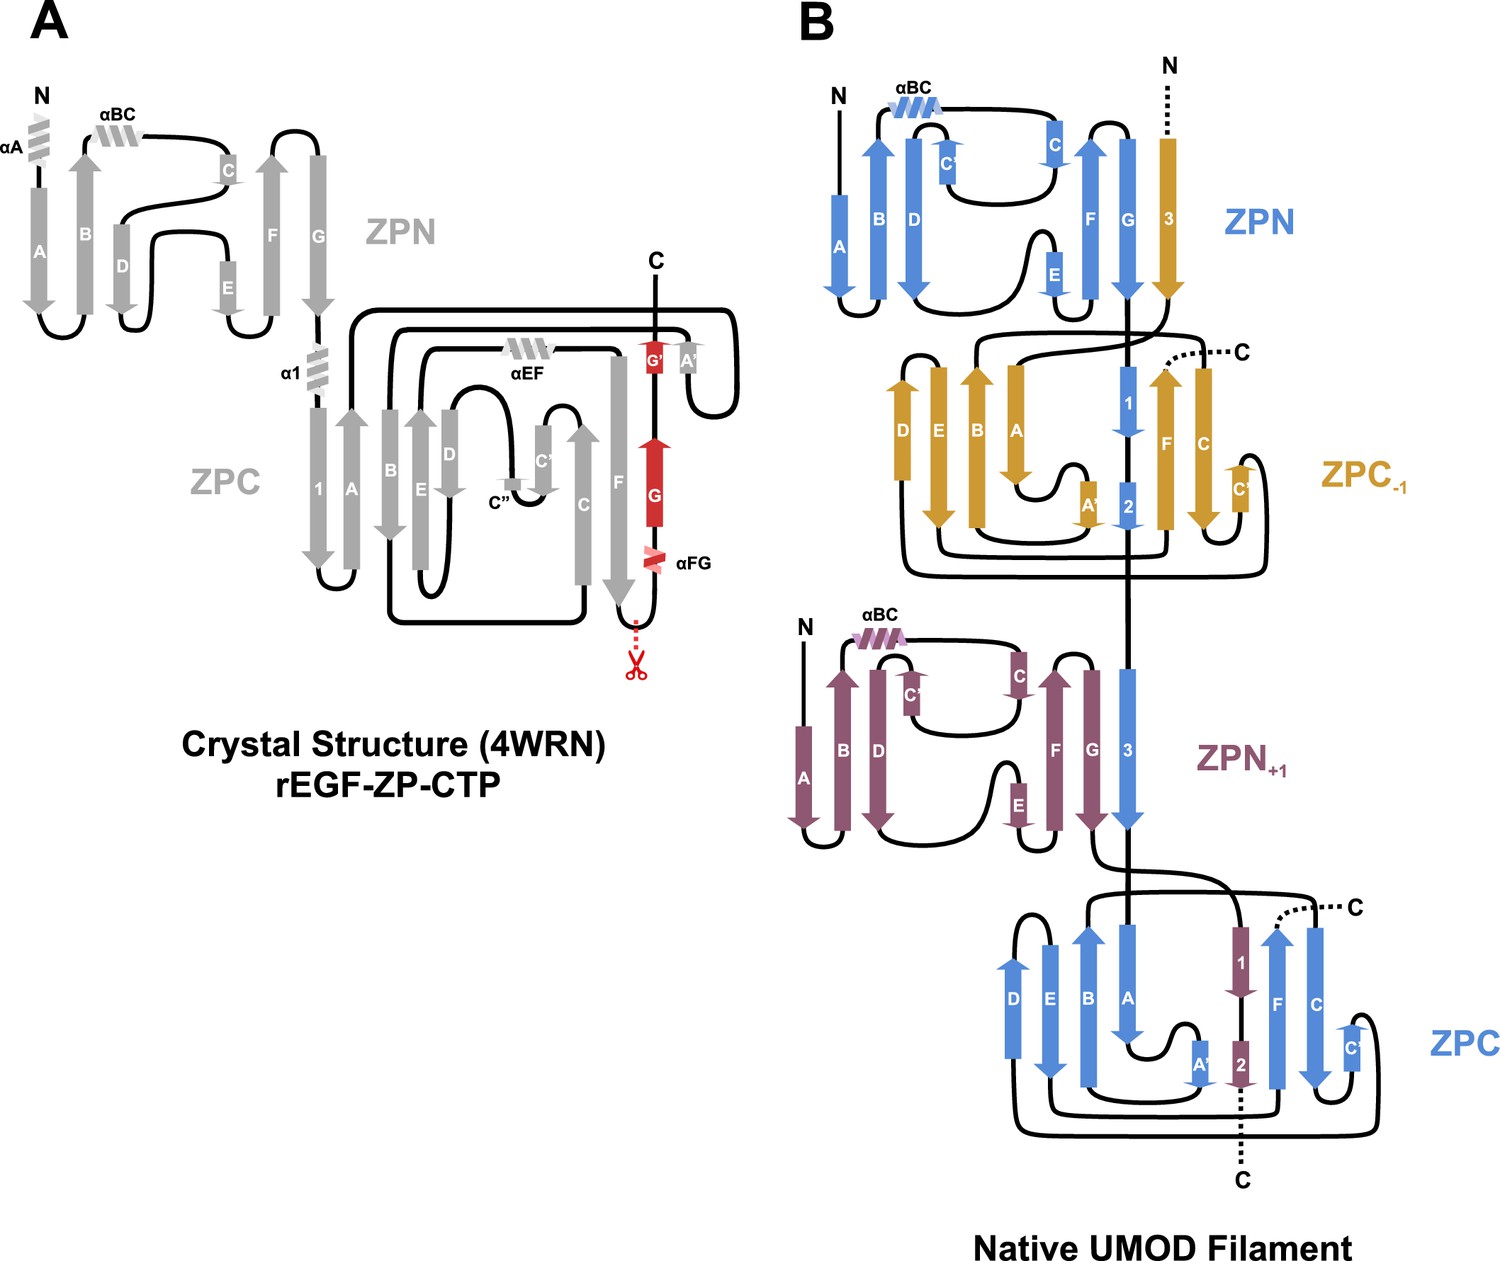
Regular secondary structure topology diagrams for the ZP modules.
(A) Crystallized rEGF-ZP-CTP fragment (PDB: 4WRN; Bokhove et al., 2016). (B) Cryo-EM structure of the native UMOD filament.
Figure 3—figure supplement 2
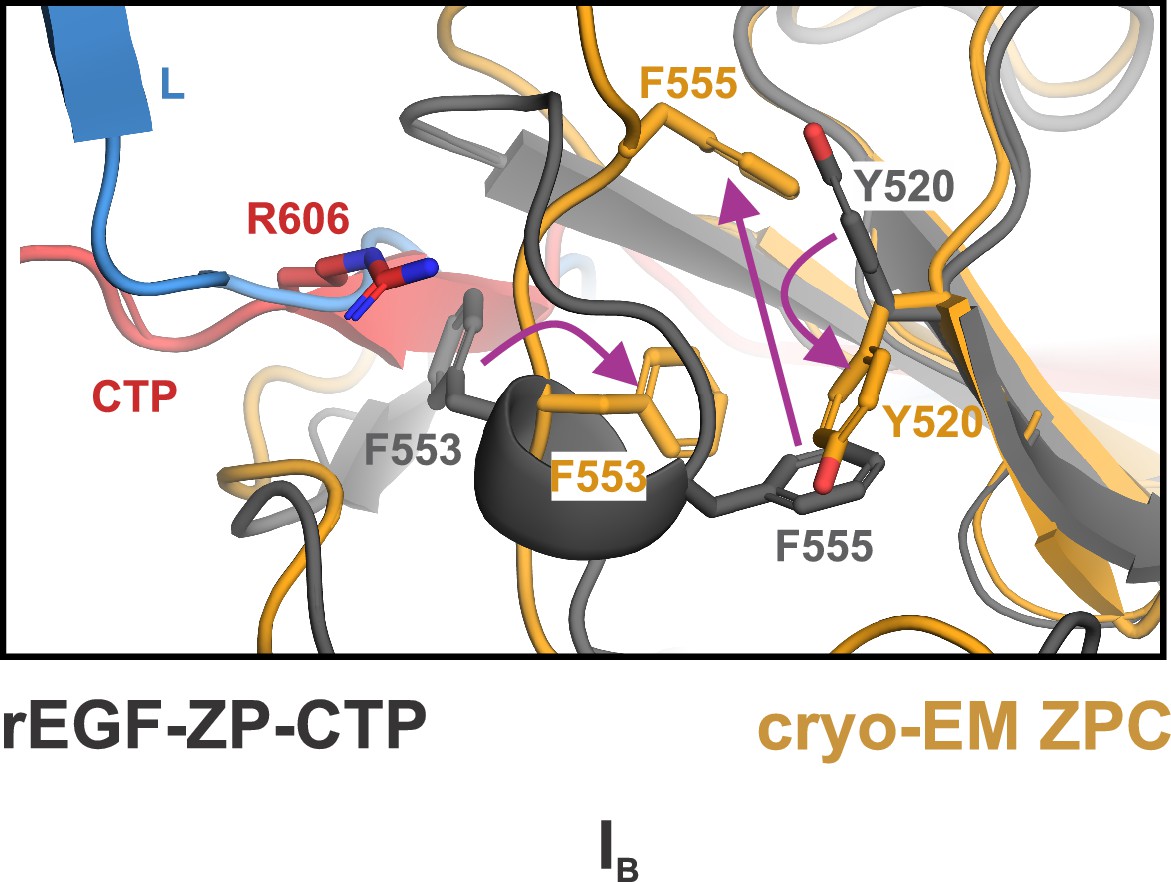
Rearrangement of aromatic residues at interface IB.
Rearrangement of the aromatic residues from ZPC-1 at IB in the mature filament that change their position relative to the rEGF-ZP-CTP structure. Compared to rEGF-ZP-CTP, the helix αEF elongates, resulting in significant reorganizing of F553 and F555, and flipping of the Y520 sidechain. In rEGF-ZP-CTP, R606 on the CTP occupies a groove on αEF, but this interaction is eliminated in the native UMOD filament. L, linker (blue).
Figure 4 with 2 supplements
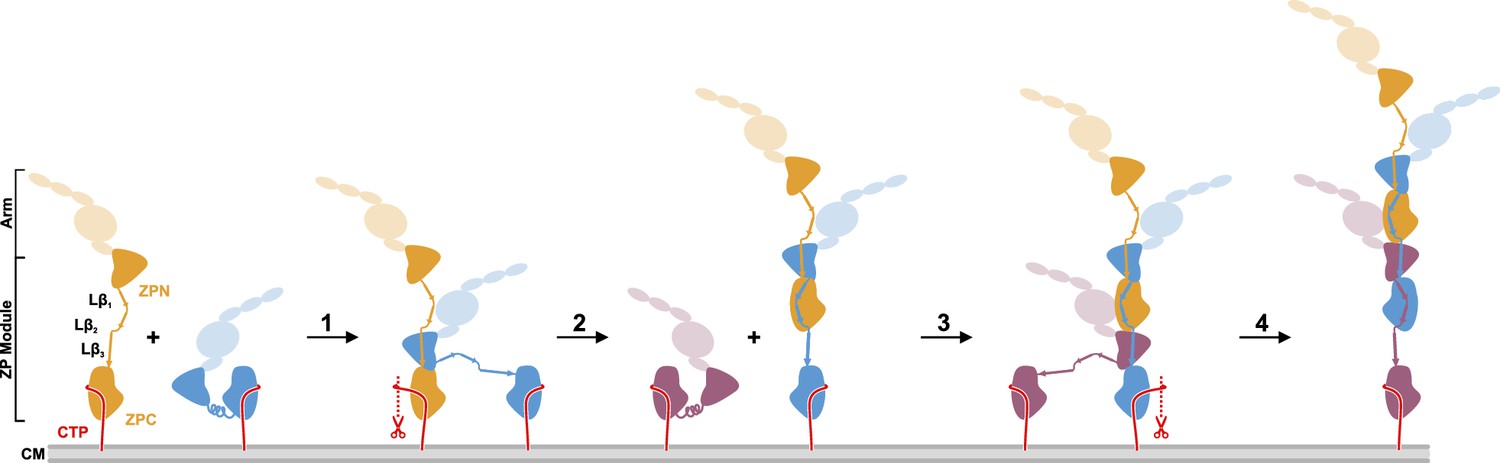
Proposed model of UMOD polymerization after hepsin cleavage of pro-UMOD.
UMOD arms with the domains EGF I-III, D8C, and EGF IV are shown transparent to indicate their positions relative to the ZP domains. (Step 1) Binding of ZPN from a pro-UMOD monomer (blue) to the Lβ3 segment of an extended neighbor pro-UMOD (gold) may start the assembly. (Step 2) In the resulting, asymmetric pro-UMOD dimer, hepsin (red scissors) cleaves the GPI anchored CTP (red) from the ZPC subdomain. The released ZPC subdomain then binds to Lβ1 and Lβ2 of the incoming pro-UMOD. (Step 3) ZPN from a third pro-UMOD (plum) binds to the Lβ3 segment between the two ZPC segments of the growing filament. (Step 4) Again, hepsin cleaves off the CTP from the pro-UMOD in which the ZPC is complexed with ZPN. Steps 3 and 4 are consistently repeated until filament assembly is completed.
Figure 4—figure supplement 1
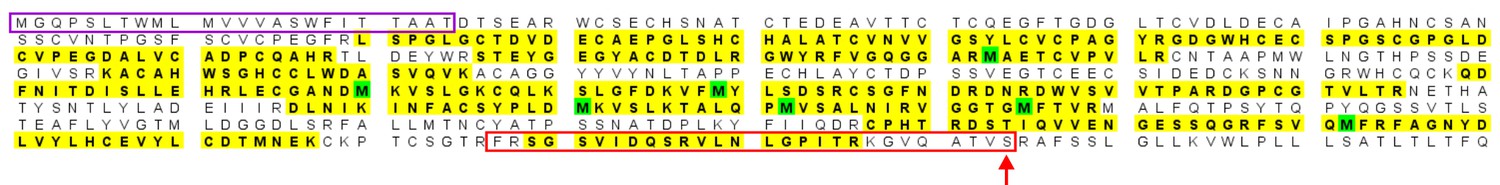
MALDI-MS/MS analysis of tryptic peptides of mature human UMOD filaments.
After purification and tryptic digest, reduced, alkylated UMOD peptides were analyzed by MALDI-MS/MS. The UMOD signal sequence is boxed in purple, the CTP in red, and the GPI anchor attachment site is indicated with a red arrow. UMOD sequence segments confirmed by tryptic peptides are shown with a yellow background. The two detected C-terminal peptides 591-SGSVIDQSR-597 and 598-VLNLGPITR-606 belong to the CTP. This could hint at a hydrolase other than hepsin that releases the growing UMOD filament from the membrane by removal of the GPI anchor from the CTP in the lastly incorporated subunit. Identified peptides are highlighted in yellow, oxidized methionine residues are highlighted in green.
Figure 4—figure supplement 2
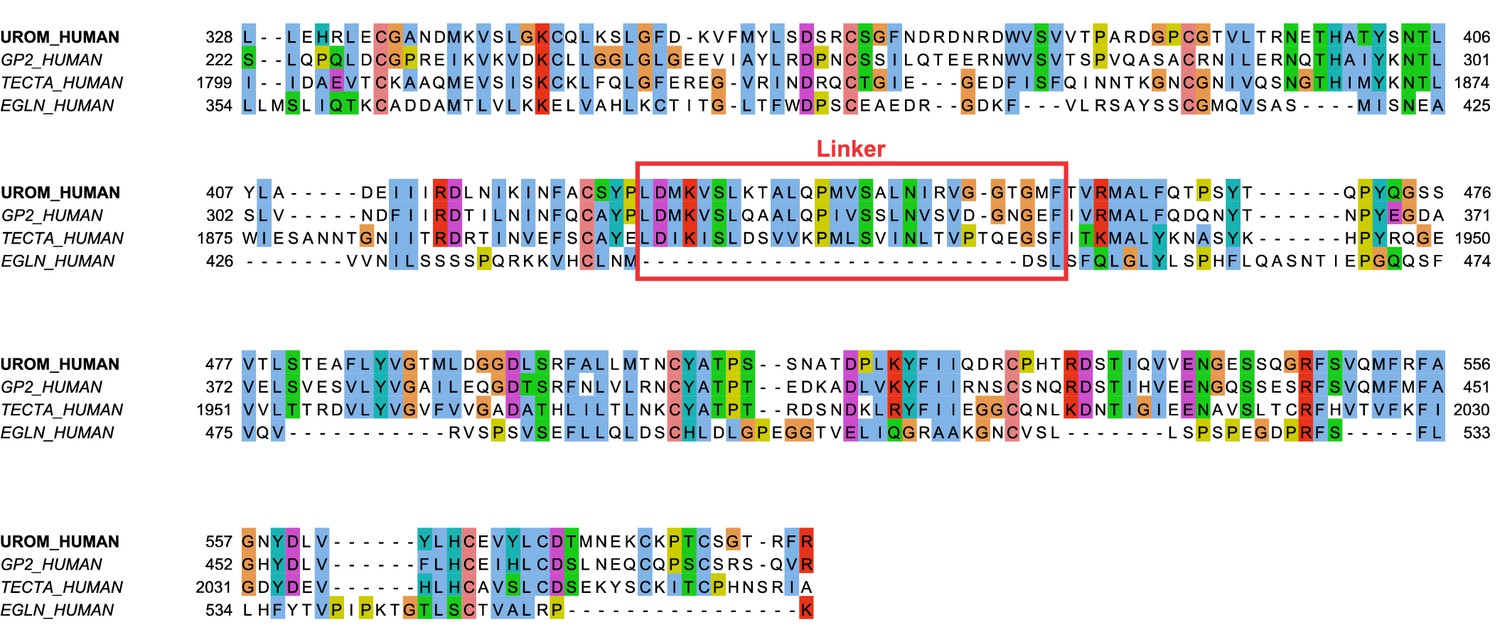
Amino acid sequence alignment of ZP-containing, GPI anchored human proteins.
A subset of human ZP-containing proteins can be predicted to form filaments based on their sequence similarity to UMOD. Glycoprotein 2 (GP2) has a high overall sequence similarity to UMOD and is a transcytotic receptor on specialized M cells in the gut for type one piliated bacteria (Hase et al., 2009). GP2 has been shown to convert from a longer, membrane-bound glycoprotein to a soluble glycoprotein with lower apparent molecular mass (Havinga et al., 1985), and from its similarity with UMOD we predict it also forms homopolymers of a similar type. In the extracellular matrix (ECM) that covers the cochlear epithelium, alpha-tectorin (TECTA) builds up via its ZP domains and must be tethered to the cell surface for the ECM to form correctly (Kim et al., 2019). In contrast, the membrane glycoprotein endoglin (EGLN) also contains a ZP module but is known to not form fibers. This is consistent with the complete lack of a linker region in EGLN (Saito et al., 2017).
Author response image 1
Author response image 2
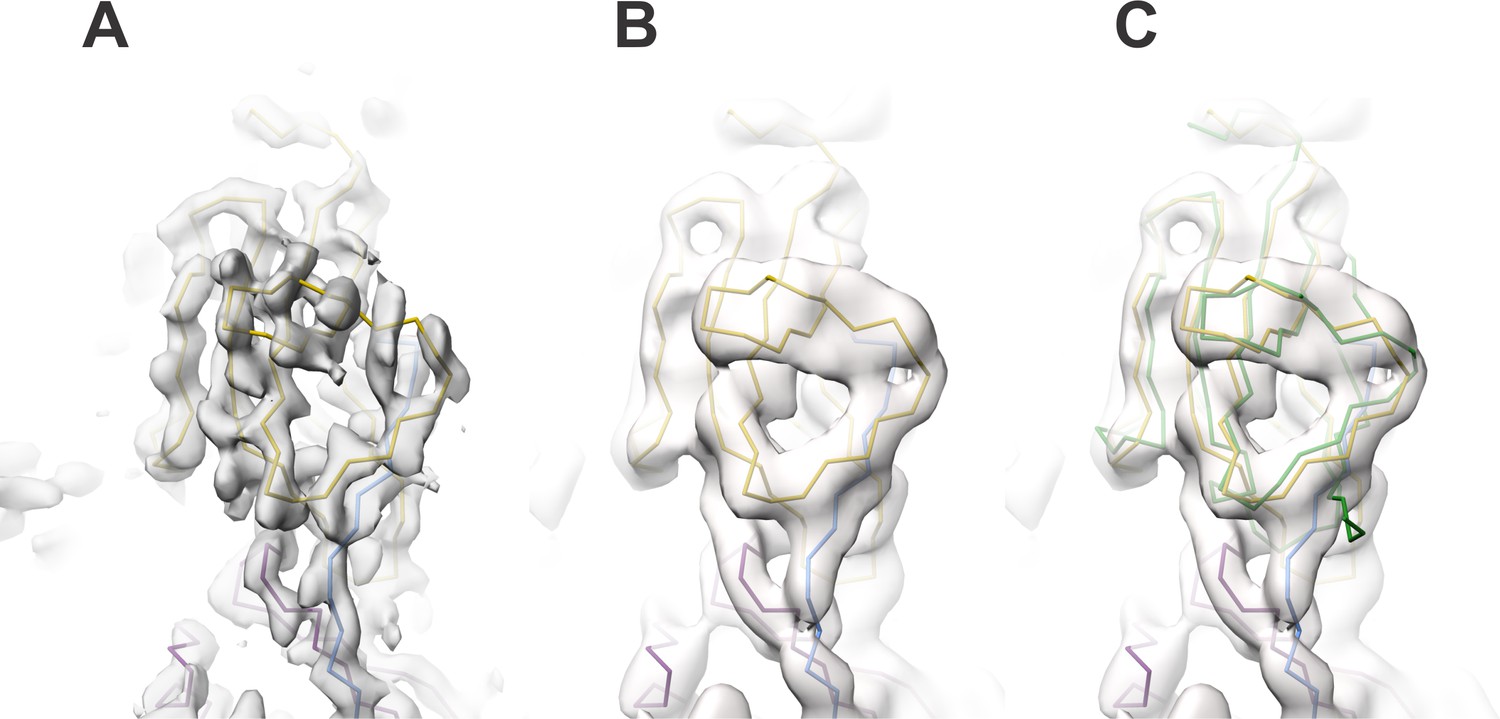
Comparison of the map region affected by radial blurring in the cryoSPARC map with the analogous region in the lower-resolution cisTEM map.
(A) In image 2 of the attached reviewers’ comments, the map in the loop region 462‒473 is affected by radial blurring in the cryoSPARC map. The main chain trace corresponds well to the lower resolution cisTEM map (B), which does not suffer from the same artifacts. (C) Additionally, the main chain trace also agrees with the conformation of 462‒743 loop in the ZPC crystal structure (PDB ID: 4WRN; Bokhove et al., 2016, superposition shown in green placed into cisTEM map, as in B). We now omitted the sidechain residues for the loop region 462‒473 from the final model.
Author response image 3
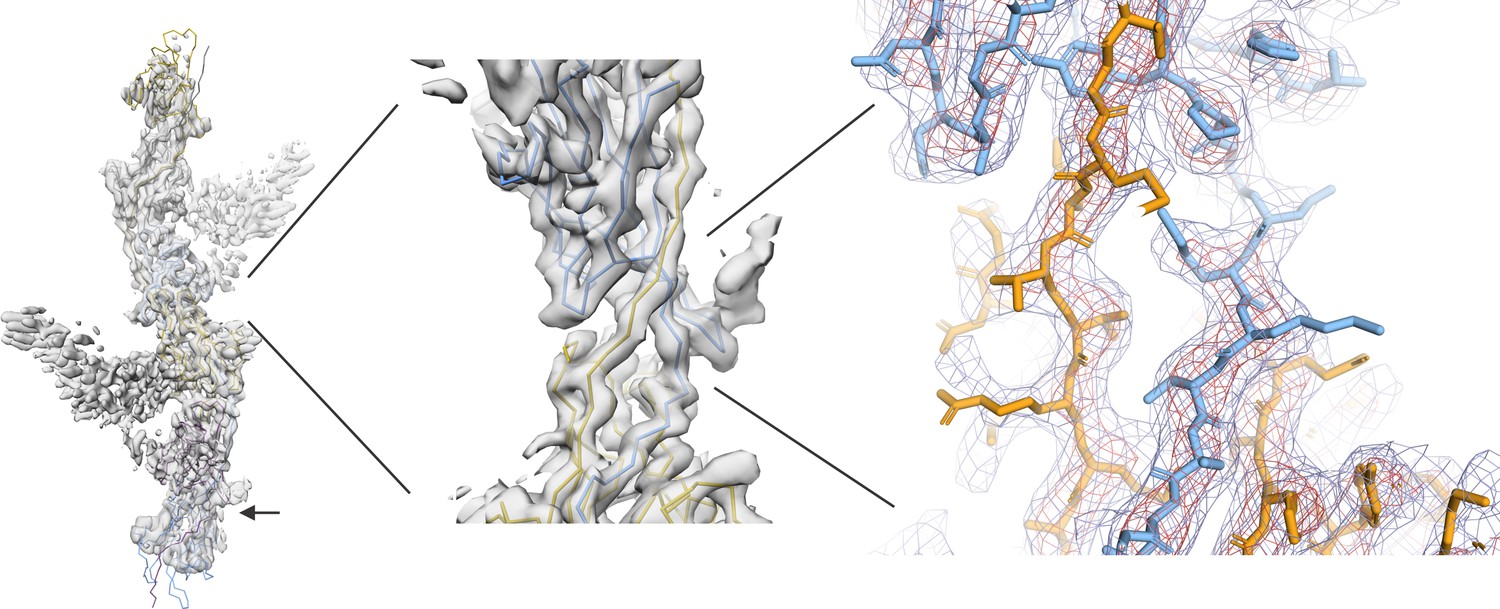
Similar to image 1, image 4 shows the subunit interface at the edge of the reconstructed volume where the map is of poor resolution (indicated with an arrow) compared to the center of the box which we used for building and refinement; however, our AU model was built in the symmetry related part at the center of the 3.5 Å cryoSPARC map (middle panel, highlighted region).
We also provide the mesh representation of the cryoSPARC map of the central region shown at two contour levels (red (18 σ), blue (10 σ)) that illustrates a good agreement between the model and the map (right panel).
Additional files
-
Supplementary file 1
Stanisich_et_al_2020_supplementary_file_1.pdf.
(A) ZP module linker and interface amino acid positions with known variants (gnomAD). (B) Cryo-EM data collection and model refinement statistics. (C) Flowchart for cryoSPARC cryo-EM processing. (D) Flowchart for cisTEM cryo-EM processing.
- https://cdn.elifesciences.org/articles/60265/elife-60265-supp1-v2.pdf
-
Transparent reporting form
- https://cdn.elifesciences.org/articles/60265/elife-60265-transrepform-v2.pdf
Download links
A two-part list of links to download the article, or parts of the article, in various formats.
Downloads (link to download the article as PDF)
Open citations (links to open the citations from this article in various online reference manager services)
Cite this article (links to download the citations from this article in formats compatible with various reference manager tools)
The cryo-EM structure of the human uromodulin filament core reveals a unique assembly mechanism
eLife 9:e60265.
https://doi.org/10.7554/eLife.60265


