Phosphatidylcholines from Pieris brassicae eggs activate an immune response in Arabidopsis
- Department of Plant Molecular Biology, University of Lausanne, Switzerland
- School of Pharmaceutical Sciences, University of Geneva, Switzerland
- Institute of Pharmaceutical Sciences of Western Switzerland, Switzerland
- NCCR Chemical Biology, University of Geneva, Switzerland
Figures
Figure 1 with 2 supplements
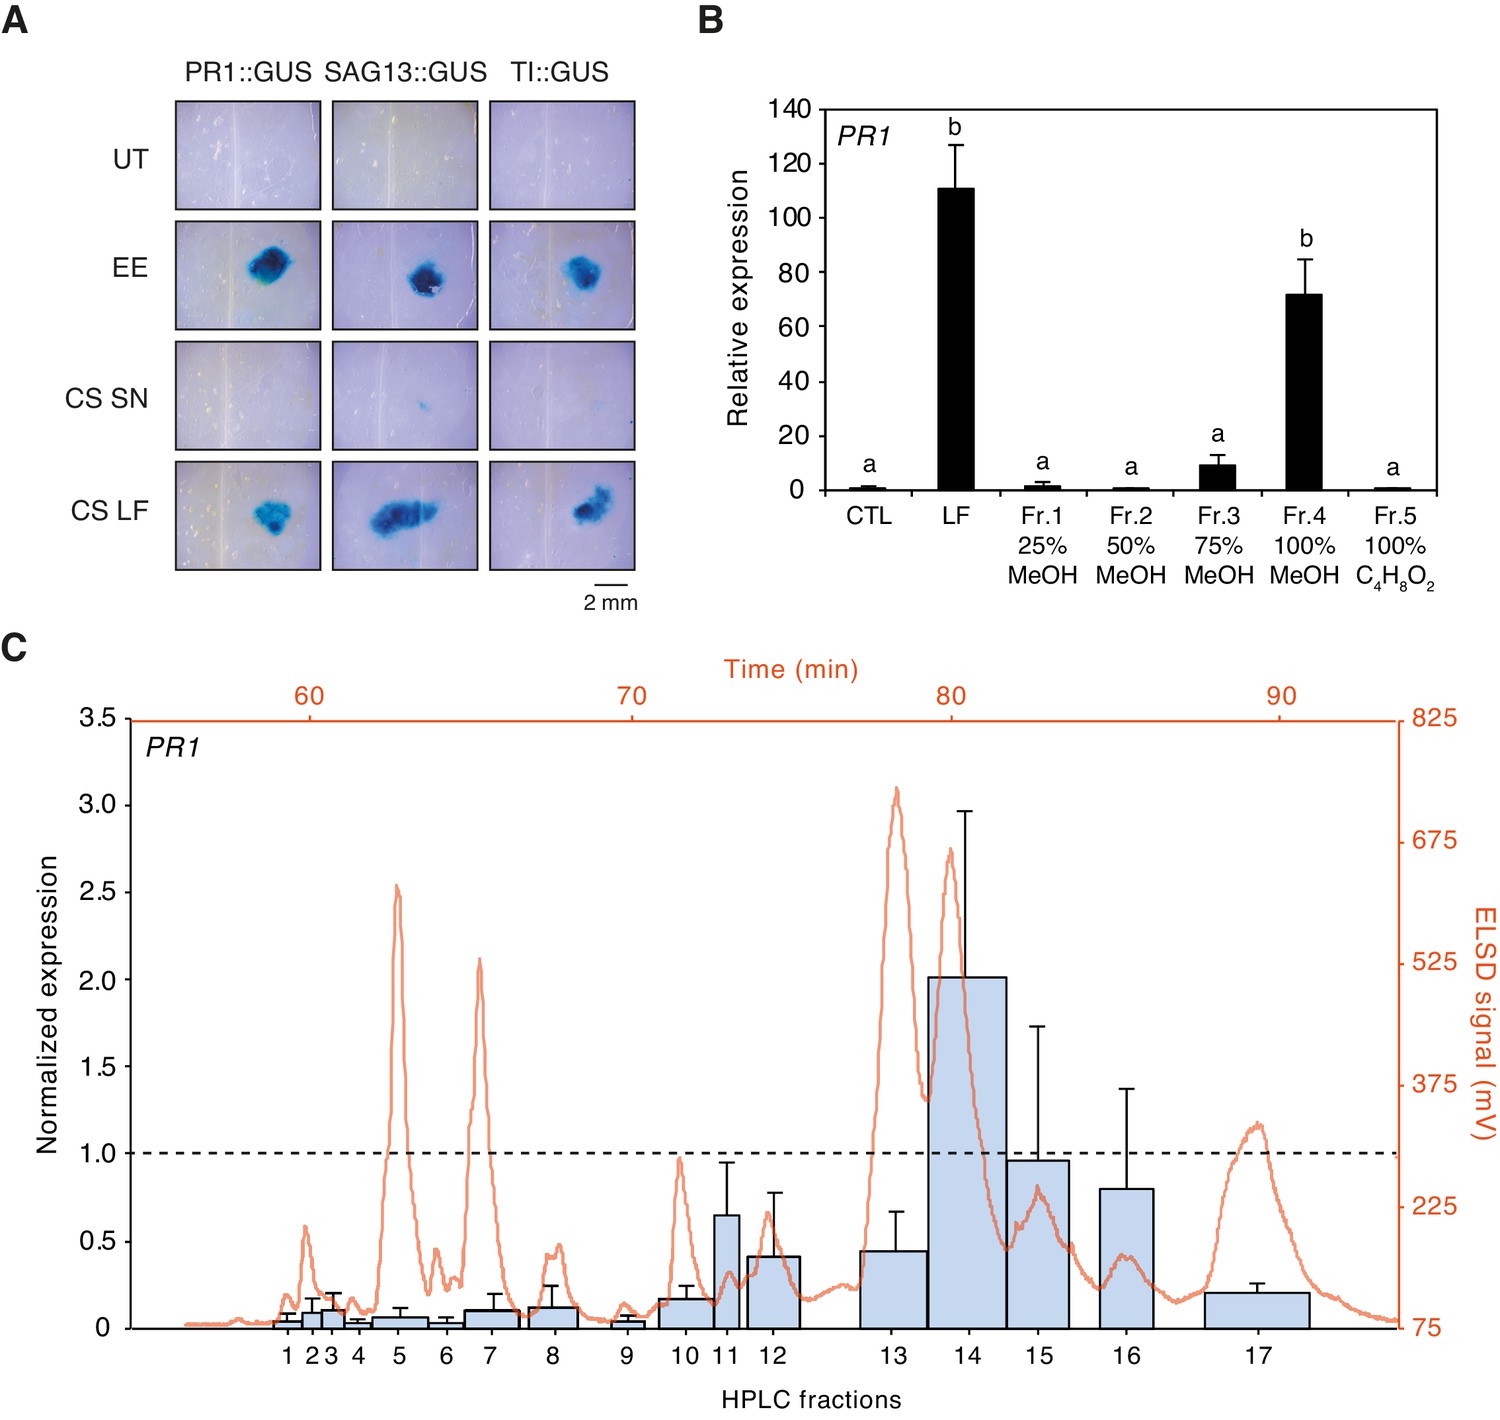
Purification of plant-defense eliciting P. brassicae egg lipids.
(A) Expression of defense genes PR1, SAG13, and TI in response to purified P. brassicae egg lipids. Purification of egg lipids was conducted using Cleanascite. GUS reporter lines were treated with the lipid-free supernatant (CS SN) or the lipid fraction (CS LF). Untreated and egg extract (EE)-treated plants served as controls. The experiment was repeated three times with similar results and representative pictures from one experiment are shown. (B) Relative PR1 expression upon treatment with purified P. brassicae egg lipids (LF) and with fractions from LF separated by solid-phase extraction (SPE). LF and SPE fractions were applied at 5 µg/µL solved in 1% DMSO and plants treated with 1% DMSO served as controls. Transcript levels represent means ± SE of three independent experiments. Different letters indicate significant differences between treatments (ANOVA followed by Tukey’s honest significant difference test, p<0.05). (C) PR1 expression upon treatment with fractions obtained from semi-preparative HPLC-fractionation of SPE Fr. four detected in ELSD (mV). Subfractions Fr. 4.1 to Fr. 4.17 were applied at 5 µg/µL solubilized in 1% DMSO. PR1 expression was normalized to the expression value obtained upon treatment with SPE Fr. four (indicated by the dashed line). Transcript levels represent means ± SE of two to five independent experiments. HPLC chromatogram used for fraction collection is indicated in orange.
-
Figure 1—source data 1
Source data for Figure 1B and C.
- https://cdn.elifesciences.org/articles/60293/elife-60293-fig1-data1-v1.xlsx
Figure 1—figure supplement 1
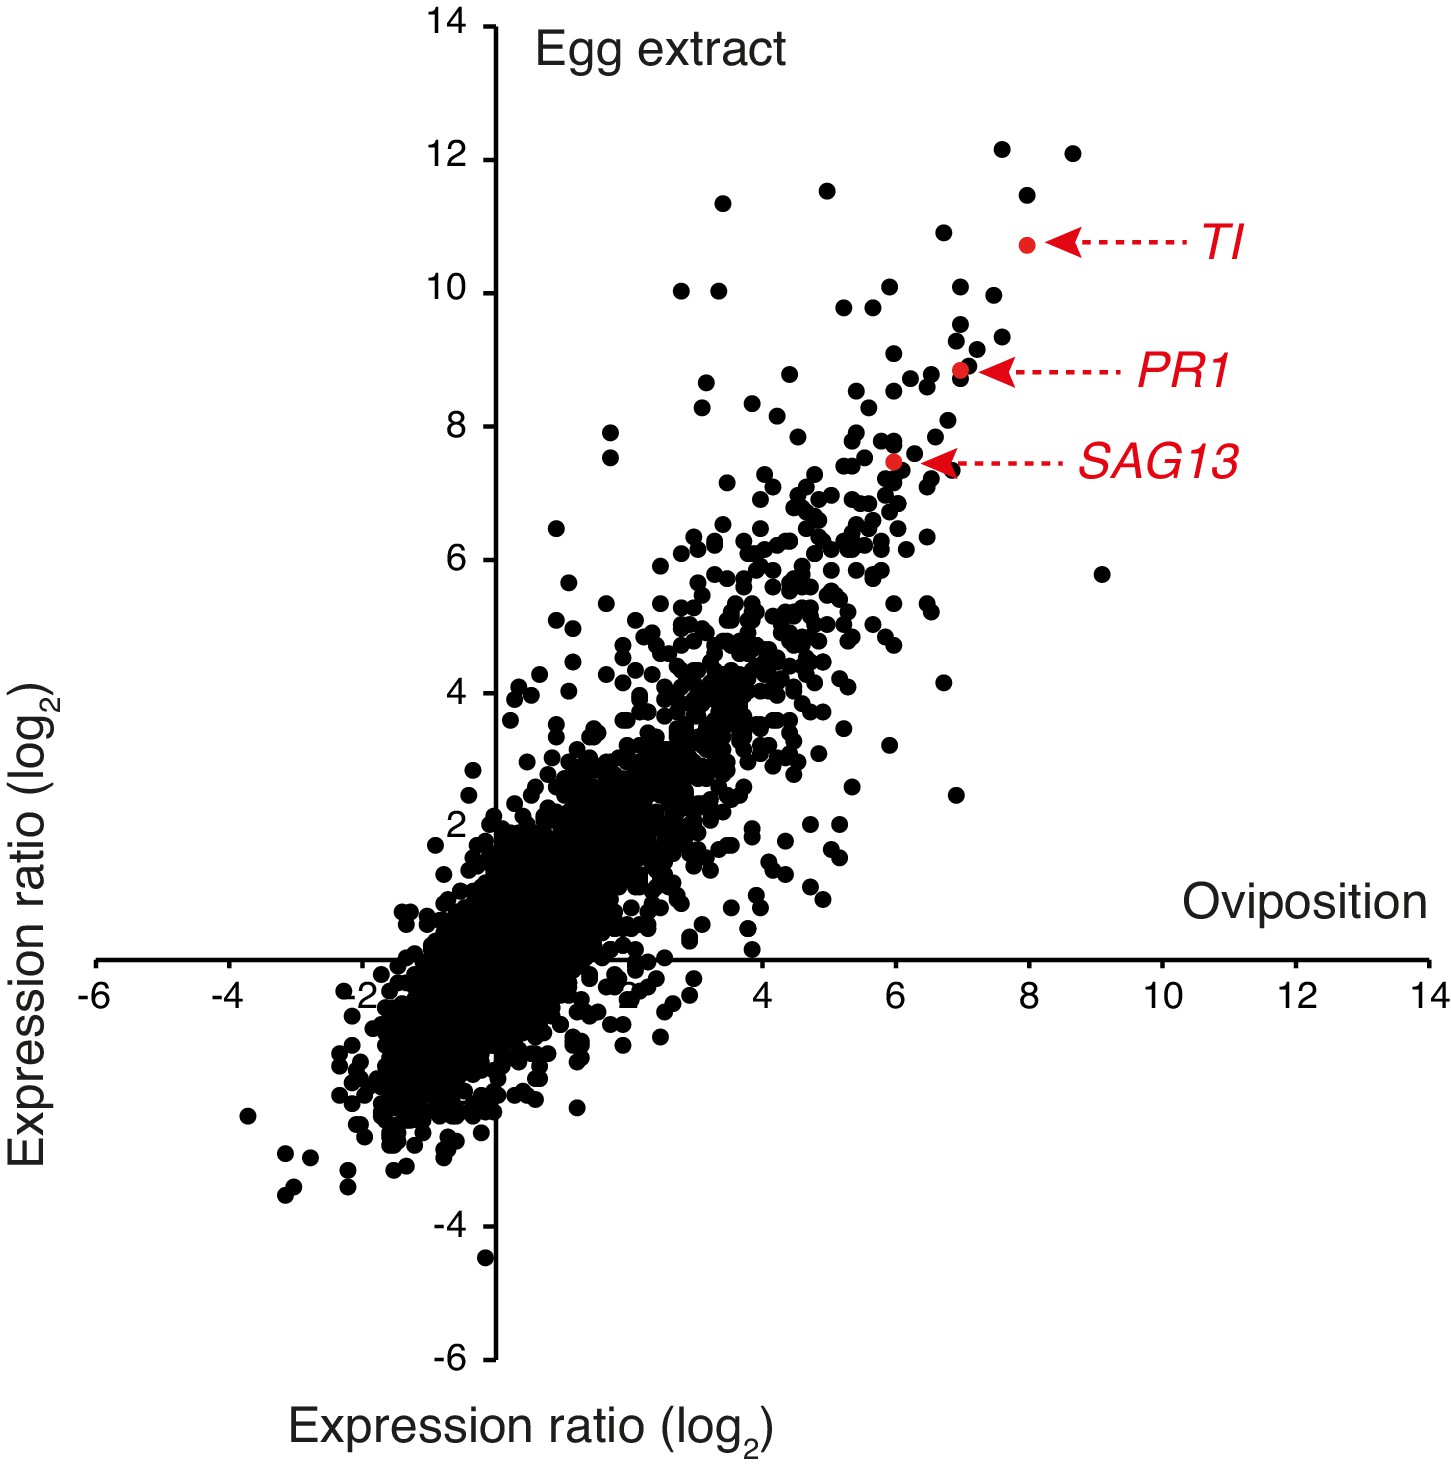
RNAseq analysis of Arabidopsis leaves after oviposition or egg extract (EE) treatment.
Plants were naturally oviposited by P. brassicae butterflies and leaves containing one egg batch (ca. 20–30 eggs) were harvested after 5 days. For EE treatment, leaves were treated with 2 × 2 μL of EE (corresponding to ca. 30 eggs) and harvested after 5 days. Expression ratios calculated from experiments comparing oviposited and control plants (three biologically independent replicates) are plotted against expression ratios between EE-treated and control plants (three biologically independent replicates). Marker genes used in this study are indicated in red. PR1, PATHOGENESIS-RELAZED PROTEIN 1 (At2g14610); SAG13, SENESCENCE-ASSOCIATED GENE 13 (At2g29350); TI, KUNITZ TRYPSIN INHIBITOR 1 (At1g73260).
-
Figure 1—figure supplement 1—source data 1
Source data for Figure 1—figure supplement 1.
- https://cdn.elifesciences.org/articles/60293/elife-60293-fig1-figsupp1-data1-v1.xlsx
Figure 1—figure supplement 2
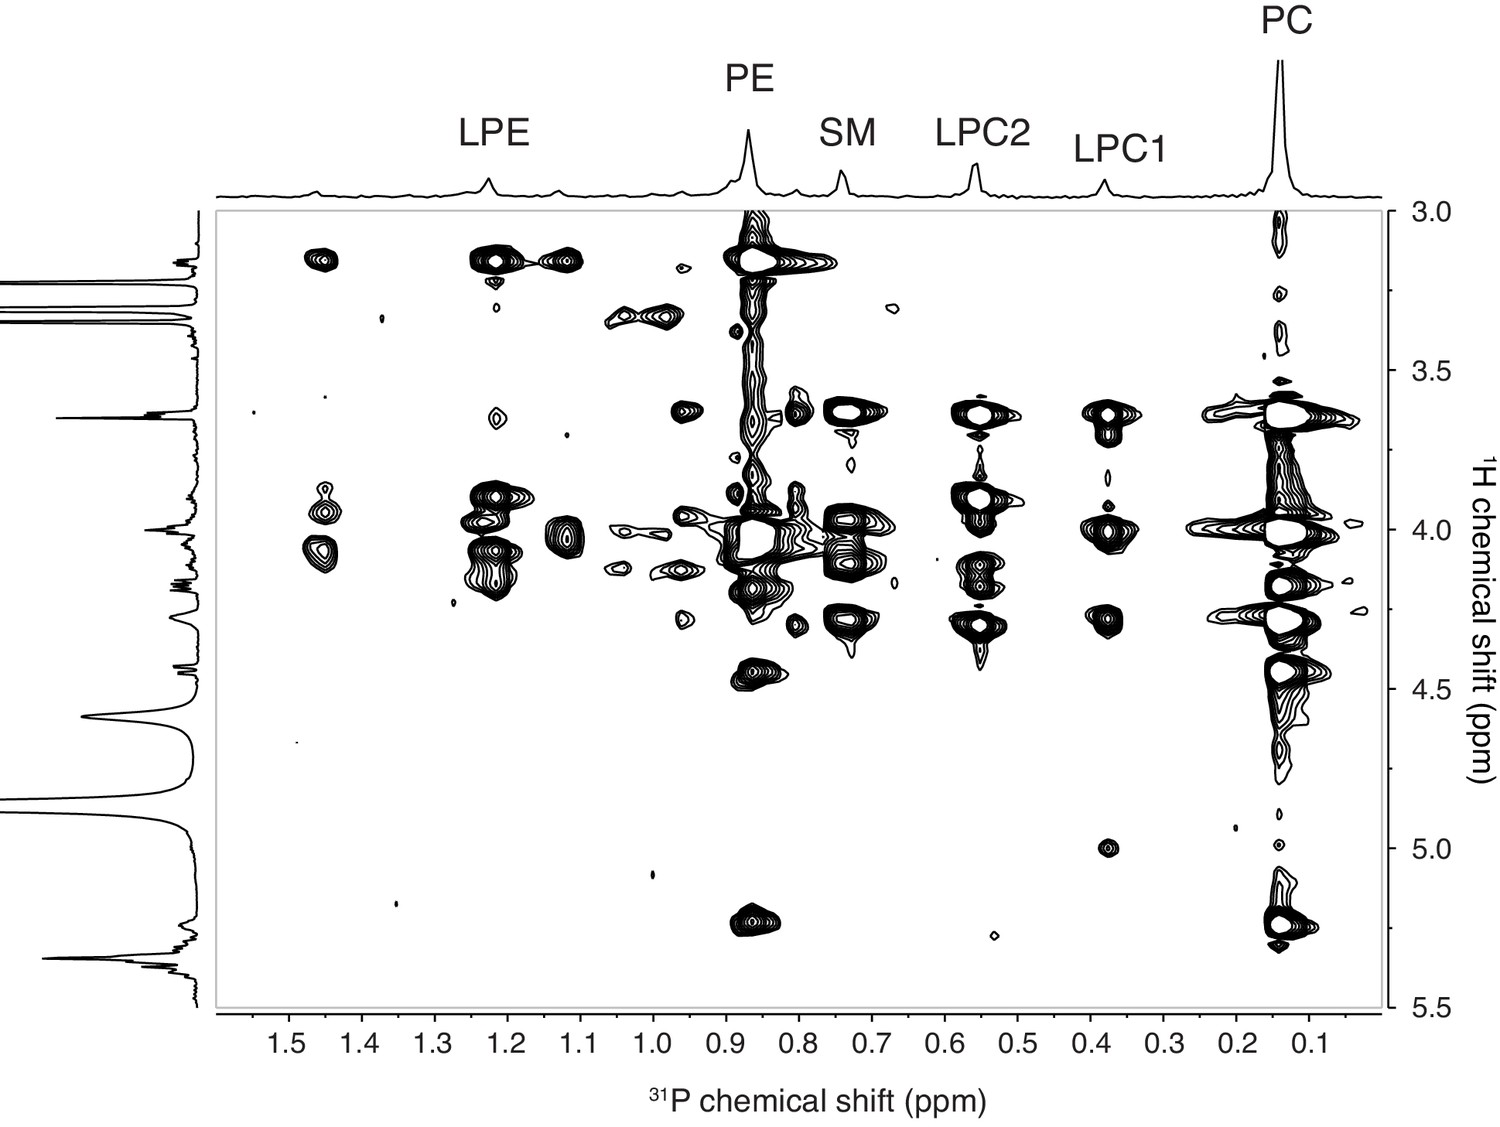
Two-dimensional 1H−31P TOCSY NMR experiment of SPE Fr. four in CD3OD.
Assignment of the main classes of phospholipids is reported as follow: PC for phosphatidylcholine, LPC1 and LPC2 for lysophosphatidylcholine, SM for sphingomyelin, PE for phosphatidylethanolamine, and LPE for lysophosphatidylethanolamine.
Figure 2 with 3 supplements

Identification of phospholipids as plant-defense eliciting compounds in P. brassicae eggs.
(A) Phospholipid composition of HPLC fractions was obtained by 1D 31P NMR. (B) Lipid composition of P. brassicae EE measured by MS shotgun lipidomic analysis. Values are given as percentage of the total lipid mass and display means of three different EE preparations. (C) Absolute levels of phosphatidylcholines (PCs) in P. brassicae EE measured by MS shotgun lipidomic analysis. Different PC species are reported according to their molecular composition with the total number of carbon atoms and the sum of double bonds in fatty acyl chains. PC levels represent the means ± SE of three different EE preparations. (D) Absolute quantification of total PC content in P. brassicae EE measured by 1D 31P NMR and MS shotgun lipidomic analysis. Total PC levels represent means ± SE of three different EE preparations. (E) Relative PR1 expression upon treatment with EE and EE digested with phospholipase D (PLD) and phospholipase A2 (PLA2). Untreated plants served as controls (CTL). Transcript levels represent means ± SE of three independent experiments. Different letters indicate significant differences between treatments (ANOVA followed by Tukey’s honest significant test, p<0.05). (F) 1D 31P NMR spectra of EE + TIPB (bottom) and EE + PLD + PLA2 + TIBP (top). TIBP is used as an internal standard. (G) Relative PR1 expression upon treatment with EE, a synthetic egg lipid mix (SELM), a synthetic egg lipid mix without PCs (SELM-PC), and a PC-Mix. The SELM was composed of 5 µg/µL PC-Mix, 2.5 µg/µL PE-Mix, 1.75 µg/µL TAG(18:1/18:1/18:1), 1 µg/µLDAG(16:0/18:1), 1 µg/µL LPC-Mix, 0.2 µg/µL LPE-Mix and 0.1 µg/µL PA-Mix. The compounds were solubilized in 1% DMSO, 0.5% Glycerol and 0.1% Tween. Plants treated with 1% DMSO, 0.5% Glycerol and 0.1% Tween (CTL) and untreated plants (UT) served as controls. Transcript levels represent means ± SE of three independent experiments. Asterisks denote statistically significant differences between control and treated plants (Welch's t-test, *p<0.05). CE, cholesterol ester; DAG, diacylglycerol; LPC1 and LPC2, lysophosphatidylcholine; LPE, lysophosphatidylethanolamine; PA, phosphatidic acid; PC, phosphatidylcholine; PE, phosphatidylethanolamine; PG, phosphatidylglycerol; PI, phosphatidylinositol; PS, phosphatidylserine; SM, sphingomyelin; TAG, triacylglycerol.
-
Figure 2—source data 1
Source data for Figure 2A–G.
- https://cdn.elifesciences.org/articles/60293/elife-60293-fig2-data1-v1.xlsx
Figure 2—figure supplement 1
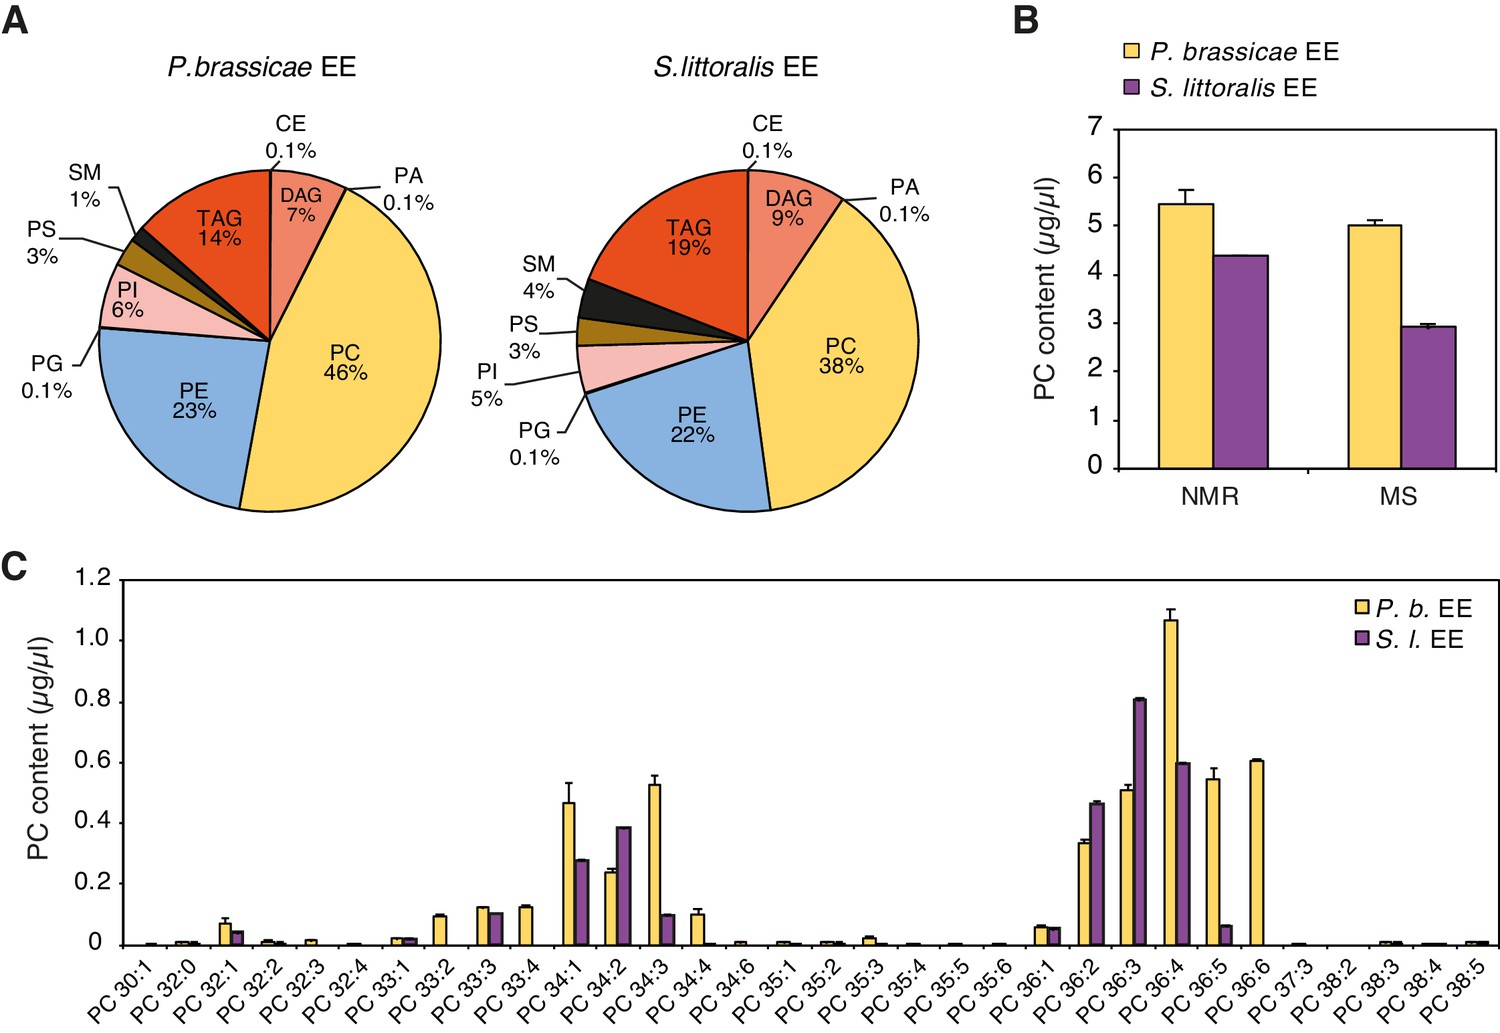
Comparative lipid composition of P. brassicae and S. littoralis EE.
(A) Lipid composition of P. brassicae and S. littoralis EE measured by MS shotgun lipidomic analysis. Values are given as percentage of the total lipid mass and display means of three different EE preparations. CE, cholesterol ester; DAG, diacylglycerol; PA, phosphatidic acid; PC, phosphatidylcholine; PE, phosphatidylethanolamine; PG, phosphatidylglycerol; PI, phosphatidylinositol; PS, phosphatidylserine; SM, sphingomyelin; TAG, triacylglycerol. (B) Absolute quantification of total PC content in P. brassicae and S. littoralis EE by 1D 31P NMR and MS shotgun lipidomic analysis. Values represent the means ± SE of three different EE preparations, except for S. littoralis where quantification by the NMR-based method which was conducted once. (C) Absolute levels of phosphatidylcholines (PCs) in P. brassicae and S. littoralis EE measured by MS shotgun lipidomic analysis. Different PC species are reported according to their molecular composition with the total number of carbon atoms and the sum of double bonds in the fatty acyl chains. PC levels represent the means ± SE of three different EE preparations.
-
Figure 2—figure supplement 1—source data 1
Source data for Figure 2—figure supplement 1A–C.
- https://cdn.elifesciences.org/articles/60293/elife-60293-fig2-figsupp1-data1-v1.xlsx
Figure 2—figure supplement 2
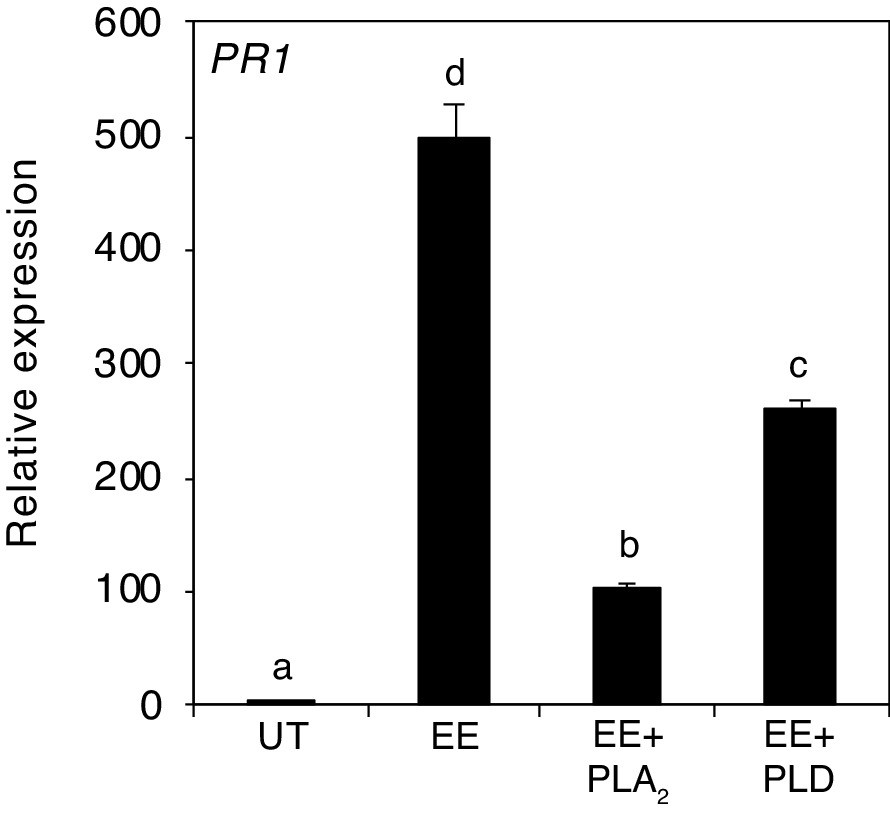
Relative PR1 expression upon treatment with EE and EE-treated with phospholipase A2 (PLA2) or phospholipase D (PLD).
Transcript levels represent means ± SE of one representative experiment with technical triplicates. The experiment was repeated three times with similar results. Different letters indicate significant differences between treatments (ANOVA followed by Tukey’s honest significant test, p<0.05).
-
Figure 2—figure supplement 2—source data 1
Source data for Figure 2—figure supplement 2.
- https://cdn.elifesciences.org/articles/60293/elife-60293-fig2-figsupp2-data1-v1.xlsx
Figure 2—figure supplement 3
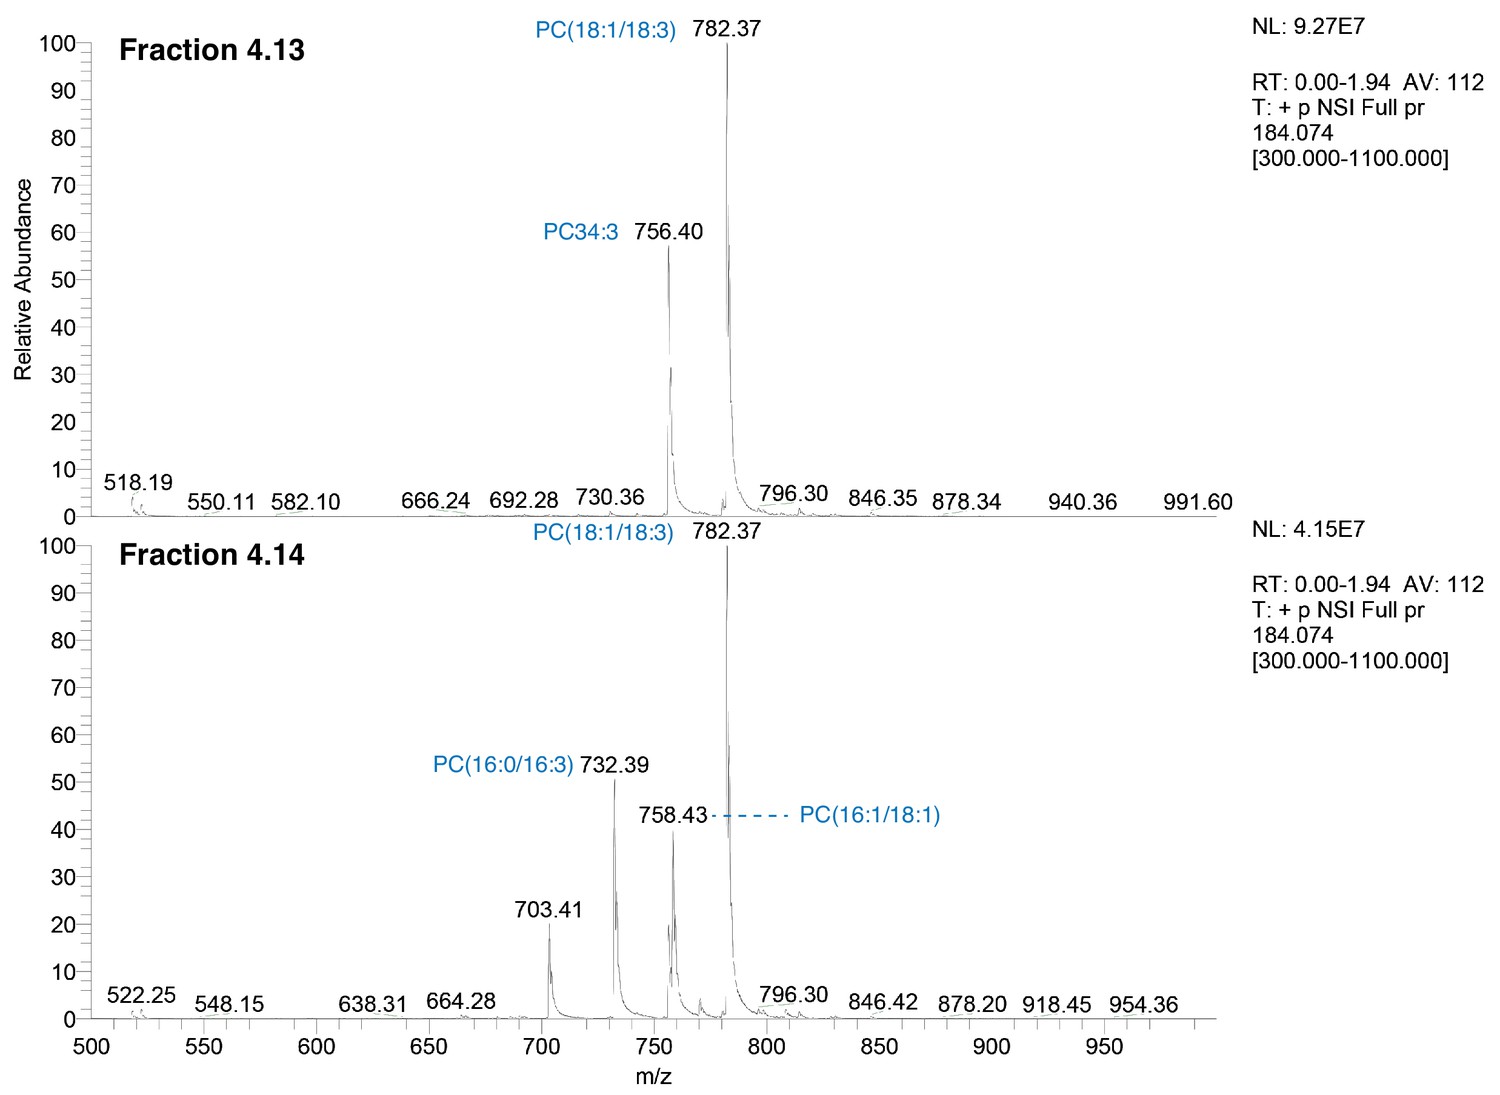
Precursor ion scans for choline-containing lipids in active fractions.
HPLC subfractions Fr. 4.13 and Fr. 4.14 were analyzed by mass spectrometry using a precursor ion scan to identify parent ions generating a phosphocholine (detected as a m/z 184.074). The parent ions for the precursor ion scan for Fr. 4.13 (upper panel) and Fr. 4.14 (lower panel) are shown.
Figure 3 with 1 supplement

Extracellular phosphatidylcholines activate defense gene expression.
(A) Expression of PR1, SAG13, and TI upon treatment with different PCs and purified phospholipid preparations. Phospholipids were applied to GUS reporter lines at 1 µg/µL, solubilized in 1% DMSO, 0.5% Glycerol and 0.1% Tween. Plants treated with 1% DMSO, 0.5% Glycerol and 0.1% Tween (CTL) served as controls. Each phospholipid was tested at least twice for its capability to activate defense gene expression and representative pictures from one experiment are shown. (B) Expression of PR1, SAG13, and TI in response to treatment with choline, phosphocholine, phosphatidic acid (PA) (18:1/18:1), lysophosphatidylcholine LPC(18:1), oleic acid (C18:1), and PC(C18:1/C18:1). All compounds were applied to GUS reporter lines at 1 µg/µL, solubilized in 1% DMSO, 0.5% Glycerol and 0.1% Tween. Plants treated with 1% DMSO, 0.5% Glycerol and 0.1% Tween (CTL) served as controls. The experiment was repeated three times with similar results and representative pictures from one experiment are shown. (C) Relative PR1 expression upon treatment with EE and PC(C16:1/C16:1) at different concentrations. PC(C16:1/C16:1) was solubilized in 1% DMSO, 0.5% Glycerol and 0.1% Tween. Untreated plants (UT) and plants treated with 1% DMSO, 0.5% Glycerol and 0.1% Tween (CTL) served as controls. Total amounts of PC(C16:1/C16:1) applied per treatment are given below each bar. Transcript levels represent means ± SE of four independent experiments. Different letters indicate significant differences between treatments (ANOVA followed by Tukey’s honest significant test, p<0.05). SM-mix, sphingomyelin mix.
-
Figure 3—source data 1
Source data for Figure 3C.
- https://cdn.elifesciences.org/articles/60293/elife-60293-fig3-data1-v1.xlsx
Figure 3—figure supplement 1
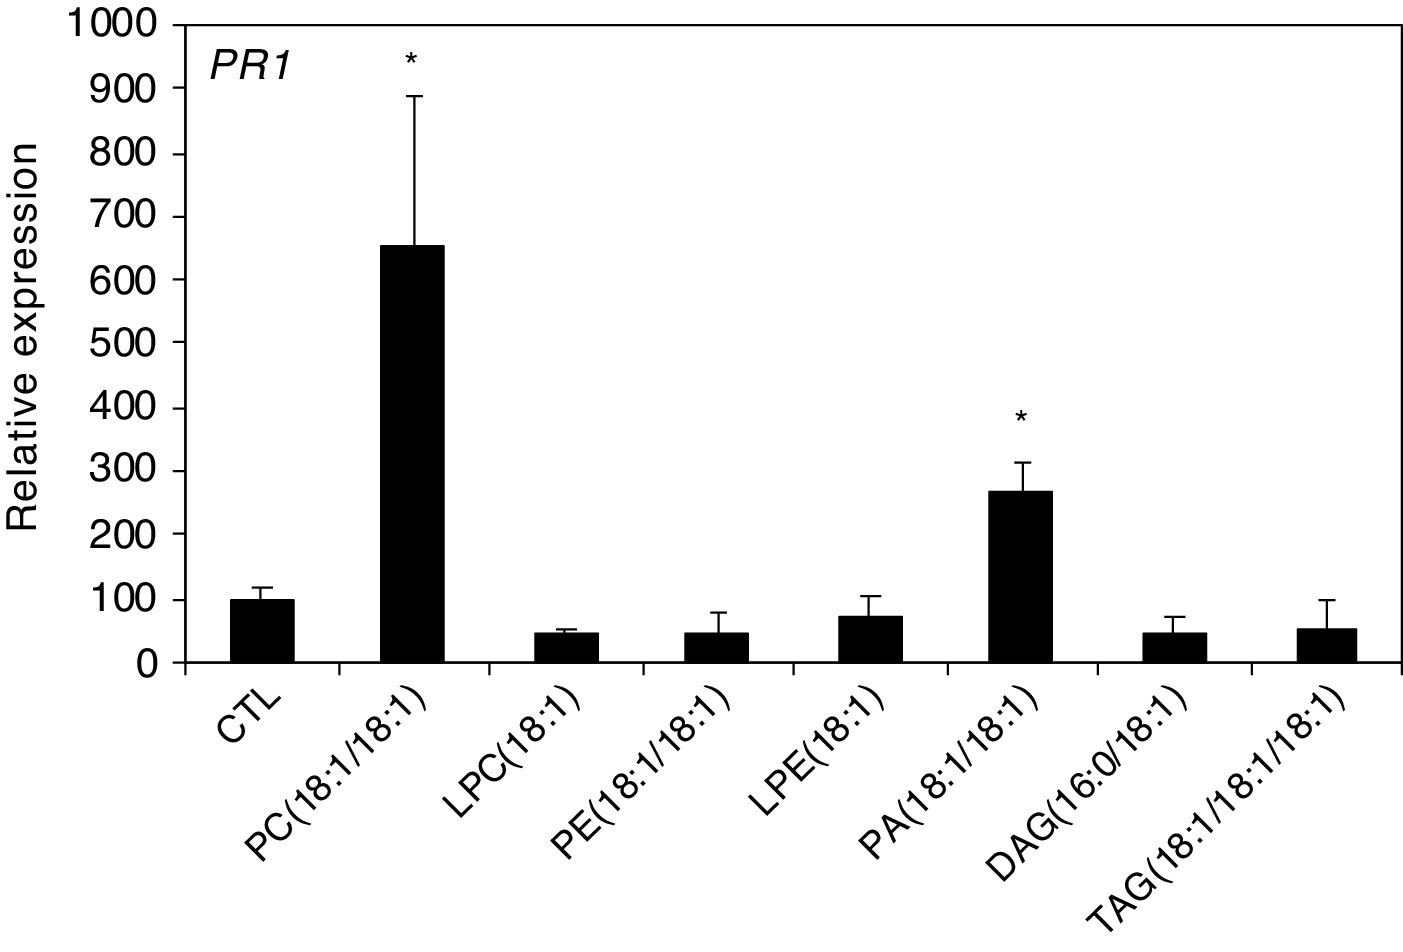
PC(18:1/18:1) and PA(18:1/18:1) activate defense gene expression in Arabidopsis.
Relative PR1 expression upon treatment with PC(18:1/18:1), LPC(18:1), PE(18:1/18:1), LPE(18:1), PA(18:1/18:1), DAG(16:0/18:1) and TAG(18:1/18:1/18:1). Phospholipids were applied at 1 µg/µL solubilized in 1% DMSO, 0.5% Glycerol and 0.1% Tween. Plants treated with 1% DMSO, 0.5% Glycerol and 0.1% Tween (CTL) served as controls. Transcript levels represent means ± SE of three independent experiments. Asterisks denote statistically significant differences between CTL and treated samples (Welch's t-test, *p<0.05).
-
Figure 3—figure supplement 1—source data 1
Source data for Figure 3—figure supplement 1.
- https://cdn.elifesciences.org/articles/60293/elife-60293-fig3-figsupp1-data1-v1.xlsx
Figure 4 with 1 supplement
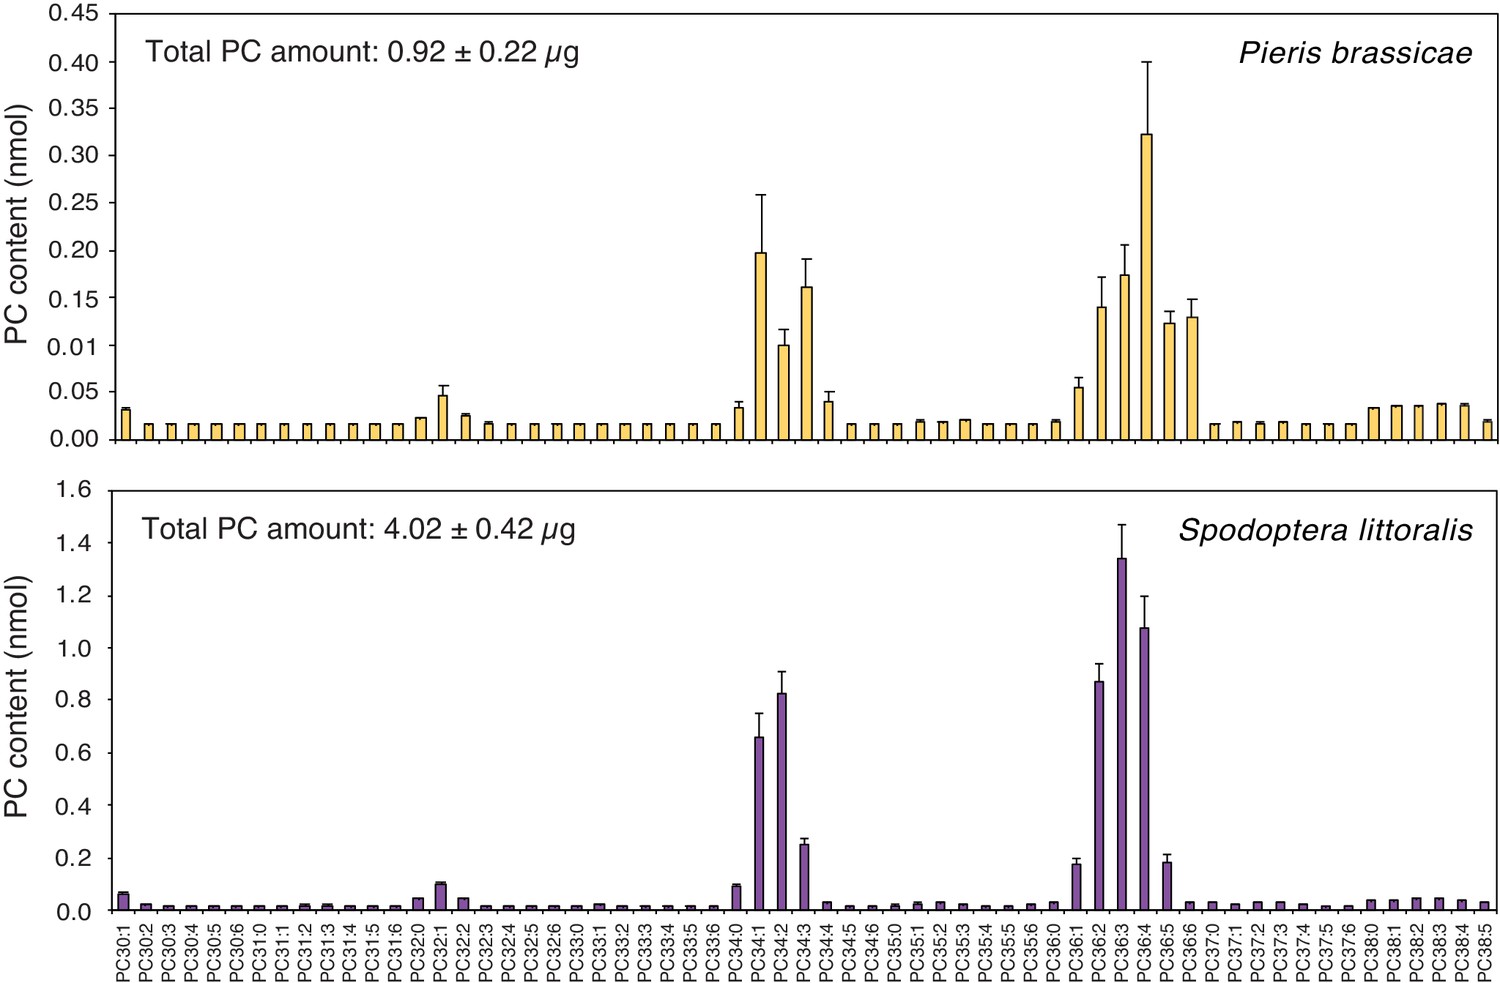
Phosphatidylcholines are released from intact insect eggs.
MS-based quantification of PCs extracted from filter papers on which P. brassicae (upper panel) and Spodoptera littoralis (lower panel) eggs were deposited by natural oviposition. 80 P. brassicae eggs or 150–200 s. littoralis eggs were oviposited on filter papers and PCs from the filter papers were extracted one day and three days later, respectively. PC species are reported according to their molecular composition with the total number of carbon atoms and the sum of double bonds in the fatty acyl chains and the levels represent the mean ± SE of three independent samples. Total amount of PCs is describing the sum of all PC species per filter paper extract and represents the mean ± SE of three independent samples.
-
Figure 4—source data 1
Source data for Figure 4.
- https://cdn.elifesciences.org/articles/60293/elife-60293-fig4-data1-v1.xlsx
Figure 4—figure supplement 1
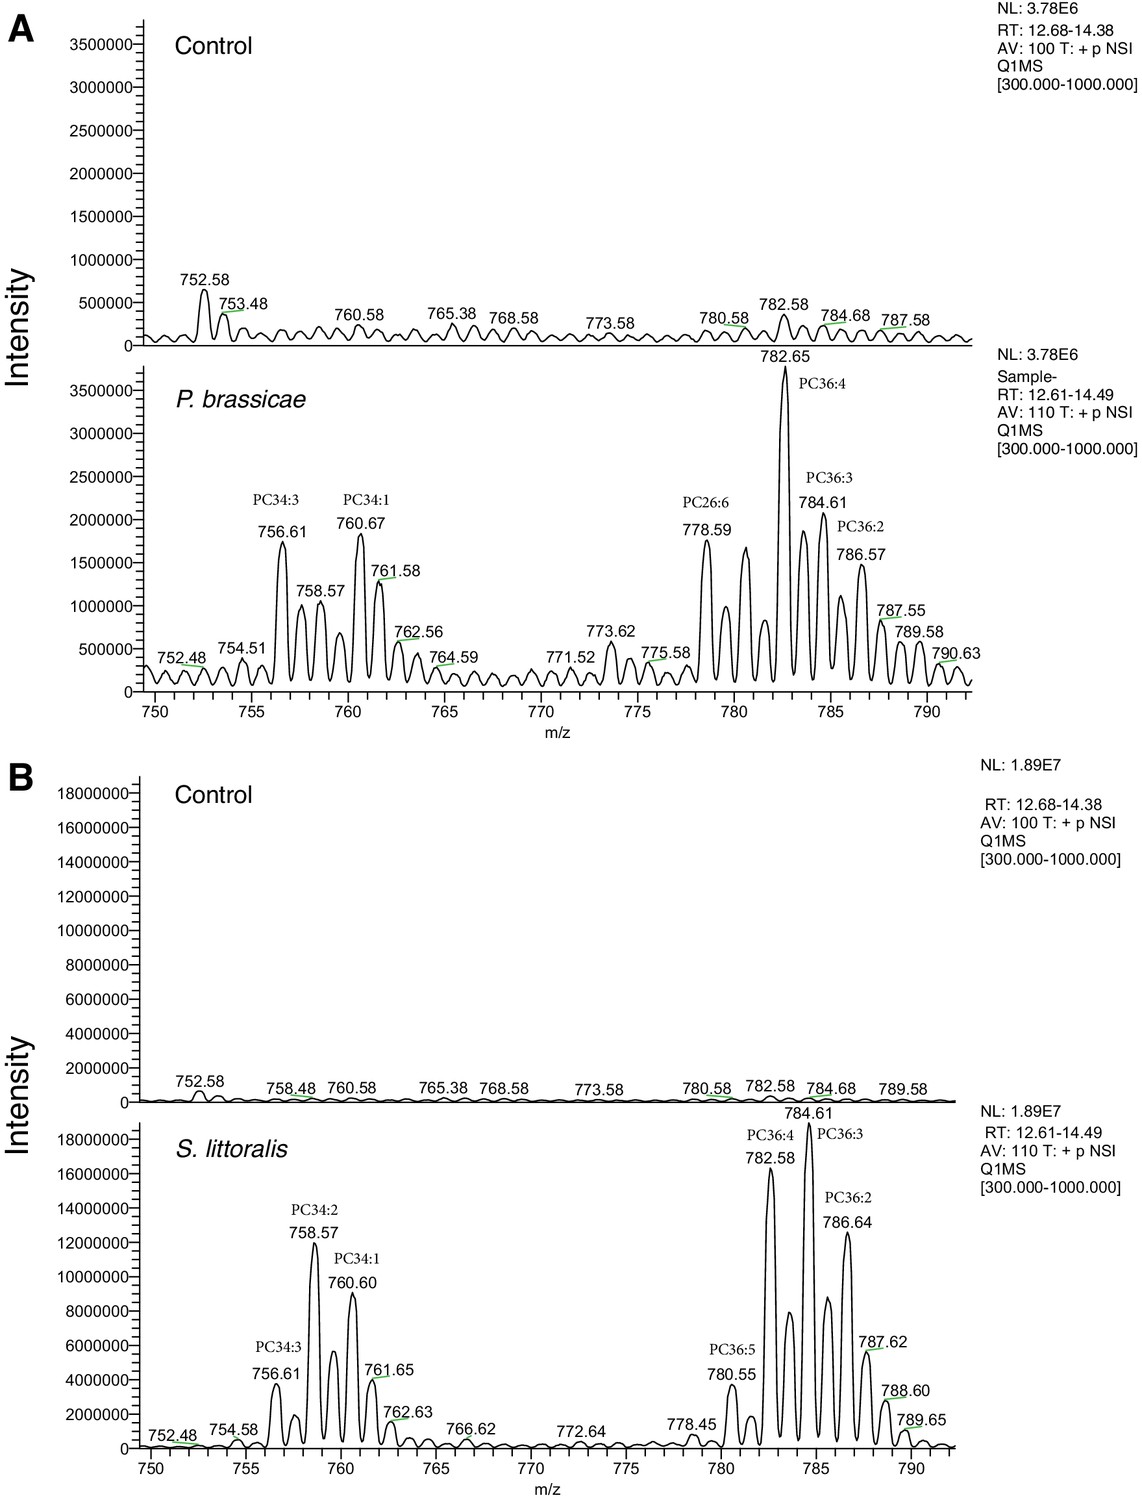
A full MS scan of samples extracted from filter paper (A) control (no eggs) and P. brassiceae eggs oviposited on filter paper and removed after one day.
(B) Control (no eggs) and S. littoralis eggs oviposited on filter paper and removed after 2–3 days. Masses where most changes in PC levels occur are shown.
Figure 5
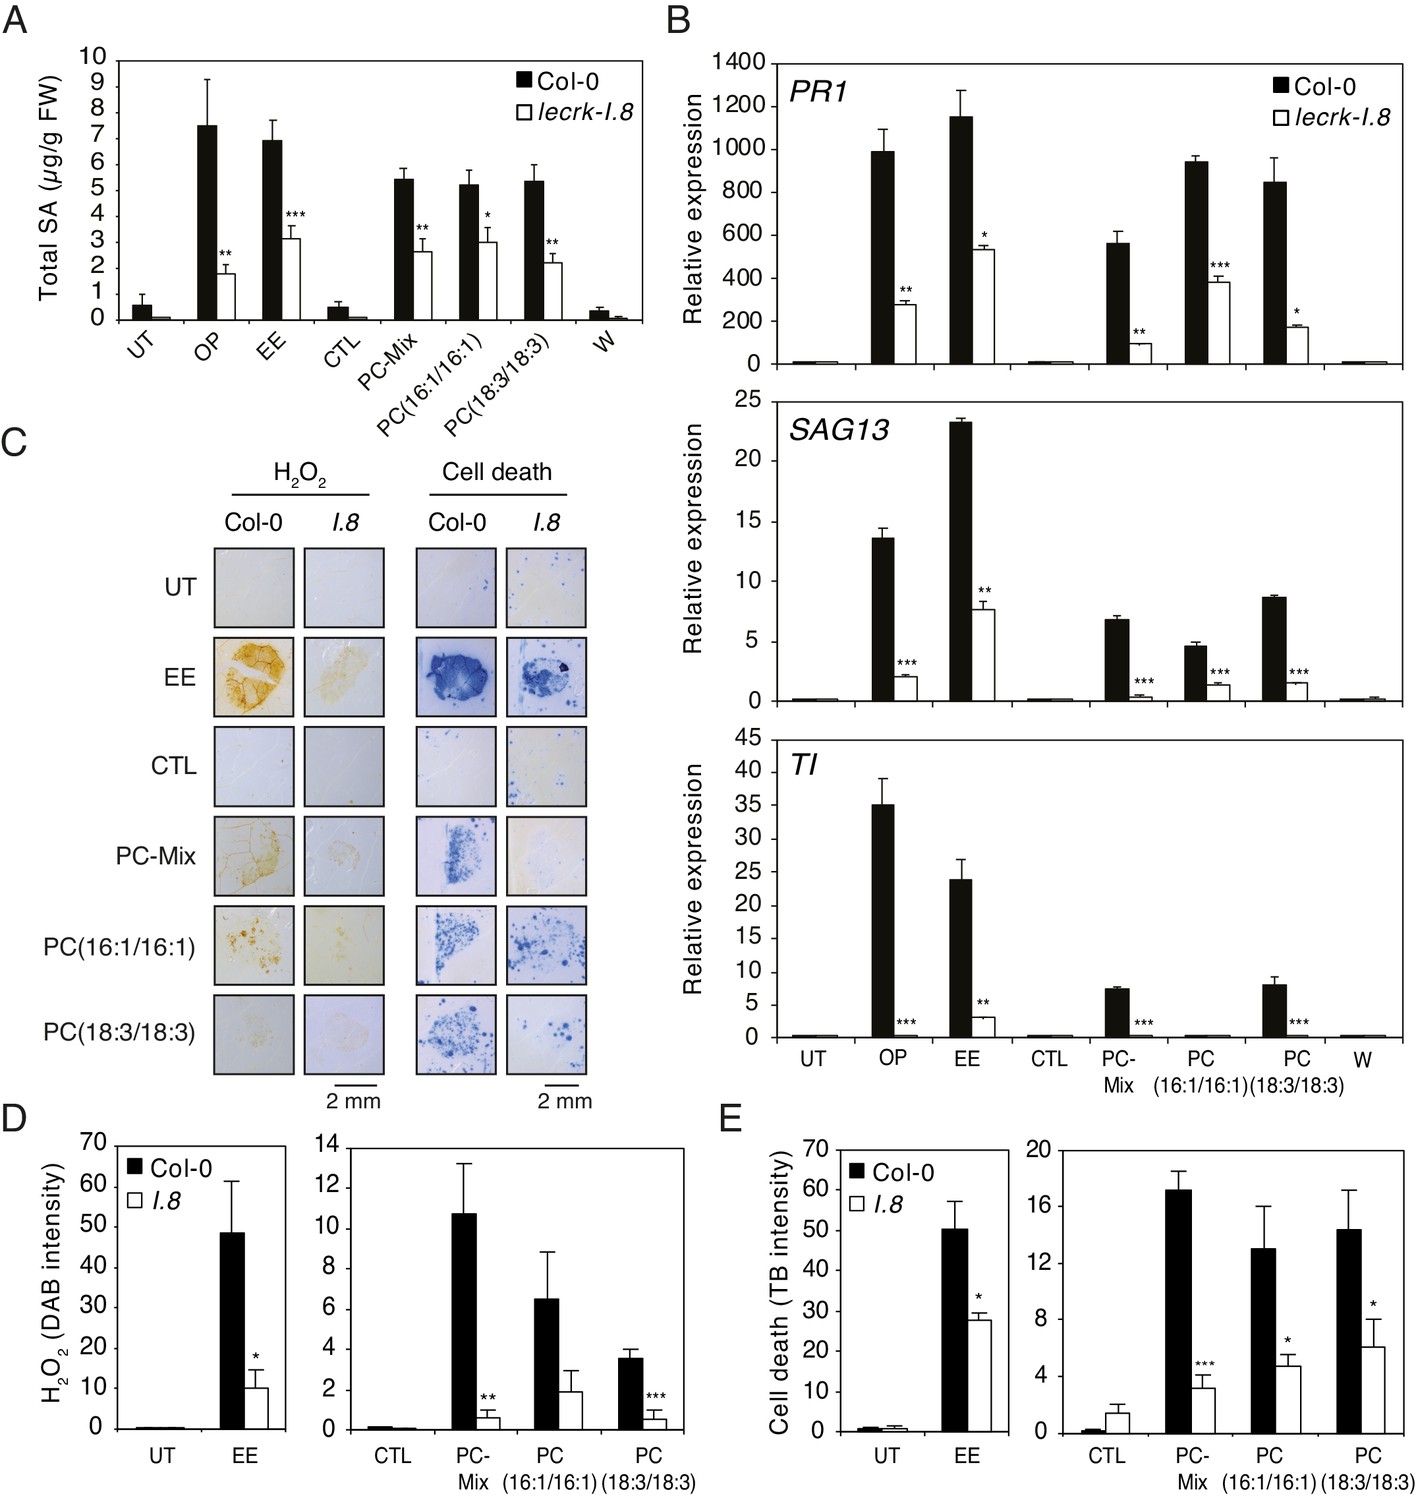
Elicitation of plant-defense responses by extracellular phosphatidylcholines depends on a functional Lectin Receptor Kinase LecRK-I.8.
(A) Endogenous levels of salicylic acid (SA) in Col-0 and lecrk-I.8 in response to P. brassicae oviposition (OP), EE, PC-Mix, PC(C16:1/C16:1), PC(C18:3/C18:3), and wounding (W). Total SA levels represent means ± SE of four independent experiments. Asterisks denote statistically significant differences between the same treatment of Col-0 and lecrk-I.8 (Welch's t-test, ***p<0.001). (B) Relative expression of PR1, SAG13 and TI in Col-0 and lecrk-I.8 upon treatment with oviposition (OP), EE, PC-Mix, PC(C16:1/C16:1), PC(C18:3/C18:3), and wounding (W). Transcript levels represent means ± SE of one representative experiment with technical triplicates. The experiment was repeated three times with similar results. Asterisks denote statistically significant differences between the same treatment of Col-0 and lecrk-I.8 (Welch's t-test, *p<0.05, **p<0.01, ***p<0.001). (C) Histochemical staining of leaves of Col-0 and lecrk-I.8 with 3,3-diaminobenzidine (DAB) to detect H2O2 accumulation and trypan blue to detect cell death in response to treatment with EE, PC-Mix, PC(C16:1/C16:1), and PC(C18:3/C18:3). The experiment was repeated twice with similar results and representative pictures from one experiment are shown. (D, E) Quantification of H2O2 and cell death accumulation as in (C). Staining intensity was measured on images with ImageJ software. Means ± SE of five to six leaves are shown. Asterisks denote statistically significant differences between the same treatment of Col-0 and lecrk-I.8 (Mann-Whitney U test (D) and Welch's t-test (E), *, p<0.05; **, p<0.01; ***, p<0.001). For all experiments, PCs were applied at 1 µg/µL (A, B) or 5 µg/µL (C–E), solubilized in 1% DMSO, 0.5% Glycerol and 0.1% Tween. Untreated plants (UT) and plants treated with 1% DMSO, 0.5% Glycerol and 0.1% Tween (CTL) served as controls.
-
Figure 5—source data 1
Source data for Figure 5A–E.
- https://cdn.elifesciences.org/articles/60293/elife-60293-fig5-data1-v1.xlsx
Author response image 1
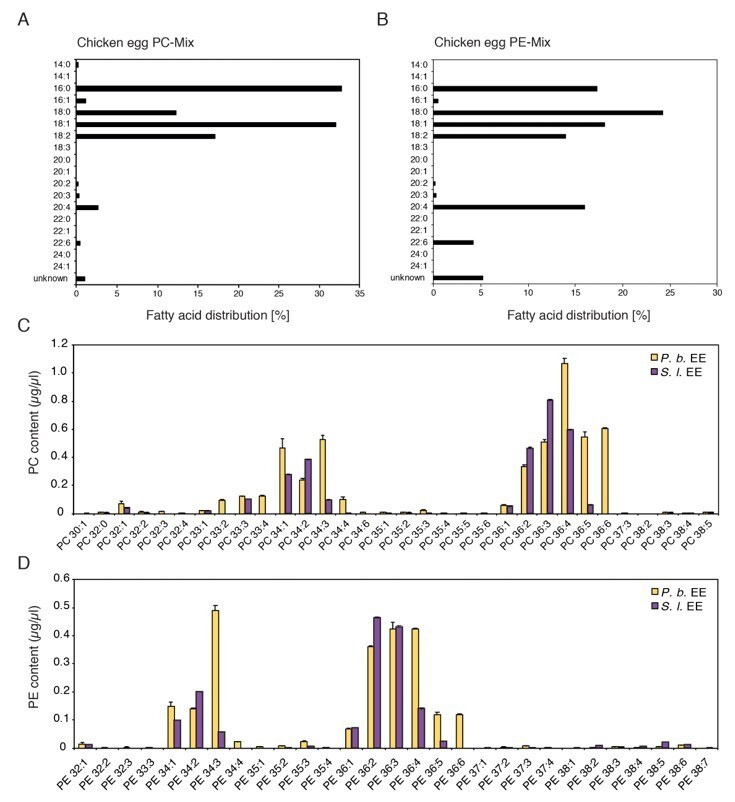
Comparison of chemical composition of PC and PE mixes purified from chicken egg yolk and PC and PE in EE.
(A, B) Fatty acid distribution in the commercially available PC and PE mixes purified from chicken eggs used in this study (Redrawn from ‘Fatty Acid Distribution’ at: PC, https://avantilipids.com/product/840051; PE, https://avantilipids.com/product/840021). (C, D) Absolute levels of phosphatidylcholines (PCs) and phosphatidylethanolamines (PE) in P. brassicae and S. littoralis EE measured by MS shotgun lipidomic analysis. Different PC and PE species are reported according to their molecular composition with the total number of carbon atoms and the sum of double bonds in the fatty acyl chains. PC and PE levels represent the means ± SE of three different EE preparations.
Author response image 2
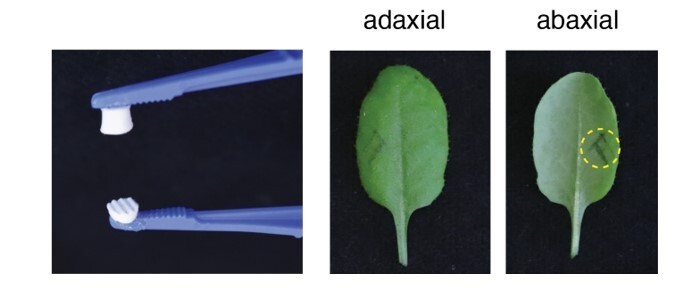
Forceps used (left) and site of leaf wound treatment.
The size of the corrugated wounding-surface was adjusted to the size of a 2 µl drop of EE. Dotted circle shows the wounded area.
Tables
Key resources table
| Reagent type (species) or resource | Designation | Source or reference | Identifiers | Additional information |
|---|---|---|---|---|
| Gene (Arabidopsis thaliana) | PR1 | arabidopsis.org | At2G14610 | |
| Gene (Arabidopsis thaliana) | SAG13 | arabidopsis.org | At2G29350 | |
| Gene (Arabidopsis thaliana) | TI | arabidopsis.org | At1g73260 | |
| Gene (Arabidopsis thaliana) | LecRK-I.8 | arabidopsis.org | At5g60280 | |
| Genetic reagent (Arabidopsis thaliana) | lecrk-I.8 T-DNA | Nottingham Arabidopsis stock center (NASC) | SALK_066416 | |
| Genetic reagent (Arabidopsis thaliana) | PR1::GUS | Bruessow et al., 2010 | ||
| Genetic reagent (Arabidopsis thaliana) | SAG13::GUS | Bruessow et al., 2010 | ||
| Genetic reagent (Arabidopsis thaliana) | TI::GUS | Bruessow et al., 2010 | ||
| Genetic reagent (Arabidopsis thaliana) | sid2-1 | Nawrath and Métraux, 1999 | ||
| Genetic reagent (Acinetobacter sp. ADPWH_lux.) | bacterial biosensor | Huang et al., 2005 | ||
| Sequence-based reagent | PR1_FWD | This paper | PCR primers | GTGGGTTAGCGAGAAGGCTA |
| Sequence-based reagent | PR1_RV | This paper | PCR primers | ACTTTGGCACATCCGAGTCT |
| Sequence-based reagent | SAG13_FWD | This paper | PCR primers | GTCGTGCATGTCAATGTTGG |
| Sequence-based reagent | SAG13_RV | This paper | PCR primers | CCAAGGACAAACAGAGTTCG |
| Sequence-based reagent | TI_FWD | This paper | PCR primers | CCTCGTGGTTGCTGGTCCAAA |
| Sequence-based reagent | TI_RV | This paper | PCR primers | CCTCTCACATAGTCTTGGACGAAA |
| Sequence-based reagent | SAND_F | This paper | PCR primers | AACTCTATGCAGCATTTGATCCACT |
| Sequence-based reagent | SAND_R | This paper | PCR primers | TGATTGCATATCTTTATCGCCATC |
Additional files
-
Supplementary file 1
Arabidopsis transcriptome after 5 days of P. brassicae oviposition or treatment with egg extract.
Plants were naturally oviposited by P. brassicae butterflies and leaves containing one egg batch (ca. 20-30 eggs) were harvested after 5 days. For EE treatment, leaves were treated with 2 x 2 microL of EE (corresponding to ca. 30 eggs) and harvested after 5 days.
- https://cdn.elifesciences.org/articles/60293/elife-60293-supp1-v1.xlsx
-
Transparent reporting form
- https://cdn.elifesciences.org/articles/60293/elife-60293-transrepform-v1.docx
Download links
A two-part list of links to download the article, or parts of the article, in various formats.
Downloads (link to download the article as PDF)
Open citations (links to open the citations from this article in various online reference manager services)
Cite this article (links to download the citations from this article in formats compatible with various reference manager tools)
Phosphatidylcholines from Pieris brassicae eggs activate an immune response in Arabidopsis
eLife 9:e60293.
https://doi.org/10.7554/eLife.60293


