Telomere length is associated with growth in children in rural Bangladesh
- Division of Epidemiology and Biostatistics, School of Public Health, University of California, Berkeley, United States
- Francis I. Proctor Foundation, University of California San Francisco, United States
- Department of Biochemistry and Biophysics, University of California, San Francisco, United States
- Department of Nutrition, University of California, Davis, United States
- Infectious Disease Division, International Centre for Diarrhoeal Disease Research, Bangladesh
- Department of Epidemiology & Population Health, Stanford University, United States
- Health System and Population Studies Division, International Centre for Diarrhoeal Disease Research, Bangladesh
- Department of Psychiatry & Behavioral Sciences, Sylvester Comprehensive Cancer Center, Miller School of Medicine, University of Miami, United States
- Division of Community Health Sciences, School of Public Health, University of California, Berkeley, United States
- Division of Infectious Diseases and Geographic Medicine, Stanford University, United States
Figures
Figure 1
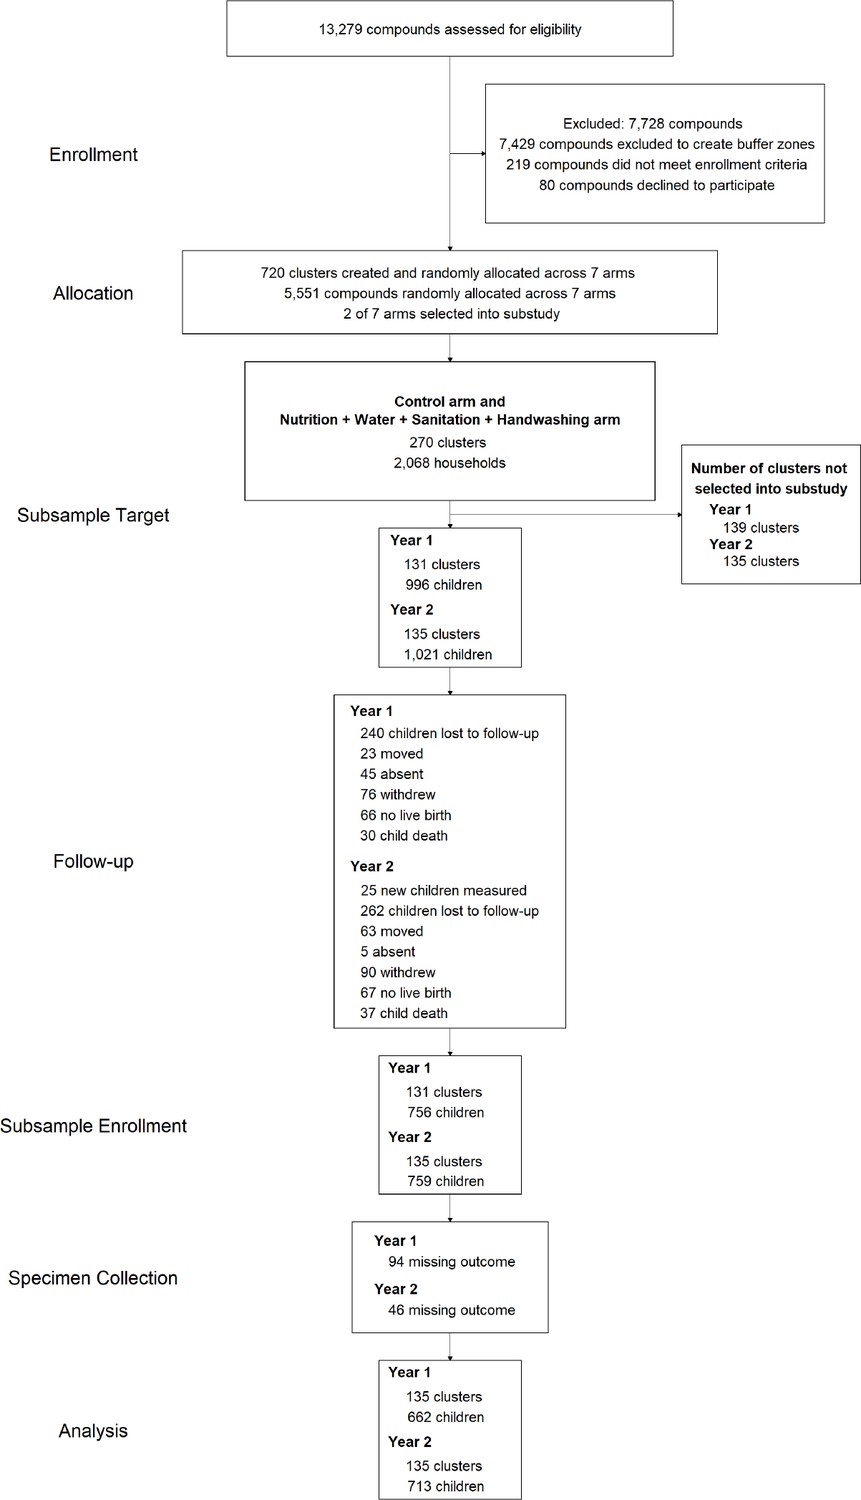
Diagram of participants at each phase of the telomere length and growth substudy within the WASH Benefits trial.
-
Figure 1—source code 1
Source code for Figure 1.
- https://cdn.elifesciences.org/articles/60389/elife-60389-fig1-code1-v2.zip
Figure 2 with 3 supplements
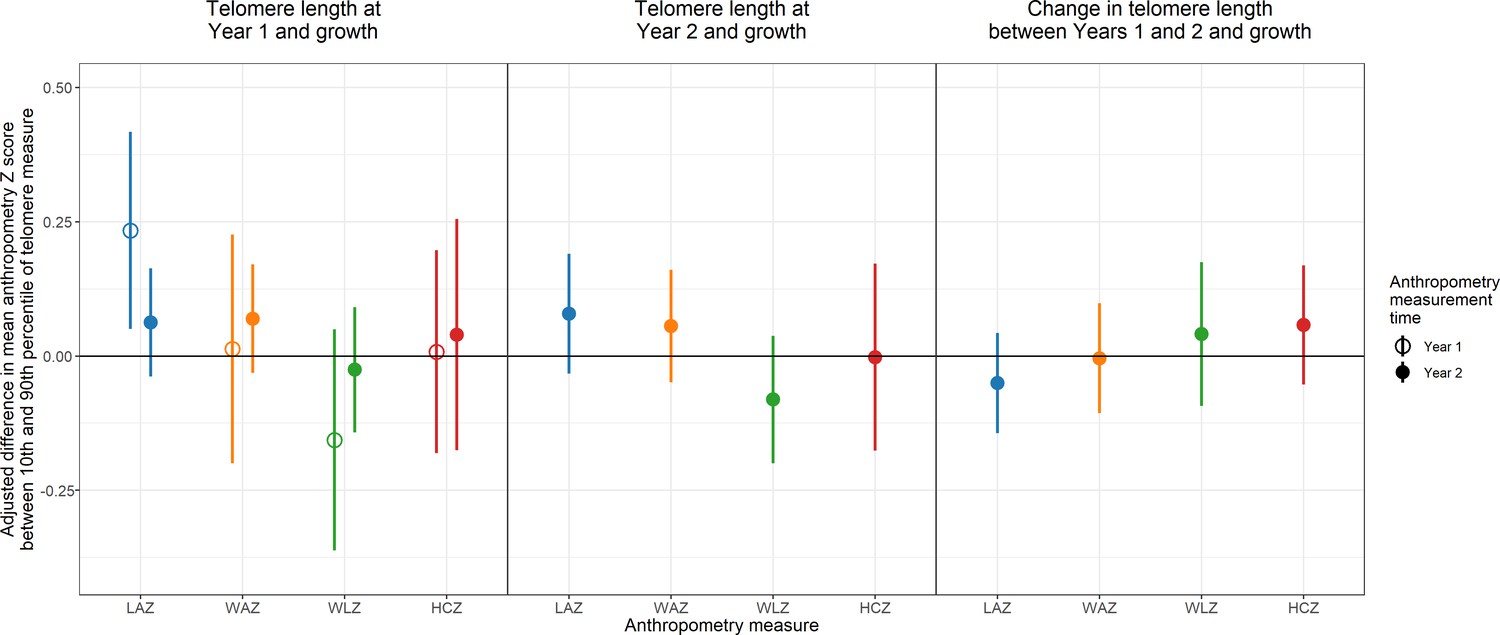
Adjusted association between telomere length and growth.
Adjusted differences in mean anthropometry Z score between 10th and 90th percentile of telomere measure. LAZ = length-for-age Z score; WAZ = weight-for-age Z score; WLZ = weight-for-length Z score; HCZ = head circumference-for-age Z score.
-
Figure 2—source code 1
Source code for Figure 2.
- https://cdn.elifesciences.org/articles/60389/elife-60389-fig2-code1-v2.zip
-
Figure 2—source data 1
Source code for Figure 2.
- https://cdn.elifesciences.org/articles/60389/elife-60389-fig2-data1-v2.zip
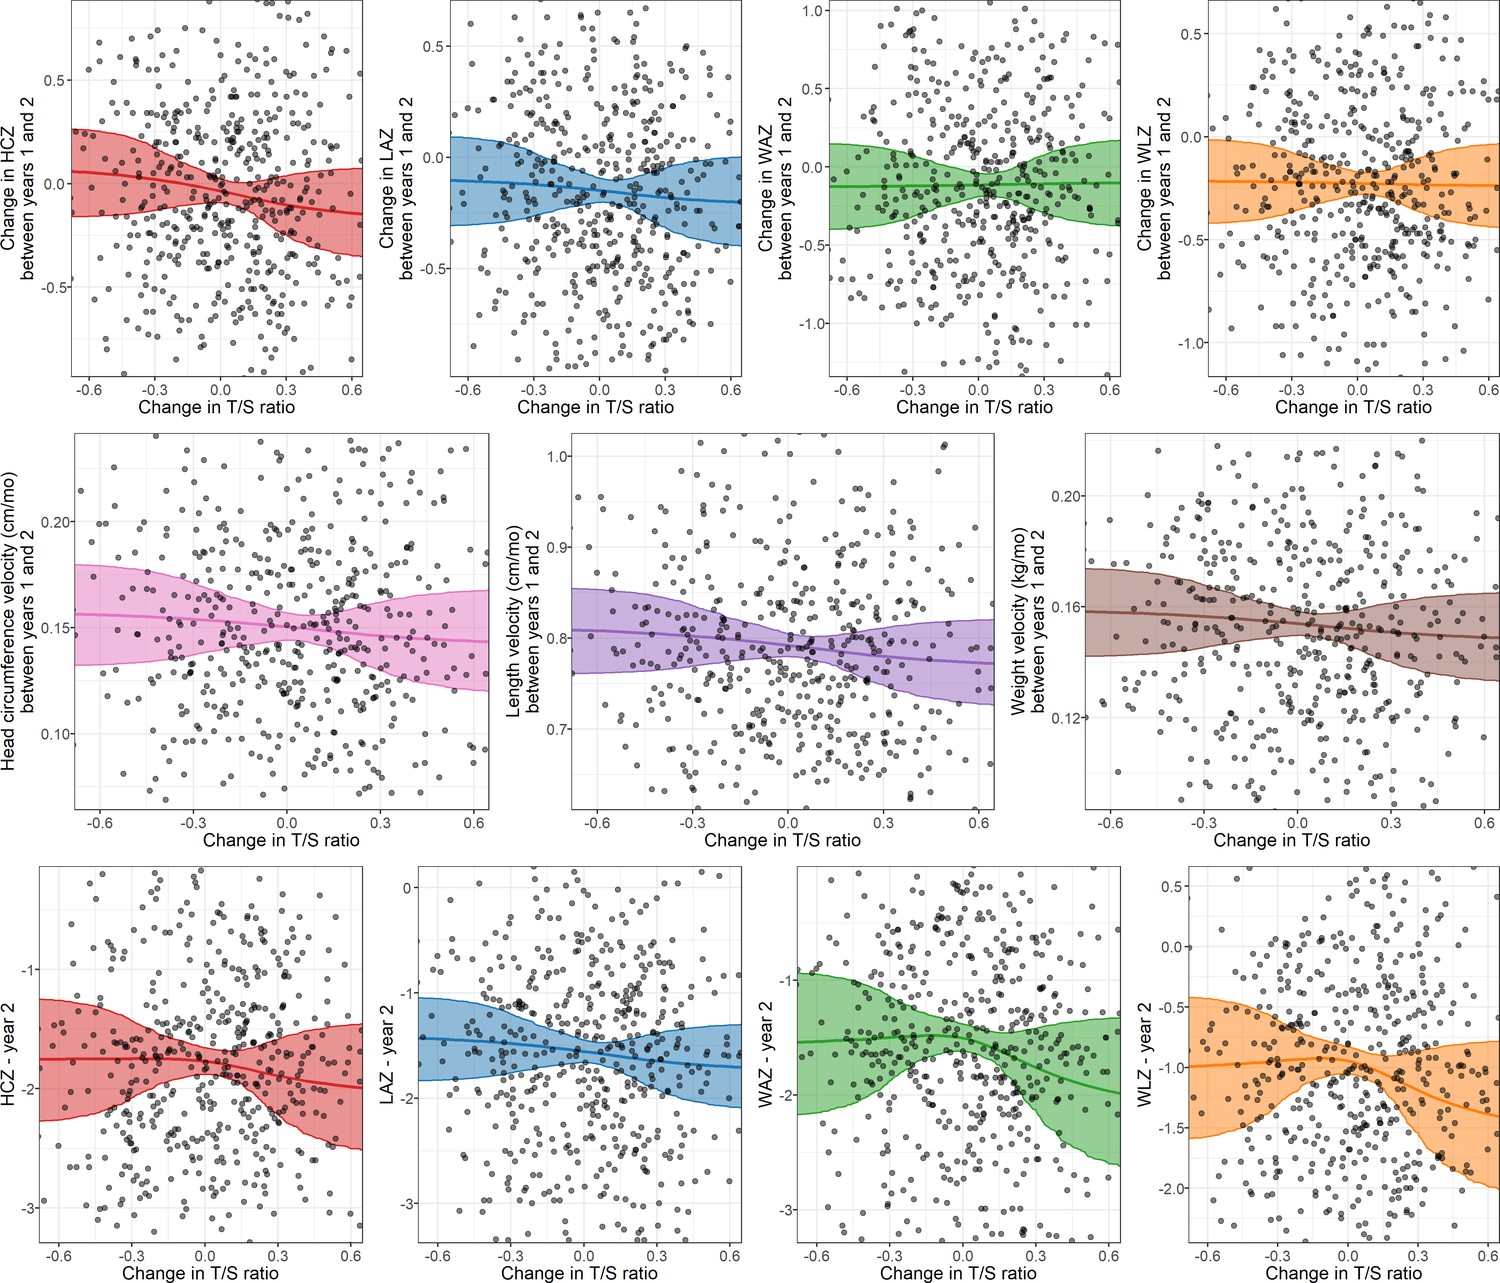
Figure 2—figure supplement 1
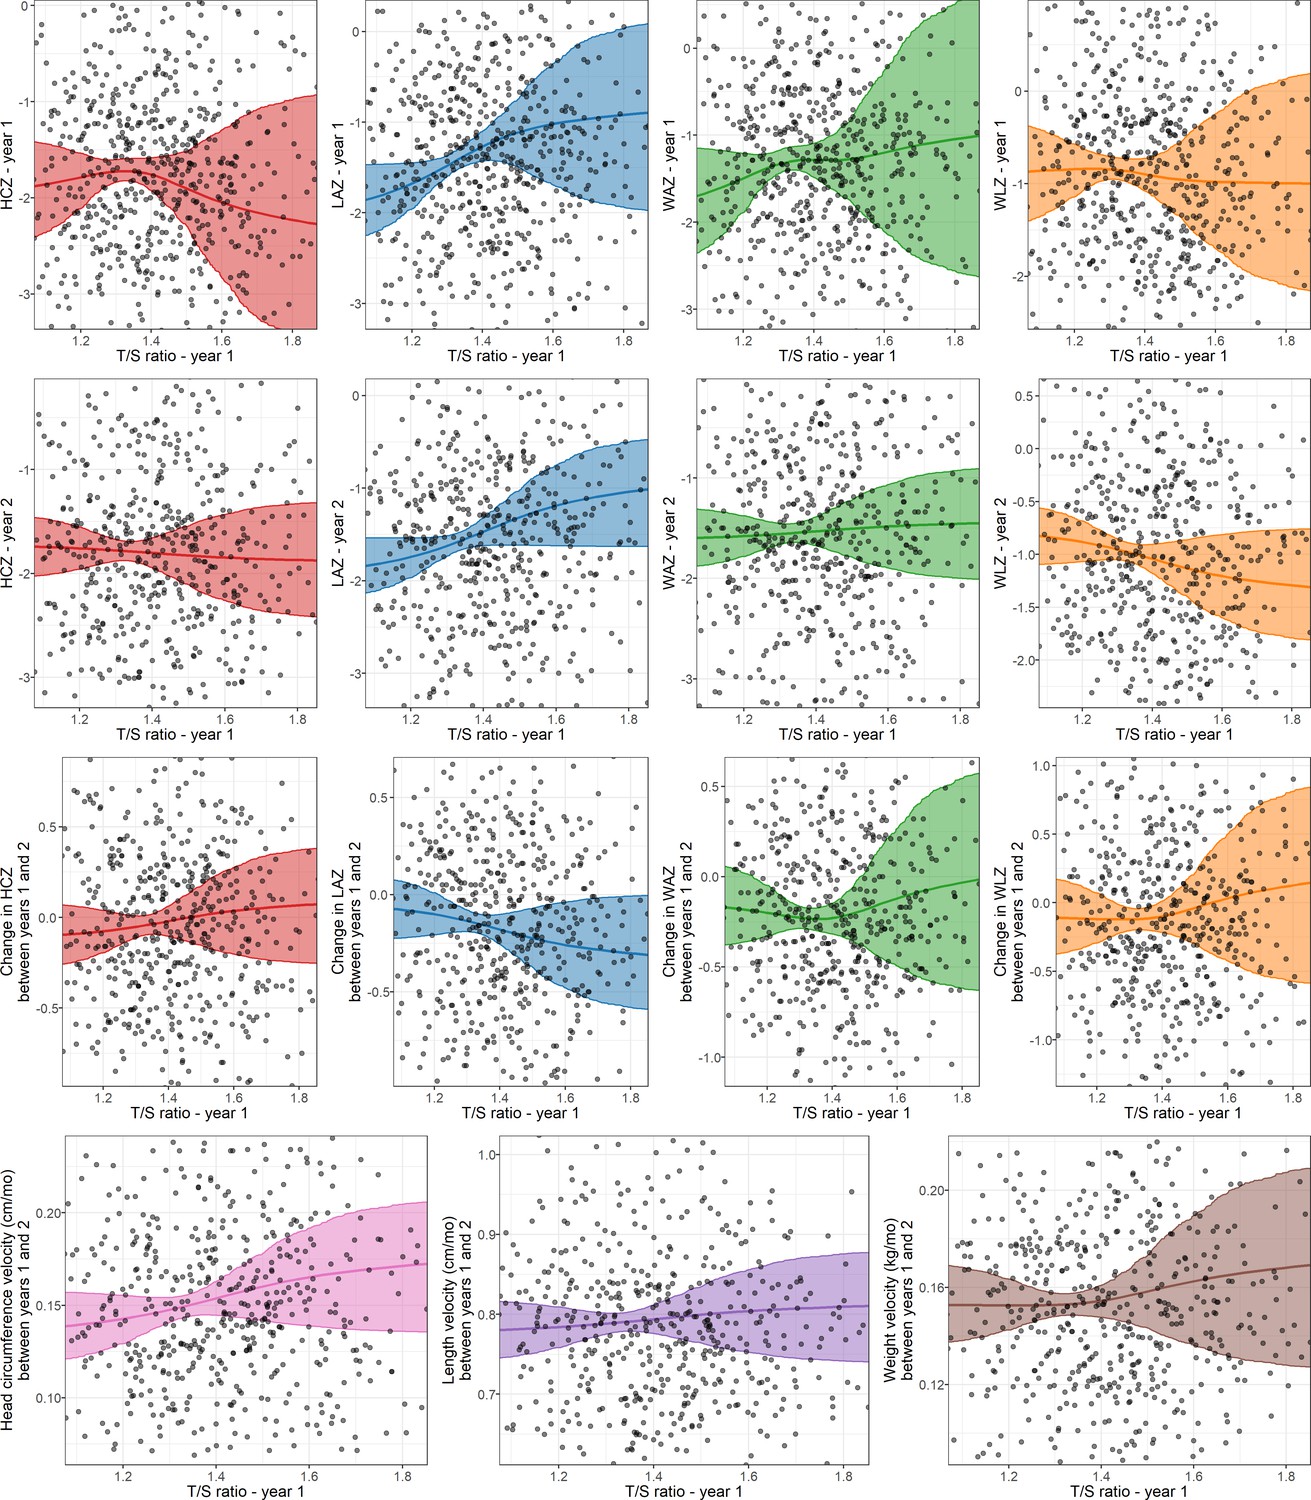
Association between telomere length at Year 1 and concurrent and subsequent growth.
Spline curves of telomere length at Year 1 and anthropometric Z scores at Years 1 and 2, change in anthropometric Z scores, and growth velocity. T/S Ratio = unit for relative telomere length; LAZ = length-for-age Z score; WAZ = weight-for-age Z score; WLZ = weight-for-length Z score; HCZ = head circumference-for-age Z score.
-
Figure 2—figure supplement 1—source data 1
Source data for Figure 2—figure supplements 1–3.
- https://cdn.elifesciences.org/articles/60389/elife-60389-fig2-figsupp1-data1-v2.zip
Figure 2—figure supplement 2
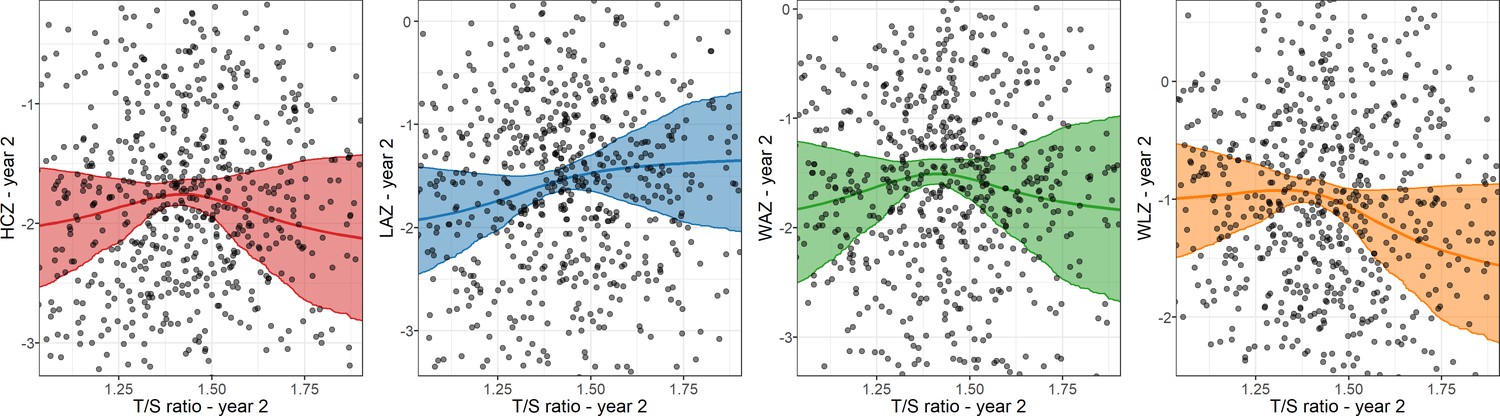
Association between telomere length at Year 2 and concurrent growth.
Spline curves of telomere length at Year 2 and anthropometric Z scores at Year 2. T/S ratio = unit for relative telomere length; LAZ = length-for-age Z score; WAZ = weight-for-age Z score; WLZ = weight-for-length Z score; HCZ = head circumference-for-age Z score.
Figure 2—figure supplement 3
Association between change in telomere length between Years 1 and 2 and growth.
Spline curves of change in telomere length between Years 1 and 2 and anthropometric Z scores at Year 2, change in anthropometric Z scores, and growth velocity. T/S ratio = unit for relative telomere length; LAZ = length-for-age Z score; WAZ = weight-for-age Z score; WLZ = weight-for-length Z score; HCZ = head circumference-for-age Z score.
Figure 3 with 2 supplements
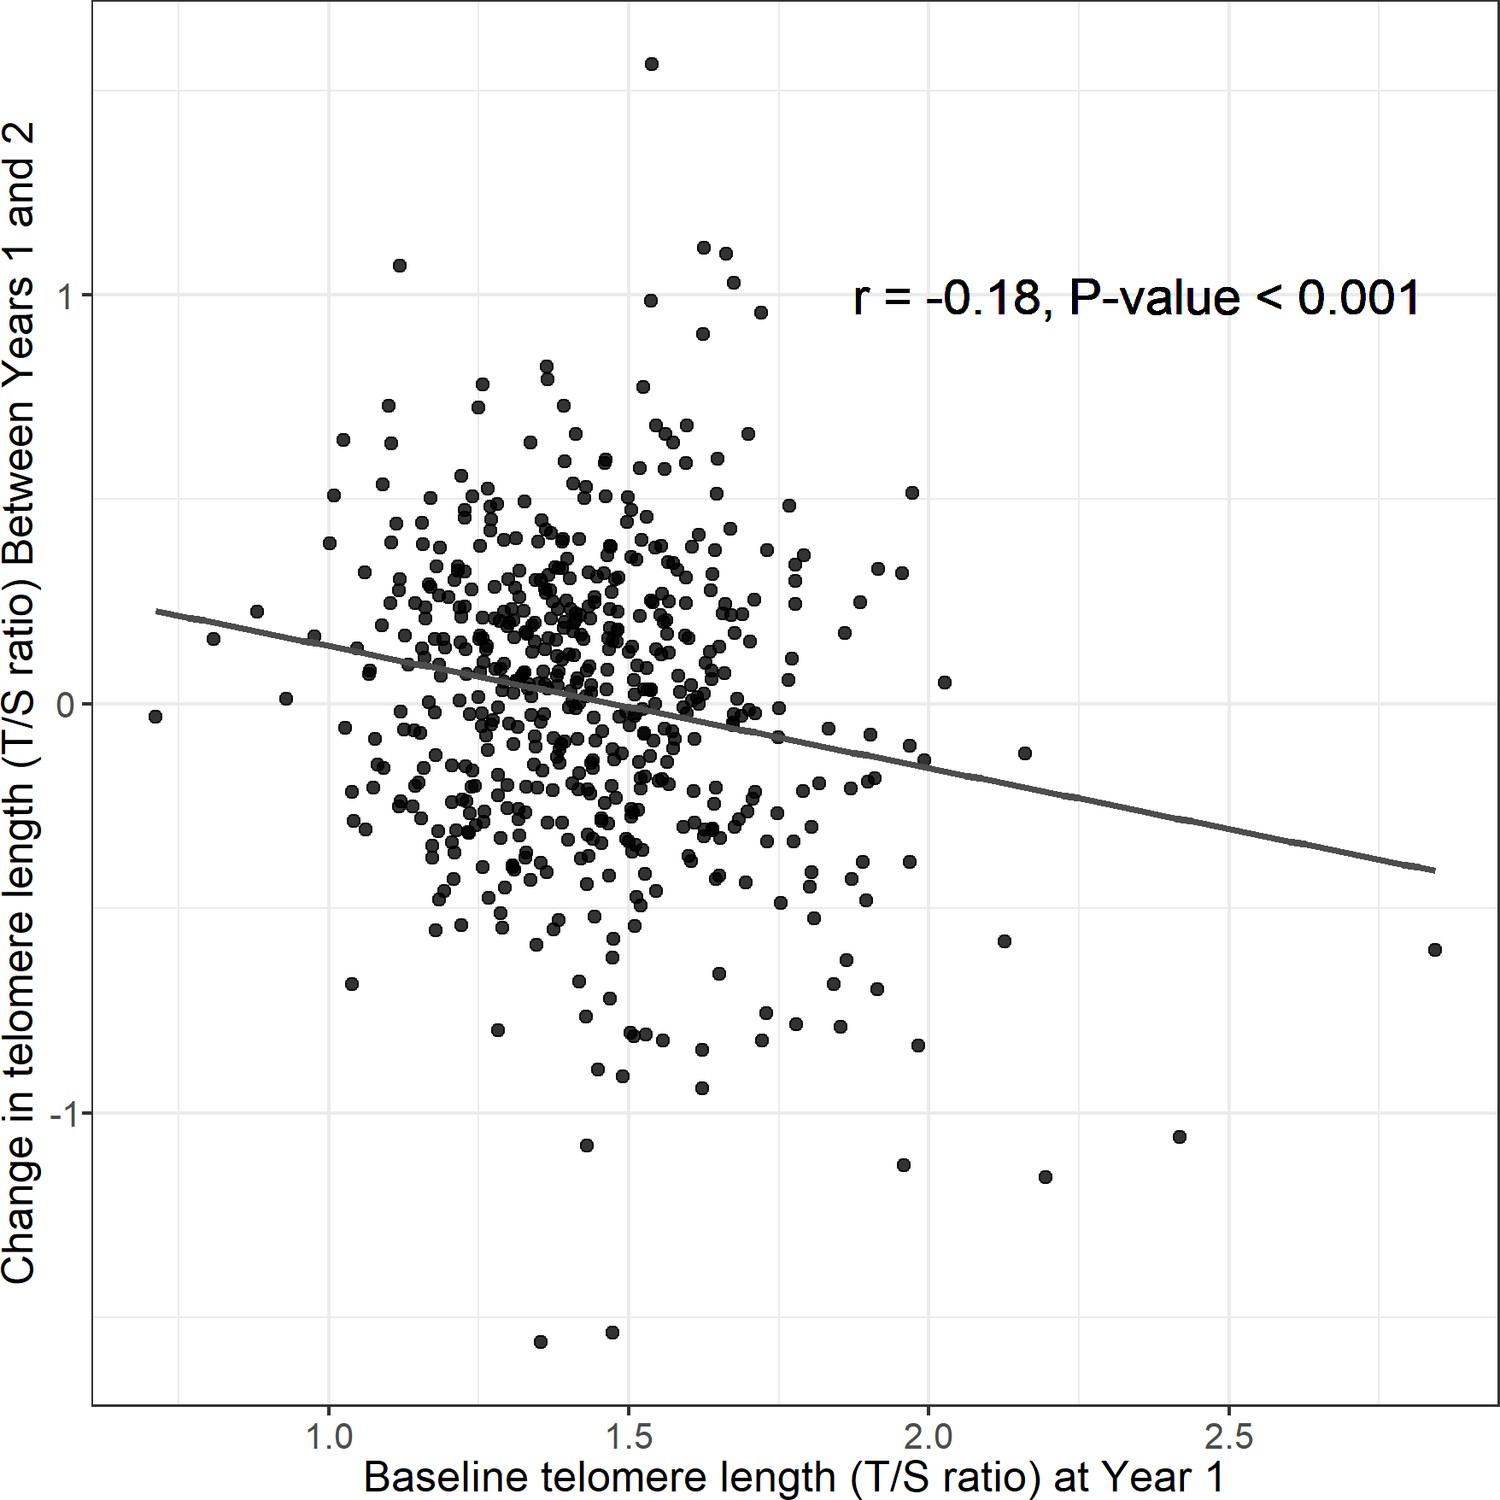
Regression to the mean assessment: association between telomere length at Year 1 and change in telomere length between Years 1 and 2.
T/S ratio = unit for relative telomere length.
-
Figure 3—source code 1
Source code for Figure 3.
- https://cdn.elifesciences.org/articles/60389/elife-60389-fig3-code1-v2.zip
Figure 3—figure supplement 1
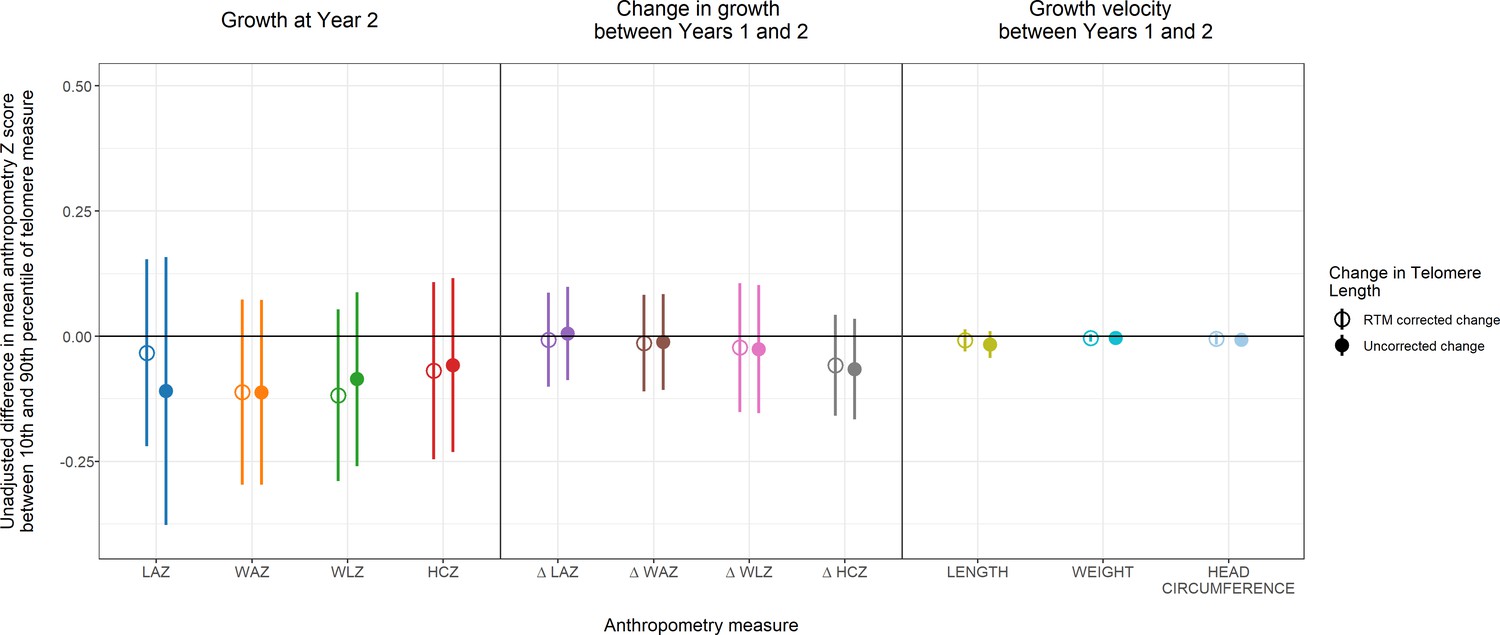
Regression to the mean comparison of unadjusted association between change in telomere length and growth.
Unadjusted differences in mean anthropometry Z score between 10th and 90th percentile of change in telomere length between Years 1 and 2. Unadjusted associations corrected for the regression to the mean (RTM) effect using the equation in Verhulst et al., 2013. LAZ = length-for-age Z score; WAZ = weight-for-age Z score; WLZ = weight-for-length Z score; HCZ = head circumference-for-age Z score.
-
Figure 3—figure supplement 1—source data 1
Source data for Figure 3—figure supplements 1 and 2.
- https://cdn.elifesciences.org/articles/60389/elife-60389-fig3-figsupp1-data1-v2.zip
-
Figure 3—figure supplement 1—source code 1
Source code for Figure 3—figure supplements 1 and 2.
- https://cdn.elifesciences.org/articles/60389/elife-60389-fig1-code1-v2.zip
Figure 3—figure supplement 2
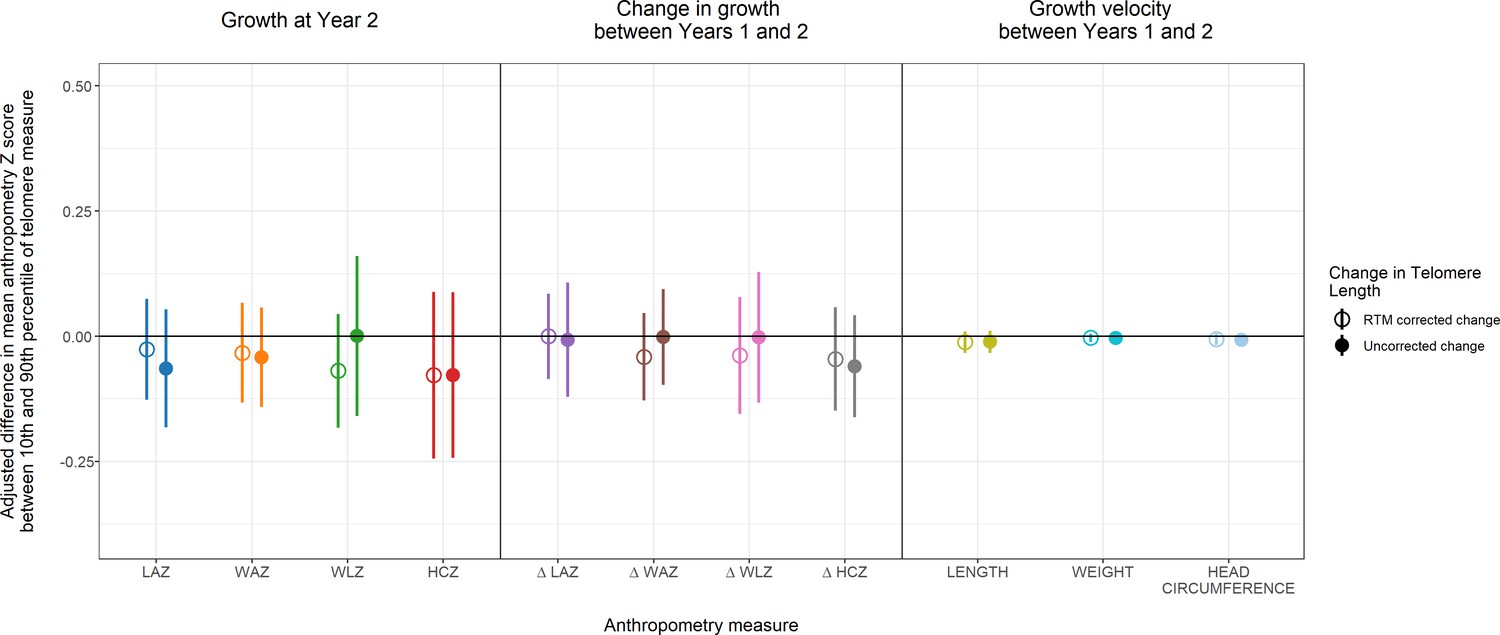
Regression to the mean comparison of adjusted association between change in telomere length and growth.
Adjusted differences in mean anthropometry Z score between 10th and 90th percentile of change in telomere length between Years 1 and 2. Adjusted associations corrected for the regression to the mean (RTM) effect using the equation in Verhulst et al., 2013. LAZ = length-for-age Z score; WAZ = weight-for-age Z score; WLZ = weight-for-length Z score; HCZ = head circumference-for-age Z score. Adjusted for pre-specified covariates: Child age, child sex, birth order, prior child length and weight measurements from Year 1 (included in Year 2 outcomes only), season of measurement, time between anthropometry measurements (included in growth velocity and change in growth measurements between Year 1 and Year 2 outcomes only), caregiver-reported diarrhoea, mother’s age, mother’s height, mother’s education level, mother’s Center for Epidemiologic Studies Depression Scale Revised (CESD-R) score, mother’s Perceived Stress Scale score, mother’s lifetime exposure to physical, sexual, and emotional intimate partner violence, household food insecurity, number of children <18 years in the household, number of individuals living in the compound, distance in minutes to the primary water source, household floor materials, household wall materials, household electricity, and household assets (wardrobe, table, chair, clock, khat, chouki, radio, television, refrigerator, bicycle, motorcycle, sewing machine, mobile phone, cattle, goats, and chickens), and treatment arm (control or N + WSH) (Supplementary file 1a).
Tables
Table 1
Characteristics of participants.
| N (%) or median (IQR) | |||
|---|---|---|---|
| Child | Female (%) | 417 (51%) | |
| Age (months) at Year 1 | 14.3 (12.6, 15.6) | ||
| Age (months) at Year 2 | 28.2 (26.9, 29.6) | ||
| Months between telomere length measurements at Year 1 and Year 2 | 13.9 (13.5, 14.7) | ||
| Telomere length at Year 1 | T/S ratio* | 1.42 (1.28, 1.56) | |
| Telomere length at Year 2 | T/S ratio* | 1.43 (1.29, 1.58) | |
| Change in telomere length between Year 1 and Year 2 | T/S ratio* | 0.04 (-0.22, 0.25) | |
| Anthropometry (age 3 months, Month 3) | Length-for-age Z score | –1.28 (–1.99, –0.53) | |
| Weight-for-age Z score | –1.18 (–1.84, –0.50) | ||
| Weight-for-length Z score | –0.26 (–1.11, 0.44) | ||
| Head circumference-for-age Z score | –1.73 (–2.39, –1.01) | ||
| Anthropometry (age 14 months, Year 1) | Length-for-age Z score | –1.41 (–2.08, –0.77) | |
| Weight-for-age Z score | –1.30 (–1.98, –0.68) | ||
| Weight-for-length Z score | –0.89 (–1.60, –0.25) | ||
| Head circumference-for-age Z score | –1.81 (–2.40, –1.19) | ||
| Anthropometry (age 28 months, Year 2) | Length-for-age Z score | –1.54 (–2.25, –0.94) | |
| Weight-for-age Z score | –1.55 (–2.09, –0.90) | ||
| Weight-for-length Z score | –1.00 (–1.59,–0.37) | ||
| Head circumference-for-age Z score | –1.78 (–2.37, –1.22) | ||
| Diarrhoea (age 14 months, Year 1) | Caregiver-reported 7 day recall (%) | 104 (14%) | |
| Diarrhoea (age 28 months, Year 2) | Caregiver-reported 7 day recall (%) | 56 (8%) | |
| Mother | Age (years) | 23 (20, 27) | |
| Anthropometry at enrolment | Height (cm) | 150.5 (147.1, 153.9) | |
| Education | Schooling completed (years) | 7 (4, 9) | |
| Depression at Year 1 | CESD-R score** | 10 (6, 16) | |
| Depression at Year 2 | CESD-R score** | 10 (5, 17) | |
| Perceived stress at Year 2 | Perceived Stress Scale score | 14 (10, 18) | |
| Physical, sexual, or emotional intimate partner violence | Any lifetime exposure: number of women (%) | 398 (56%) |
-
*The unit for relative telomere length is the T/S ratio. Telomere length was measured by quantitative PCR (qPCR), a method that determines relative telomere length by measuring the factor by which each DNA sample differs from a reference DNA sample in its ratio of telomere repeat copy number (T) to single-copy gene copy number (S).
-
**CESD-R = Center for Epidemiologic Studies Depression Scale Revised.
-
Table 1—source code 1
Source code for Table 1.
- https://cdn.elifesciences.org/articles/60389/elife-60389-table1-code1-v2.zip
Table 2
Association between telomere length at Year 1 and growth.
| Exposure | Outcome | N | 10th percentile | 90th percentile | Outcome, 90th percentile vs. 10th percentile | |||
|---|---|---|---|---|---|---|---|---|
| Adjusted† | ||||||||
| Predicted outcome at 10th percentile | Predicted outcome at 90th percentile | Coefficient (95% CI) | p-value | |||||
| Telomere length at Year 1 (T/S ratio) | LAZ Year 1 | 638 | 1.2 | 1.7 | –1.54 | –1.31 | 0.23 (0.05, 0.42) | 0.01* |
| WAZ Year 1 | 638 | 1.2 | 1.7 | –1.21 | –1.20 | 0.01 (–0.2, 0.23) | 0.91 | |
| WLZ Year 1 | 636 | 1.2 | 1.7 | –0.68 | –0.83 | –0.16 (-0.36, 0.05) | 0.14 | |
| HCZ Year 1 | 638 | 1.2 | 1.7 | –1.82 | –1.81 | 0.01 (–0.18, 0.2) | 0.94 | |
| LAZ Year 2 | 542 | 1.2 | 1.7 | –1.51 | –1.45 | 0.06 (–0.04, 0.16) | 0.22 | |
| WAZ Year 2 | 565 | 1.2 | 1.7 | –1.77 | –1.70 | 0.07 (–0.03, 0.17) | 0.18 | |
| WLZ Year 2 | 568 | 1.2 | 1.7 | –0.99 | –1.01 | –0.03 (–0.14, 0.09) | 0.68 | |
| HCZ Year 2 | 565 | 1.2 | 1.7 | –1.85 | –1.81 | 0.04 (–0.18, 0.25) | 0.73 | |
| Change in LAZ between Year 1 and Year 2 | 568 | 1.2 | 1.7 | –0.23 | –0.28 | –0.05 (–0.14, 0.04) | 0.29 | |
| Change in WAZ between Year 1 and Year 2 | 572 | 1.2 | 1.7 | –0.37 | –0.38 | 0 (–0.11, 0.1) | 0.94 | |
| Change in WLZ between Year 1 and Year 2 | 565 | 1.2 | 1.7 | –0.24 | –0.20 | 0.04 (–0.09, 0.17) | 0.56 | |
| Change in HCZ between Year 1 and Year 2 | 545 | 1.2 | 1.7 | –0.16 | –0.11 | 0.06 (–0.05, 0.17) | 0.31 | |
| Length velocity between Year 1 and Year 2 | 541 | 1.2 | 1.7 | 0.80 | 0.80 | 0 (–0.02, 0.03) | 0.79 | |
| Weight velocity between Year 1 and Year 2 | 541 | 1.2 | 1.7 | 0.15 | 0.15 | 0 (–0.01, 0.01) | 0.74 | |
| Head circumference velocity between Year 1 and Year 2 | 545 | 1.2 | 1.7 | 0.15 | 0.16 | 0.01 (0, 0.02) | 0.13 | |
-
N, 10th percentile, and 90th percentile are from the adjusted analyses.
-
T/S ratio = unit for relative telomere length; LAZ = length-for-age Z score; WAZ = weight-for-age Z score; WLZ = weight-for-length Z score; HCZ = head circumference-for-age Z score.
-
*
p-value<0.05 after adjusting for multiple comparisons using the Benjamini–Hochberg procedure.
-
†
Adjusted for pre-specified covariates: Child age, child sex, birth order, prior child length, and weight measurements (included in Year 2 outcomes only), time between anthropometry measurements (included in growth velocity and change in growth measurements between Year 1 and Year 2 outcomes only), season of measurement, caregiver-reported diarrhoea, mother’s age, mother’s height, mother’s education level, mother’s Center for Epidemiologic Studies Depression Scale Revised (CESD-R) score, mother’s Perceived Stress Scale score, mother’s lifetime exposure to physical, sexual, and emotional intimate partner violence, household food insecurity, number of children < 18 years in the household, number of individuals living in the compound, distance in minutes to the primary water source, household floor materials, household wall materials, household electricity, and household assets (wardrobe, table, chair, clock, khat, chouki, radio, television, refrigerator, bicycle, motorcycle, sewing machine, mobile phone, cattle, goats, and chickens), and treatment arm (control or N + WSH) (Supplementary file 1a).
Table 3
Association between telomere length at Year 2 and growth.
| Exposure | Outcome | N | 10th percentile | 90th percentile | Outcome, 90th percentile vs. 10th percentile | |||
|---|---|---|---|---|---|---|---|---|
| Adjusted* | ||||||||
| Predicted outcome at 10th percentile | Predicted outcome at 90th percentile | Coefficient (95% CI) | p-value | |||||
| Telomere length at Year 2 (T/S ratio) | LAZ Year 2 | 592 | 1.1 | 1.7 | −1.68 | −1.6 | 0.08 (−0.03, 0.19) | 0.17 |
| WAZ Year 2 | 611 | 1.1 | 1.7 | −1.84 | −1.8 | 0.06 (−0.05, 0.16) | 0.3 | |
| WLZ Year 2 | 615 | 1.1 | 1.7 | −0.98 | −1.1 | −0.08 (−0.2, 0.04) | 0.18 | |
| HCZ Year 2 | 612 | 1.1 | 1.7 | −1.94 | −1.9 | 0 (−0.18, 0.17) | 0.98 | |
-
N, 10th percentile, and 90th percentile are from the adjusted analyses.
-
T/S ratio = unit for relative telomere length; LAZ = length-for-age Z score; WAZ = weight-for-age Z score; WLZ = weight-for-length Z score; HCZ = head circumference-for-age Z score.
-
*
Adjusted for pre-specified covariates: Child age, child sex, birth order, prior child length and weight measurements from Year 1, season of measurement, caregiver-reported diarrhoea, mother’s age, mother’s height, mother’s education level, mother’s Center for Epidemiologic Studies Depression Scale Revised (CESD-R) score, mother’s Perceived Stress Scale score, mother’s lifetime exposure to physical, sexual, and emotional intimate partner violence, household food insecurity, number of children <18 years in the household, number of individuals living in the compound, distance in minutes to the primary water source, household floor materials, household wall materials, household electricity, and household assets (wardrobe, table, chair, clock, khat, chouki, radio, television, refrigerator, bicycle, motorcycle, sewing machine, mobile phone, cattle, goats, and chickens), and treatment arm (control or N + WSH) (Supplementary file 1a).
Table 4
Association between change in telomere length and growth.
| Exposure | Outcome | N | 10th percentile | 90th percentile | Outcome, 90th percentile vs. 10th percentile | |||
|---|---|---|---|---|---|---|---|---|
| Adjusted* | ||||||||
| Predicted outcome at 10th percentile | Predicted outcome at 90th percentile | Coefficient (95% CI) | p-value | |||||
| Change in telomere length between Year 1 and Year 2 (T/S ratio) | LAZ Year 2 | 523 | −0.43 | 0.44 | −1.47 | −1.50 | −0.03 (−0.13, 0.07) | 0.62 |
| WAZ Year 2 | 541 | −0.43 | 0.44 | −1.72 | −1.76 | −0.03 (−0.13, 0.07) | 0.53 | |
| WLZ Year 2 | 545 | −0.43 | 0.44 | −0.98 | −1.05 | −0.07 (−0.18, 0.04) | 0.24 | |
| HCZ Year 2 | 543 | −0.43 | 0.44 | −1.83 | −1.90 | −0.08 (−0.24, 0.09) | 0.36 | |
| Change in LAZ between Year 1 and Year 2 | 545 | −0.43 | 0.44 | −0.23 | −0.23 | 0 (−0.09, 0.08) | 1 | |
| Change in WAZ between Year 1 and Year 2 | 547 | −0.43 | 0.44 | −0.36 | −0.40 | −0.04 (−0.13, 0.05) | 0.36 | |
| Change in WLZ between Year 1 and Year 2 | 543 | −0.43 | 0.44 | −0.23 | −0.27 | −0.04 (−0.16, 0.08) | 0.53 | |
| Change in HCZ between Year 1 and Year 2 | 525 | −0.43 | 0.44 | −0.14 | −0.19 | −0.05 (−0.15, 0.06) | 0.39 | |
| Length velocity between Year 1 and Year 2 | 522 | −0.43 | 0.44 | 0.84 | 0.82 | −0.01 (−0.03, 0.01) | 0.29 | |
| Weight velocity between Year 1 and Year 2 | 522 | −0.43 | 0.44 | 0.15 | 0.15 | 0 (−0.01, 0.01) | 0.48 | |
| Head circumference velocity between Year 1 and Year 2 | 525 | −0.43 | 0.44 | 0.16 | 0.15 | −0.01 (−0.02, 0.01) | 0.35 | |
-
N, 10th percentile, and 90th percentile are from the adjusted analyses.
-
T/S ratio = unit for relative telomere length; LAZ = length-for-age Z score; WAZ = weight-for-age Z score; WLZ = weight-for-length Z score; HCZ = head circumference-for-age Z score.
-
*
Adjusted for pre-specified covariates: Child age, child sex, birth order, prior child length and weight measurements from Year 1 (included in Year 2 outcomes only), season of measurement, time between anthropometry measurements (included in growth velocity and change in growth measurements between Year 1 and Year 2 outcomes only), caregiver-reported diarrhoea, mother’s age, mother’s height, mother’s education level, mother’s Center for Epidemiologic Studies Depression Scale Revised (CESD-R) score, mother’s Perceived Stress Scale score, mother’s lifetime exposure to physical, sexual, and emotional intimate partner violence, household food insecurity, number of children <18 years in the household, number of individuals living in the compound, distance in minutes to the primary water source, household floor materials, household wall materials, household electricity, and household assets (wardrobe, table, chair, clock, khat, chouki, radio, television, refrigerator, bicycle, motorcycle, sewing machine, mobile phone, cattle, goats, and chickens), and treatment arm (control or N + WSH) (Supplementary file 1a).
Author response table 1
Twin Sensitivity Analysis: Association Between Telomere Length at Year 1 and Growth.
| Exposure | Outcome | N | 10th Percentile | 90th Percentile | Outcome, 90th Percentile v. 10th Percentile | |||
|---|---|---|---|---|---|---|---|---|
| Adjusted | ||||||||
| Predicted Outcome at 10th Percentile | Predicted Outcome at 90th Percentile | Coefficient (95% CI) | P-value | |||||
| Telomere length at Year 1 | LAZ Year 1 | 635 | 1.2 | 1.7 | -1.52 | -1.32 | 0.2 (0.02, 0.37) | 0.03* |
| WAZ Year 1 | 634 | 1.2 | 1.7 | -1.18 | -1.20 | -0.02 (-0.22, 0.19) | 0.89 | |
| WLZ Year 1 | 633 | 1.2 | 1.7 | -0.66 | -0.83 | -0.17 (-0.37, 0.03) | 0.10 | |
| HCZ Year 1 | 635 | 1.2 | 1.7 | -1.72 | -1.73 | -0.01 (-0.2, 0.18) | 0.92 | |
| LAZ Year 2 | 540 | 1.2 | 1.7 | -1.50 | -1.44 | 0.06 (-0.04, 0.16) | 0.21 | |
| WAZ Year 2 | 540 | 1.2 | 1.7 | -1.74 | -1.69 | 0.05 (-0.05, 0.16) | 0.35 | |
| WLZ Year 2 | 566 | 1.2 | 1.7 | -0.97 | -1.00 | -0.03 (-0.15, 0.08) | 0.58 | |
| HCZ Year 2 | 563 | 1.2 | 1.7 | -1.87 | -1.82 | 0.04 (-0.13, 0.21) | 0.65 | |
| Change in LAZ between Year 1 and Year 2 | 566 | 1.2 | 1.7 | -0.24 | -0.29 | -0.05 (-0.14, 0.05) | 0.35 | |
| Change in WAZ between Year 1 and Year 2 | 570 | 1.2 | 1.7 | -0.37 | -0.38 | -0.01 (-0.11, 0.09) | 0.87 | |
| Change in WLZ between Year 1 and Year 2 | 563 | 1.2 | 1.7 | -0.25 | -0.22 | 0.03 (-0.1, 0.17) | 0.66 | |
| Change in HCZ between Year 1 and Year 2 | 543 | 1.2 | 1.7 | -0.16 | -0.11 | 0.06 (-0.05, 0.17) | 0.32 | |
| Length velocity between Year 1 and Year 2 | 539 | 1.2 | 1.7 | 0.80 | 0.80 | 0 (-0.02, 0.03) | 0.76 | |
| Weight velocity between Year 1 and Year 2 | 539 | 1.2 | 1.7 | 0.15 | 0.15 | 0 (-0.01, 0.01) | 0.84 | |
| Head circumference velocity between Year 1 and Year 2 | 543 | 1.2 | 1.7 | 0.15 | 0.16 | 0.01 (0, 0.02) | 0.14 |
-
N, 10th Percentile, and 90th Percentile are from the adjusted analyses.
-
P-value < 0.05 after adjusting for multiple comparisons using the Benjamini-Hochberg procedure.
Additional files
-
Supplementary file 1
Supplementary tables.
(a) Pre-specified covariates screened for inclusion in fully adjusted models. (b) Association Between Telomere Length at Year 1 and Growth. (c) Association Between Telomere Length at Year 2 and Growth. (d) Association Between Change in Telomere Length and Growth. (e) Post-hoc Analyses: Association Between Growth at Month 3 and Subsequent Telomere Length. (f) Post-hoc Analyses: Association Between Growth at Year 1 and Subsequent Telomere Length. (g) Post-hoc Analyses: Association Between Change in Growth and Telomere Length. (h) Post-hoc Analyses: Association Between Growth Velocity and Telomere Length.
- https://cdn.elifesciences.org/articles/60389/elife-60389-supp1-v2.docx
-
Transparent reporting form
- https://cdn.elifesciences.org/articles/60389/elife-60389-transrepform1-v2.docx
-
Source code 1
- https://cdn.elifesciences.org/articles/60389/elife-60389-supp2-v2.zip
-
Source code 2
Source code for Supplementary file 1e–1h.
- https://cdn.elifesciences.org/articles/60389/elife-60389-supp3-v2.zip
-
Source data 1
Source data for Supplementary file 1e–1h.
- https://cdn.elifesciences.org/articles/60389/elife-60389-supp4-v2.zip
-
Source data 2
- https://cdn.elifesciences.org/articles/60389/elife-60389-supp5-v2.zip
Download links
A two-part list of links to download the article, or parts of the article, in various formats.
Downloads (link to download the article as PDF)
Open citations (links to open the citations from this article in various online reference manager services)
Cite this article (links to download the citations from this article in formats compatible with various reference manager tools)
Telomere length is associated with growth in children in rural Bangladesh
eLife 10:e60389.
https://doi.org/10.7554/eLife.60389


