IFN-γ mediates Paneth cell death via suppression of mTOR
- Center for Vaccine Biology and Immunology, Department of Microbiology and Immunology, University of Rochester Medical Center, United States
- Department of Medicine and Department of Biomedical Sciences, Cedars-Sinai Medical Center, United States
- Cancer Prevention and Control Program, Fox Chase Cancer Center, United States
Figures
Figure 1 with 1 supplement

IFN-γ directly contributes to Paneth cell loss during Toxoplasma gondii infection.
(a) qRT-PCR analysis of relative Lyz1, Defa23, and Defa24 expression measured in the small intestines of WT, E-Ifngr2 KO, and PC- Ifngr2 KO infected orally with 20 cysts per mouse of the ME49 T. gondii on day 7 after infection (n=6) or uninfected controls (n=6). The results are representative of three independent experiments. (b) Histological visualization of Paneth cells in the small intestines of naïve and infected WT, E- ifngr2 KO, and PC- ifngr2 KO mice. (c) Quantification of Paneth cells per crypt in naïve and infected WT, E- Ifngr2 KO, and PC- Ifngr2 KO mice with 20 cysts of ME49 T. gondii on day 7. Error bars=mean±s.d. (d). Immunofluorescence of intestinal crypts of naive and T. gondii-infected WT, E- Ifngr2 KO, and PC- Ifngr2 KO for Paneth cells (UEA, green), Lyz1 (red), and nucleic acid (DAPI, blue). Scale bar: 50 μm. The results are representative of three independent experiments. (e) Immunofluorescence images of intestinal crypts of naïve or T. gondii-infected WT, E- Ifngr2 KO, and PC- Ifngr2 KO mice treated intravenously with propidium iodide (PI) on day 6 post infection. Arrows show individual PI+ puncta. The results are representative of four independent experiments each containing at least three mice per group. Scale bar: 50 μm. (f) Average numbers of PI+ puncta per crypt. Histological sections shown were selected by blinded observation. The results are representative of four independent experiments, PI (pink), Lyz1 (green), and DAPI (blue). Error bars=mean±s.d.
-
Figure 1—source data 1
Analysis of Paneth cells in the small intestines of WT, E-Ifngr2 KO, and PC- Ifngr2 KO infected orally with Toxoplasma gondii.
Figure 1A: qRT-PCR analysis of relative Lyz1, Defa23, and Defa24 expression measured in the small intestines of WT, E-Ifngr2 KO, and PC- Ifngr2 KO infected orally with 20 cysts per mouse of the ME49 T. gondii on day 7 after infection. Figure 1C: Quantification of Paneth cells per crypt in naïve and infected WT, E- Ifngr2 KO, and PC- Ifngr2 KO mice with 20 cysts of ME49 T. gondii on day 7. Figure 1F: numbers of PI+ puncta per crypt in the small intestines of WT, E-Ifngr2 KO, and PC- Ifngr2 KO infected orally with 20 cysts per mouse of the ME49 T. gondii on day 7 after infection.
- https://cdn.elifesciences.org/articles/60478/elife-60478-fig1-data1-v2.xlsx
Figure 1—figure supplement 1
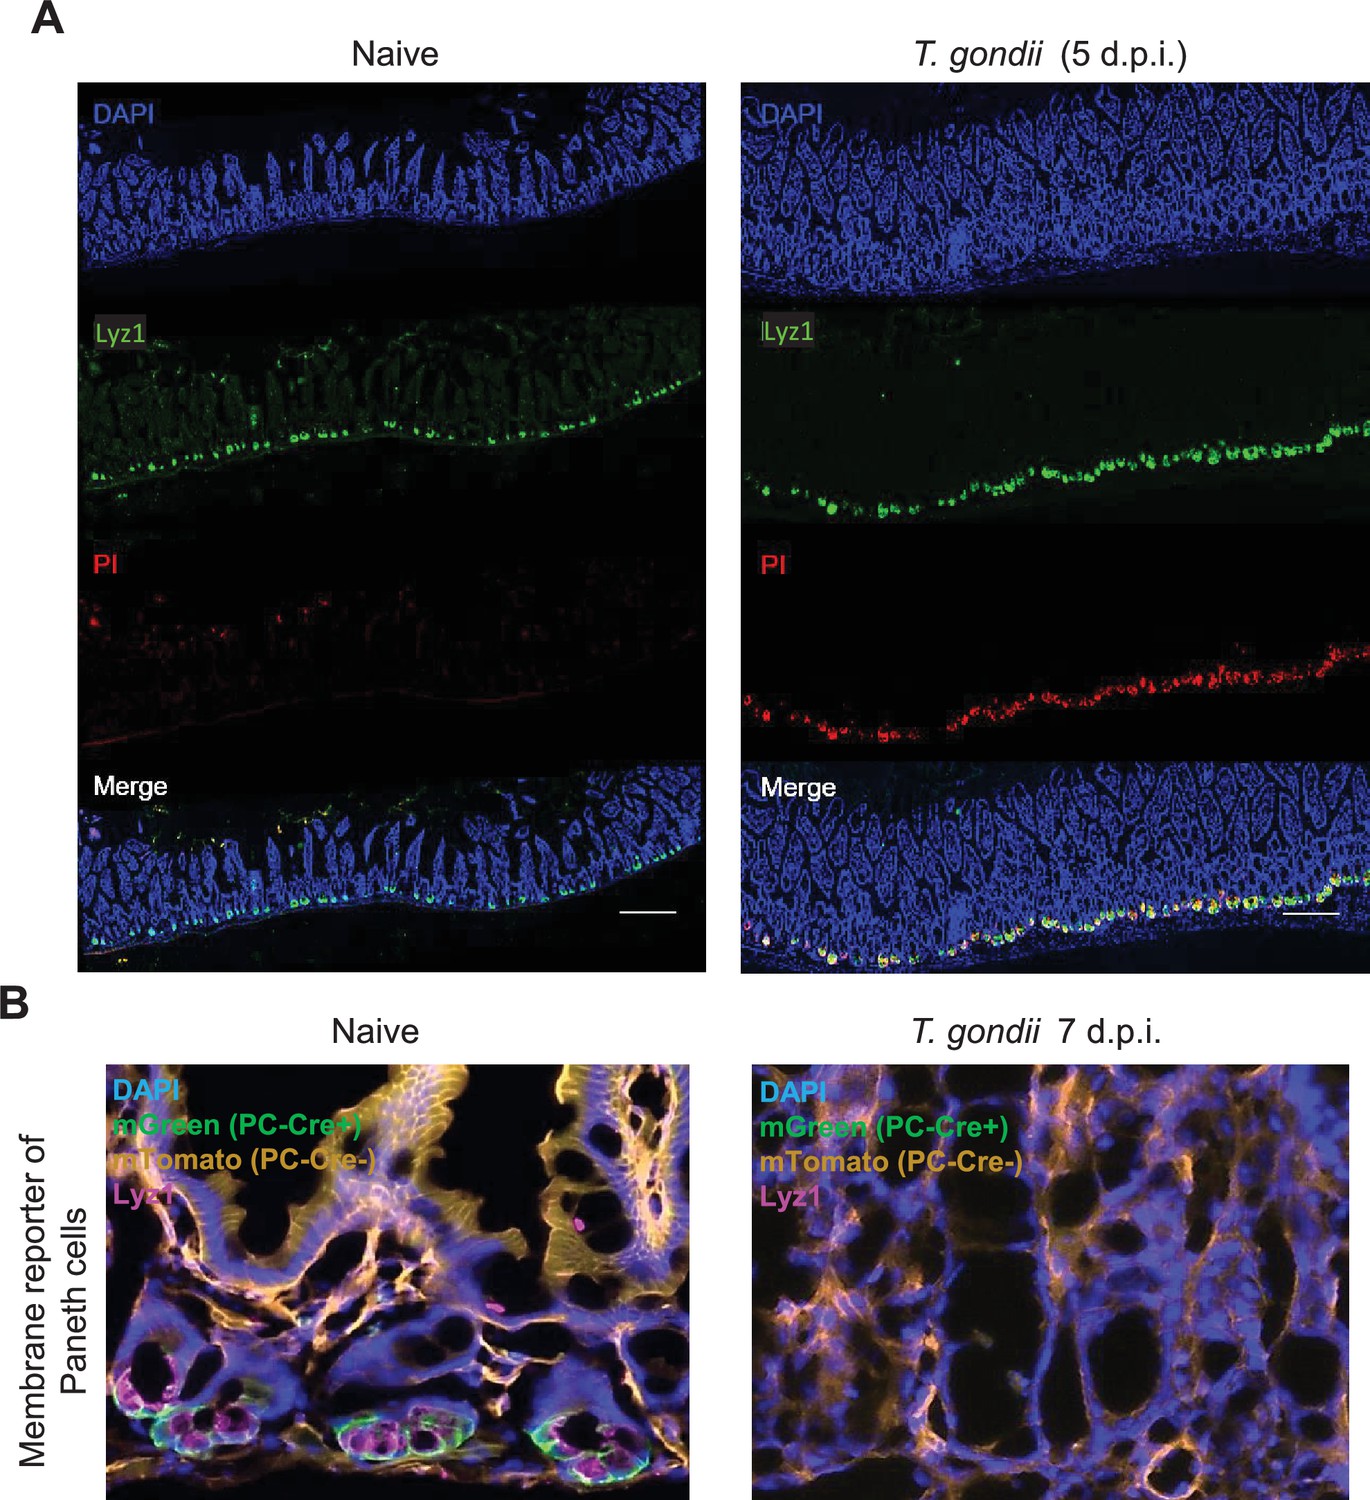
Visualization of Paneth cell death during Toxoplasma gondii infection in vivo.
(a) Immunofluorescence images of mouse small intestine on day 6 post infection with T. gondii stained in vivo with propidium iodide (PI, red). Paneth cells were detected with anti-Lyz1 staining (green). The results are representative of three independent experiments. Scale bar: 300 μM. (b) Immunofluorescence images of naive and T. gondii-infected PC-Cre × mTmG PC-Cre reporter mice on day 7 post infection. Lyz1 staining (pink) identified Paneth cells. The results shown are representative of three separate experiments each involving 3–4 mice per experimental group.
Figure 2 with 2 supplements

IFN-γ triggers Paneth cells death independently of apoptosis.
Immunofluorescence images of crypts of WT mice on days 3, 5, and 7 post Toxoplasma gondii infection. Images were stained with UEA (green), DAPI (blue), and (a) Cleaved Caspase 3 (pink) or (b) TUNEL. Scale bar: 50 μm. The results are representative of three independent experiments, involving at least three mice per group. WT, wild-type.
Figure 2—figure supplement 1
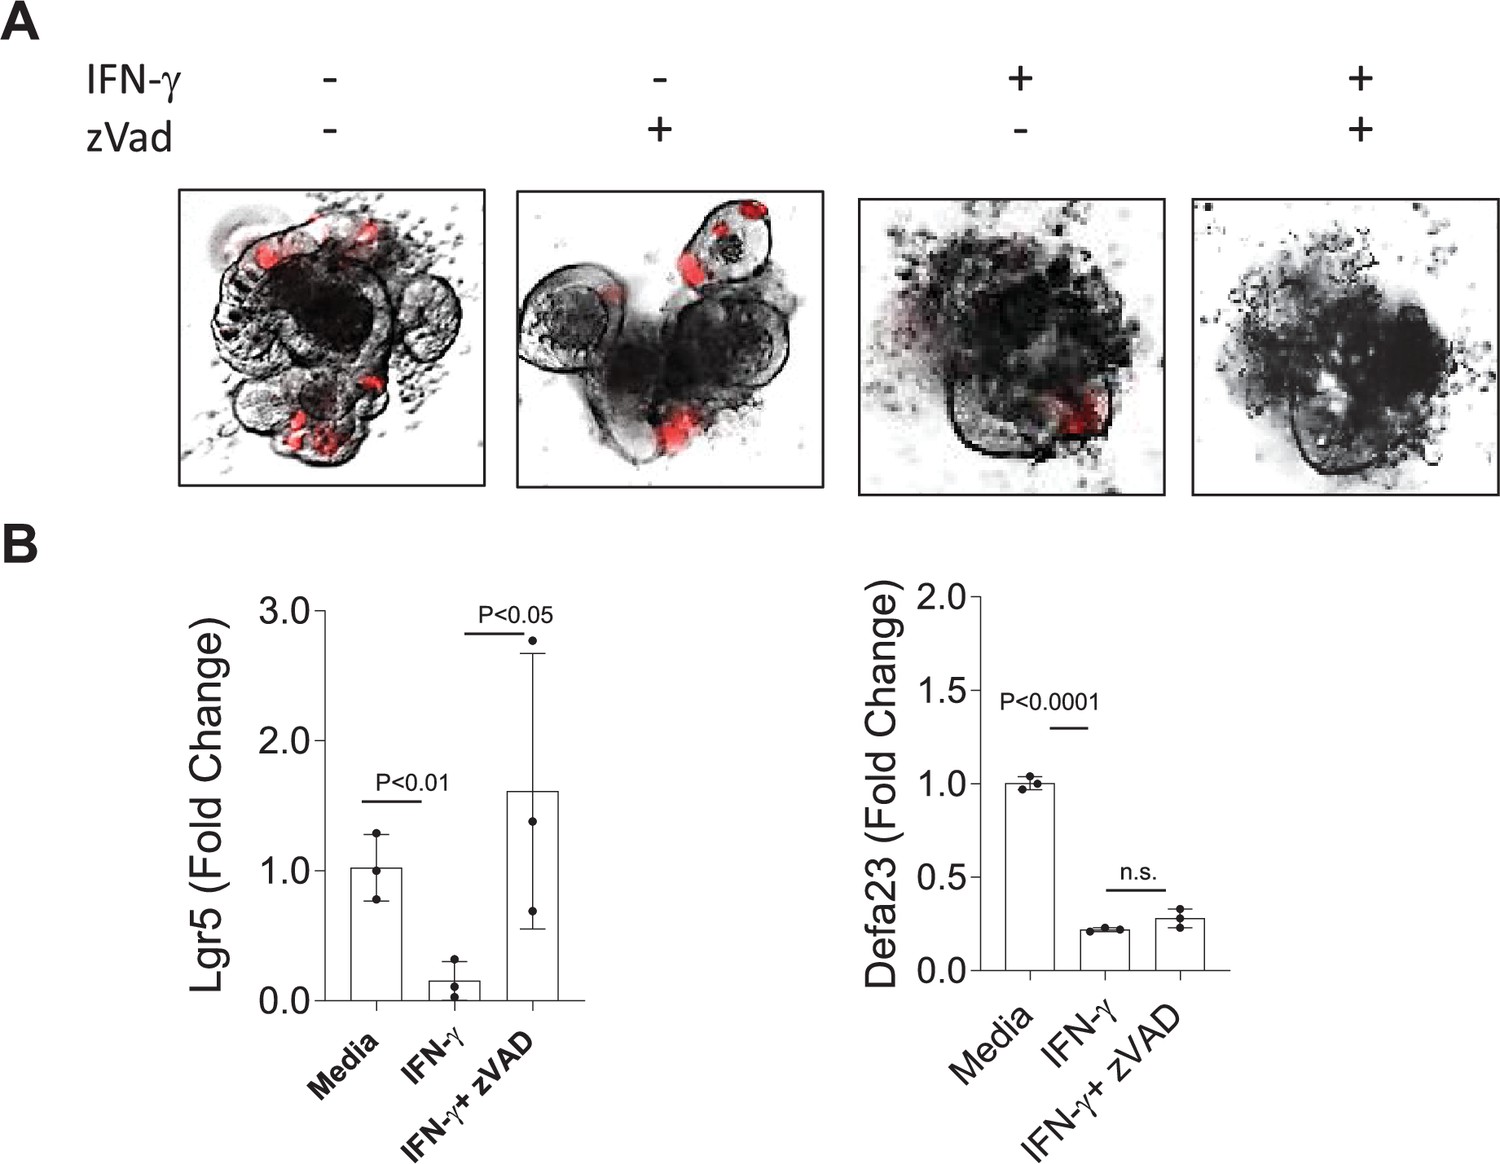
IFN-γ triggers Paneth cells death independently of apoptosis in vitro.
(a) Intestinal organoids were generated from small intestinal stem cells isolated from crypts of PC-Cre × TdTomato reporter mice and stimulated with IFN-γ (200 ng/ml) alone or in the presence of zVAD (50 uM). Paneth cells (red) were analyzed 24 hr later. The images shown are representative of 30 organoids imaged across three technical replicate wells per condition. (b) Intestinal organoids were stimulated with IFN-γ alone or in the presence of zVAD. The stem cells (Lgr5) or Paneth cells (Defa23) specific transcripts were analyzed by RT-PCR. The results shown are representative of three separate experiments with three technical replicates per condition.
Figure 2—figure supplement 2
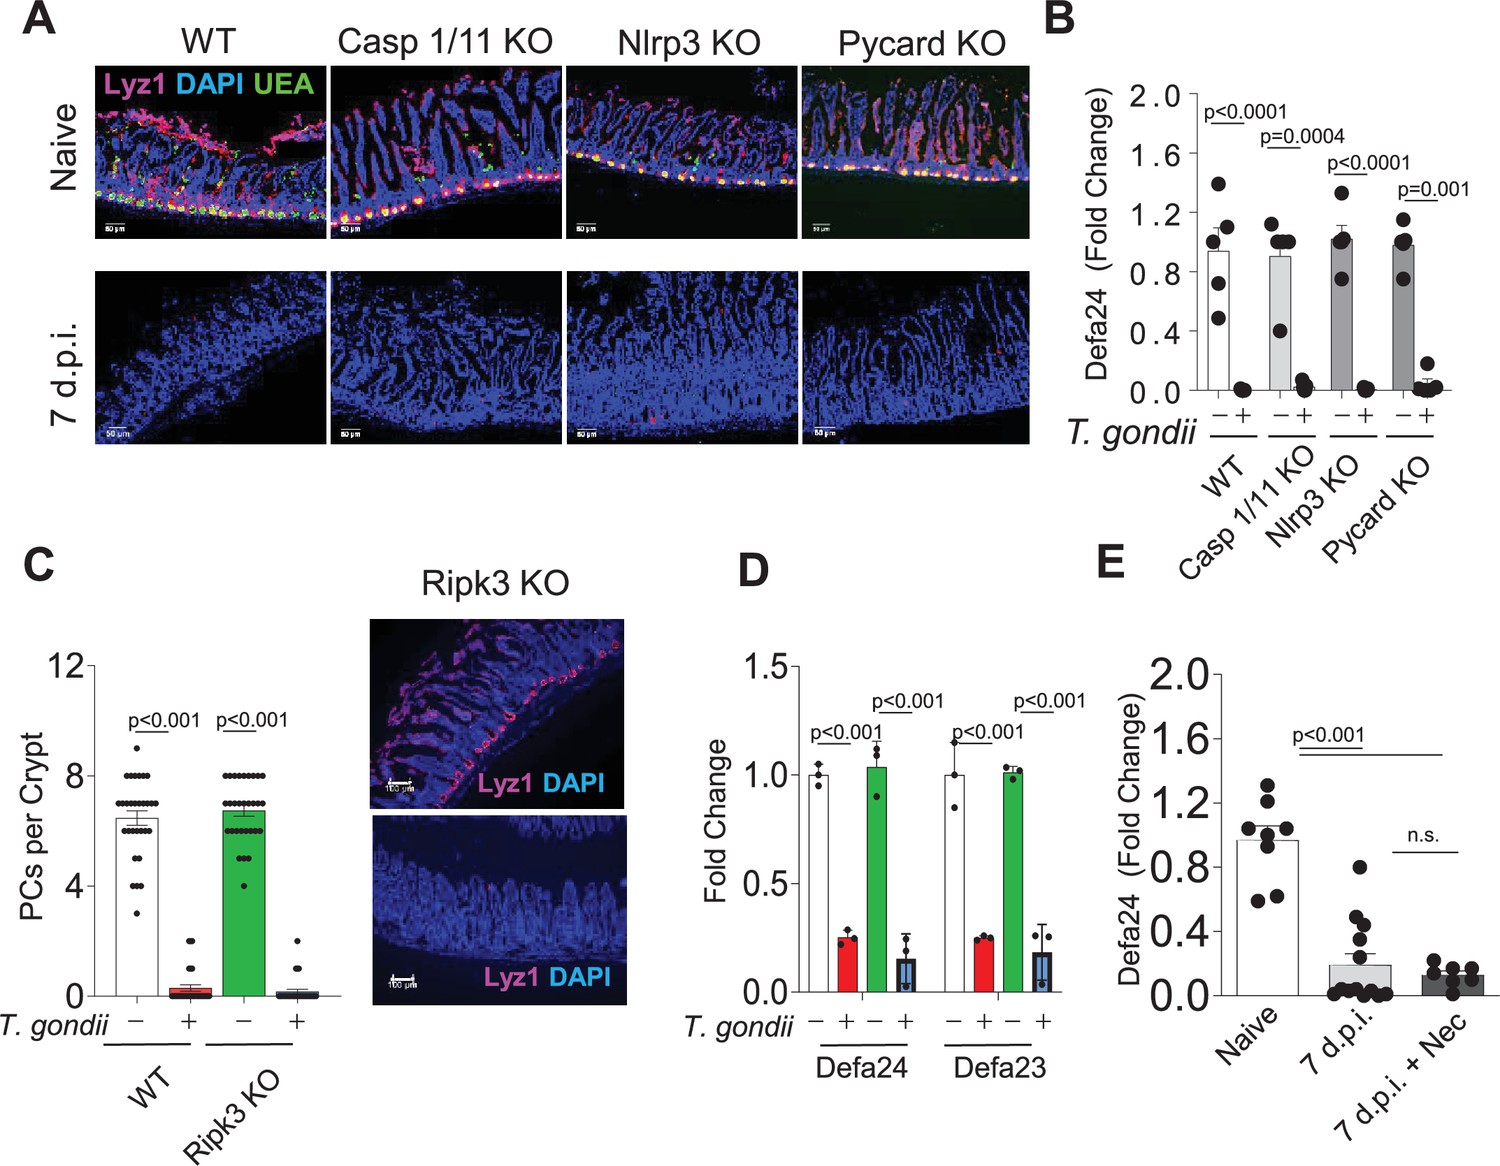
IFN-γ-mediated Paneth cell loss occurs independently of pyroptosis or necroptosis.
(a) Immunofluorescence images of intestinal crypts in naïve and Toxoplasma gondii-infected (day 7 post infection) WT, Casp1/11−/−, Nlrp3−/−, and Pycard−/− mice stained with UEA (green), Lyz1 (pink), and DAPI (blue). The results shown are representative of three separate experiments. Scale bar: 50 μm. (b) qRT-PCR analysis for the relative Defa24 expression in naïve and T. gondii-infected WT, Casp1/11−/−, Nlrp3−/−, and Pycard−/− mice on day 7 post infection. The results are representative of three independent experiments, each involving at least three mice per group. Error bars=mean±s.d. (c) Quantification of Paneth cells per crypt in naïve and infected WT and Ripk3−/− mice, and immunofluorescence images of intestinal crypts of WT and Ripk3−/− mice infected with 20 Me49 T. gondii cysts on day 7 post infection. Sections were stained as in (a) Lyz1 (pink) and DAPI (blue). Scale bar: 50 μm. (d) qRT-PCR analysis for the relative expression of Defa23 and Defa24 in small intestines of naïve or T. gondii-infected WT and Ripk3−/− mice. Error bars=mean±s.d. (e) qRT-PCR analysis for relative Defa24 expression in naive or T. gondii-infected mice (day 7 post infection) additionally daily treated with Necrostatin (nec). Error bars=mean±s.d.
Figure 3 with 1 supplement
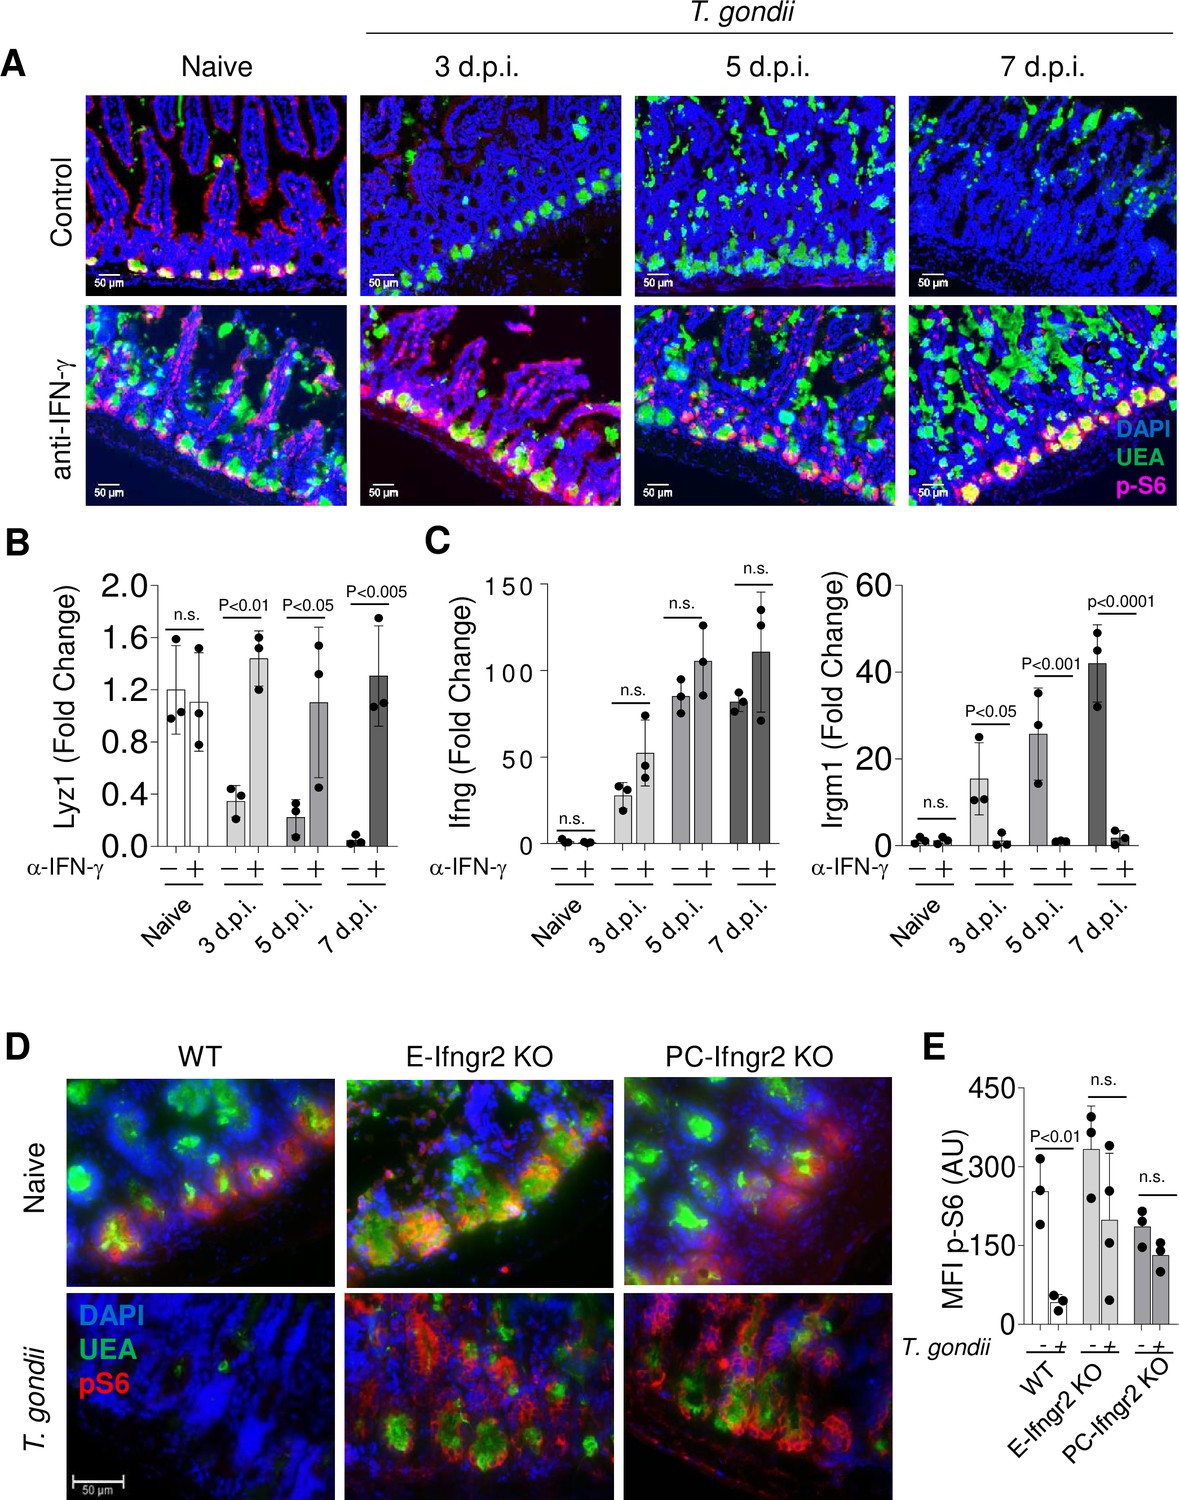
Toxoplasma gondii infection leads to IFN-γ-mediated inhibition of mTORC1 activity in Paneth cells.
(a) Immunofluorescence images of small intestinal crypts from naïve, T. gondii-infected and T. gondii-infected mice treated with anti-IFN-γantibody on days 3, 5, and 7 post oral infection with T. gondii. UEA-positive (green) Paneth cells in crypts were analyzed for p-S6 (p-Ser 240/244, pink) expression and additionally stained with DAPI (blue). Scale bar: 50 μm. (b, c) qRT-PCR analysis for the relative Lyz1 (b), IFN-γ, and Irgm1 (c) expression in small intestines of naïve and T. gondii-infected mice on days 3, 5, and 7 post infection. Some mice were additionally treated with IFN-γneutralizing antibody (α-IFN-g+). The results are representative of three independent experiments, involving three mice per group. Error bars=mean±s.d. (d) Immunofluorescence images of small intestinal crypts of naïve and T. gondii-infected WT, E-Ifngr2 KO, and PC-Ifngr2 KO mice on day 7 post oral infection with T. gondii. UEA positive (green) Paneth cells were stained for p-S6 (p-Ser 240/244, pink), and DAPI (blue). Scale bar: 50 μm. (e) Mean fluorescent intensity (MFI) of p-Ser 240/244 channel in individual intestinal sections of T. gondii-infected WT, E-ifngr2 KO, and PC-ifngr2 KO mice on day 7 post infection. Error bars=mean±s.d.
-
Figure 3—source data 1
Toxoplasma gondii infection leads to IFN-γ-mediated inhibition of mTORC1 activity in Paneth cells.
Figure 3B qRT-PCR analysis for the relative Lyz1 expression in small intestines of naïve and T. gondii-infected mice on days 3, 5, and 7 post infection. Figure 3C: qRT-PCR analysis for the relative IFN-γ and Irgm1 expression in small intestines of naïve and T. gondii-infected mice on days 3, 5, and 7 post infection. Figure 3E Mean fluorescent intensity of p-Ser 240/244 channel in individual intestinal sections of T. gondii-infected WT, E-ifngr2 KO, and PC-ifngr2 KO mice on day 7 post infection.
- https://cdn.elifesciences.org/articles/60478/elife-60478-fig3-data1-v2.xlsx
Figure 3—figure supplement 1
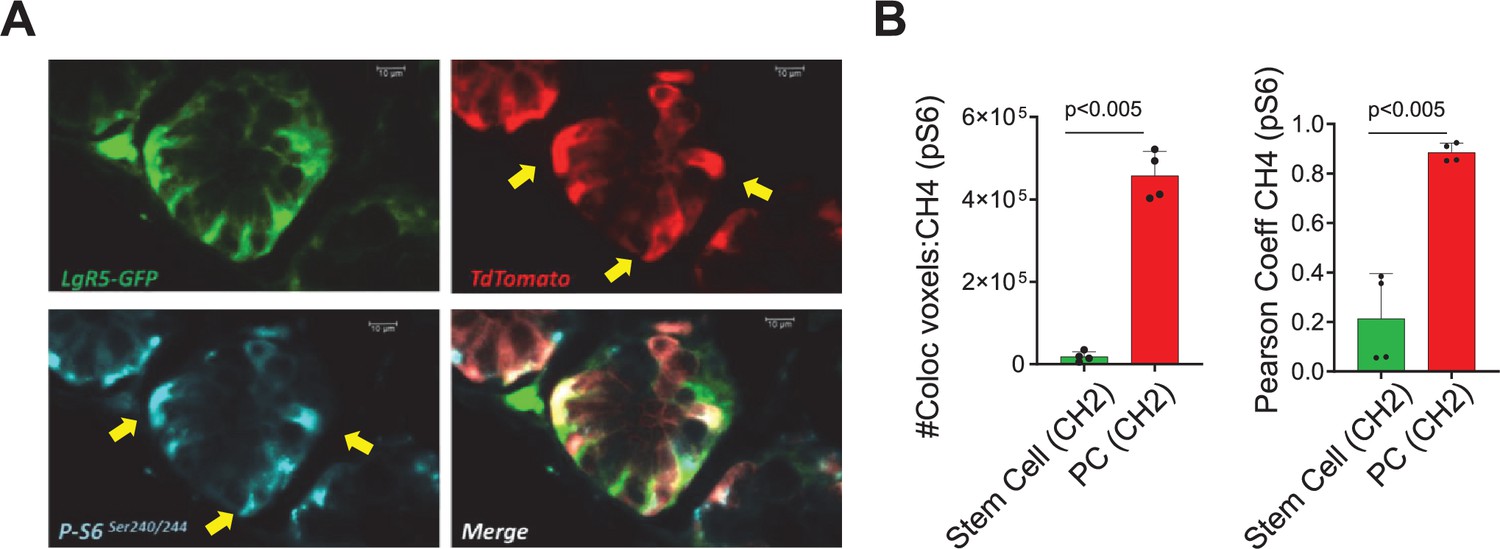
mTOR activity in Paneth cells and intestinal stem cells in vivo.
(a) Confocal immunofluorescence images of intestinal crypts prepared from the PC-Cre x TdTomato x Lgr5-GFP double reporter mice. Stem cells are green (Lgr5+), Paneth cells are red (TdTomato+) and mTOR activity was measured indirectly by the analysis of pS6Ser 240/244 (cyan). Images were taken at 40× magnification and the (b) co-localization analysis was performed by Imaris with channel auto-thresholding. Scale bar=100 mm. Error bars=mean±s.d.
Figure 4
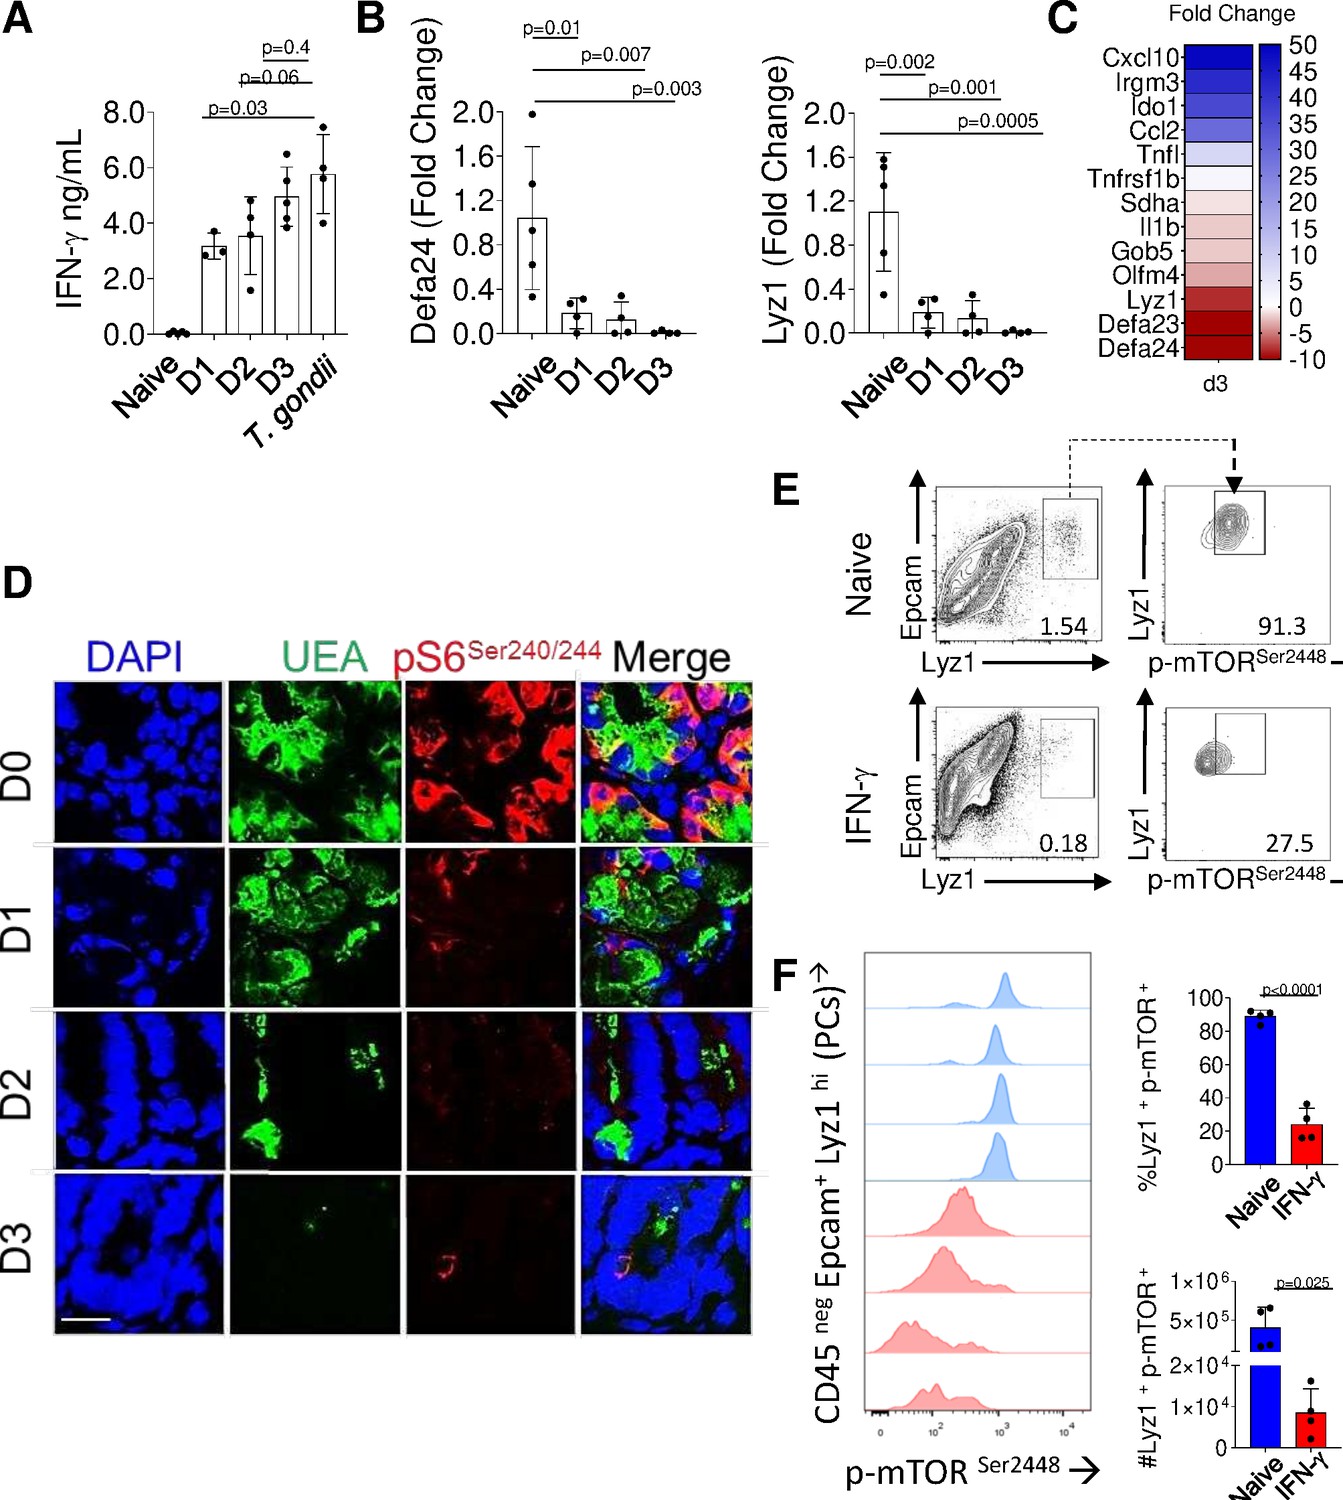
IFN-γ is sufficient for inhibition of mTORC1 activity in Paneth cells.
(a) Mice were treated with recombinant IFN-γ for 24 hr (D1), 48 hr (D2), and 72 hr (D3), and the serum levels of the cytokine were analyzed by ELISA in comparison to Toxoplasma gondii-infected mice (day 7post infection). (b) qRT-PCR analysis for the relative Defa24 and Lyz1 expression in small intestines of mice treated with recombinant IFN-γ. The results are representative of three independent experiments, each involving at least three mice per group. Error bars=mean±s.d. (c) Relative expression of IFN-γ stimulated genes in the small intestines of mice treated with recombinant IFN-γfor 72 hr was analyzed by qRT-PCR. (d) Confocal images showing gradual loss of p-S6 Ser240/244 (red) in crypts of mice untreated or treated with recombinant IFN-γfor 24 hr (D1), 48 hr (D2), and 72 hr (D3). DAPI (blue) and UEA (green) staining were used to detect Paneth cells. (e) Flow cytometric analysis of phosphorylated mTOR kinase (Ser2448) in Paneth cells (CD45 neg, Lyz1+ Epcam+) from control or mice treated with recombinant IFN-γ for 72 hr. (f) The frequency and absolute numbers of mTOR+ Paneth cells in control (blue histograms and bars) and IFN-γ treated (red histograms and bars) mice. The results are representative of four independent experiments each containing four mice per experimental group. Error bars=mean± s.d.
-
Figure 4—source data 1
IFN-γ is sufficient for inhibition of mTORC1 activity in Paneth cells.
Figure 4A: the serum levels of IFN-γ were analyzed by ELISA in comparison to Toxoplasma gondii-infected mice on day 7 post infection. Figure 4B qRT-PCR analysis for the relative Defa24 and Lyz1 expression in small intestines of mice treated with recombinant IFN-γ. Figure 4F: The frequency and absolute numbers of mTOR+ Paneth cells in control and IFN-γ treated mice.
- https://cdn.elifesciences.org/articles/60478/elife-60478-fig4-data1-v2.xlsx
Figure 5 with 1 supplement
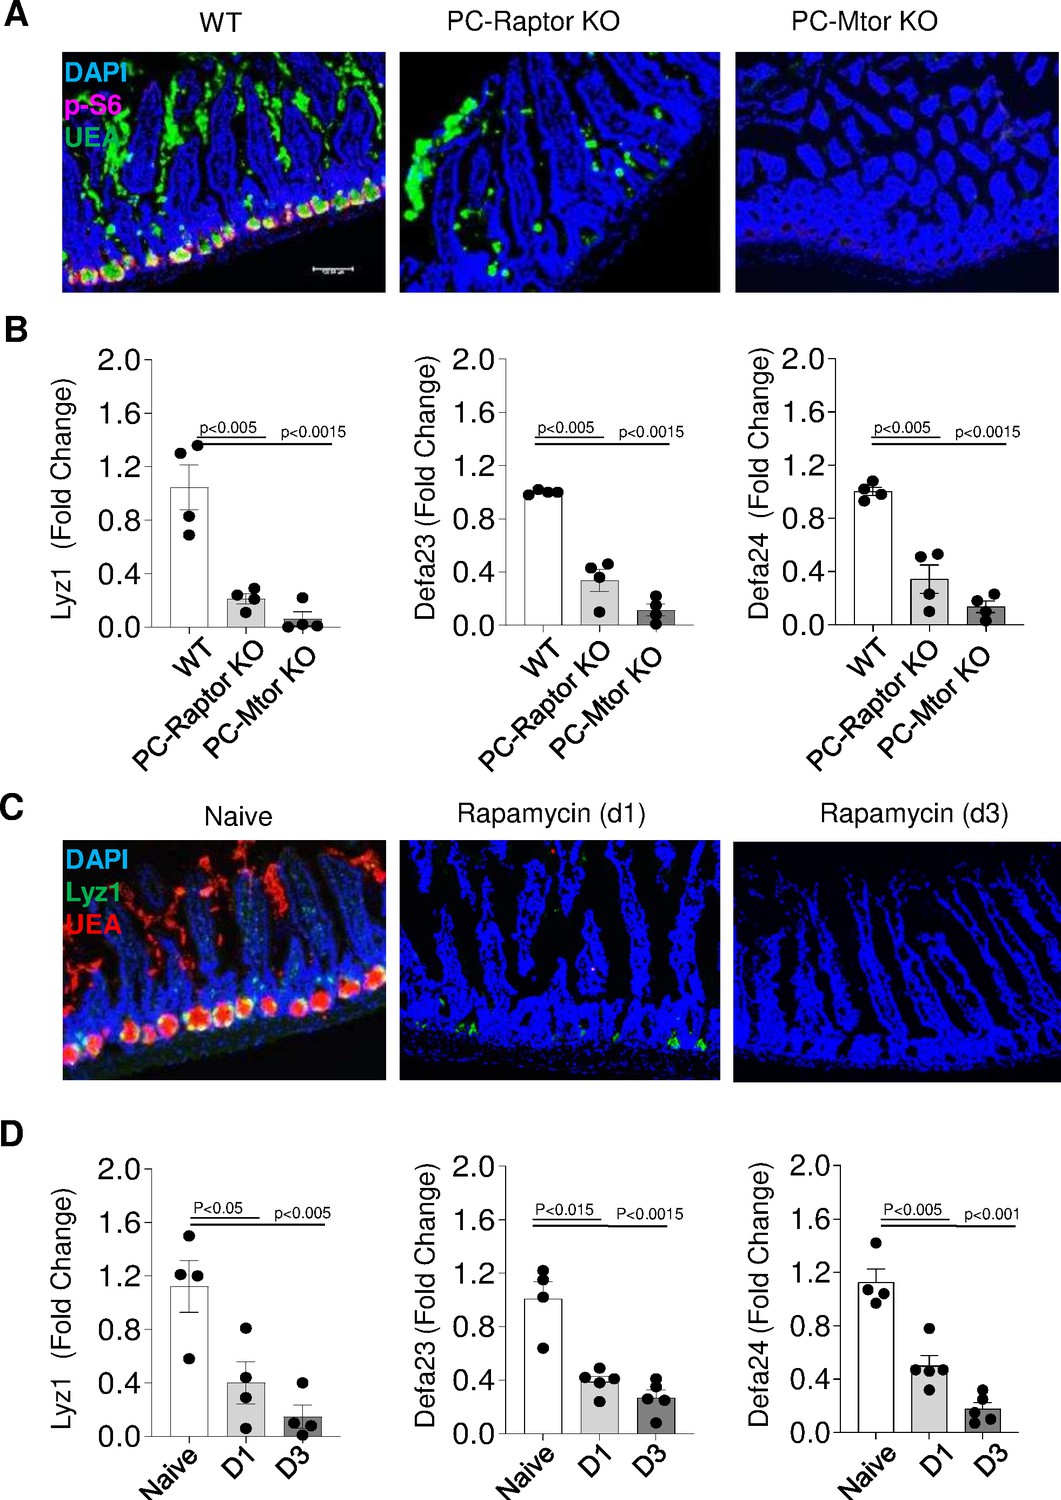
Paneth cells require intrinsic mTORC1 signaling.
(a) Immunofluorescence images of small intestinal crypts of WT mice and mice lacking the mTOR regulatory protein Raptor (PC-Raptor) or mTOR kinase (PC-Mtor) in Paneth cells that were detected by UEA staining (green) and additionally stained with anti-p-S6 antibody (red). DAPI (blue) was used for counterstaining. Scale bars=100 μM. (b) qRT-PCR analysis of Lyz1, Defa23, and Defa24 relative expression in the small intestines of WT mice and mice lacking Raptor or mTOR in Paneth cells. Error bars=mean±s.d. (c) Immunofluorescence images of small intestinal crypts in WT mice treated with rapamycin daily for 24 hr (D1) or 72 hr (D3). Paneth cells were detected by staining for Lyz1 (green), UEA (red), and DAPI (blue). (d) qRT-PCR analysis for relative Lyz1, Defa23,and Defa24 expression in the small intestines in WT mice treated with rapamycin daily for 24 hr (D1) or 72 hr (D3). Error bars=mean±s.d. The results are representative of three independent experiments. WT, wild-type.
-
Figure 5—source data 1
Paneth cells require intrinsic mTORC1 signaling.
Figure 5B qRT-PCR analysis of Lyz1, Defa23, and Defa24 relative expression in the small intestines of WT mice and mice lacking Raptor or mTOR in Paneth cells. Figure 5D qRT-PCR analysis for relative Lyz1, Defa23, and Defa24 expression in the small intestines in WT mice treated with rapamycin daily for 24 hr (D1) or 72 hr (D3). WT, wild-type.
- https://cdn.elifesciences.org/articles/60478/elife-60478-fig5-data1-v2.xlsx
Figure 5—figure supplement 1
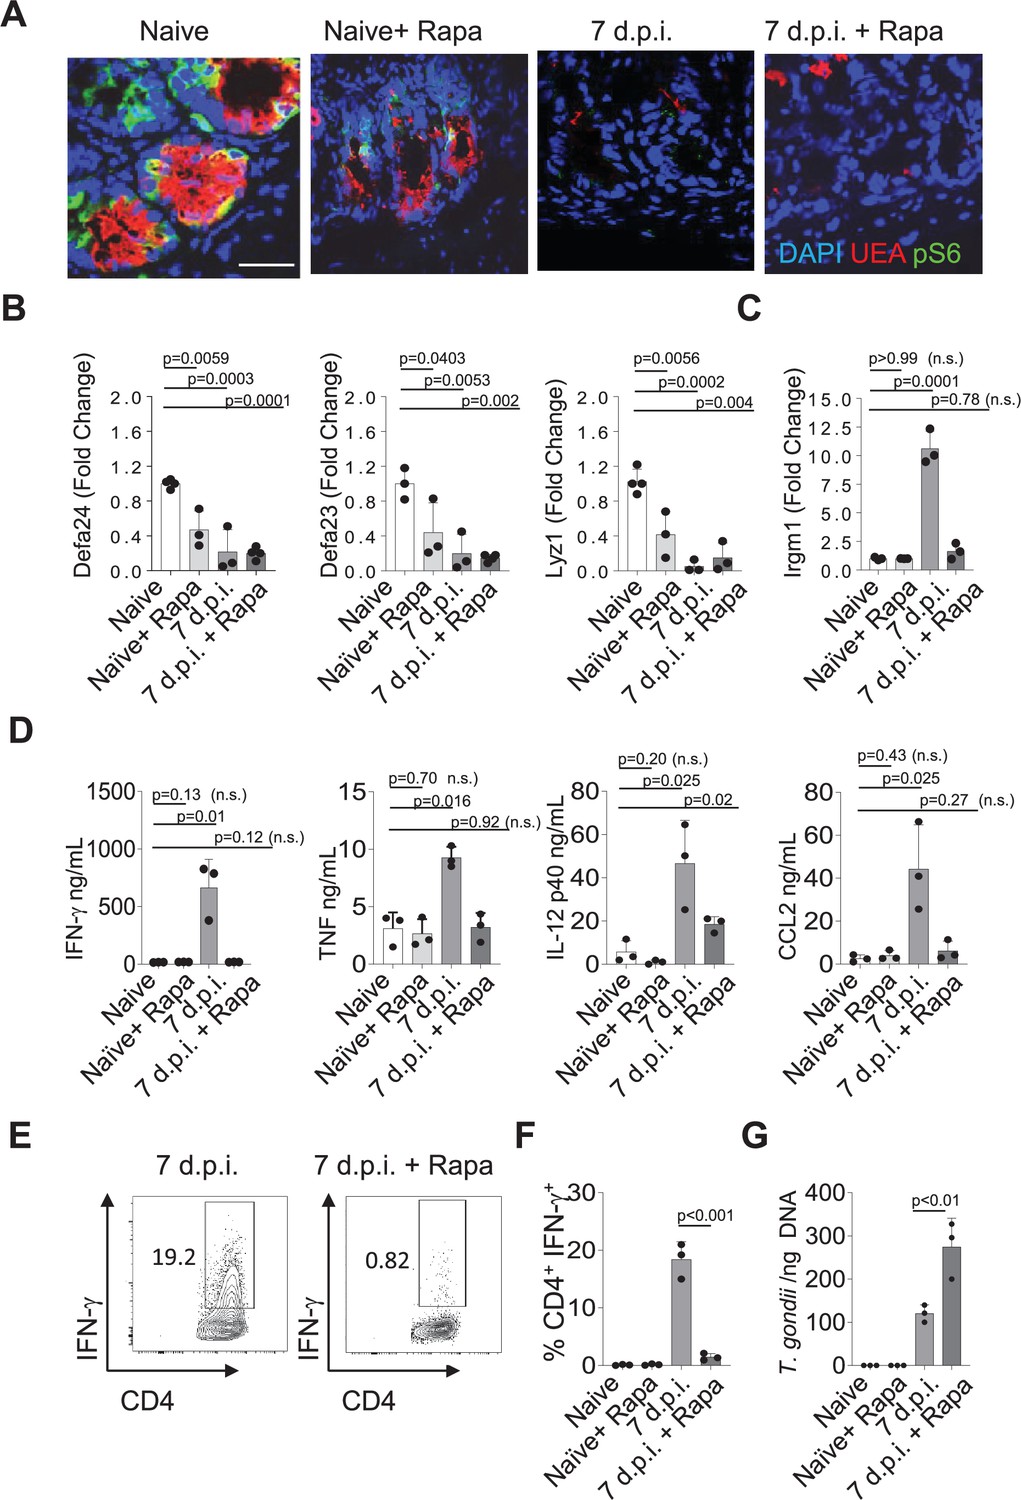
Paneth cell mTORC1 dependency is downstream of Toxoplasma gondii-infection triggered IFN-γ.
(a) Confocal immunofluorescence images of intestinal crypts prepared from naïve or T. gondii-infected mice treated intraperitoneally with rapamycin (rapa). Sections were stained with UEA (red), anti-pS6Ser 240/244 (green), and DAPI (blue). Scale bar: 50 μm. The results are representative of three independent experiments, each involving at least three mice per group. (b) qRT-PCR analysis for relative expression of Paneth cell-specific transcripts (Lyz1, Defa23, and Defa24) in small intestines of naïve and T. gondii-infected mice treated with rapamycin daily for 7 days. Error bars=mean±s.d. (c) Relative expression of the IFN-γ stimulated gene Irgm1 in small intestines of naïve and T. gondii-infected mice treated with rapamycin daily for 7 days. Error bars=mean±s.d. (d) Serum levels of IFN-γ, TNF, IL-12p40, and CCL2 in naïve and T. gondii-infected mice treated with rapamycin for 7 days. Error bars=mean±s.d. (e, f) Flow cytometric analysis of IFN-γ expression by CD4+ cells in the spleen of naïve and T. gondii-infected mice treated daily with rapamycin. Error bars=mean± .d. (g) T. gondii burden in the small intestines of the infected mice on day 7 post infection. Error bars=mean±s.d. and the results are representative of three separate experiments.
Figure 6
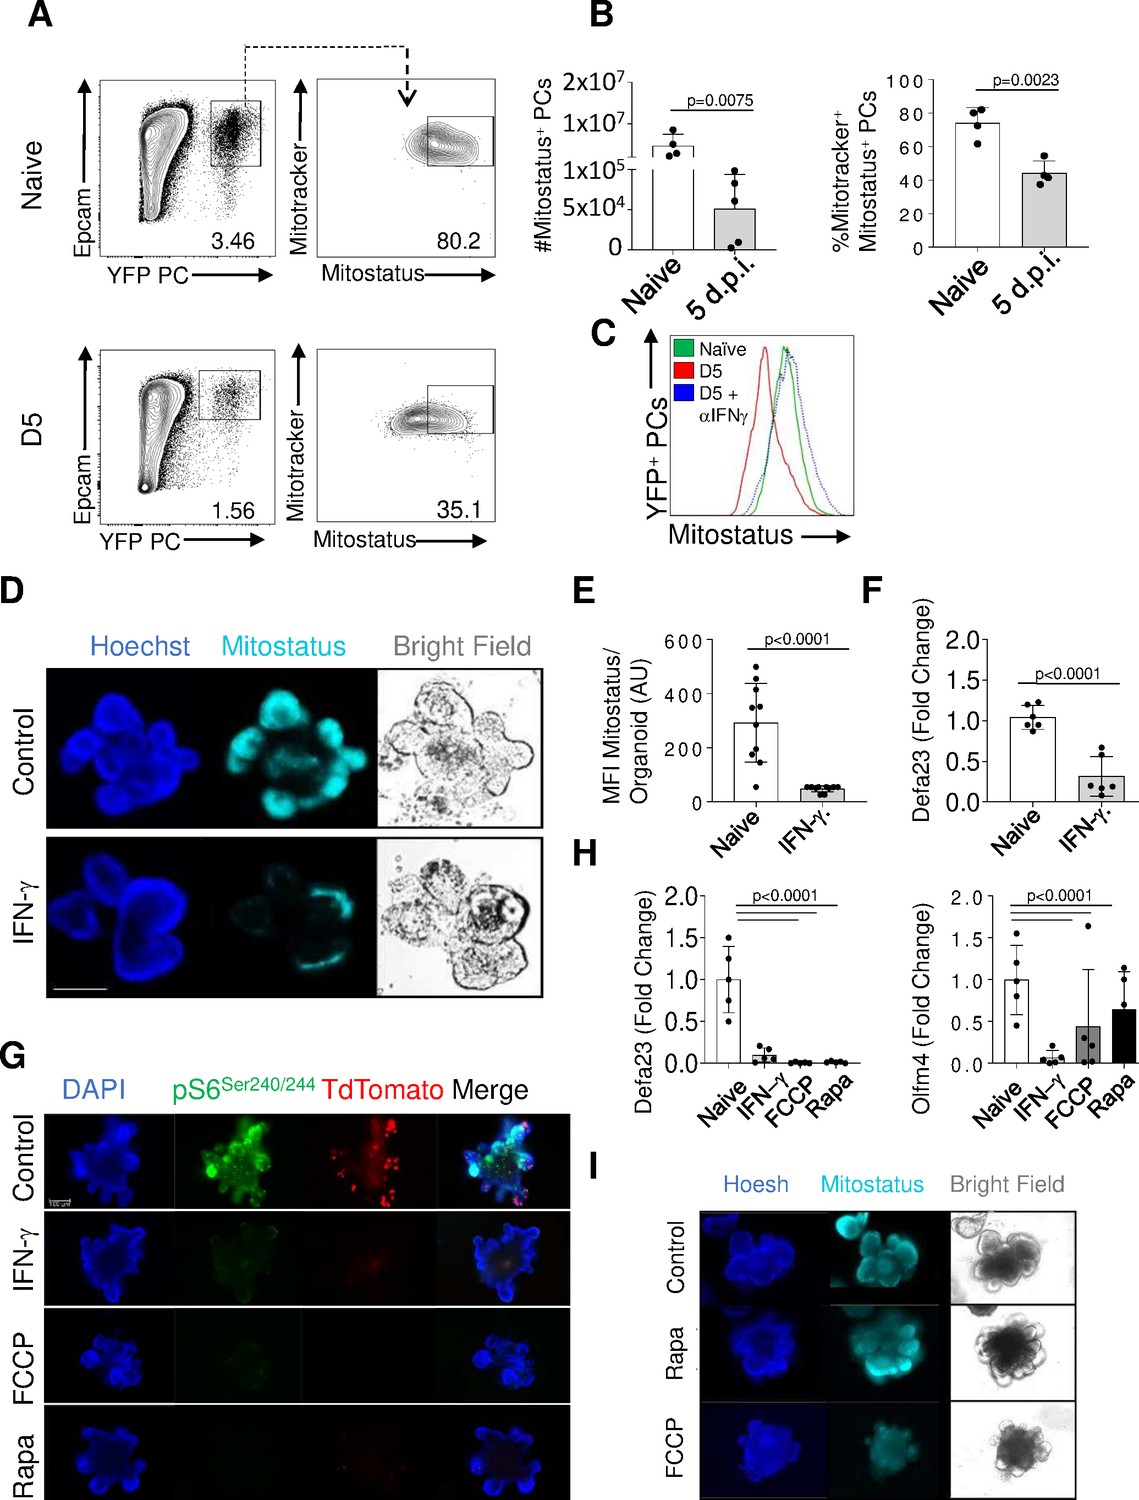
IFN-γ-mediated mitochondrial damage accompanies mTORC1 inhibition in Paneth cells.
(a, b) Flow cytometric analysis of Paneth cell mitochondrial activity (potentiation) and mass analyzed by mitostatus and mitotracker staining, respectively, in naïve or Toxoplasma gondii-infected PC-Cre x Rosa-YFP reporter mice (day 5 post infection). The results are representative of three independent experiments, each involving 3–4 mice per group. Error bars=mean±s.d. (c). MitoStatus mean fluorescence intensity (MFI) in the Paneth cells in naïve (green), T. gondii-infected (red), and T. gondii-infected and treated with anti-IFN-γ antibody (blue). The results are representative of three independent experiments. (d) Intestinal organoids were generated from small intestinal stem cells isolated from crypts of WT mice and stimulated with IFN-γ (200 ng/ml) in vitro for 24 hr and stained with MitoStatus (cyan) and Hoechst (blue). The images shown are representative of 30 organoids imaged across three technical replicate wells per condition. Scale bar: 100 μM. (e). MitoStatus MFI of the individual intestinal organoids treated with IFN-γin vitro for 24 hr and imaged at 40×. (f) qRT-PCR analysis for relative Defa23 expression in organoids stimulated with IFN-γ (200 ng/ml) for 24 hr. The results are representative of three independent experiments. (g) Intestinal organoids were generated from PC-Cre x TdTomato reporter mice and stimulated with IFN-γ (200 ng/ml), Rapamycin (500 nM) or FCCP (100 μM) for 6 hr (n=4 per treatment). (h) qRT-PCR analysis for relative Defa23 and Olfm4 expression in PC-Cre x TdTomato organoids stimulated with IFN-γ (200 ng/ml), Rapamycin (500 nM) or FCCP (100 μM) for 6 hr (n=4 per treatment). Data shown are mean±s.d. (i) Intestinal organoids were generated from WT mice and stimulated with Rapamycin (500 nM) for 2 hr. Organoids were stained with Hoescht (blue) and MitoStatus (cyan) prior imaging. The organoid images are representative of 30 organoids imaged across three technical replicates per condition.
-
Figure 6—source data 1
IFN-γ-mediated mitochondrial damage accompanies mTORC1 inhibition in Paneth cells.
Figure 6B Flow cytometric quantification of mitostatus and mitotracker positive Paneth cells in naïve or Toxoplasma gondii-infected PC-Cre x Rosa-YFP reporter mice on day 5 post infection. Figure 6E: MitoStatus MFI of the individual intestinal organoids treated with IFN-γ in vitro for 24 hr. Figure 6F: qRT-PCR analysis for relative Defa23 expression in organoids stimulated with IFN-γ (200 ng/ml) for 24 hr. Figure 6H: qRT-PCR analysis for relative Defa23 and Olfm4 expression in PC-Cre x TdTomato organoids stimulated with IFN-γ(200 ng/ml), Rapamycin (500 nM) or FCCP (100 µM) for 6 hr. MFI, mean fluorescence intensity.
- https://cdn.elifesciences.org/articles/60478/elife-60478-fig6-data1-v2.xlsx
Figure 7 with 1 supplement
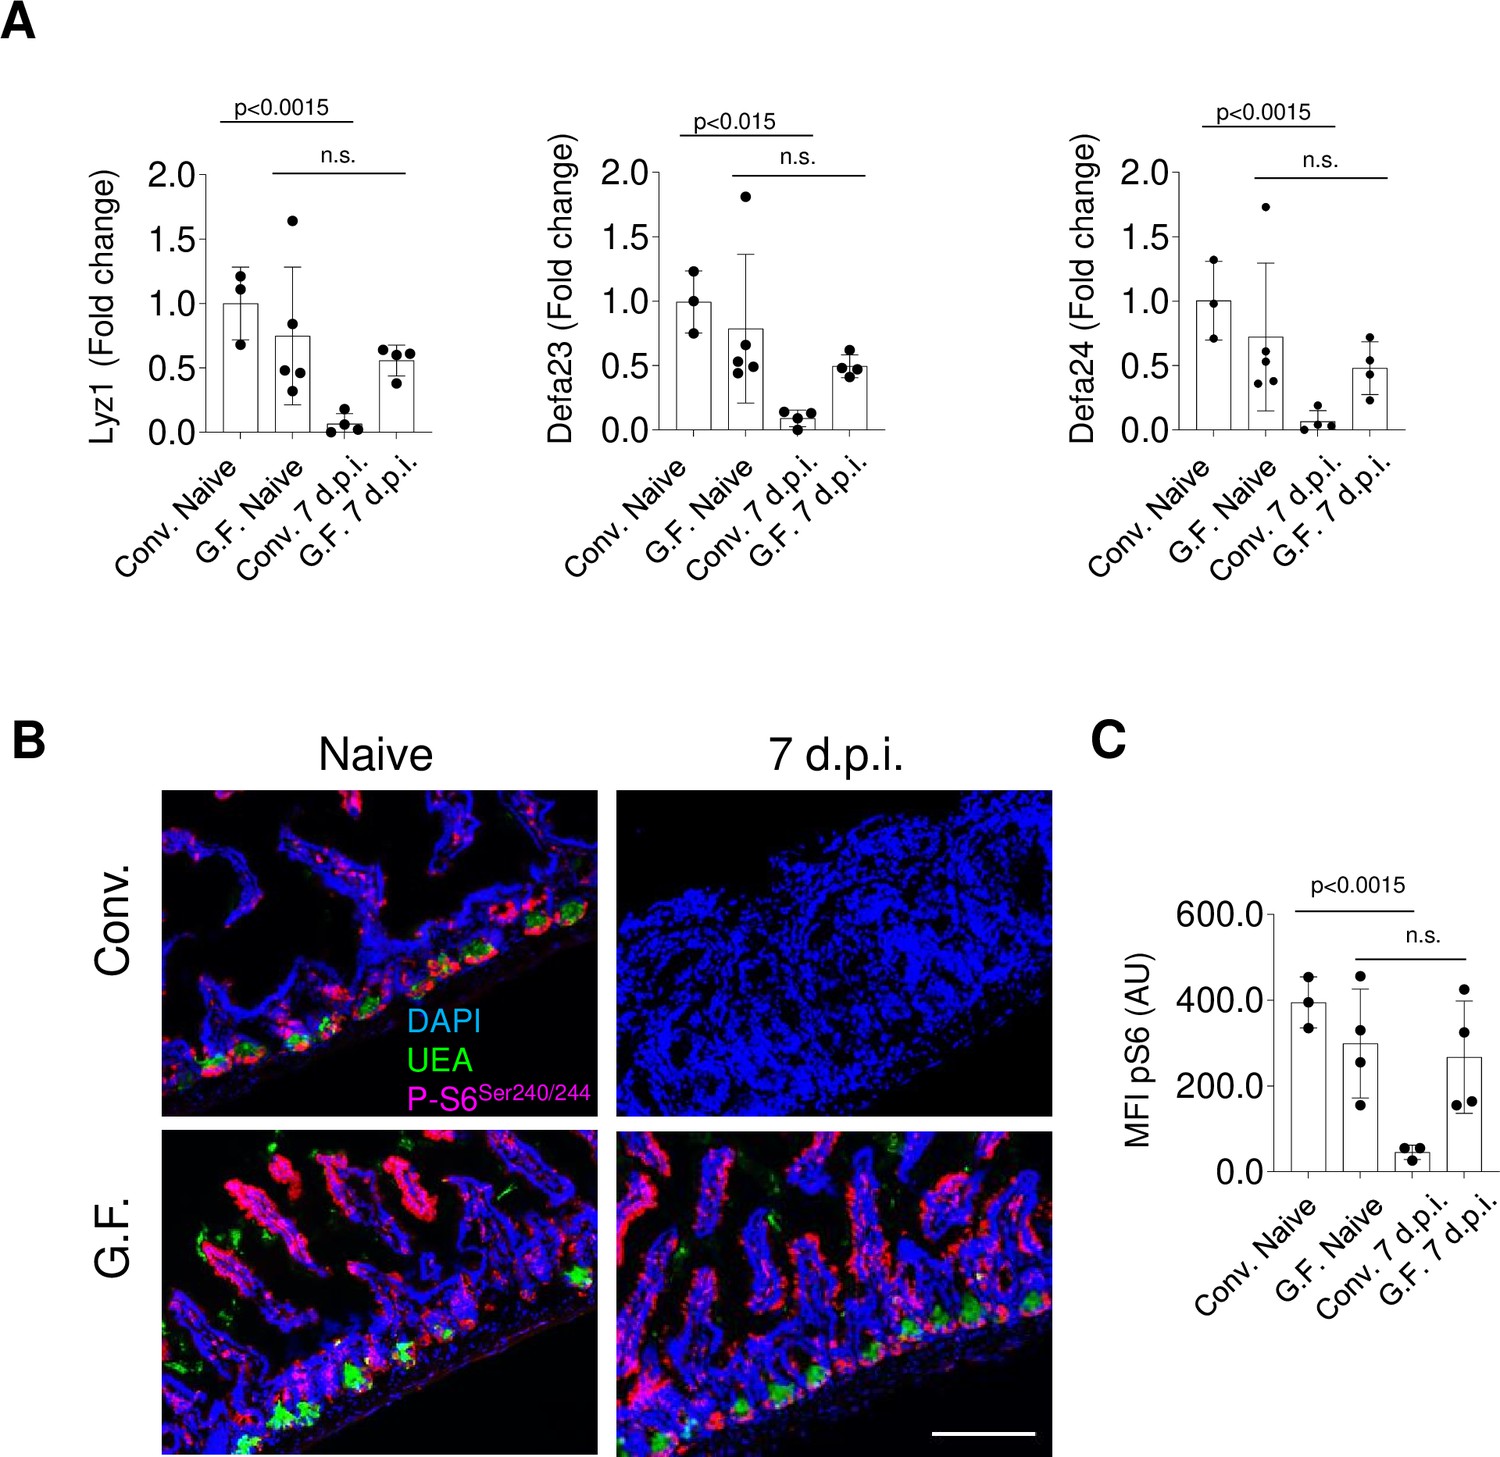
Microbiota is required for IFN-γ-mediated mTORC1 inhibition during Toxoplasma gondii infection.
(a) qRT-PCR analysis for relative expression of Lyz1, Defa23, and Defa24 measured in the small intestines of conventional (CONV) and germ-free (GF) C57Bl/6 mice infected orally with 20 cysts of the ME49 T. gondii (day 7 post infection). The results are representative of three independent experiments. Error bars=mean±s.d. (b) Immunofluorescence images of small intestinal crypts of naïve and T. gondii-infected WT CONV and GF free mice 7 days post oral infection with 20 Me49 T. gondii cysts. UEA (green), p-S6 (p-Ser 240/244) (pink), and DAPI (blue). Scale bar: 200 μM. (c) MFI quantification of p-Ser240/244 channel in individual intestinal sections of T. gondii-infected WT CONV and GF mice on day 7 post infection. Error bars=mean±s.d. The results shown are representative of three separate experiments. Error bars=mean±s.d. MFI, mean fluorescence intensity; WT, wild-type.
-
Figure 7—source data 1
Microbiota is required for IFN-γ-mediated mTORC1 inhibition during Toxoplasma gondii infection.
Figure 7A: qRT-PCR analysis for relative expression of Lyz1, Defa23, and Defa24 measured in the small intestines of conventional (CONV) and germ-free (GF) C57Bl/6 mice infected orally with 20 cysts of the ME49 T. gondii (day 7 post infection). Figure 7C: MFI quantification of p-Ser240/244 channel in individual intestinal sections of T. gondii-infected WT CONV and GF mice on day 7 post infection. MFI, mean fluorescence intensity; WT, wild-type.
- https://cdn.elifesciences.org/articles/60478/elife-60478-fig7-data1-v2.xlsx
Figure 7—figure supplement 1
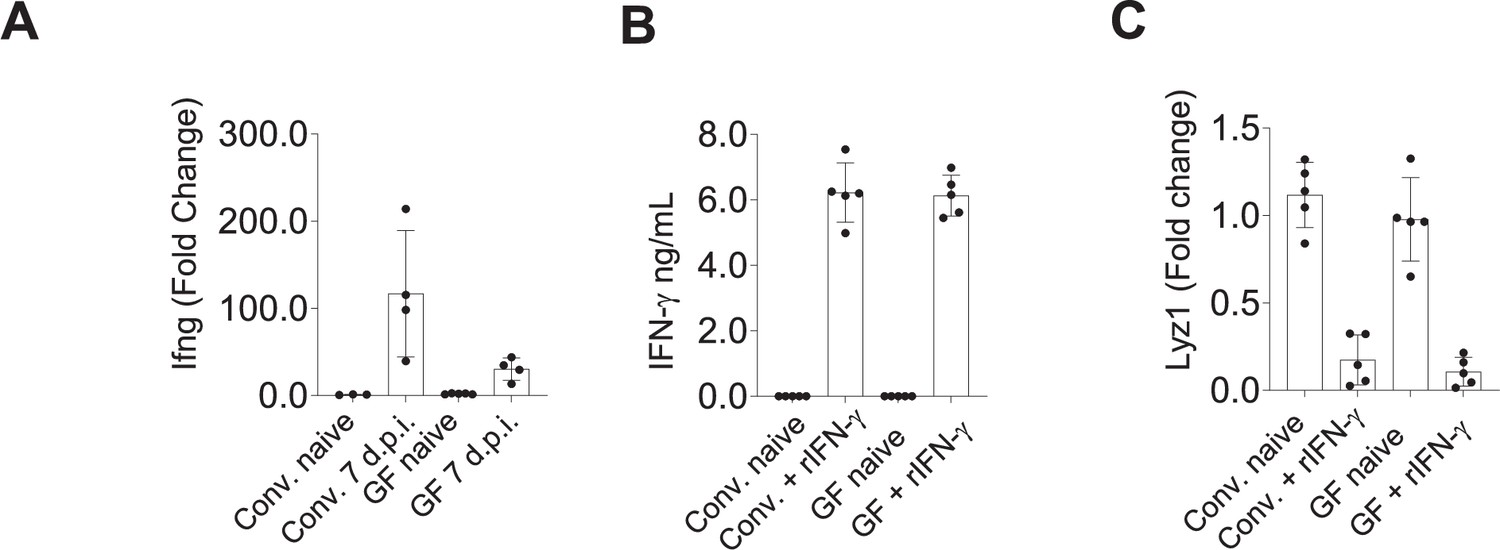
Microbiota contributes to IFN-γ response during Toxoplasma gondii infection.
(a) qRT-PCR analysis for relative expression of IFN-γ expression in the small intestines of WT CONV and GF mice infected orally with 20 cysts of the ME49 T. gondii on day 7 post infection. Error bars=mean±s.d. (b) IFN-γ levels in sera of WT CONV and GF mice treated with rIFN-g. (c) qRT-PCR analysis for relative expression of Lyz1 in WT CONV and GF mice treated with r-IFN-γ. The results shown are representative of three separate experiments. Error bars=mean±s.d. CONV, conventional; GF, germ-free; MFI, mean fluorescence intensity; WT, wild-type.
Author response image 1
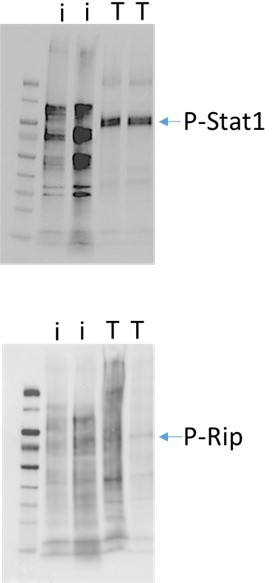
Western blot analysis of sort-sort-purified Paneth cells isolated from naïve or T. gondii infected mice (day 6 post infection).
Paneth cells were combined from 3 naïve mice (I) and 12-15 T. gondii infected mice (T). The data shown are from two independent experiments.
Additional files
Download links
A two-part list of links to download the article, or parts of the article, in various formats.
Downloads (link to download the article as PDF)
Open citations (links to open the citations from this article in various online reference manager services)
Cite this article (links to download the citations from this article in formats compatible with various reference manager tools)
IFN-γ mediates Paneth cell death via suppression of mTOR
eLife 10:e60478.
https://doi.org/10.7554/eLife.60478


