Neurofascin and Kv7.3 are delivered to somatic and axon terminal surface membranes en route to the axon initial segment
- Centre for Discovery Brain Sciences, University of Edinburgh, United Kingdom
Figures
Figure 1 with 1 supplement

SEP-Nfasc186 accumulates at the AIS and the cell surface of the soma and axon terminus before the formation of the AIS.
(A) Immunostaining of cortical neurons at DIV 7 shows that SEP-Nfasc186 is delivered to the AIS where it colocalises with ßIV-Spectrin. Location of the cell body is shown by asterisks. Scale bar, 10 µm. (B) Quantitation of signal intensity shows comparable enrichment of SEP-Nfasc186 relative to either the soma or distal axon when compared to endogenous Neurofascin irrespective of expression in WT or Neurofascin-null neurons. n = 3, ≥41 cells; one-way ANOVA; ns = not significant. (C) Live imaging before AIS formation at DIV 3 shows SEP-Nfasc186 at the surface of the soma and axon terminus (arrows). KHC560-halo identifies the axon terminus. Dashed lines outline the axon. Scale bar, 10 µm. (D) Line scan of top panel in (C) showing the SEP-Nfasc186 signal intensity in the cell body, axon and terminal relative to background.
Figure 1—figure supplement 1
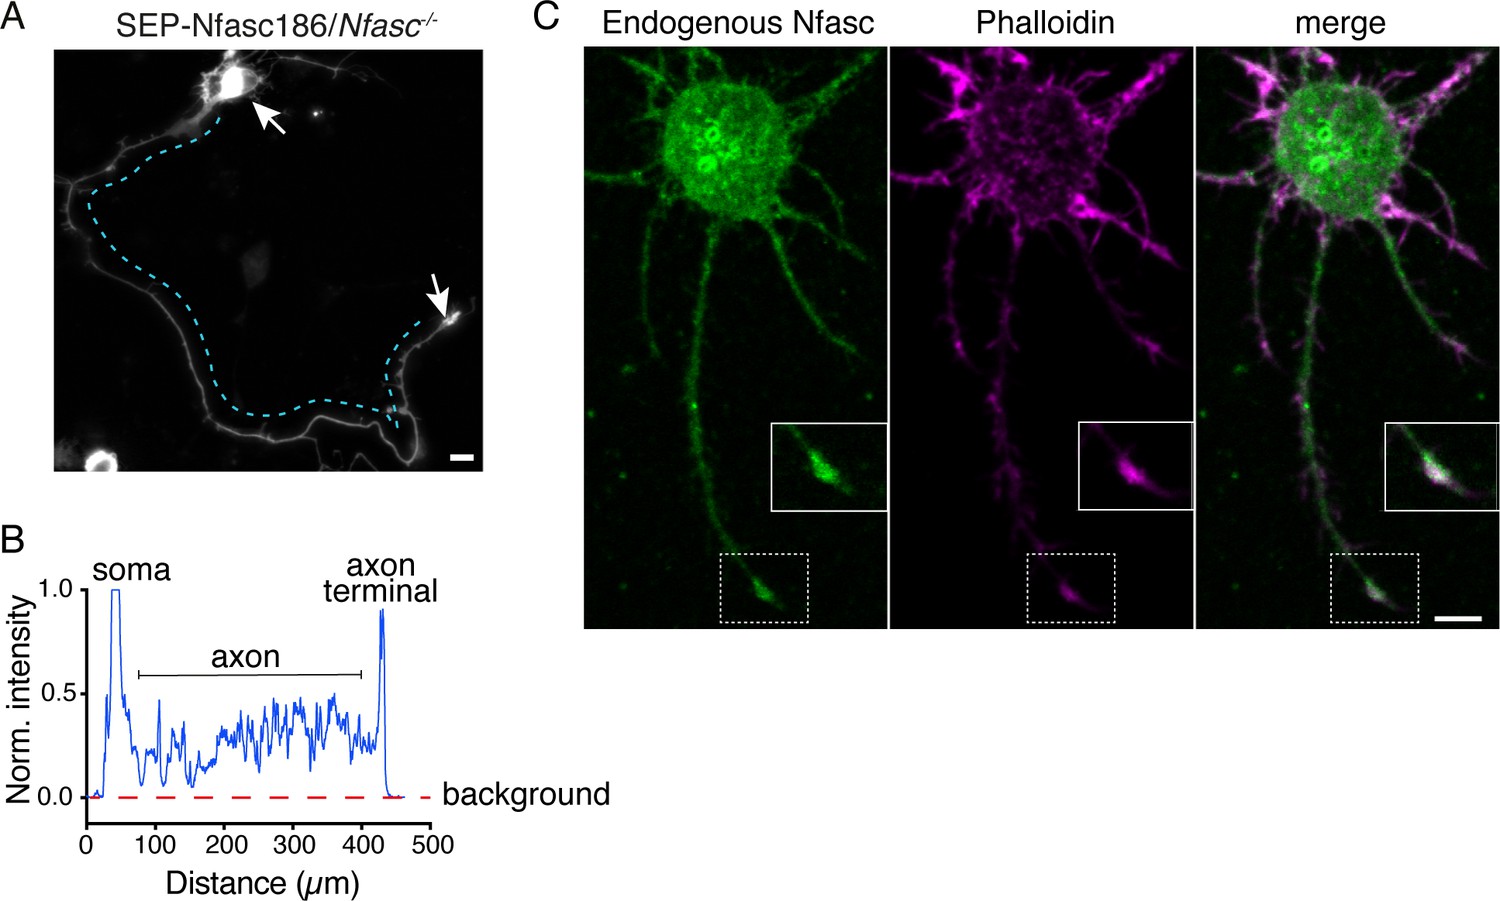
SEP-Nfasc186 expressed in Neurofascin-null neurons and endogenous Neurofascin in WT cells accumulate at the cell surface of the soma and axon terminus before the formation of the AIS.
(A) SEP-Nfasc186 was transfected at DIV 2 in Neurofascin-null cortical neurons. The expression at DIV 3 shows enrichment at the cell surface membrane of the soma and axon terminal (arrows). Scale bar, 10 µm. (B) Line scan of A showing SEP-Nfasc186 signal intensity in the cell body, axon and terminal relative to background. (C) The surface staining of neuronal Neurofascin (Nfasc) using an antibody directed to the extracellular domain of Nfasc186 at DIV 2 shows increased signal intensity at the soma and axon terminal (inset), Phalloidin staining identifies the cell body and the axon terminal (inset of axon terminal). Scale bar 5 µm.
Figure 2
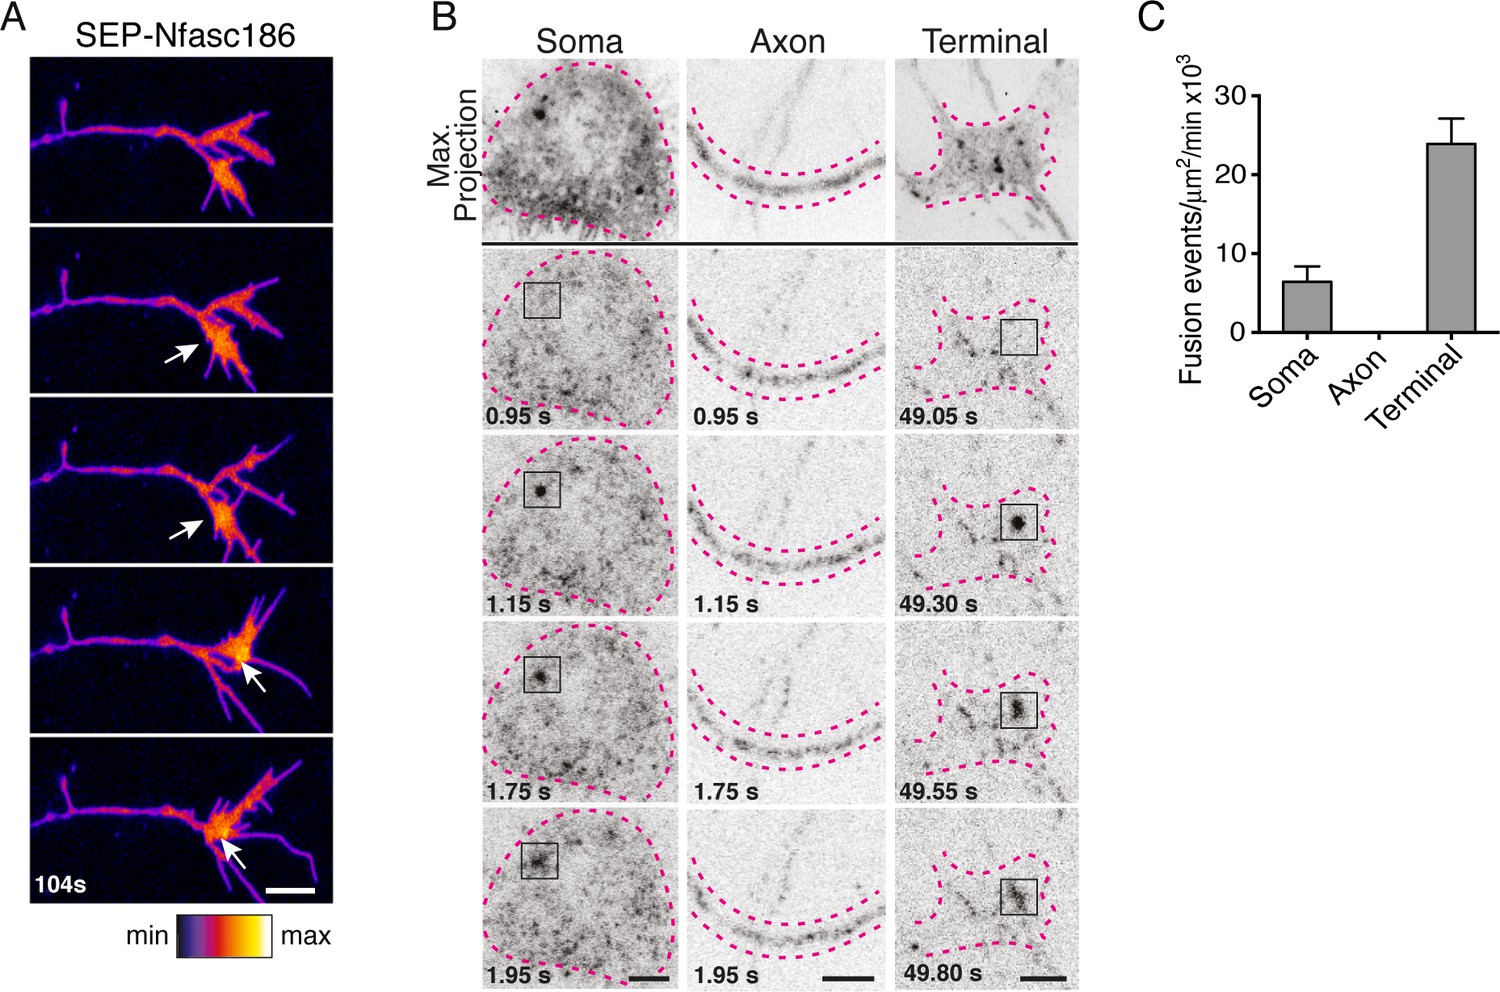
Nfasc186 is inserted into the neuronal membrane by vesicular fusion at the soma and axon terminus.
(A) Still video images show transient elevated signal intensities (arrows) of SEP-Nfasc186 at the cell surface of an axon terminal. Scale bar, 5 µm. (B) TIRF microscopy reveals exocytotic insertion of SEP-Nfasc186 at the cell membrane of the soma and axon terminal (boxes), see Video 1. The soma, axon and terminal are outlined with dashed lines. Scale bar, 5 µm. (C) Quantitation of vesicle fusion events. Number of cells; soma = 4, axons = 7, terminal = 5.
Figure 3 with 2 supplements
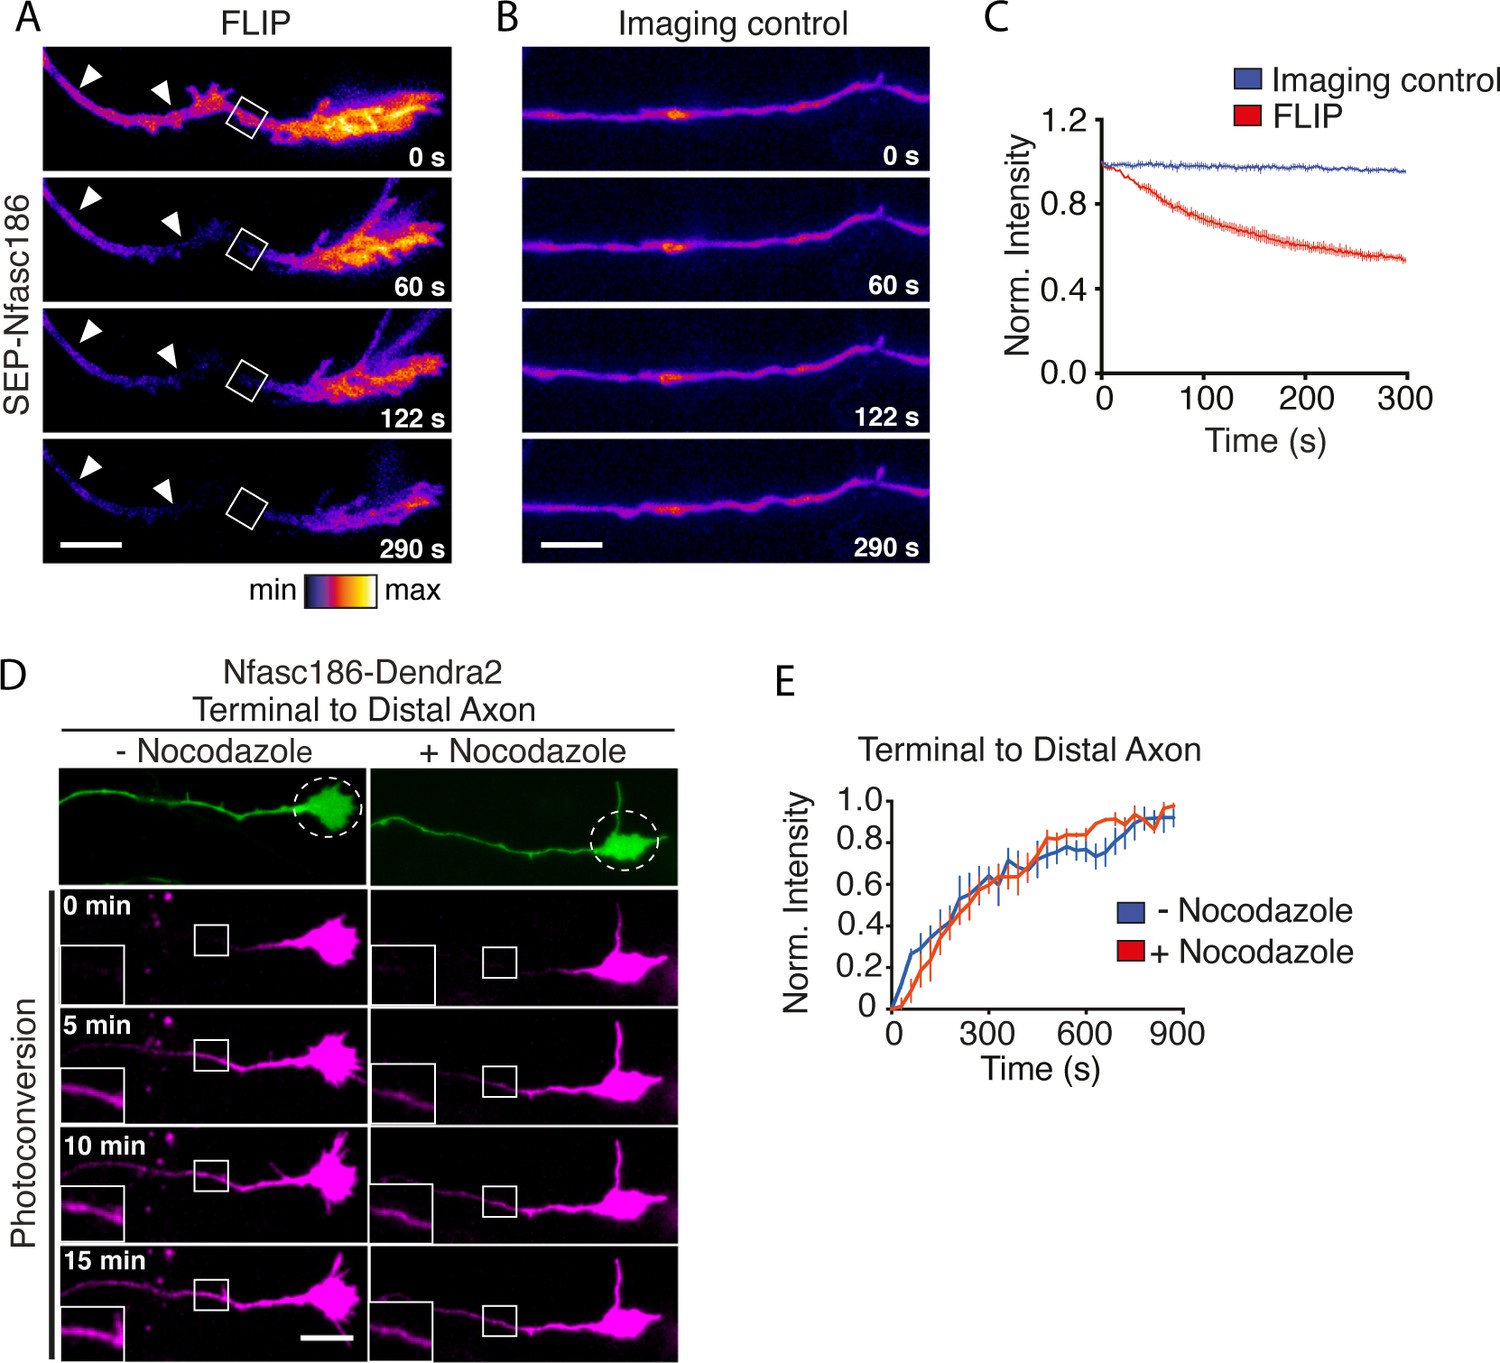
Lateral movement of Nfasc186 in the axon membrane from the axon terminal towards the distal axon.
(A-C) Still images and quantitation from Video 2 show depletion of SEP-Nfasc186 signal (arrowheads) proximal to the ROI after FLIP proximal to the axon terminal and at the axon terminal itself. In the imaging control axons were subjected to the same acquisition protocol without FLIP. n = 3, ≥15 cells. Scale bar, 10 µm. (D-E) Still images from Video 3 of the photoconversion of Nfasc186-Dendra2 in the axon terminal and quantitation of normalised signal intensities (ROI boxes with insets) show that nocodazole does not affect Nfasc186-Dendra2 movement into the axon. An image in the green channel before photoconversion is shown in the top panel and the irradiated area is outlined in the dashed circle. n = 3, ≥14 cells. Scale bar, 10 µm.
Figure 3—figure supplement 1

Nocodazole inhibits the movement of vesicles transporting Nfasc186-Dendra2.
(A) Intra-axonal vesicles containing Nfasc186-Dendra2 were readily identifiable immediately proximal to the axon terminal and kymographs of their motion showed that their movement was arrested in distal axons by nocodazole. Scale bar, 5 µm. (B) Mean velocities of anterograde and retrograde axonal vesicles were measured from kymographs. n = 5 axons. One-way ANOVA followed by Tukey’s multiple comparison test. ****p<0.0001. **p<0.01.
Figure 3—figure supplement 2
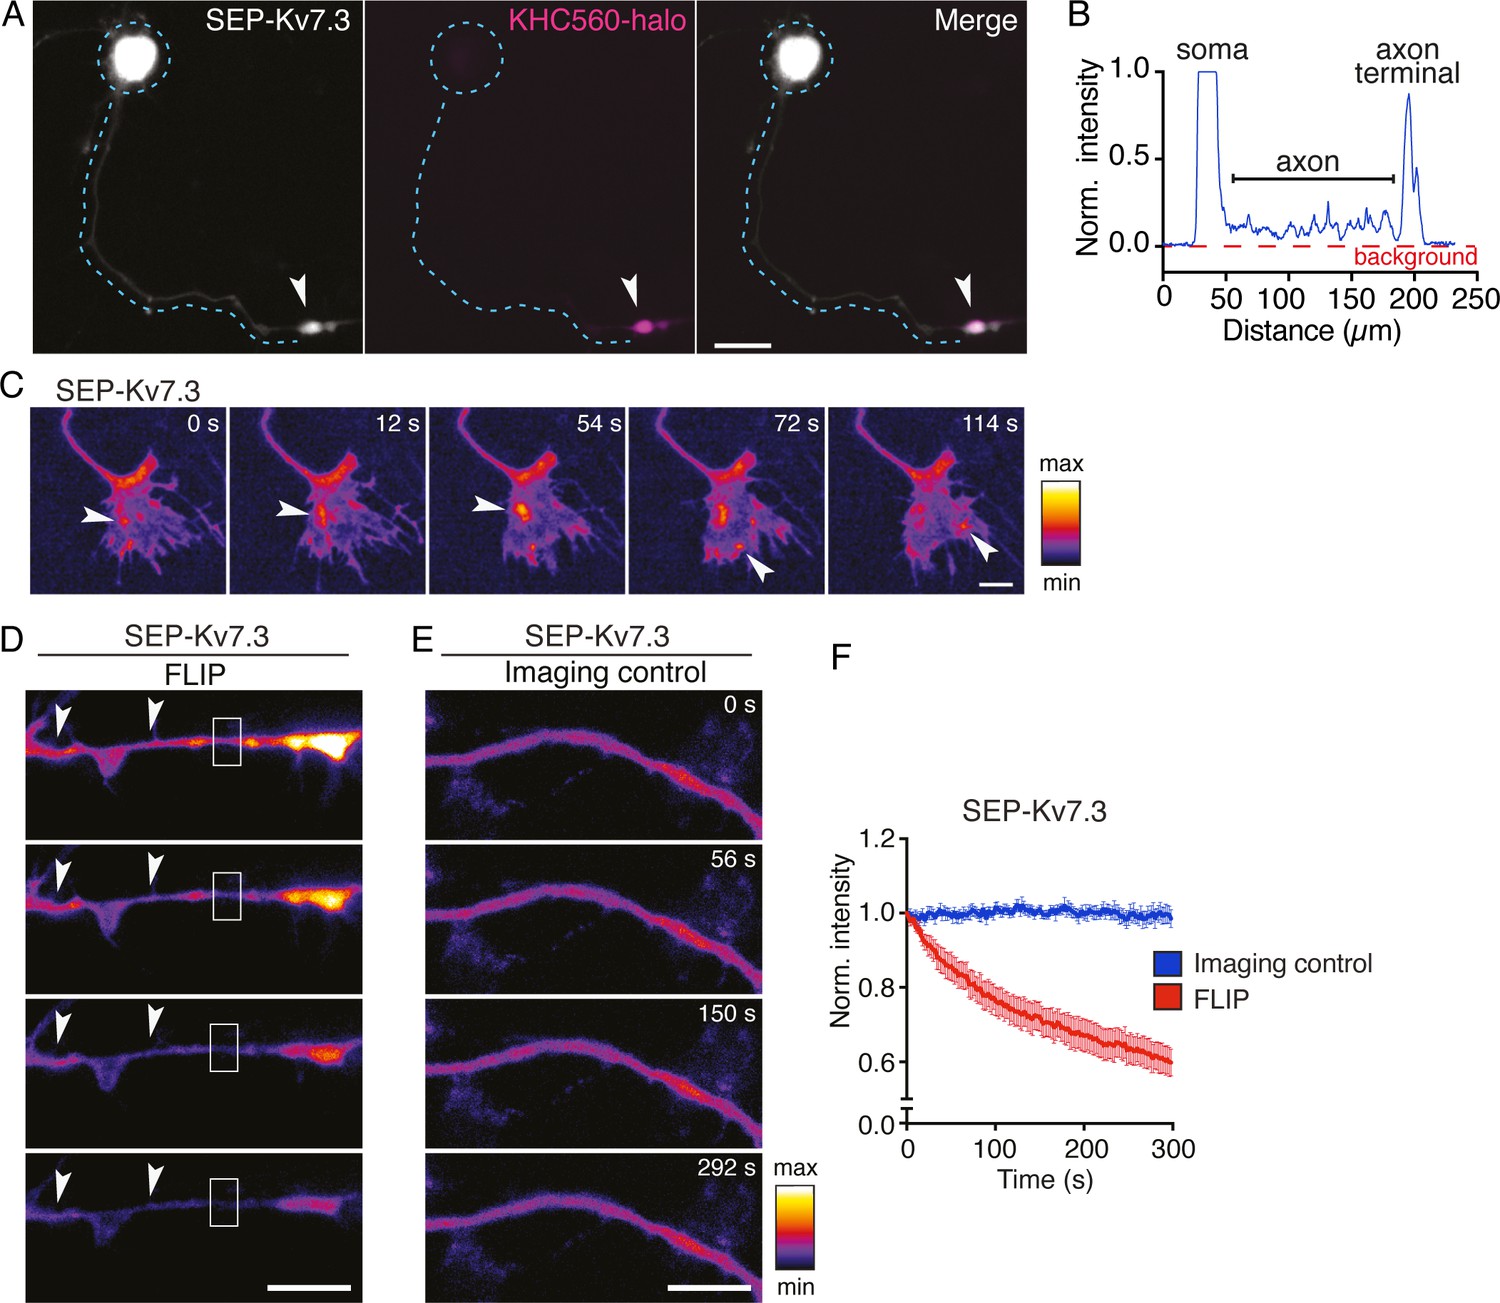
Kv7.3 accumulates at the soma and axon terminus before the formation of the AIS.
(A) Live imaging of a neuron at DIV 3 showing accumulation of SEP-Kv7.3 at the membrane surface of the soma and axon terminus (arrows). KHC560-halo identifies the axon terminus. SEP-Kv7.3 is co-expressed with Kv7.2. Dashed lines outline the axon. Scale bar, 20 µm. (B) Line scan of the first panel in (A) showing the SEP-Kv7.3 signal intensity in the cell body, axon and terminal relative to background. (C) Still video images show SEP-Kv7.3 at the cell surface of the axon terminal and arrows indicate transient elevated signal intensities. Scale bar, 5 µm. (D-F) Still images from a time-lapse video and quantitation of fluorescence intensity show that repetitive photobleaching (FLIP) of the ROI (box) at the axon immediately proximal to the axon terminal causes depletion of SEP-Kv7.3 signal (arrowheads) proximal to the ROI and at the axon terminal. (D) In a control region of the axon no change in signal intensity was observed for the duration of the experiment in the absence of FLIP (imaging control). Data are mean ± SE. n ≥ 8 axons. Scale bar, 10 µm.
Figure 4 with 5 supplements
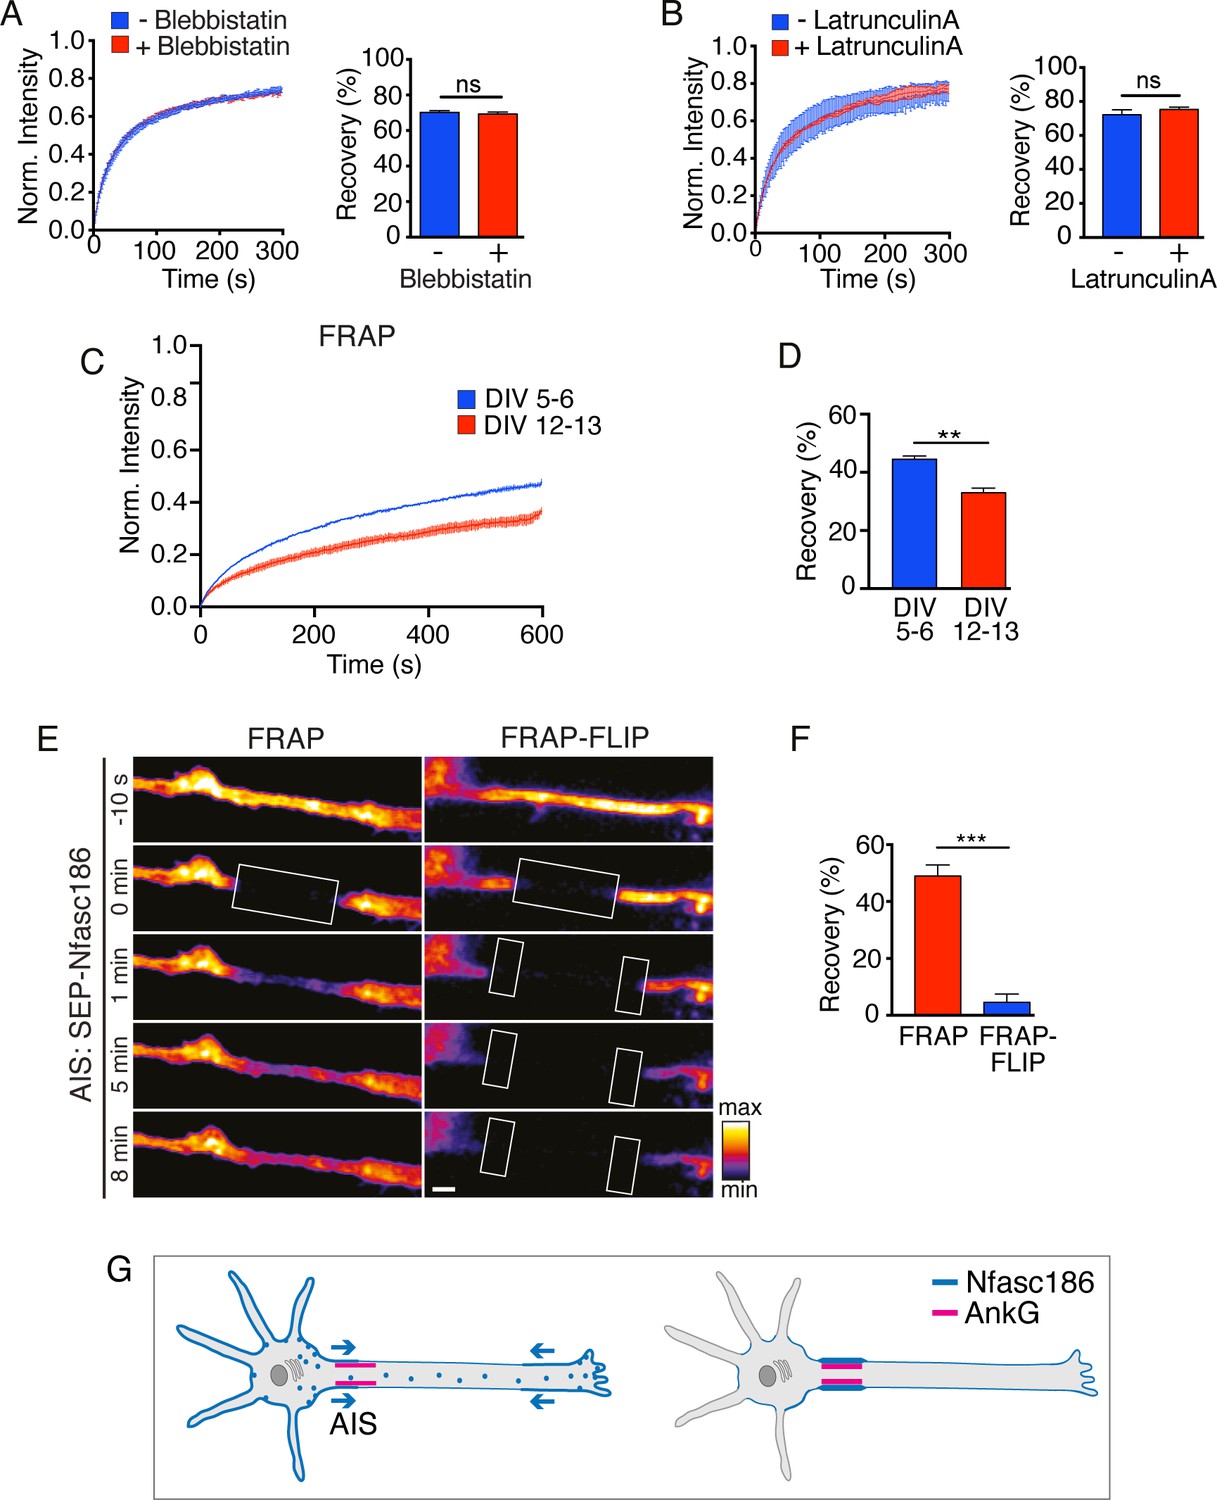
Nfasc186 is delivered to the AIS by lateral diffusion in the cell membrane of cortical neurons.
(A—B) Cultured cortical neurons were treated with the myosin ATPase inhibitor Blebbistatin and latrunculin A. The FRAP curves show that the drugs did not affect recovery of the mean signal intensity from three independent experiments for each condition. The bar graph shows the mean recovery fraction. n = 3, ≥16 cells; Student’s t test; ns = not significant. (C-D) Comparison of FRAP curves at DIV 5–6 and DIV 12–13 shows that SEP-Nfasc186 becomes significantly more immobilised at the AIS with time. n = 3, ≥17 cells. Student’s t test. **p<0.01. (E-F). Still images from Video 5 of FRAP and FRAP-FLIP within the AIS (FRAP at boxed ROIs and FLIP at flanking boxed ROIs) and quantitation show that signal recovery after photobleaching is prevented by FLIP. n = 3, ≥16 cells; Student’s t test; ***p<0.001. Scale bar, 2 µm. (G) Model depicting bidirectional delivery of Nfasc186 to the AIS.
Figure 4—figure supplement 1
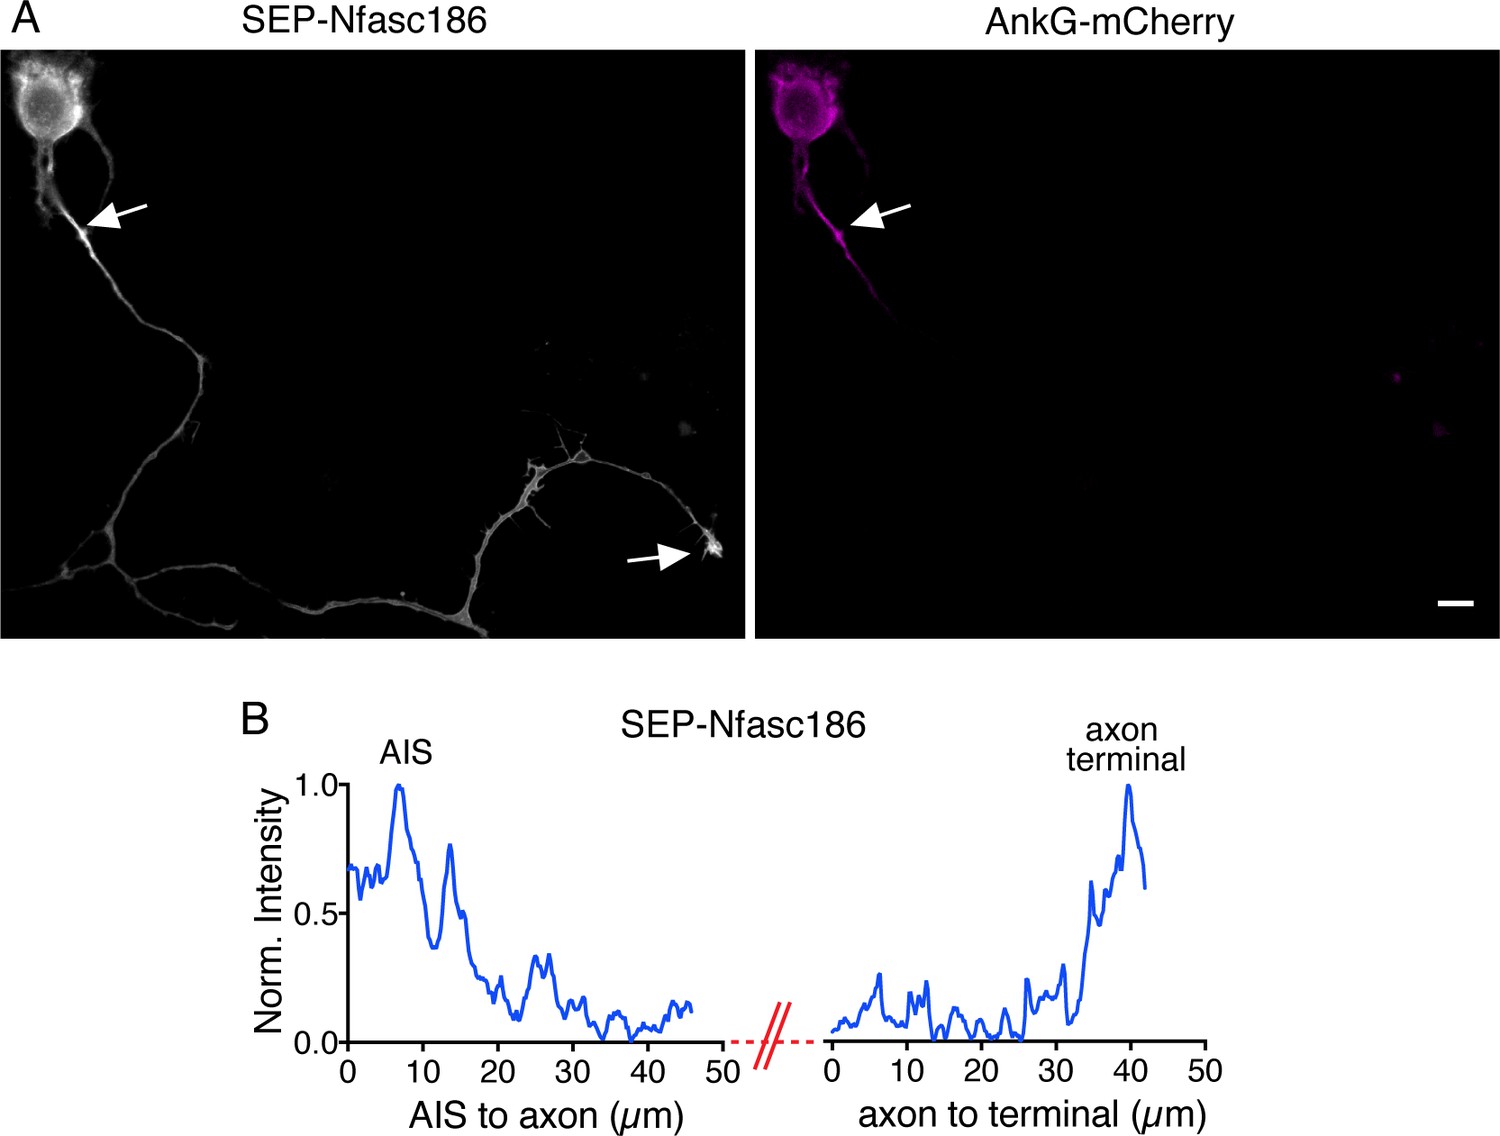
Enrichment of SEP-Nfasc186 at the soma and axon terminal during AIS assembly.
(A) Live imaging of a cortical neuron expressing both SEP-Nfasc186 and AnkG-mCherry fusion proteins (see Figure 4—figure supplement 3) (grey scale, SEP; magenta, mCherry) shows that SEP-Nfasc186 and AnkG-mCherry are enriched at the AIS at DIV 5. (B) Line scans show SEP-Nfasc186 enrichment at the AIS and the axon terminal. Scale bar, 10 µm.
Figure 4—figure supplement 2
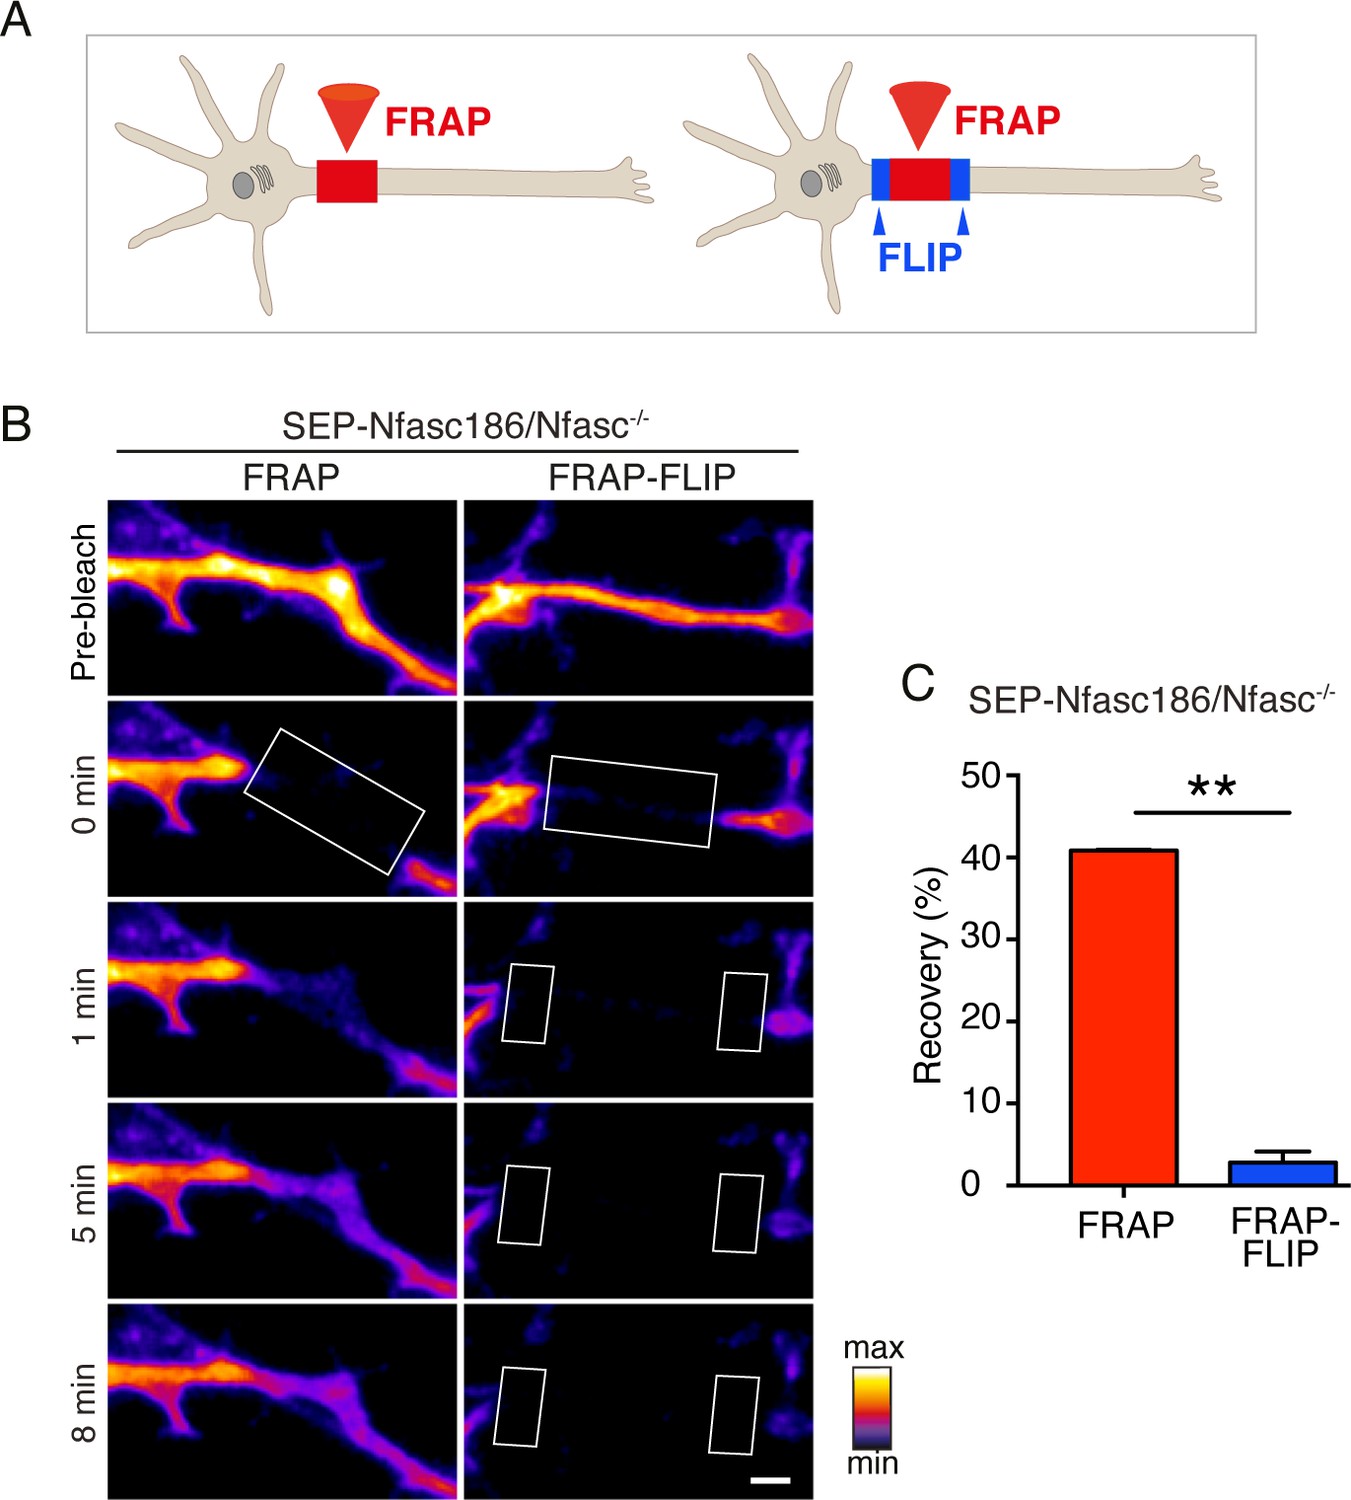
SEP-Nfasc186 is delivered to the AIS by lateral diffusion in Neurofascin-null cortical neurons.
(A) Schematic of FRAP and FRAP-FLIP. (B) FRAP and FRAP-FLIP at the AIS (FRAP at boxed ROIs and FLIP at flanking boxed ROIs). Still images show signal recovery after photobleaching is prevented by FLIP. (C) Quantitation of fluorescence signal recovery after FRAP and FRAP-FLIP. n = 2, ≥9 cells. Student’s t test. **p<0.01. Scale bar, 2 µm.
Figure 4—figure supplement 3

Control experiment to show that the vesicular fraction of SEP-Nfasc186 is not bleached during FRAP-FLIP.
(A) Diagram of the SEP-Nfasc186 and AnkG-mCherry (AnkG-mCh) fusion proteins showing the sites of the fluorescent reporter attachment (green, SEP; magenta, mCh). Live imaging of a cortical neuron expressing both proteins shows that SEP-Nfasc186 and AnkG-mCh are enriched at the AIS. Brief (less than 1 min) exposure to an acidic medium (pH 6.0) quenched SEP-Nfasc186 fluorescence. Hence, SEP-Nfasc186 fluorescence originates primarily from the surface-expressed protein. The subsequent alkalinisation with NH4Cl restores the surface signal and reveals intracellular vesicles (arrowheads). Asterisks show the position of the cell body. Scale bar, 10 µm. (B) Surface and total fluorescence signal intensity after alkalinisation of SEP-Nfasc186. The difference between surface and total fluorescence intensity shows the fluorescence contribution from vesicular SEP-Nfasc186 without FRAP-FLIP. (n = 9 cells). (C) Mean recovery of surface signal intensity after FRAP-FLIP (n = 7 cells). (D) Mean recovery of surface signal intensity after FRAP-FLIP and subsequent alkalinisation (total, n = 7 cells). (E) Computation from (C and D) of surface and total signal intensity of SEP-Nfasc186 after FRAP-FLIP to calculate the vesicular intensity after FRAP-FLIP. (F) Comparison of vesicular signal intensity without and with FRAP-FLIP (from B and E) shows that FLIP did not affect any potential contribution from vesicular SEP-Nfasc186 to fluorescence recovery at the cell surface. All fluorescence signal intensities were normalised to surface signal intensities (without NH4Cl). Student’s t test; ns = not significant.
Figure 4—figure supplement 4

Nfasc186 is recruited to the AIS by lateral diffusion in cerebellar Purkinje Neurons.
(A) Immunofluorescence staining of Purkinje cells at P10 in acute cerebellar slices shows that SEP-Nfasc186 expression (GFP) under the control of the L7 promoter colocalises with AnkG (AnkG) at the AIS (arrows). Immunofluorescence staining of endogenous neuronal Neurofascin (Nfasc) in a WT shows that the localisation of SEP-Nfasc186 mirrors that of the endogenous protein at both the Purkinje cell somatic plasma membrane and the AIS (arrows). Scale bar, 10 µm. (B-D) Still video images of FRAP and bilateral FRAP-FLIP at the AIS of live Purkinje cells in acute cerebellar slices (FRAP at boxed ROIs and FLIP at flanking boxed ROIs) show that signal recovery by FRAP is prevented by FLIP. n = 3, ≥16 cells; Student’s t test; ***p<0.001. Scale bar, 10 µm.
Figure 4—figure supplement 5

AnkG immobilises Nfasc186 at the AIS by its interaction with AnkG but delivery to the axon terminal surface is independent of AnkG.
(A) Mutation of the tyrosine residue in the cytoplasmic FIGQY domain of SEP-Nfasc186 generates the AnkG binding mutant SEP-Nfasc186YA. (B-C) Neurons were cotransfected at DIV 3 and imaged live at DIV 5. SEP-Nfasc186 was clustered in the AIS but SEP-Nfasc186YA was not (arrows). AnkG-mCh clustering was unaffected. The mutant showed increased accumulation at the soma (arrowheads). Scale bars, 10 μm. Quantitation of signal intensity profiles show the different enrichments for SEP-Nfasc186 and the mutant at the AIS. n = 3, ≥28 cells. (D) Still video images show rapid recovery of fluorescence signal intensity by SEP-Nfasc186YA at DIV 5 in the AIS after photobleaching at the boxed ROI. Scale bar, 5 µm. (E-F) FRAP analysis shows that the mutant remains highly mobile at the AIS in culture up to DIV 12–13 (n = 3, ≥17 cells). Student’s t-test; ns = not significant. (G) Still video images show that SEP-Nfasc186YA is delivered to the cell surface of the axon terminal. Arrows indicate transient elevated signal intensities. Scale bar, 5 µm.
Videos
Video 1
TIRF microscopy imaging of SEP-Nfasc186 vesicle fusion events at the cell surface of the soma (top) and axon terminal (lower).
The dashed lines outline the cell body and axon terminal respectively. Arrowheads point to some individual fusion events. Real interframe interval, 50 ms. Scale bar, 5 µm.
Video 2
FLIP of SEP-Nfasc186 in the distal axon proximal to the axon terminus.
SEP-Nfasc186 fluorescence signal is depleted in the axon (arrows) proximal to the ROI (outlined by the box) following FLIP (top) and at the axon terminal itself showing that SEP-Nfasc186 moves retrogradely from and anterogradely to the axon terminus. The lower movie shows no significant bleaching of a control axon during the same acquisition period. Real interframe interval, 2 s. Scale bar, 5 µm.
Video 3
Imaging of cortical neurons expressing Nfasc186-Dendra2 after photoconversion at the axon terminal.
The photoconverted signal is propagated from the axon terminal to the distal axon (shown by arrows) in the absence (top) or presence of nocodazole (lower). Real interframe interval, 30 s. Scale bar, 5 µm.
Video 4
Transport of Nfasc186-mCh in axonal vesicles in rat cortical axons.
Arrows indicate the directionality of movement. Kymograph analysis of 5 axons showed that the anterograde velocity was 2.3 ± 0.27 μm/s and retrograde velocity was 1.9 ± 0.18 μm/s (mean ± SEM). Real interframe interval, 0.5 s. Scale bar, 5 μm.
Video 5
FRAP (top) and FRAP-FLIP (lower) at the AIS of cortical neurons expressing SEP-Nfasc186 (DIV 5).
The boxes indicate the FRAP ROI and the flanking FLIP ROIs. Real interframe interval, 2 s. Scale bar, 2 µm.
Tables
Key resources table
| Reagent type (species) or resource | Designation | Source or reference | Identifiers | Additional information |
|---|---|---|---|---|
| Strain, strain background (R. norvegicus, male and female) | Sprague-Dawley Crl: CD(SD) | Charles River Laboratories | RRID:RGD_734476 | University of Edinburgh maintained colony |
| Strain, strain background (M. musculus, male and female) | Nfasc-/- mice Background: C57BL/6JOla | Sherman et al., 2005 | Peter Brophy, University of Edinburgh | |
| Strain, strain background (M. musculus, male and female) | L7-SEP-Nfasc186 Background: C57BL/6JOla | This paper | Peter Brophy, University of Edinburgh | |
| Transfected construct (M. musculus) | SEP-Nfasc186-pCMV5a | This paper | Peter Brophy, University of Edinburgh | |
| Transfected construct (M. musculus) | SEP-Nfasc186YA-pCMV5a | This paper | Peter Brophy, University of Edinburgh | |
| Transfected construct (M. musculus) | Nfasc186-mCh-pCMV5a | This paper | Peter Brophy, University of Edinburgh | |
| Transfected construct (M. musculus) | Nfasc186-Dendra2-pCMV5a | This paper | Peter Brophy, University of Edinburgh | |
| Transfected construct (human) | SEP-Kv7.3-pCDNA3.1 | Benned-Jensen et al., 2016 | Nicole Schmitt, University of Copenhagen | |
| Transfected construct (human) | Kv-7.2-pXOOM | Benned-Jensen et al., 2016 | Nicole Schmitt, University of Copenhagen | |
| Transfected construct (R. norvegicus) | AnkG-mCh | Addgene Leterrier et al., 2011 | plasmid #42566 | |
| Transfected construct (human) | KHC560-halo | Twelvetrees et al., 2016 | Alison Twelvetrees, University of Sheffield | |
| Antibody | Neurofascin (rabbit polyclonal) | Tait et al., 2000 | Intracellular epitope IF (1:1000) | |
| Antibody | Neurofascin (mouse monoclonal) | UC Davis/NIH NeuroMab | clone: A12/18 | Extracellular epitope IF (1:10) |
| Antibody | ßIV spectrin (rabbit polyclonal) | Zonta et al., 2011 | IF (1:200) | |
| Antibody | GFP (chicken polyclonal) | Abcam | Cat# ab13970 | IF (1:1000) |
| Antibody | Ankyrin G (mouse monoclonal) | UC Davis/NIH NeuroMab | clone: N106/65 | IF (1:30) |
| Antibody | Anti-Rabbit Alexa Fluor 594 | Jackson ImmunoResearch | Cat# 111-585-14 | IF (1:1000) |
| Antibody | Anti-Chicken Alexa Fluor 488 | Jackson ImmunoResearch | Cat# 703-545-155 | IF (1:1000) |
| Antibody | Anti-Mouse IgG2a Alexa Fluor 488 | Invitrogen | Cat# A-21131 | IF (1:1000) |
| Antibody | Anti-Mouse IgG2b Alexa Fluor 568 | Invitrogen | Cat# A-21144 | IF (1:1000) |
| Chemical compound, drug | Phusion High-Fidelity DNA Polymerase | New England BioLabs | Cat# M0530S | |
| Chemical compound, drug | T4 DNA Ligase | Thermo Fisher Scientific | Cat# EL0011 | |
| Chemical compound, drug | DpnI | New England BioLabs | Cat# R0176S | |
| Chemical compound, drug | Lipofectamine 2000 Transfection Reagent | Thermo Fisher Scientific | Cat#11668030 | |
| Chemical compound, drug | DMSO | Sigma-Aldrich | Cat# 434302 | |
| Chemical compound, drug | Poly-D-lysine | Sigma-Aldrich | Cat# P6407 | |
| Chemical compound, drug | B-27 | Thermo Fisher Scientific | Cat# 17504044 | |
| Chemical compound, drug | Fish skin gelatin | Sigma-Aldrich | Cat# G7765 | |
| Chemical compound, drug | Nocodazole | Sigma-Aldrich | Cat# SML1665 | |
| Chemical compound, drug | Latrunculin A | Merck | Cat# 428026 | |
| Chemical compound, drug | (S)-nitro-Blebbistatin | Cayman Chemical | Cat# 85692575–2 | |
| Chemical compound, drug | JF549-Halo Tag Ligand | Janelia Research Campus Grimm et al., 2017 | ||
| Sequence-based reagent | Mutagenesis primer one to insert AgeI site in Nfasc cDNA | Integrated DNA Technologies | This paper | GAATGAGCTGACCGGTCAACCCCCAACTATCAC |
| Sequence-based reagent | Mutagenesis primer two to insert AgeI site in Nfasc cDNA | Integrated DNA Technologies | This paper | GGGGGTTGACCGGTCAGCTCATTCTGAATGCTTG |
| Sequence-based reagent | Mutagenesis primer one to generate Nfasc186YA | Integrated DNA Technologies | This paper | AAGGAGCCATCTTCATTG |
| Sequence-based reagent | Mutagenesis primer two to generate Nfasc186YA | Integrated DNA Technologies | This paper | TATTGGCCAGGCCACTGTCAAAAAG |
| Sequence-based reagent | Dendra2-HindIII-fwd | Integrated DNA Technologies | This paper | AAAAAGCTTGGAGGAACCATGAACACCCCGGGAATTAACC |
| Sequence-based reagent | Dendra2-SalI-rev | Integrated DNA Technologies | This paper | TTTGTCGAC TCACCACACCTGGCTGGGCA |
| Software, algorithm | FIJI | Schindelin et al., 2012 | RRID:SCR_002285 | https://imagej.net/Fiji |
| Software, algorithm | Prism 6.0 | GraphPad | RRID:SCR_002798 | |
| Software, algorithm | KymoTool Box | Zala et al., 2013 | Frédéric Saudou, University of Grenoble Alpes |
Additional files
Download links
A two-part list of links to download the article, or parts of the article, in various formats.
Downloads (link to download the article as PDF)
Open citations (links to open the citations from this article in various online reference manager services)
Cite this article (links to download the citations from this article in formats compatible with various reference manager tools)
Neurofascin and Kv7.3 are delivered to somatic and axon terminal surface membranes en route to the axon initial segment
eLife 9:e60619.
https://doi.org/10.7554/eLife.60619


