Simultaneous quantification of mRNA and protein in single cells reveals post-transcriptional effects of genetic variation
- Department of Genetics, Cell Biology and Development, University of Minnesota, United States
Figures
Figure 1 with 2 supplements
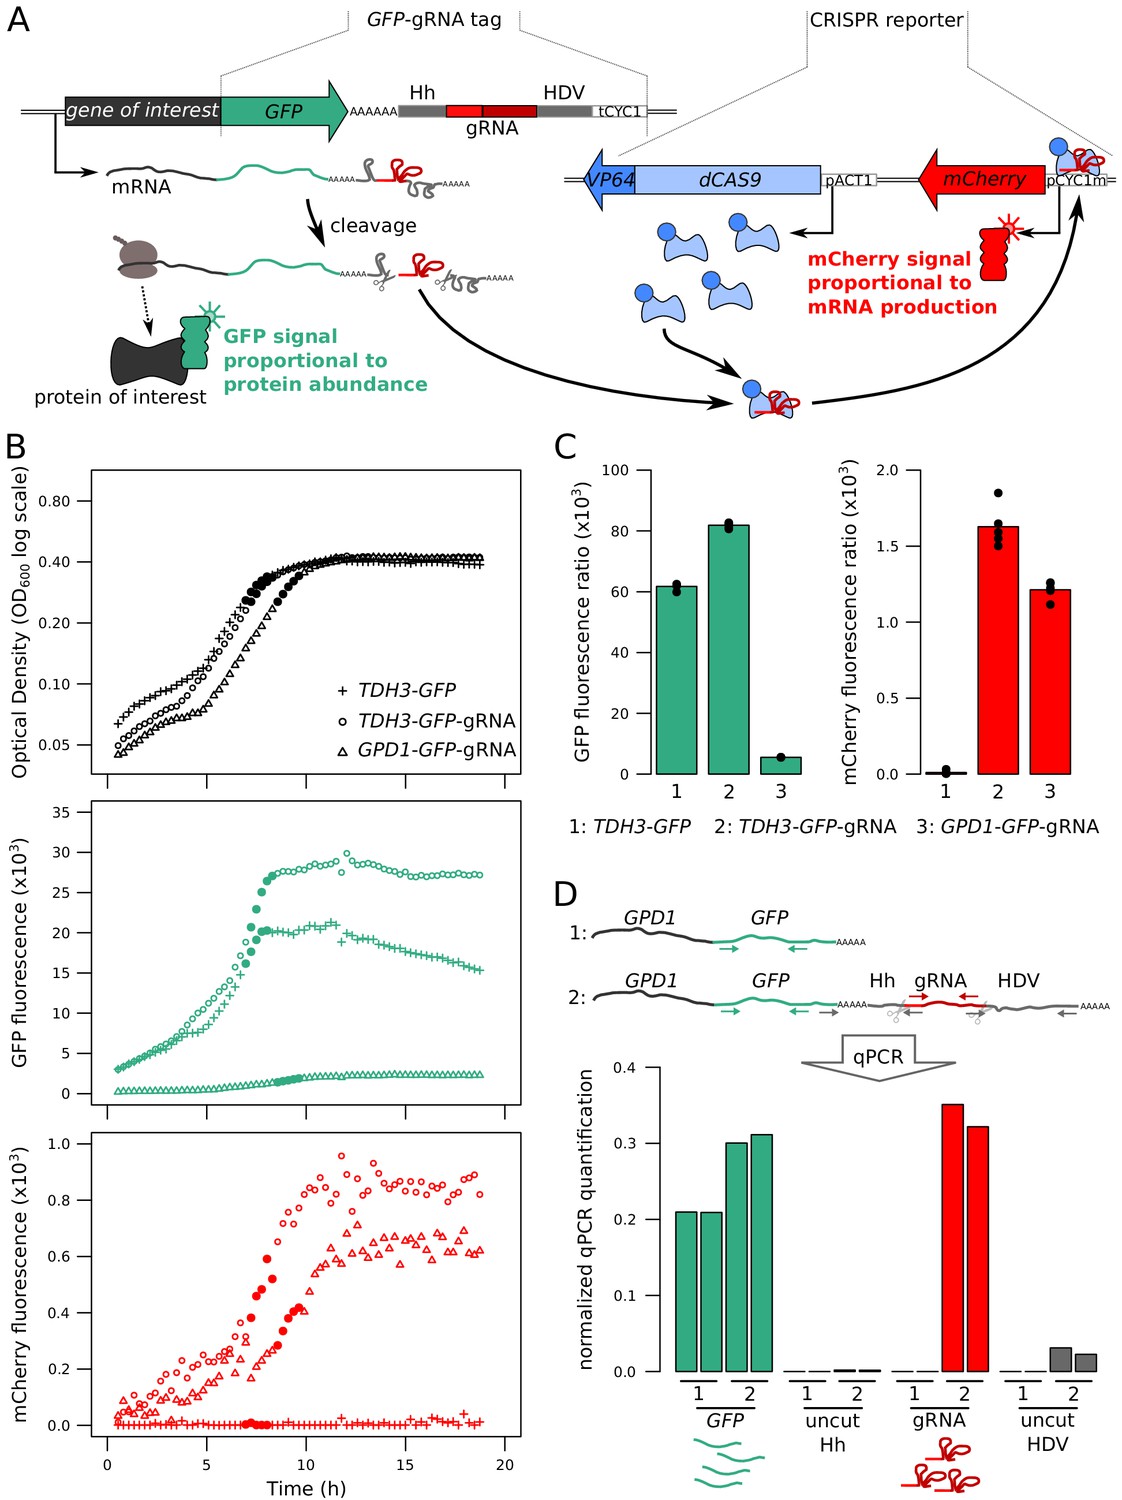
Fluorescence-based quantification of mRNA and protein levels.
(A) Schematic of the dual quantification reporter. Hh: Hammerhead ribozyme, HDV: Hepatitis Delta Virus ribozyme, tCYC1: terminator sequence from the CYC1 gene, VP64: four consecutive sequences encoding viral protein transcription activators VP16, pACT1: promoter sequence from the ACT1 gene, pCYC1m: modified promoter sequence from the CYC1 gene without baseline transcriptional activity. Plasmids implementing the reporter are shown in Figure 1—figure supplement 1. (B) Time courses of cell density and fluorescence measurements for three tagged strains during 20 hr of growth on a plate reader. Filled symbols correspond to five measurements at the end of the exponential growth phase that were used for calculating fluorescence ratios for strain comparisons in the same physiological context as shown in panel C. (C) Fluorescence ratios (fluorescence / OD600) for the three strains shown in panel B. The points show the fluorescence ratios for the five measurements shown as filled circles in panel B. (D) RNA quantification of the individual components of the tag, for TDH3-GFP and TDH3-GFP-gRNA by RT-qPCR. The two bars per strain show biological replicates. Normalized qPCR quantifications were calculated separately for each primer pair based on calibration with known template DNA amounts (Figure 1—figure supplement 2). For these pilot experiments, cells were grown in YNB glutamate medium. For experiments in B – D, the CRISPR reporter was inserted at NPR2.
Figure 1—figure supplement 1
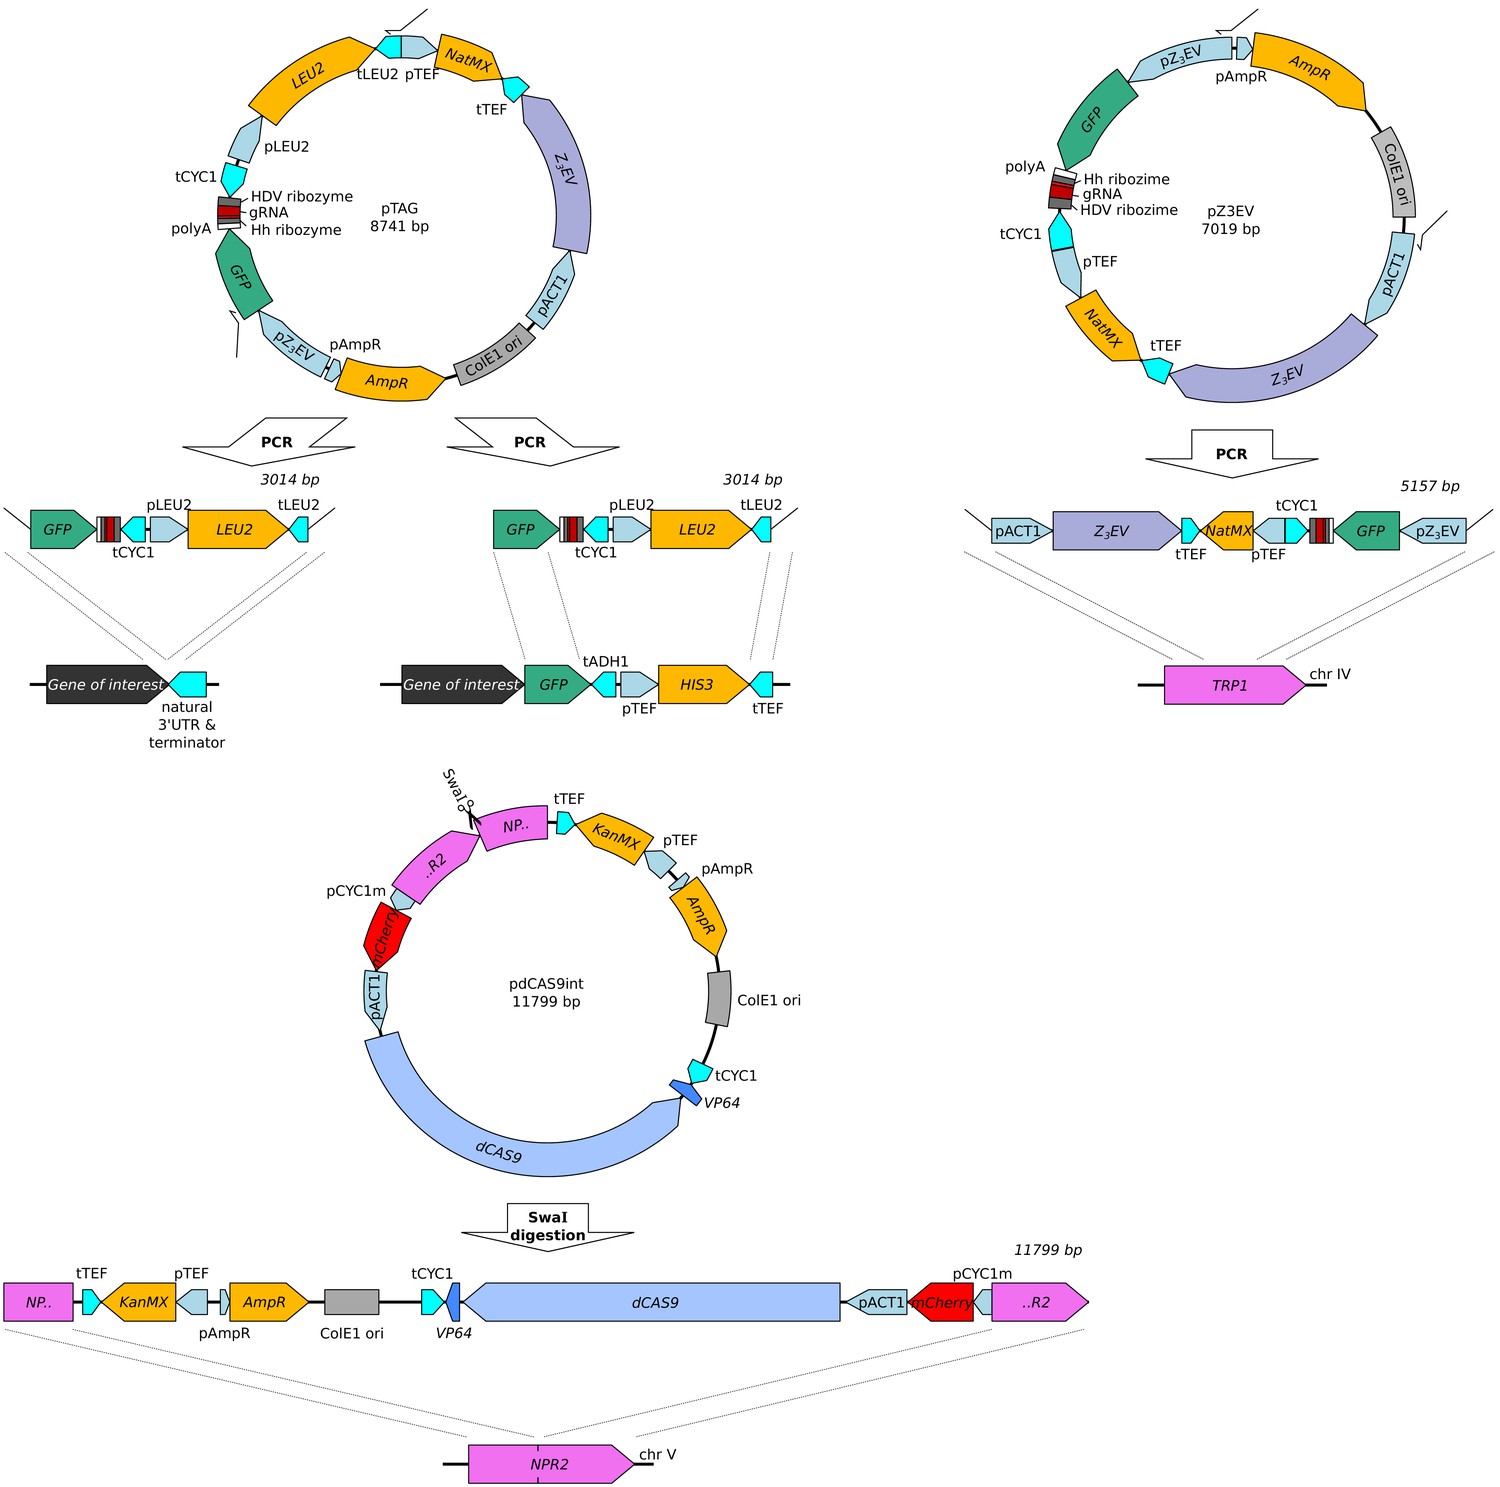
Plasmids carrying the two reporter cassettes (top: GFP-gRNA tag, middle: CRISPR reporter) and the Z3EV construct (bottom).
For each plasmid, the figure shows the plasmid map, the linear segment used in transformation, and integration sites in the genome used in this paper. The GFP-gRNA tag was added either directly after an untagged gene of interest using gene specific primers (Supplementary file 3, tagged genes: CYC1, OLE1, TPO1, CTS1, and RPS10A), or added to a gene already tagged with GFP from the GFP collection (primers OFA0046 and OFA0363 in Supplementary file 3, tagged genes: ARO8, BMH2, GPD1, MTD1, UGP1, and TDH3). These plasmids are available on AddGene under IDs #157656, #157658, and #157659.
Figure 1—figure supplement 2

qPCR calibration plot for the four primer pairs, using a range of known DNA concentrations.
Figure 2 with 4 supplements
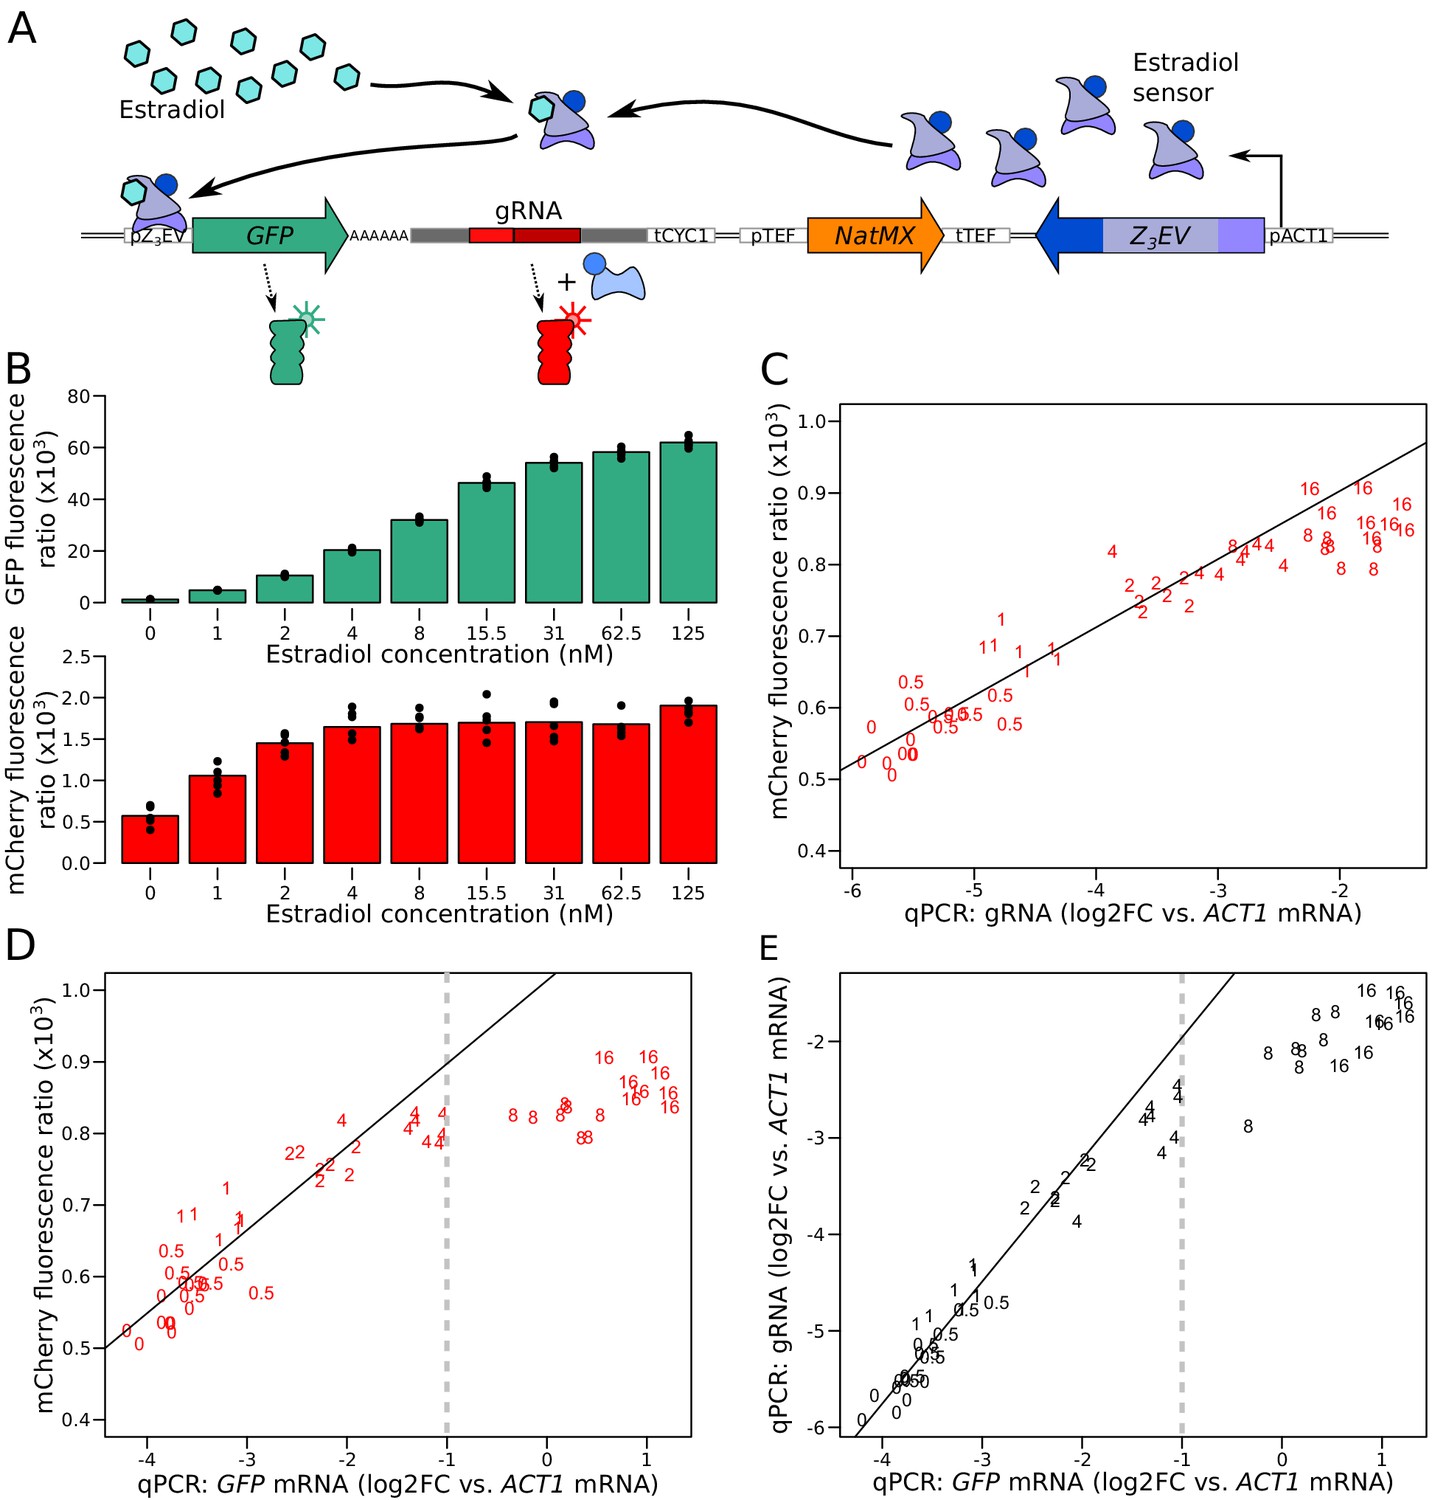
Characterization of the quantitative response of the reporter using an inducible transcriptional activator system to tune the expression of a GFP gene tagged with the gRNA.
(A) Schematic of the Z3EV system used in this experiment. (B) Fluorescence as a function of increasing estradiol concentrations. (C) Comparison of gRNA abundance (qPCR) and mCherry fluorescence in increasing estradiol concentrations. qPCR quantifications were normalized across samples using ACT1 cDNA as a reference. log2FC: log2 of fold-change (D) Comparison of mRNA abundance (qPCR) and mCherry fluorescence in increasing estradiol concentrations. (E) Comparison of mRNA abundance to gRNA abundance in increasing estradiol concentrations. The numbers in C to E show the concentration of estradiol in mM, with 7 to 8 biological replicates per concentration. Solid lines represent linear regressions calculated on measurements taken at up to 2 mM estradiol. Dashed vertical lines correspond to the mRNA abundance threshold, below which we deemed the reporter to be quantitative. Cells were grown in SC medium. See also Figure 2—figure supplement 1, Figure 2—figure supplement 2, Figure 2—figure supplement 3, Figure 2—figure supplement 4.
Figure 2—figure supplement 1
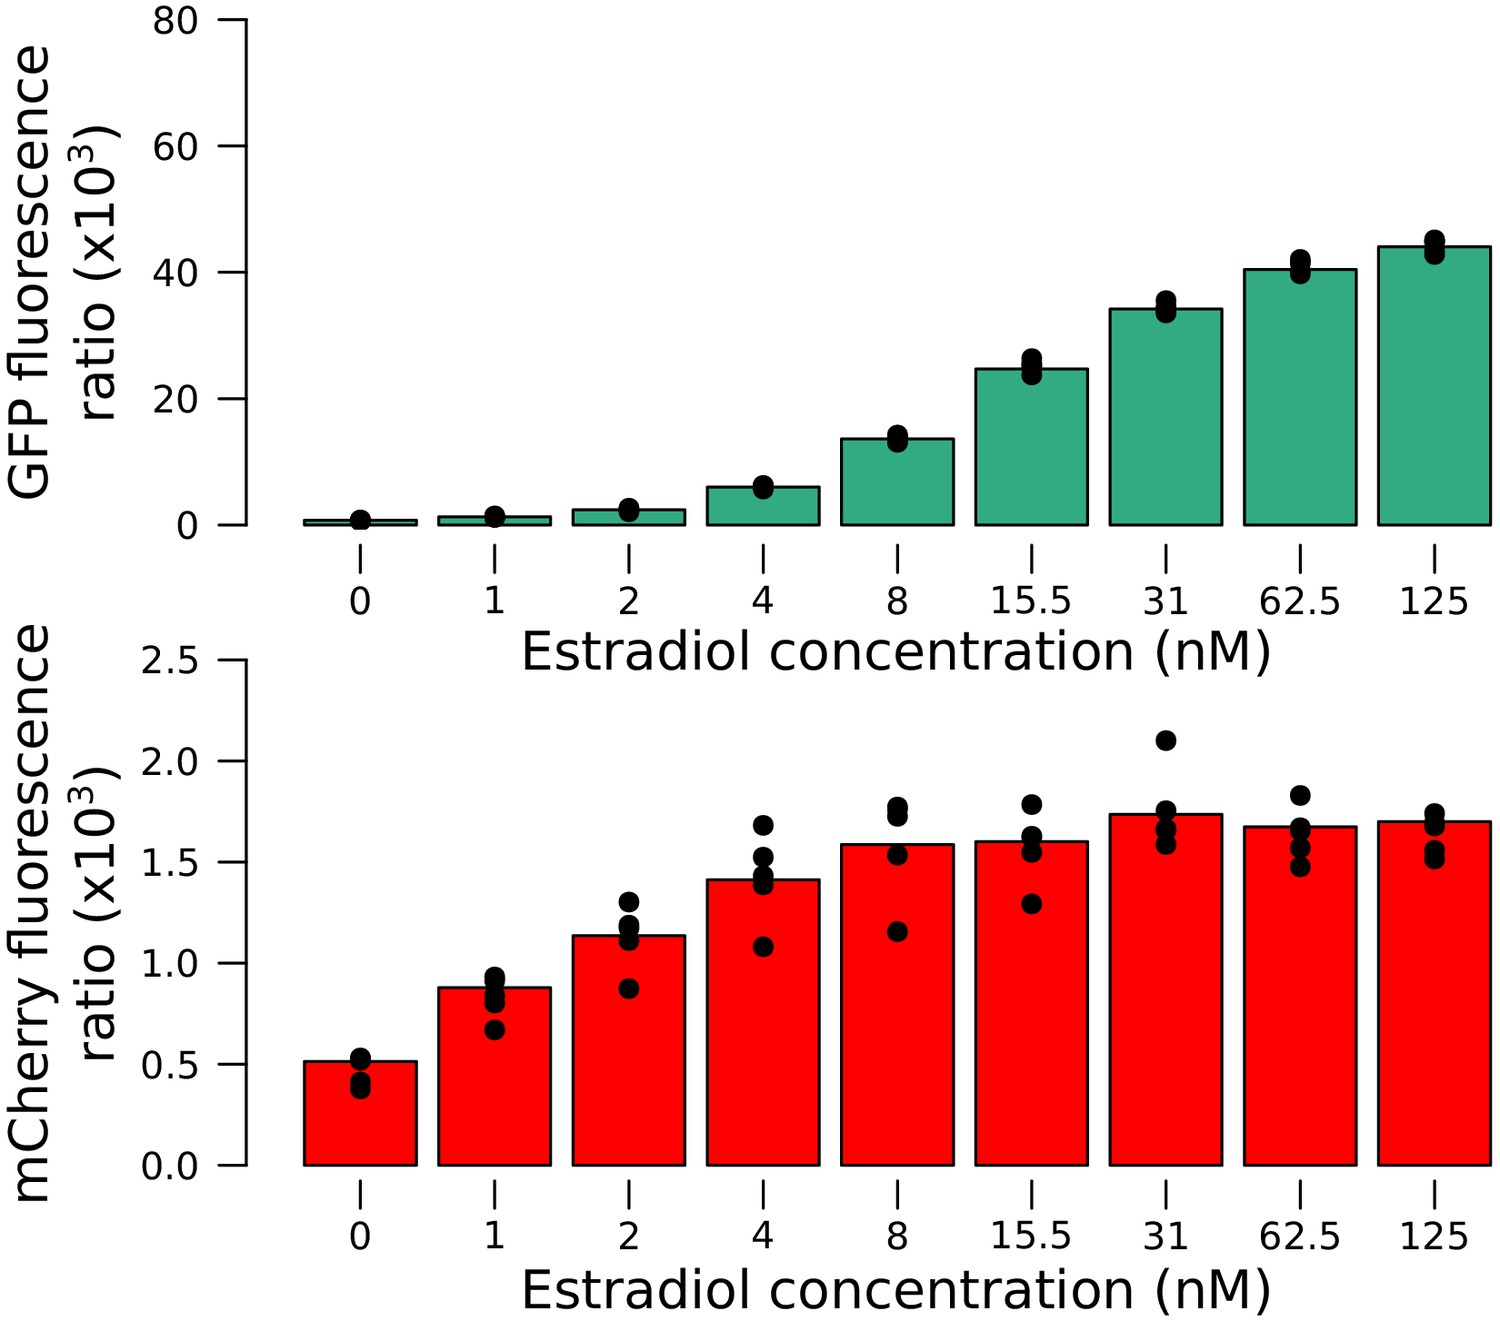
Quantitative response of the reporter measured using the Z3EV system in an RM strain.
Increasing concentrations of estradiol drove higher expression of the tagged gene. Values correspond to the fluorescence ratio at the end of the exponential growth phase. Cells were grown in SC medium.
Figure 2—figure supplement 2
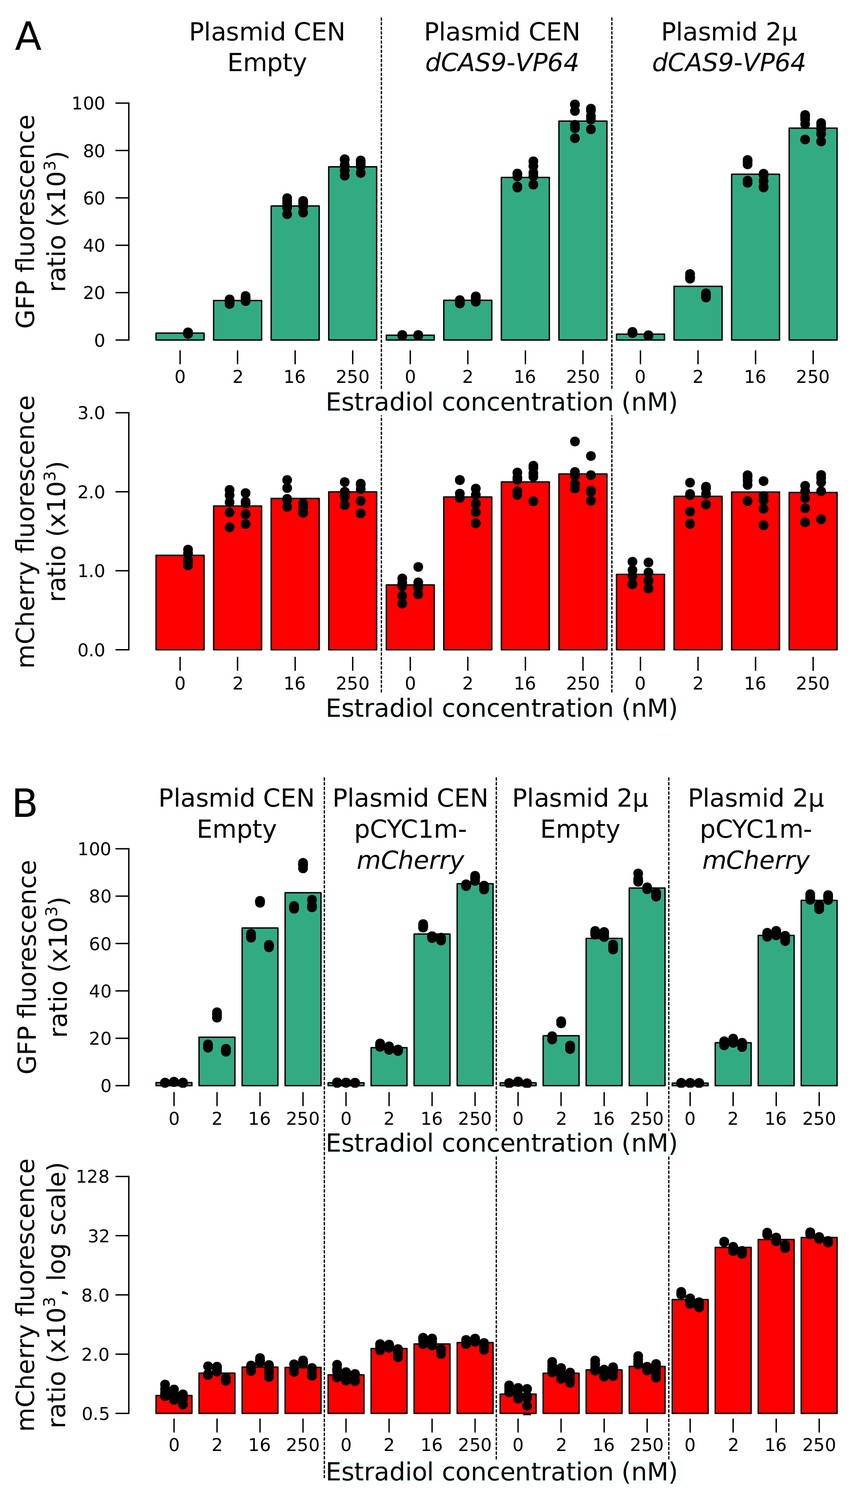
mCherry and GFP expression as a function of additional reporter component copies in a range of estradiol concentrations.
(A) Additional copies of the dCAS9-Vp64 gene using a low-copy number (CEN) or a high-copy number (2µ) plasmid affected neither GFP nor mCherry expression. Two replicates per condition are shown as stacked columns of points, each with five points that show the values at the time points at which measurements were taken. (B) Additional copies of mCYC1p-mCherry increased red fluorescence in all concentrations of estradiol, but did not extend the linear range of mCherry expression. Three replicates per condition. Cells were grown in SC medium.
Figure 2—figure supplement 3
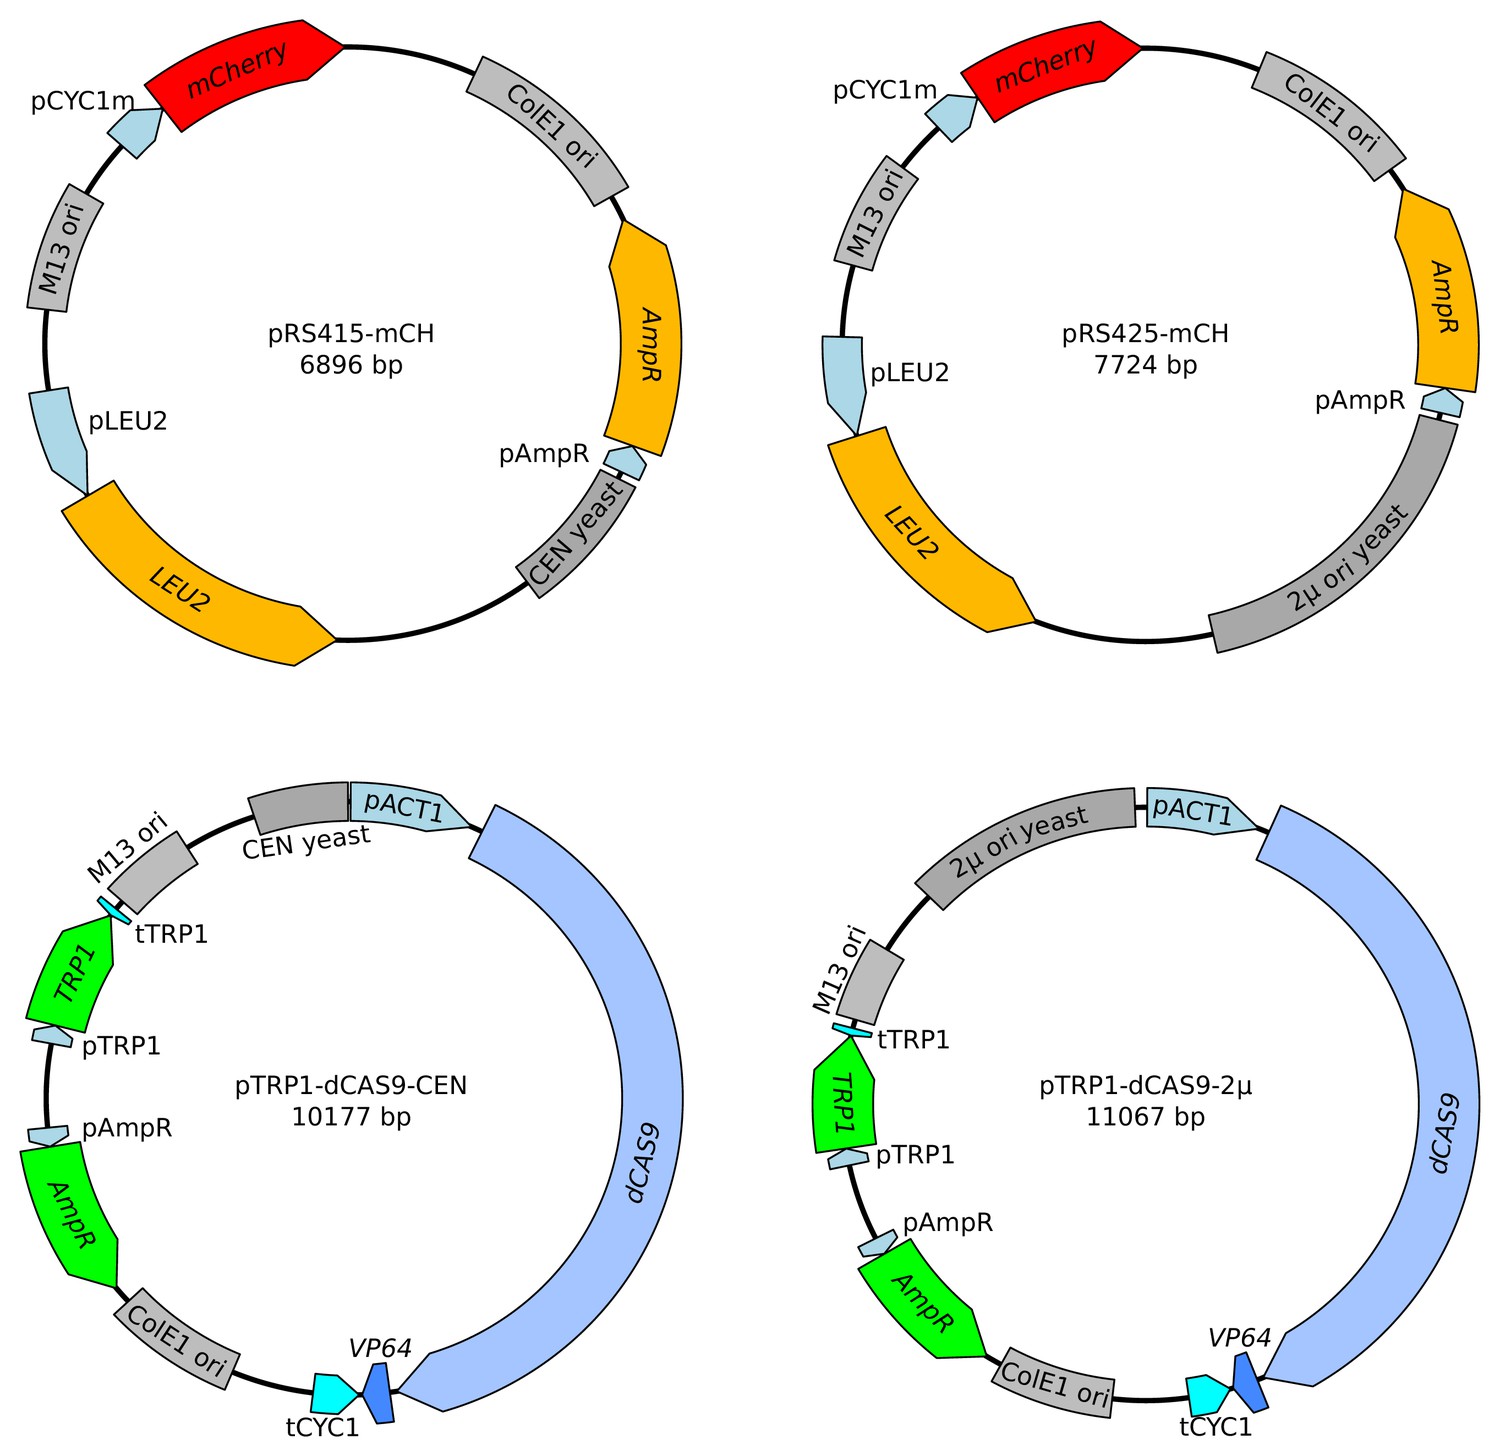
Maps of the four plasmids used to investigate reporter behavior.
The two plasmids on the top increase the copy number of gRNA binding sites (pCYC1m) and of the mCherry gene. The two plasmids on the bottom increase the copy number of dCAS9-VP64.
Figure 2—figure supplement 4
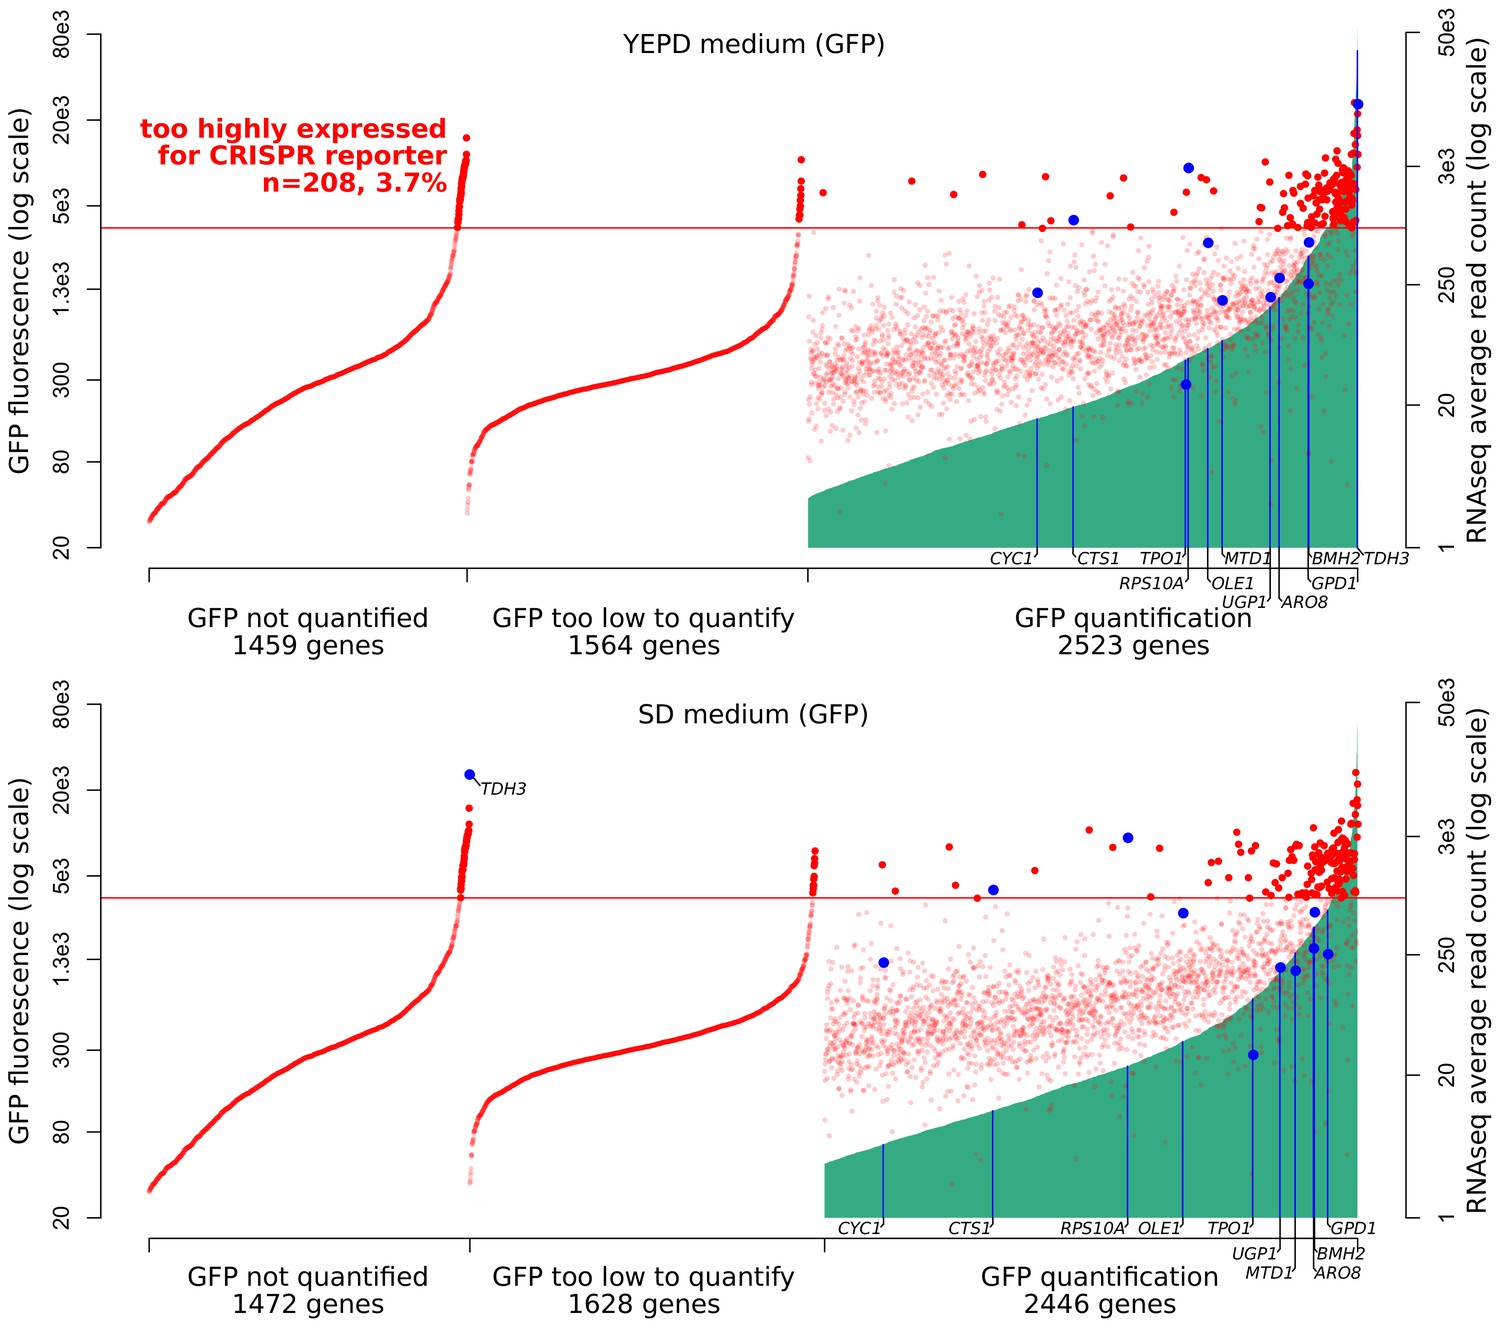
Expression ranges of S. cerevisiae genes.
On the x-axis, 5546 genes were ordered using two measures of expression. First, genes were ordered on the basis of published GFP fluorescence values (Newman et al., 2006) (green vertical lines). About half of the genes in the genome had available quantifications. Top panel: GFP measures in YEPD medium, bottom: SD medium. Second, genes were ordered on the basis of mRNA abundance in YNB medium as determined by RNA sequencing (red dots, data are averaged across 1,012 BY/RM segregants reported in Albert et al., 2018). Genes examined in the present study are indicated in blue. The red horizontal line indicates the estimated threshold below which mRNA abundance of a gene can be quantified by the CRISPR reporter.
Figure 3 with 3 supplements
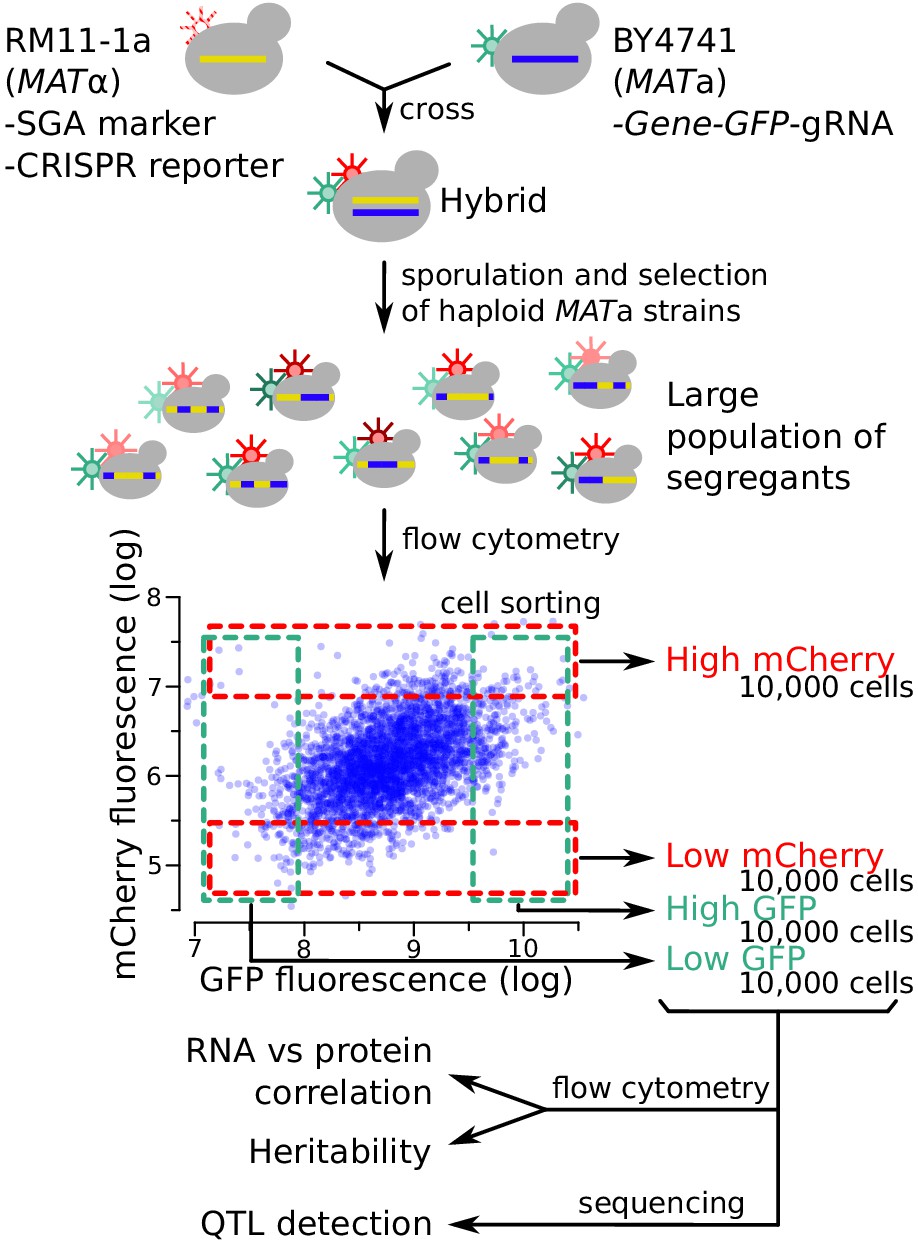
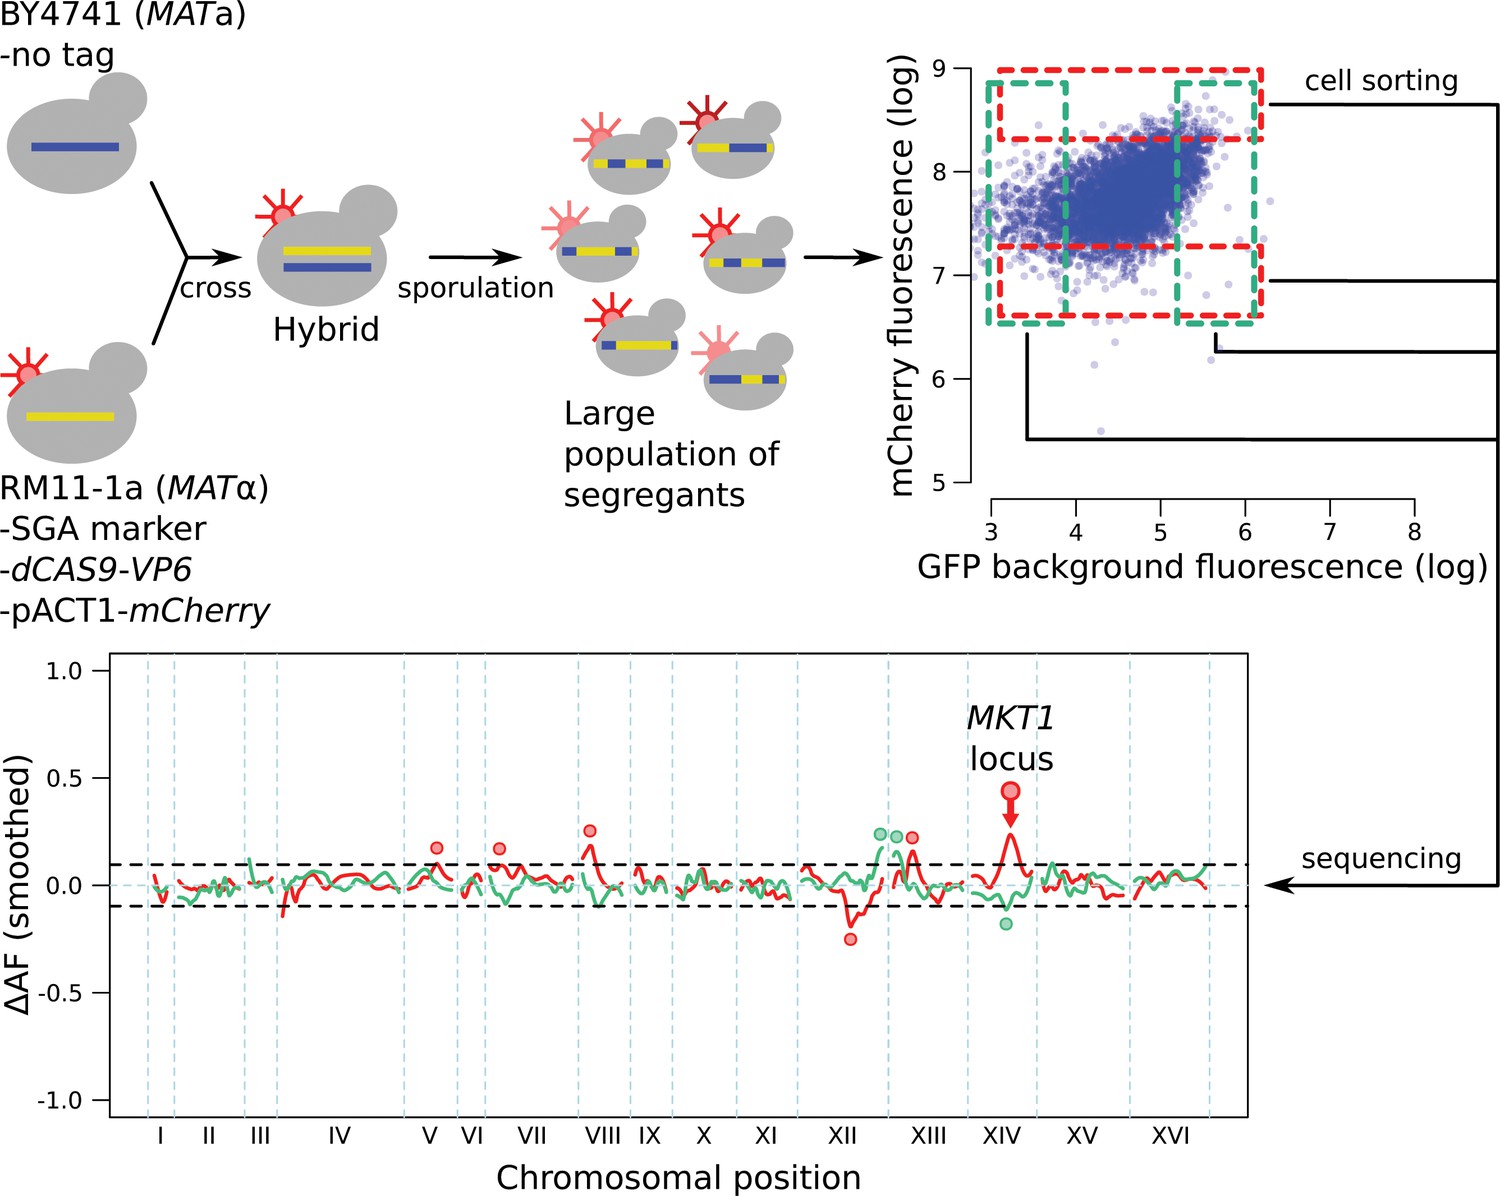
Schematic of the workflow for the identification of RNA-QTLs and protein-QTLs.
The SGA marker allows for the selection of haploid MATa strains after sporulation (Methods). The flow cytometry plot shows data transformed using the natural log. See also Figure 3—figure supplement 1, Figure 3—figure supplement 2 & Figure 3—figure supplement 3.
Figure 3—figure supplement 1
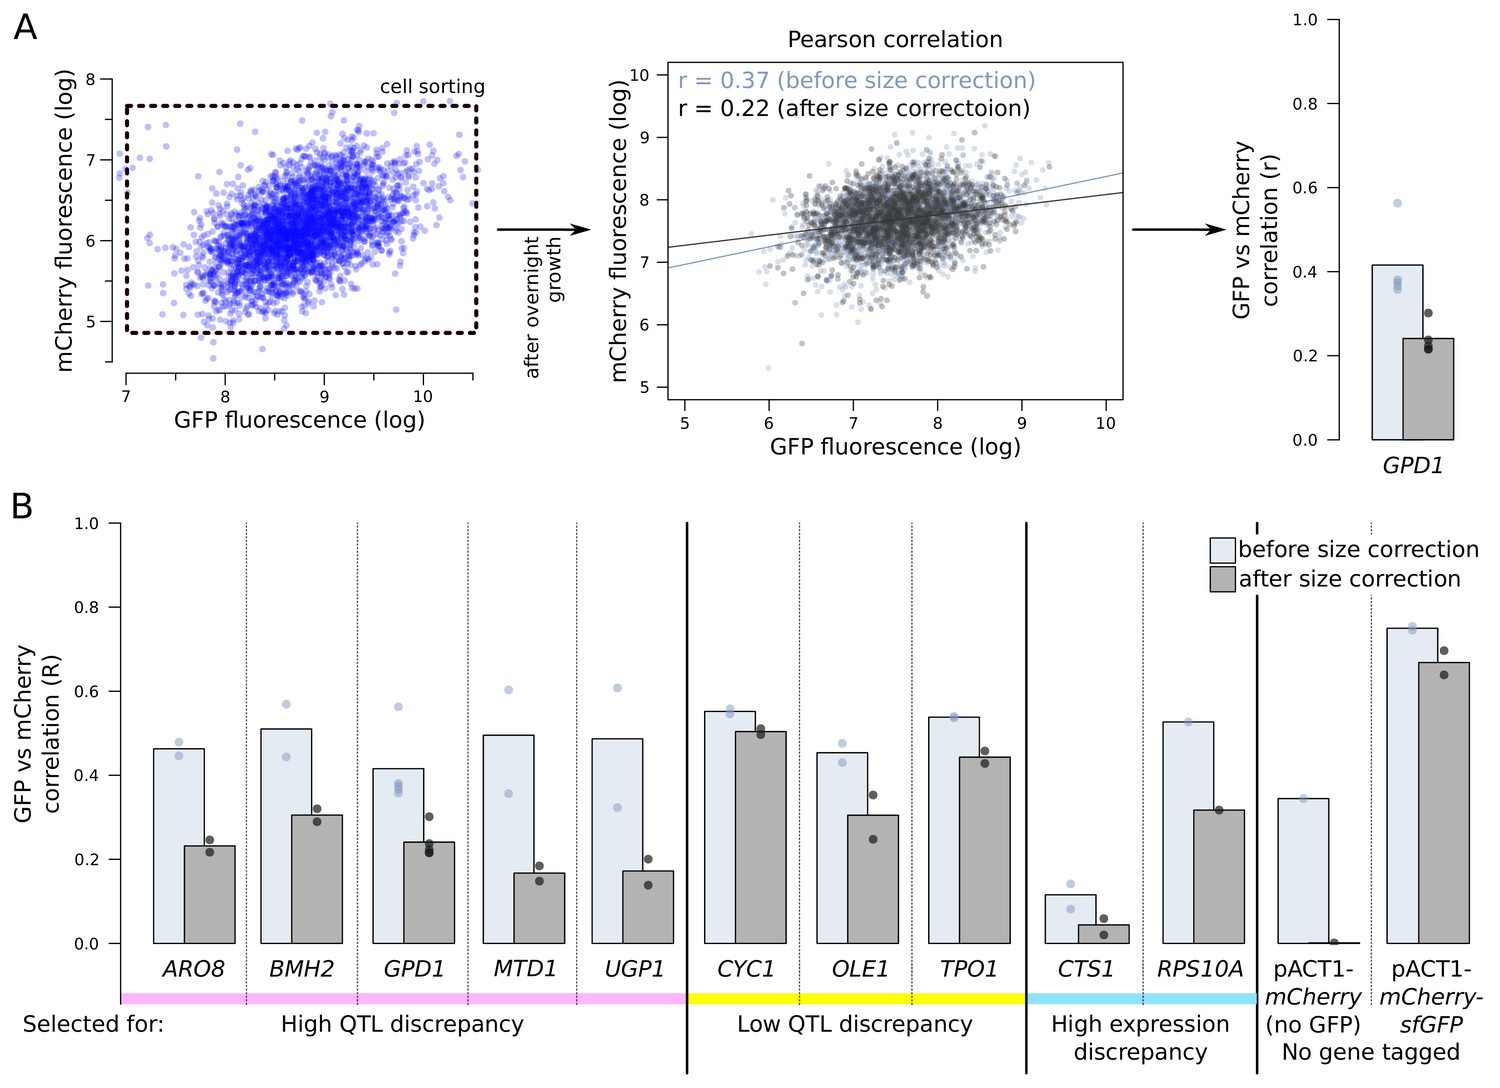
mCherry and GFP fluorescence correlations.
(A) Following overnight growth after sorting, segregant populations were analysed by flow cytometry. We calculated mRNA and protein abundance correlations (Pearson’s r) with and without correction for cell size (see Figure 3—figure supplement 2). (B) Genes with higher reported discrepancies between mRNA-QTLs and protein-QTLs tended to show lower correlation between mRNA (mCherry) and protein (GFP) abundance than genes with more similar prior QTL results. We used two controls. First, in a segregant population with no gene tagged and with mCherry under the control of a constitutive ACT1 promoter (see Figure 4—figure supplement 2), we expected no mCherry/GFP correlation. Second, a segregant population expressing a protein fusion of mCherry and GFP under control of the ACT1 promoter provided an upper bound for the possible mCherry/GFP correlation.
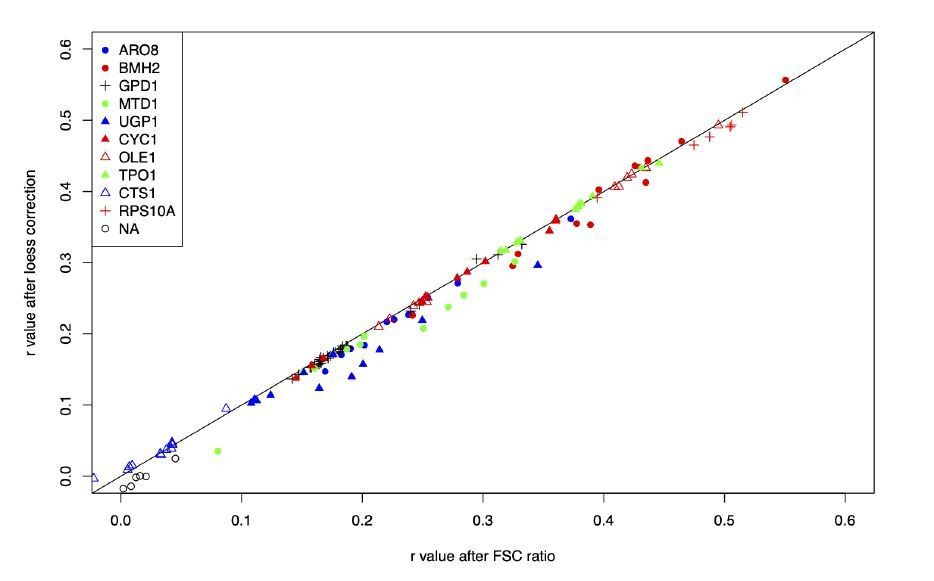
Figure 3—figure supplement 2
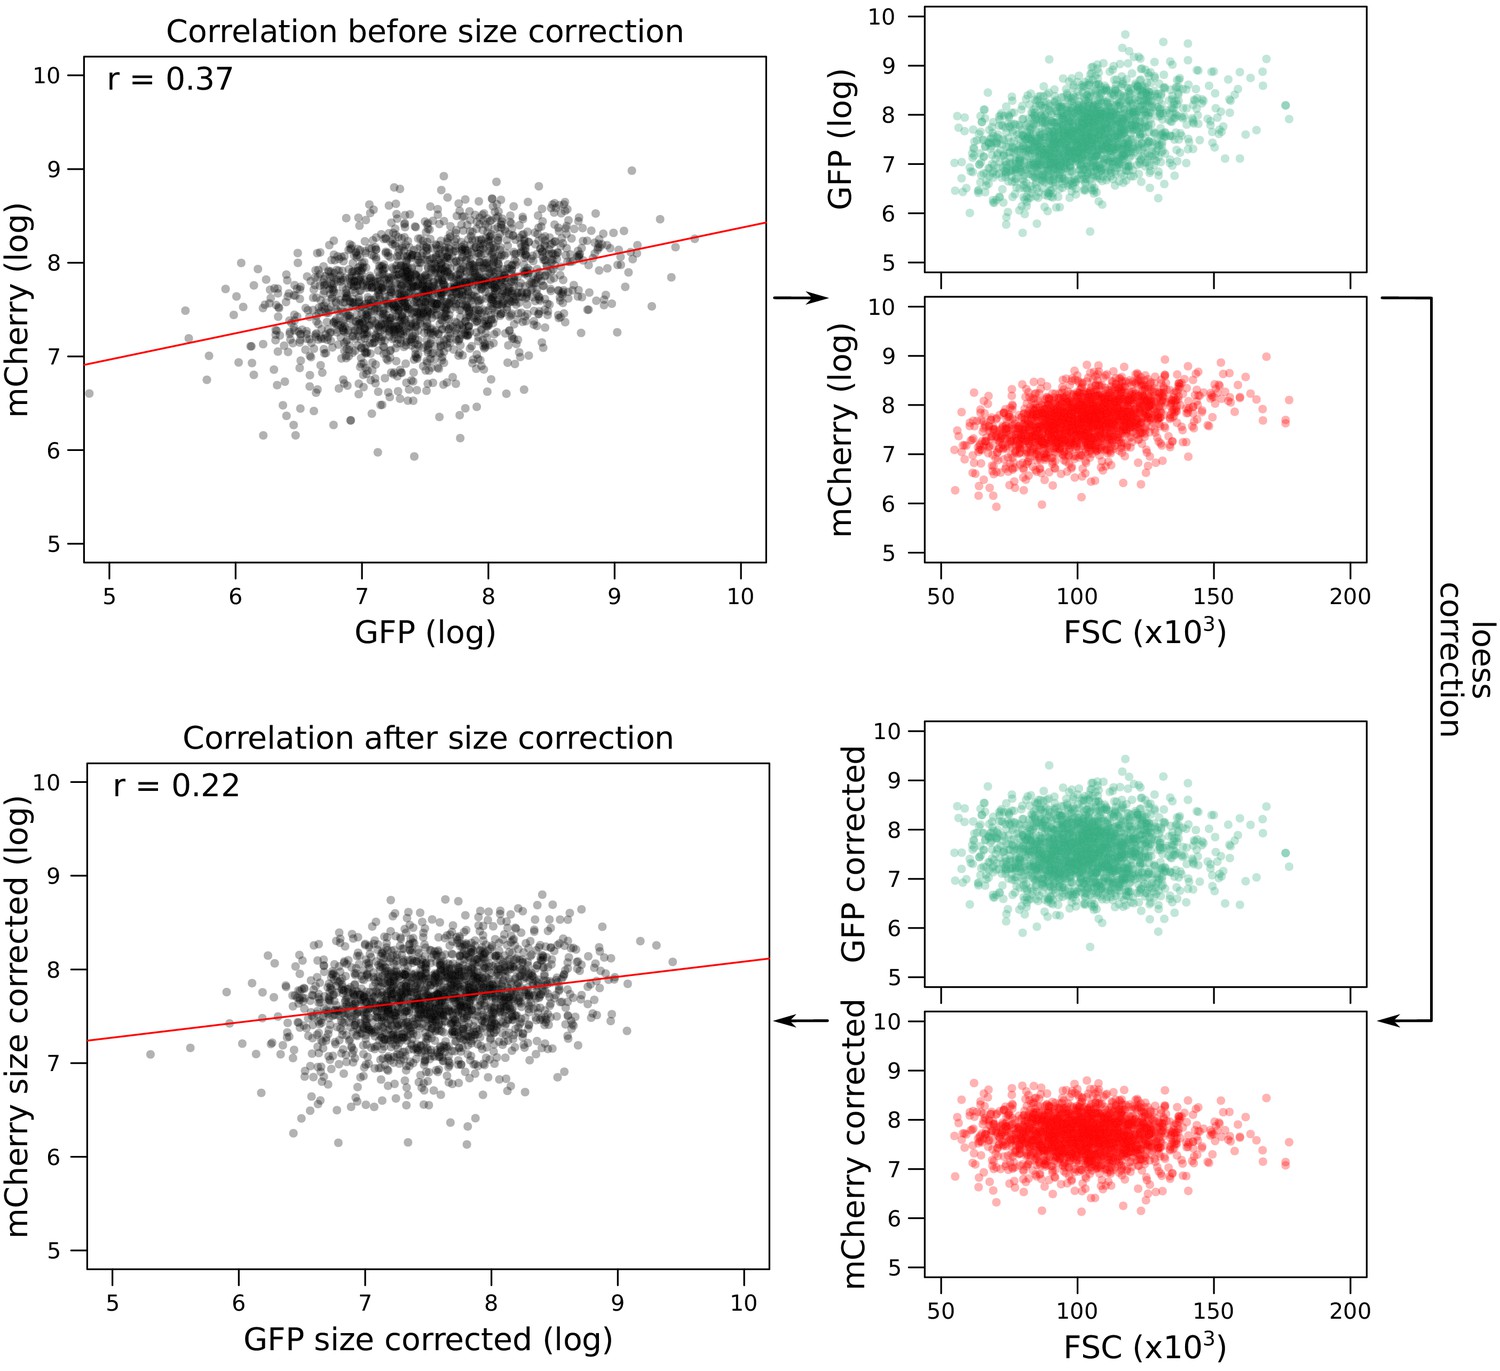
Correction of fluorescence measures for cell size to prevent spurious correlations between mCherry and GFP due to shared correlations with cell size.
As an example, the figure shows data from GPD1-GFP-gRNA.
Figure 3—figure supplement 3

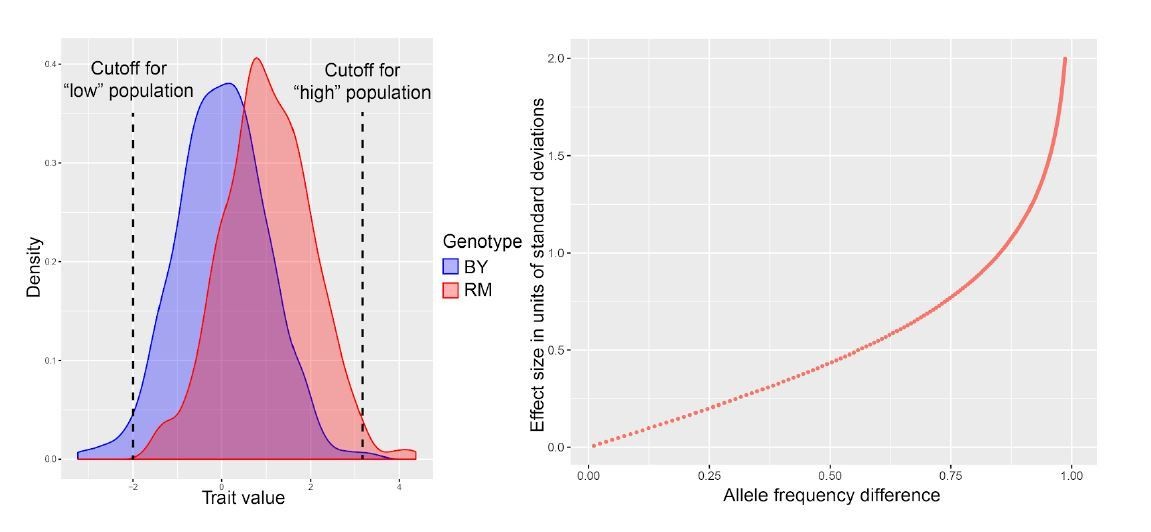
Heritability of mCherry and GFP fluorescence.
(A) Flow cytometry measures of high and low populations after overnight growth. The difference of fluorescence means (Δ means) between the high and low populations that is retained after multiple generations of growth reflects how much of the variation among single cells is due to genetic variation. When measuring the same fluorophore used to collect extreme cells, Δ means reflects the heritability of that fluorophore. When measuring the other fluorophore than that used in sorting (e.g., measuring GFP in a pair of populations that had been sorted based on different mCherry levels), Δ means reflects the genetic correlation between mRNA and protein. (B) Significant heritability was observed for all fluorescent measures across genes, except for GFP in CTS1. Genes with higher reported discrepancies between mRNA-QTLs and protein-QTLs tended to have lower genetic correlations between mRNA and protein than genes with more concordant prior QTL results. Bar plots of Δ means are square root transformed to visually emphasize smaller values. Empty dots correspond to non-significant differences. Filled dots indicate significant differences at a t-test p-value threshold of 10−5.
Figure 4 with 2 supplements
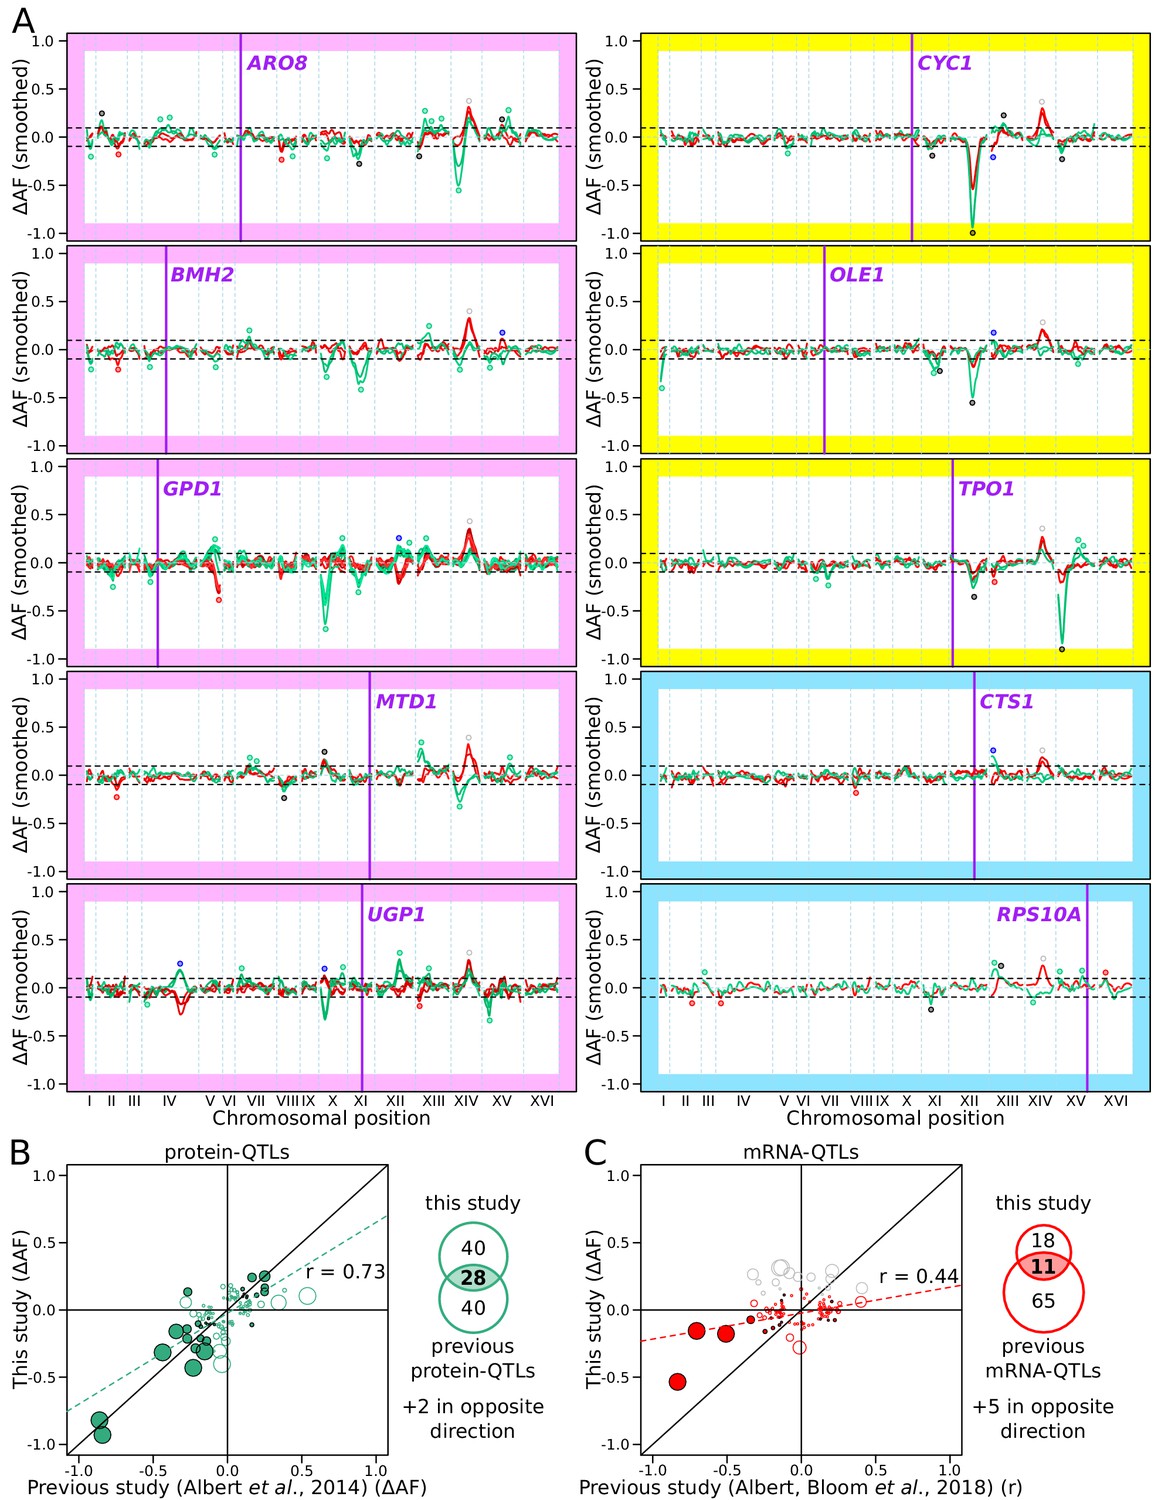
RNA-QTLs and protein-QTLs.
(A) Allele frequency difference along the genome between the high and low population for each of the ten tagged genes, with 1–6 replicates per gene. Red and green curves correspond to the populations sorted to map mRNA and protein levels, respectively. The colored plot borders indicate the reason for which the gene was chosen for study. Pink: high discrepancy between reported eQTLs and pQTLs, yellow: high similarity between reported eQTLs and pQTLs, blue: high mRNA level and low GFP fluorescence. Purple vertical lines indicate the position of the tagged gene in the genome. Points indicate the location of significant QTLs, color coded based on protein or mRNA specificity (black: shared effect in same direction, green: protein-specific, red: mRNA-specific, blue: discordant). (B) Comparison between the effect size (ΔAF) of protein-QTLs identified in this study and pQTLs from previous work. (C) Same as (B) but comparing mRNA-QTLs identified in this study (ΔAF) to trans-eQTLs from previous work (eQTL effect sizes from Albert et al., 2018 are shown as a Pearson correlation coefficient between mRNA abundance and genotype at the QTL marker). Filled circles correspond to QTLs significant in both datasets. Empty circles correspond to QTLs significant in only one dataset. Gray circles correspond to QTLs located on chromosome XIV between 350 and 550 kb, which were excluded from analysis. Circle size is proportional to the LOD score of the QTL. The Venn diagrams show the total number and overlap of QTLs detected across the 10 genes between studies. See also Figure 4—figure supplement 1 & Figure 4—figure supplement 2. Source data files: Figure 4—source data 1, Figure 4—source data 2, Figure 4—source data 3.
-
Figure 4—source data 1
List of all detected QTLs (LOD score >3.0) before combining replicates.
- https://cdn.elifesciences.org/articles/60645/elife-60645-fig4-data1-v2.xlsx
-
Figure 4—source data 2
Comparison of significant protein-QTLs (LOD score >4.5) between this study and previous work (Albert et al., 2014a; used in Figure 4B).
- https://cdn.elifesciences.org/articles/60645/elife-60645-fig4-data2-v2.xlsx
-
Figure 4—source data 3
Comparison of significant mRNA-QTLs (LOD score >4.5) between this study and previous work (Albert et al., 2018 used in Figure 4C).
- https://cdn.elifesciences.org/articles/60645/elife-60645-fig4-data3-v2.xlsx
Figure 4—figure supplement 1
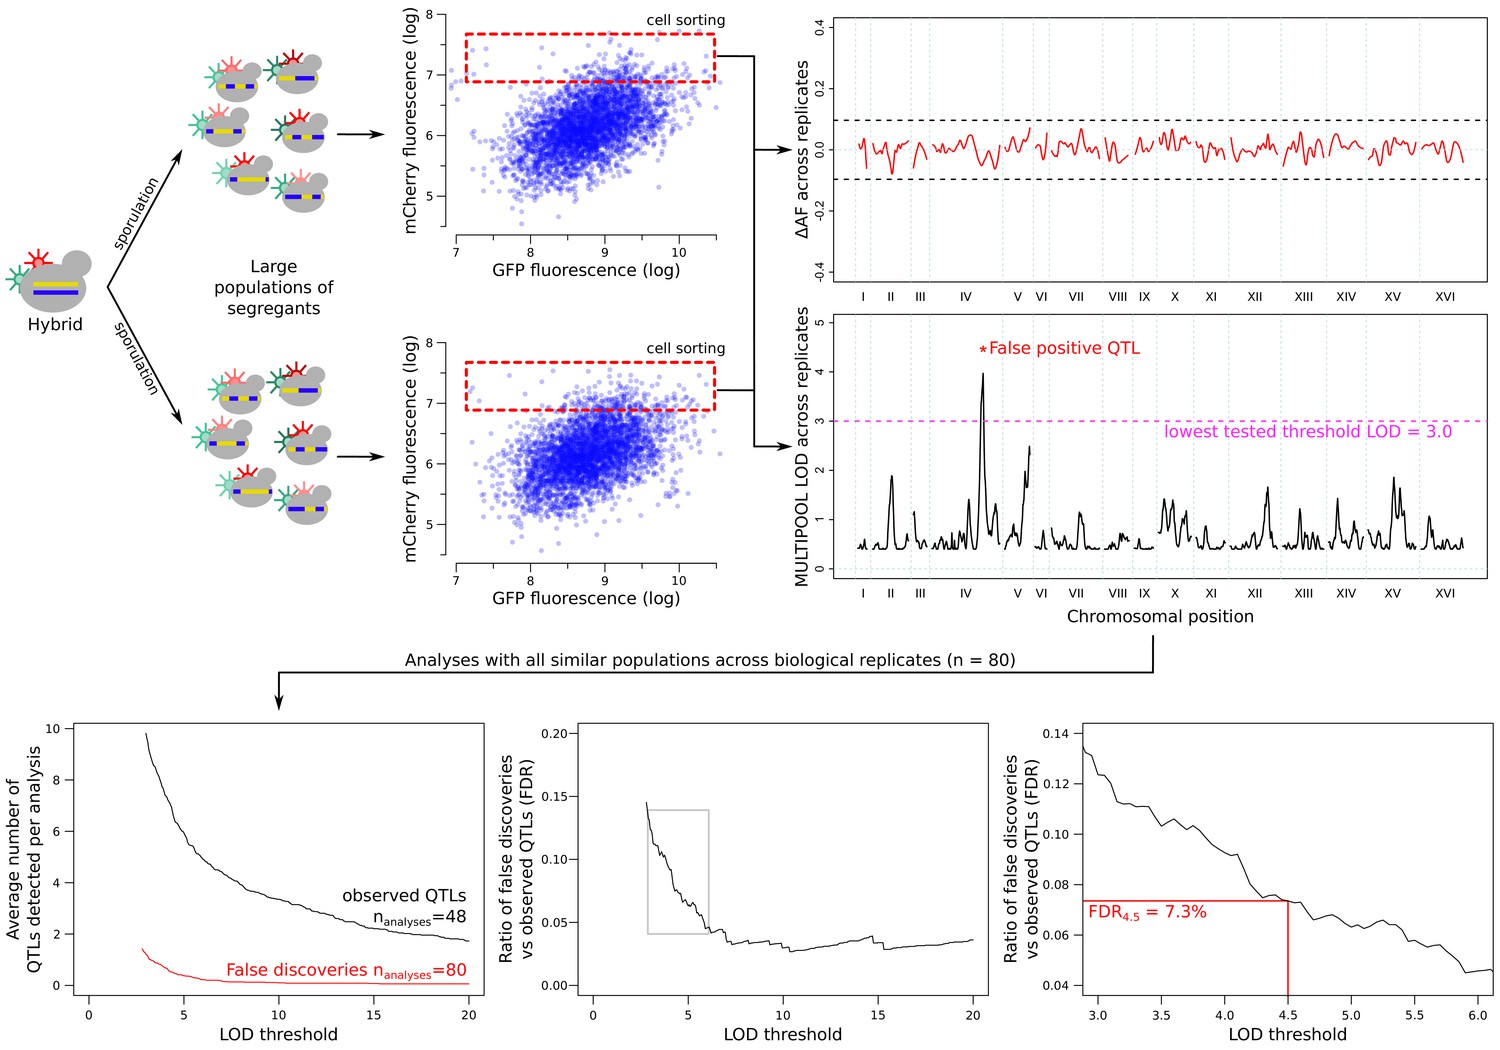
Estimation of the false discovery rate (FDR) from comparisons across replicated sort experiments.
Allele frequencies were compared between replicate populations collected using the same sort gates. The example shown here is based on data from the GPD1 gene. Any QTLs between these populations were considered to be false discoveries. Increasing the LOD threshold reduced both the number of observed QTLs (from the high vs low population comparisons) and false QTLs (from the comparison of the same population type across replicates). FDR was calculated as a function of the LOD threshold (thr): FDRthr = (NrepQTLthr/Nrep) / (NfluoQTLthr/Nfluo), where NrepQTLthr is the number of QTLs that exceeded a LOD threshold of thr (false discoveries), Nrep is the number of inter-replicate comparisons (Nrep = 80), NfluoQTLthr is the number of significant fluorescence QTLs (GFP or mCherry) at a LOD threshold of thr, and Nfluo is the number of high-low fluorescence comparisons (Nfluo = 48; excluding the control experiment in which no gene was tagged; Figure 4—figure supplement 2). The threshold of LOD = 4.5, which corresponded to an FDR of 7.3%, is indicated in the figure.
Figure 4—figure supplement 2
Control mapping experiment, in which no gene was tagged with GFP or the gRNA, and in which the mCherry gene was under control of a constitutively active pACT1 promoter sequence.
The highlighted mCherry QTL on chromosome XIV, which overlaps the MKT1 locus, was also present in all experiments with tagged genes (Figure 4), where it always had the same direction of effect as in this control experiment. While the highly pleiotropic MKT1 locus (Albert et al., 2018) could truly influence all ten genes we studied, we cannot rule out that this locus may affect mCherry fluorescence independently of the gRNA. We therefore excluded QTLs from tagged genes in this region from our analysis. We did not exclude the remaining mCherry QTLs visible in the figure because these loci were not uniformly present for tagged genes. These loci could represent trans-acting influences on the ACT1 promoter sequence that drives mCherry expression in this control experiment, but not in experiments with tagged genes under the control of their native promoters. The control experiment also identified three loci that affected GFP background fluorescence, likely by altering cellular abundance of autofluorescent compounds such as NAD, aromatic amino acids, or flavins. The intensity of this autofluorescence was much lower than the GFP signal for the genes we studied (see for example Figure 3—figure supplement 2 and Figure 4—figure supplement 1), such that in those experiments, the signal from the GFP gene tags dominates over background fluorescence.
Figure 5 with 1 supplement
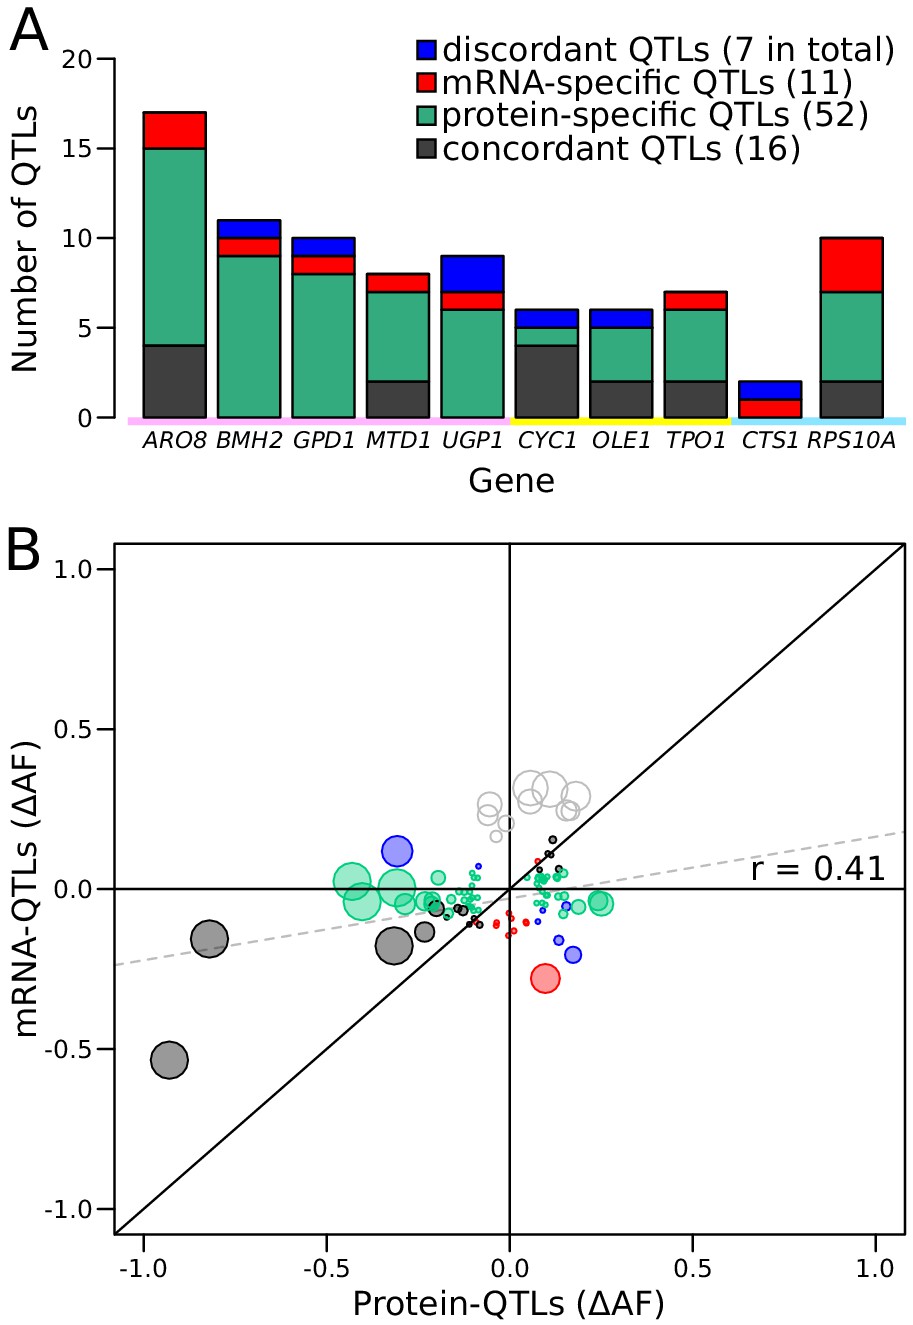
Comparison of RNA-QTLs and protein-QTLs.
(A) Number of QTLs for each tagged gene, color coded according to type of effect on RNA and/or protein. (B) Comparison of QTL effect sizes between mRNA-QTLs and protein-QTLs. Gray circles correspond to QTLs located on chromosome XIV 350–550 kb, which were excluded from analysis. Circle size is proportional to the LOD score of the QTL. See also Figure 5—figure supplement 1. Source data files: Figure 5—source data 1, Figure 5—source data 2.
-
Figure 5—source data 1
List of tagged genes and number of QTLs identified (used in Figure 5B and 6A).
- https://cdn.elifesciences.org/articles/60645/elife-60645-fig5-data1-v2.xlsx
-
Figure 5—source data 2
Comparison mRNA-QTLs and protein-QTLs (LOD score >4.5) (used in Figure 5B).
- https://cdn.elifesciences.org/articles/60645/elife-60645-fig5-data2-v2.xlsx
Figure 5—figure supplement 1
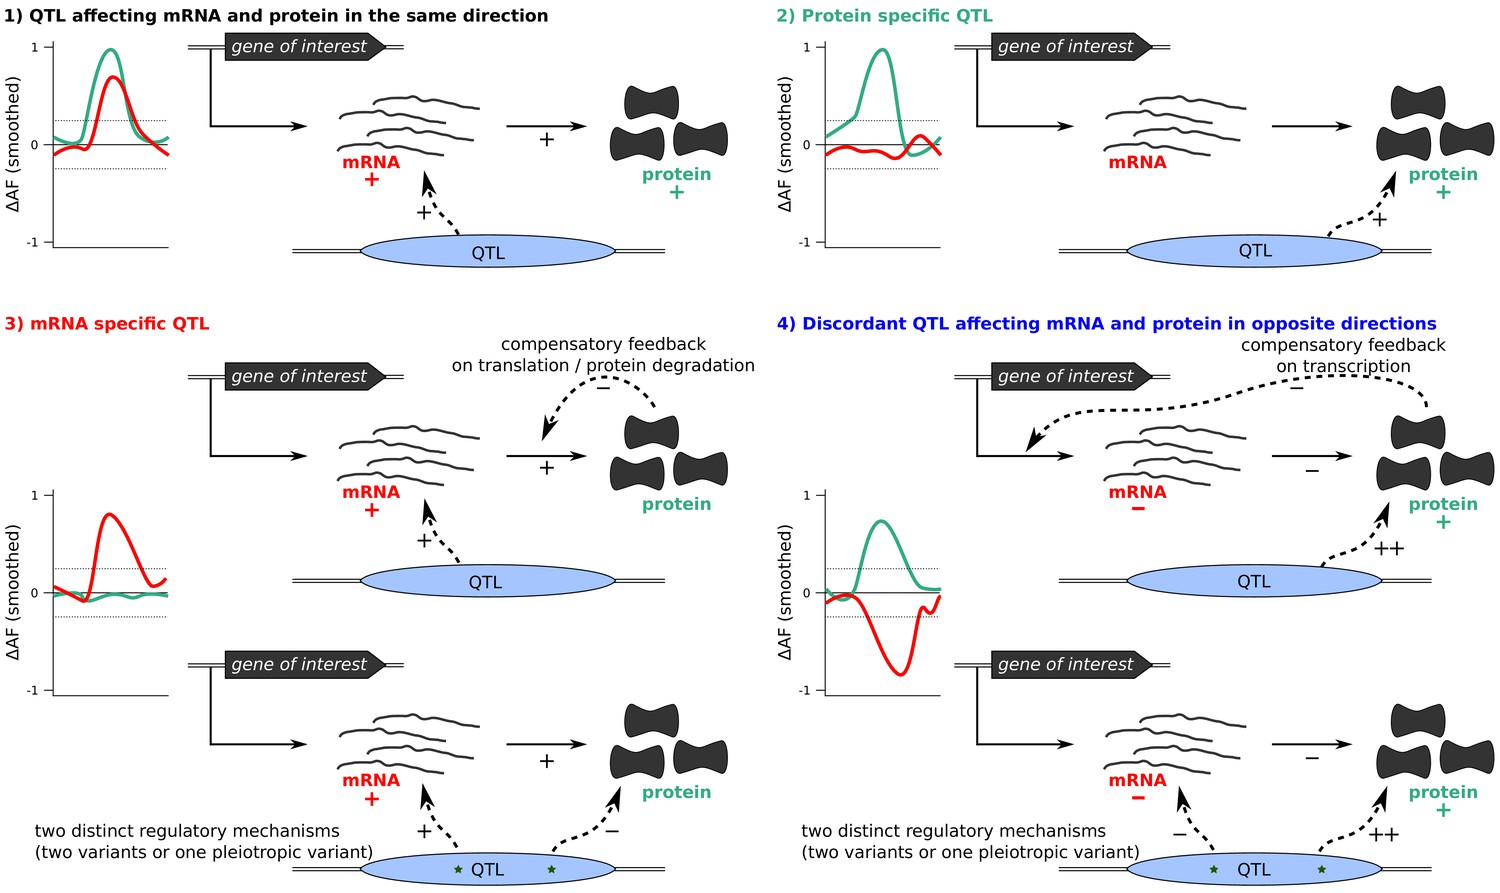
Classification of QTLs into four groups based on their effect on protein and/or mRNA.
Differences in allele frequency (ΔAF) are illustrations rather than observed data. Examples of possible underlying mechanisms for each scenario are shown.
Figure 6 with 2 supplements
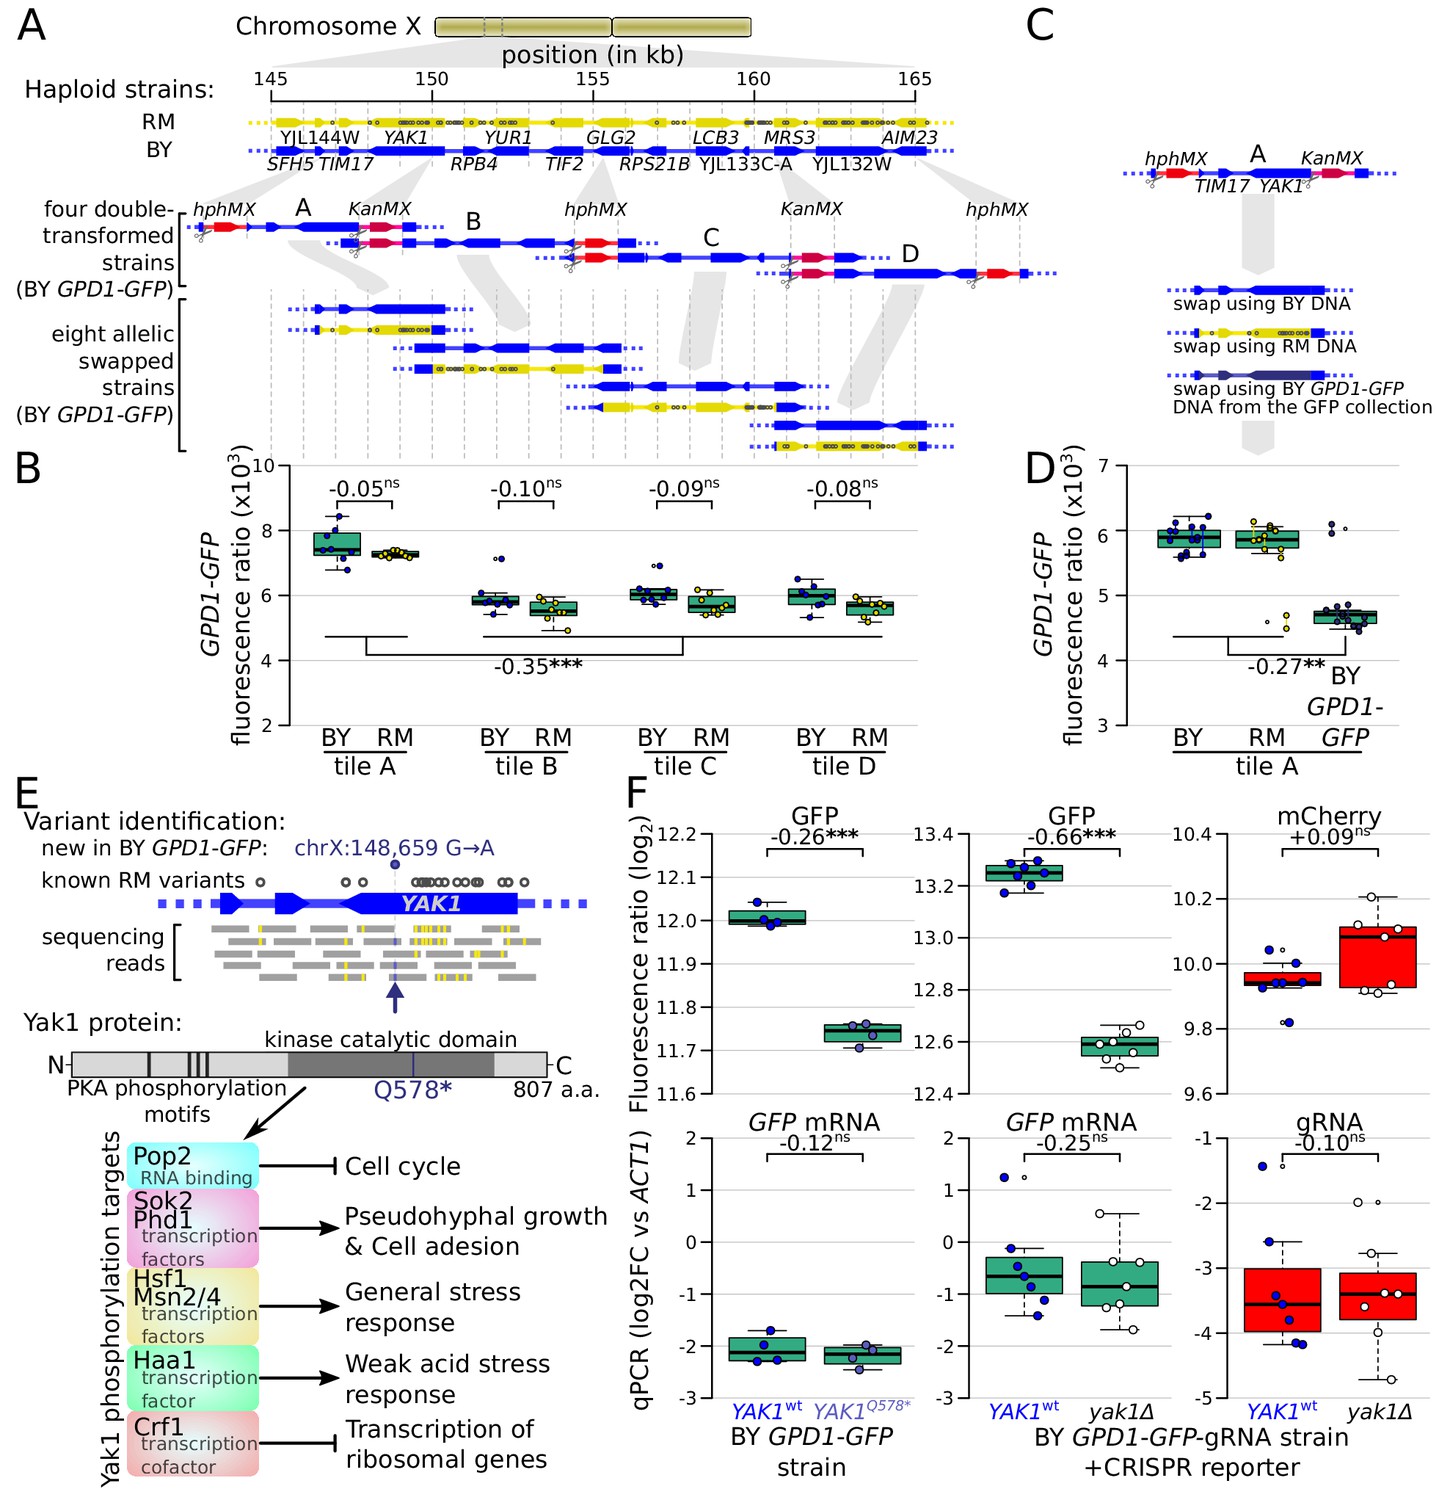
Identification of a causal variant influencing Gpd1-GFP protein but not GPD1 mRNA.
(A) Schematic of the investigated region and the strategy for generating tiled allele swaps across the region. Gray dots on the RM genome (yellow) indicate the positions of known BY/RM variants. (B) Boxplots comparing Gpd1-GFP fluorescence between allele swaps (6–8 replicates per swap). While none of the swaps resulted in a difference in fluorescence between BY and RM alleles, replacement with both backgrounds in tile A generated a significant increase in green fluorescence. Based on this result, we suspected that the BY GPD1-GFP strain carried a new mutation that was absent from the RM as well as BY genomic DNA used for the replacement. (C) Schematic of using BY GPD1-GFP DNA as a repair template for the allelic swap of tile A. (D) Boxplots comparing Gpd1-GFP fluorescence between the three swaps of tile A. The DNA repair template from the BY GPD1-GFP strain resulted in low Gpd1-GFP fluorescence, suggesting a new mutation in the BY GPD1-GFP strain. (E) Identification of the YAK1Q578* mutation using sequencing data from the segregant population, and location of YAK1Q578* in the Yak1 kinase protein sequence. Selected known protein phosphorylation targets of Yak1 and downstream processes are indicated. (F) Effect of YAK1Q578* and YAK1 knockout on Gpd1-GFP expression. Top: fluorescence, bottom: RNA quantified by qPCR. Numbers atop the boxplots correspond to log2(fold-change). log2FC: log2 of fold-change. Stars indicate the significance of a t-test: ns: not significant (p>0.05); *: 0.005 < p < 0.05; **: 0.0005 < p < 0.005; ***: p<0.0005. Cells were grown in SC medium. See also Figure 6—figure supplement 1 & Figure 6—figure supplement 2.
Figure 6—figure supplement 1
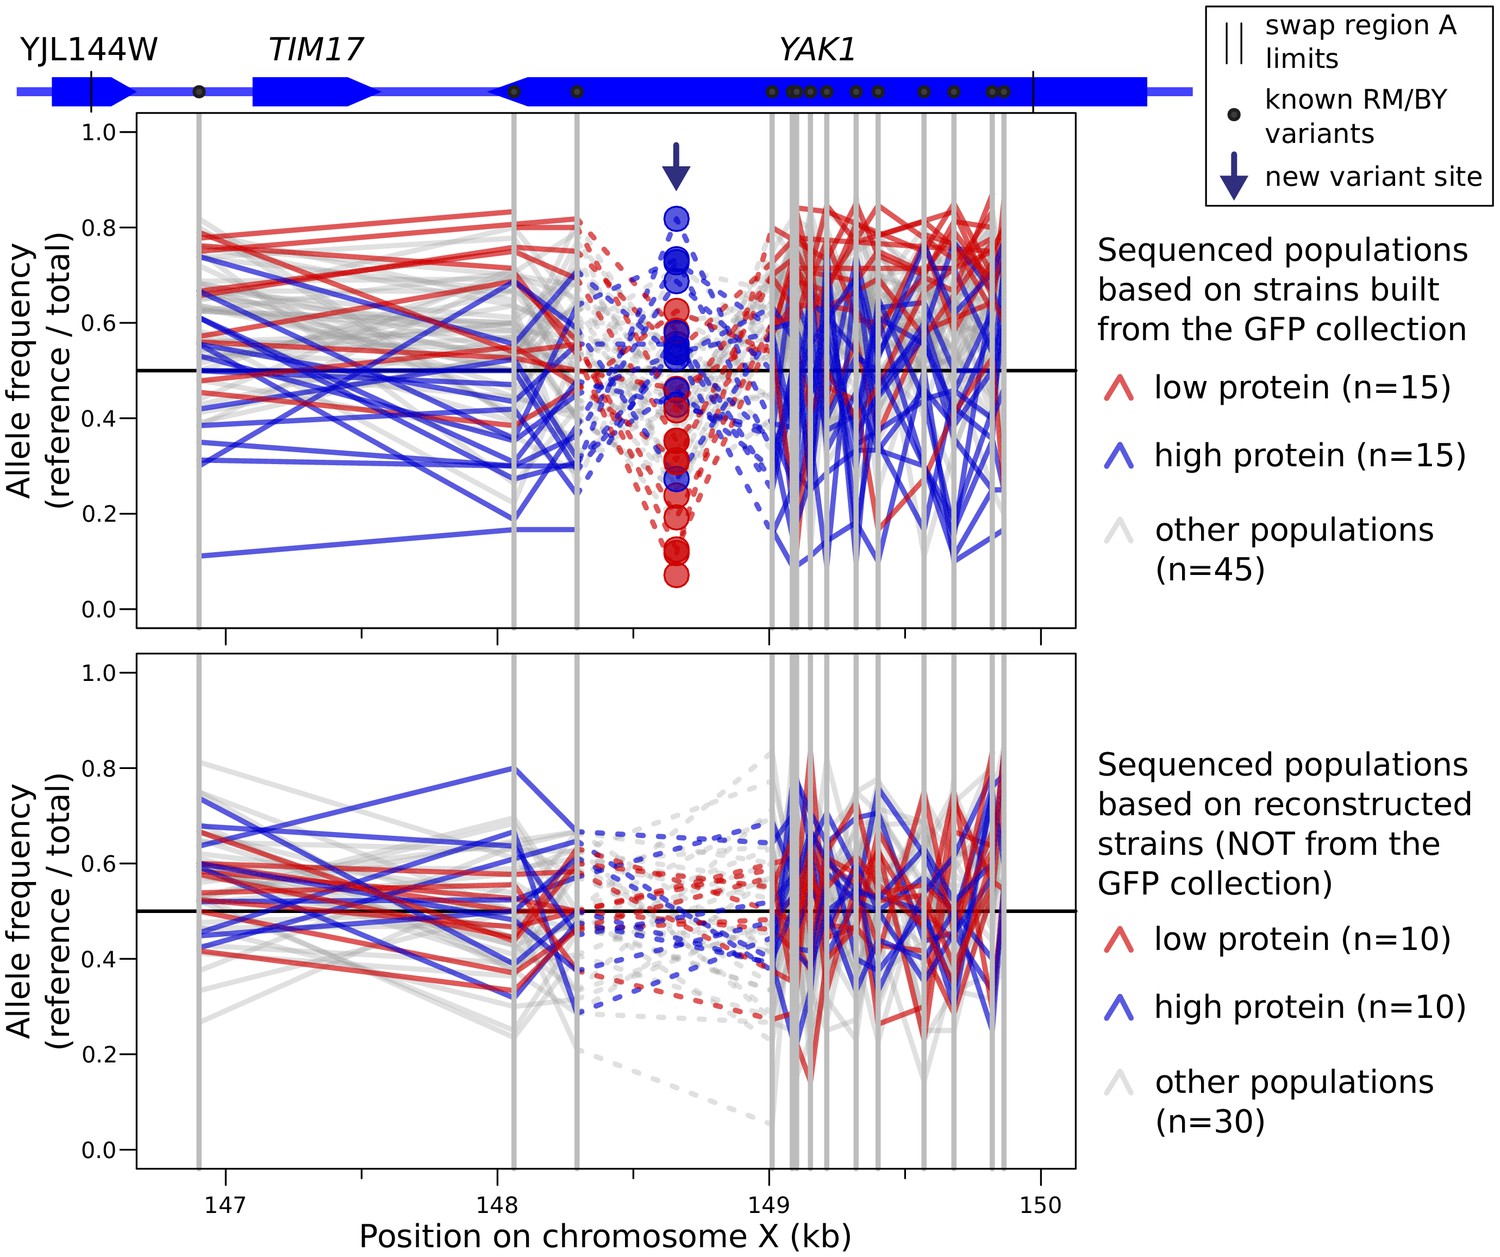
Allele frequency of variants in tile A for every sequenced segregant population, separated between populations based on BY strains from the GFP collection (top), or on a separate BY strain into which we had engineered the GFP tag (bottom).
For each sequenced population, a line traces the allele frequency of neighboring variants along the genome. Known BY/RM variants are indicated by solid gray vertical lines. The new A/G single nucleotide variant at 148,659 bp is indicated by an arrow. This mutation was detected as a heterozygous site in the majority of cell populations constructed from GFP collection strains (72 out of 75 populations). The mutation was detected in no populations constructed from strains that did not directly originate from the GFP collection (0 out of 50 populations). The apparent allele frequency inversion at this variant compared to nearby variants is due to the fact that the alternative ‘G’ allele at this variant is carried by a derivative of the reference BY strain.
Figure 6—figure supplement 2
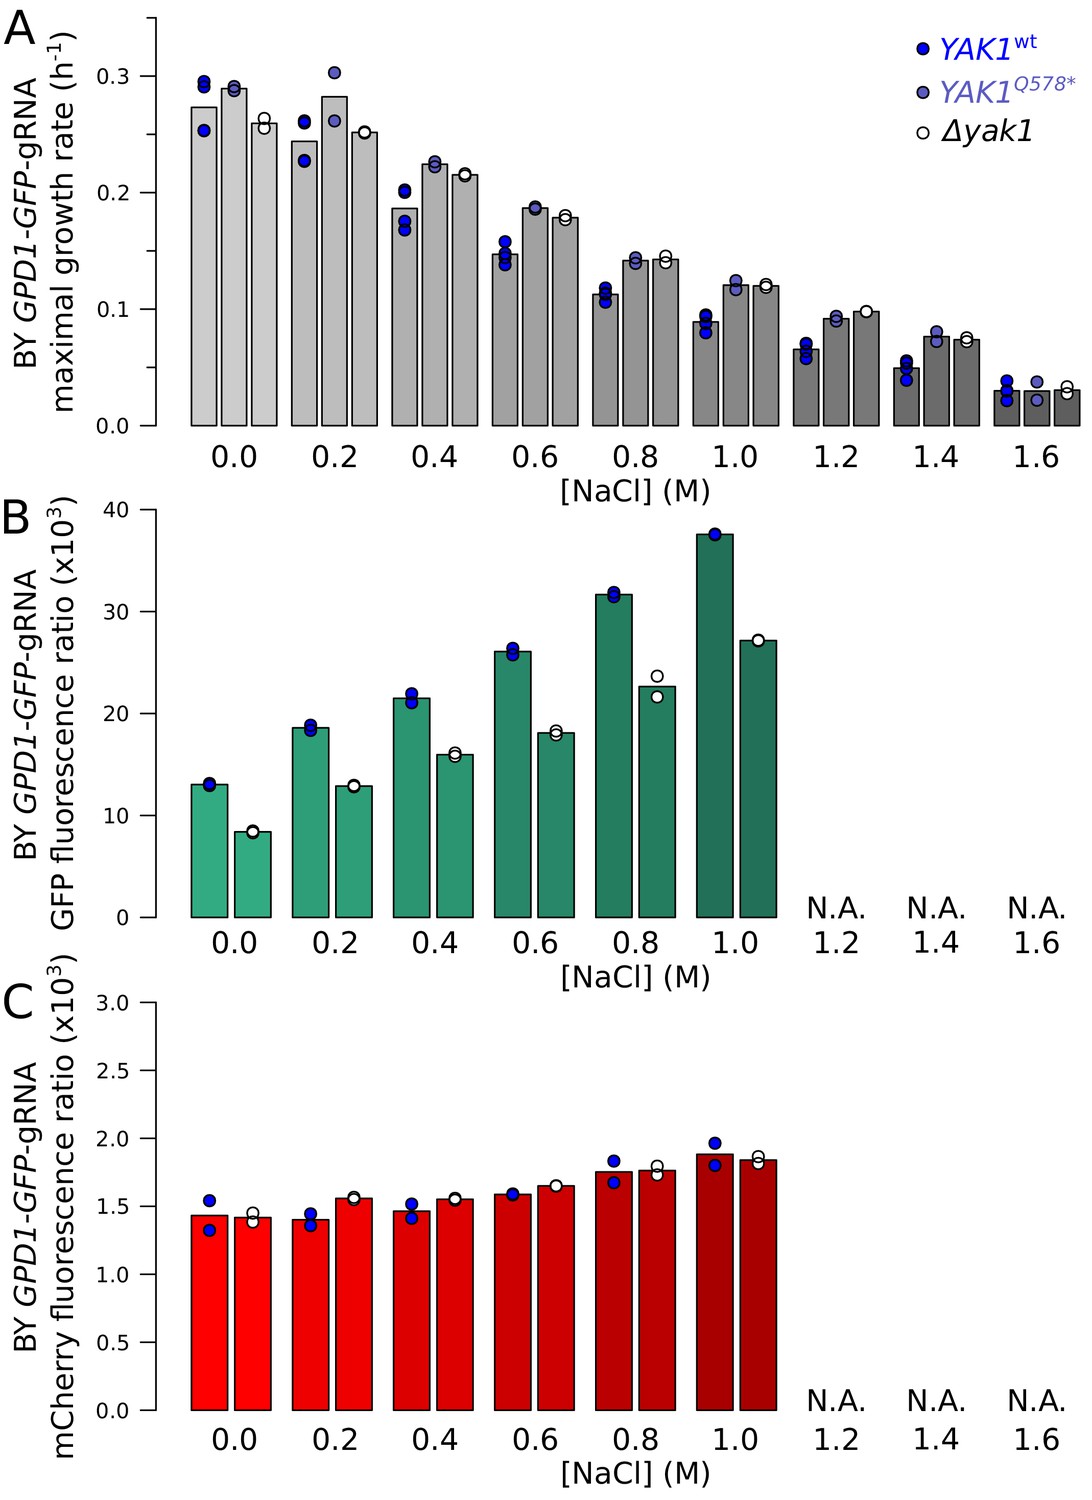
Effect of YAK1Q578* and YAK1 deletion on growth rate and GPD1 expression during chronic osmotic stress.
(A) Maximal growth rate of strains with different YAK1 alleles in SC medium with increasing concentrations of sodium chloride. The maximal growth rate was calculated as the maximal slope of log-transformed OD600 values during 24 hr of growth. (B) Effect of YAK1 deletion on GPD1-GFP protein abundance in increasing concentrations of sodium chloride. At the highest salt doses (indicated by ‘N.A'.), growth was too slow to reliably apply our GFP and mCherry quantification procedure. (C) Effect of YAK1 deletion on GPD1-GFP mRNA abundance (as measured as mCherry fluorescence by our reporter) in increasing concentrations of sodium chloride. YAK1Q578* and YAK1 deletion both alleviated slower growth normally triggered by chronic osmotic stress. The effect of YAK1 deletion on GPD1 expression was not modified by osmotic stress. While GPD1 protein expression increased at higher salt concentrations, Gpd1-GFP was always lower in the presence of the YAK1 deletion compared to wild type YAK1. mRNA abundance (as measured by our reporter) also rose as a function of salt concentration, but was not affected by YAK1 deletion.
Figure 7 with 1 supplement
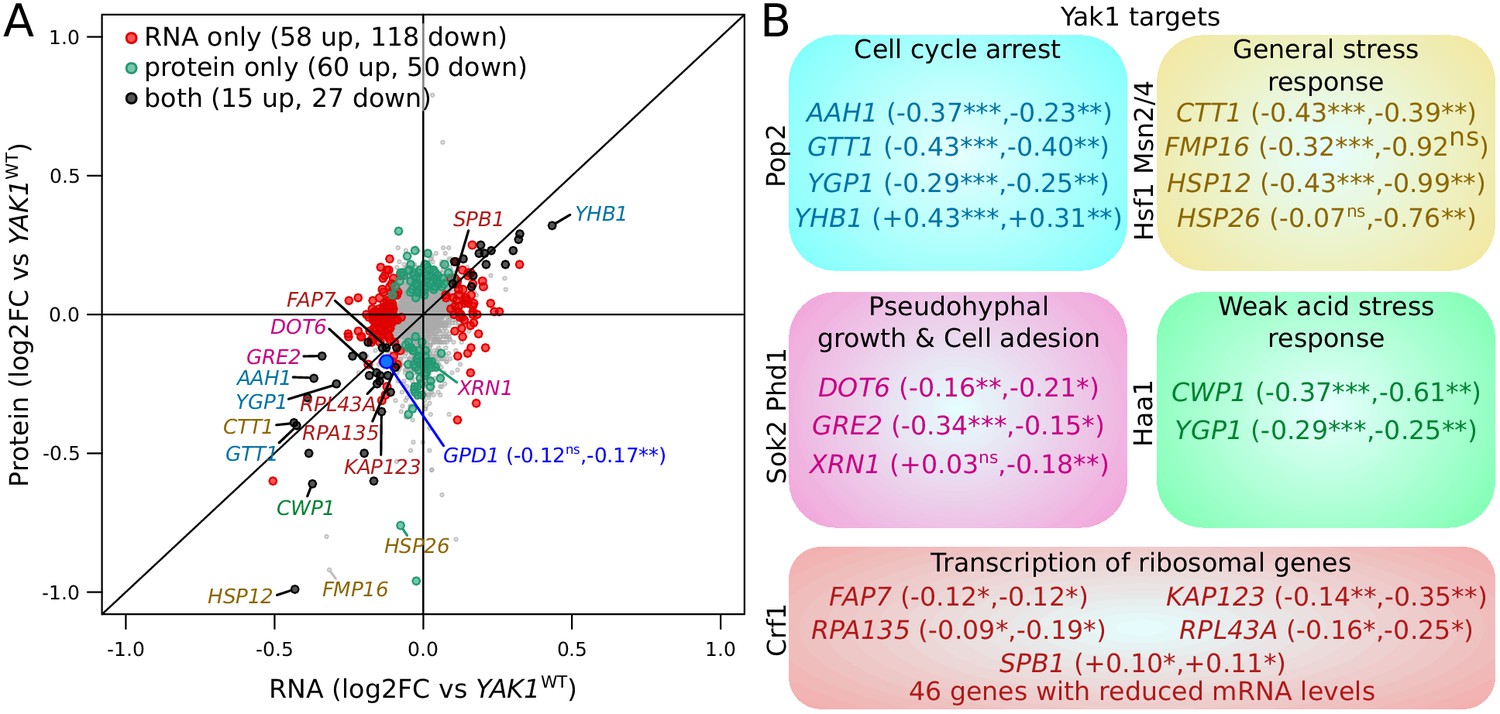
Effect of YAK1Q578* on gene expression.
(A) Effect on mRNA levels and protein levels quantified by RNA sequencing and mass spectrometry, respectively. Genes are colored according to their function as indicated in (B). GPD1 is highlighted in blue. (B) Examples of differentially expressed genes related to processes downstream of Yak1 phosphorylation regulation. The two numbers following gene names correspond to the log2 of fold-change (log2FC) of differential expression for mRNA and protein abundance, respectively. Stars indicate the significance of differential expression (Benjamini-Hochberg adjusted p-values). ns: not significant, p>0.05; *: 0.005 < p < 0.05; **: 0.0005 < p < 0.005; ***: p<0.0005. Cells were grown in SC medium. See also Figure 7—figure supplement 1. Source data files: Figure 7—source data 1, Figure 7—source data 3, Figure 7—source data 4, Figure 7—source data 2.
-
Figure 7—source data 1
Differential expression analysis of RNA abundance of BY YAK1-Q578* compared to BY YAK1-WT.
- https://cdn.elifesciences.org/articles/60645/elife-60645-fig7-data1-v2.xlsx
-
Figure 7—source data 2
GO term enrichment analysis of the differentially expressed genes (BY YAK1-Q578* compared to BY YAK1-WT).
- https://cdn.elifesciences.org/articles/60645/elife-60645-fig7-data2-v2.xlsx
-
Figure 7—source data 3
Differential expression analysis of protein abundance of BY YAK1-Q578* compared to BY YAK1-WT.
- https://cdn.elifesciences.org/articles/60645/elife-60645-fig7-data3-v2.xlsx
-
Figure 7—source data 4
Comparison of the differential expression of mRNA versus protein (BY YAK1-Q578* compared to BY YAK1-WT, used in Figure 7 and Figure 7—figure supplement 1).
- https://cdn.elifesciences.org/articles/60645/elife-60645-fig7-data4-v2.xlsx
Figure 7—figure supplement 1
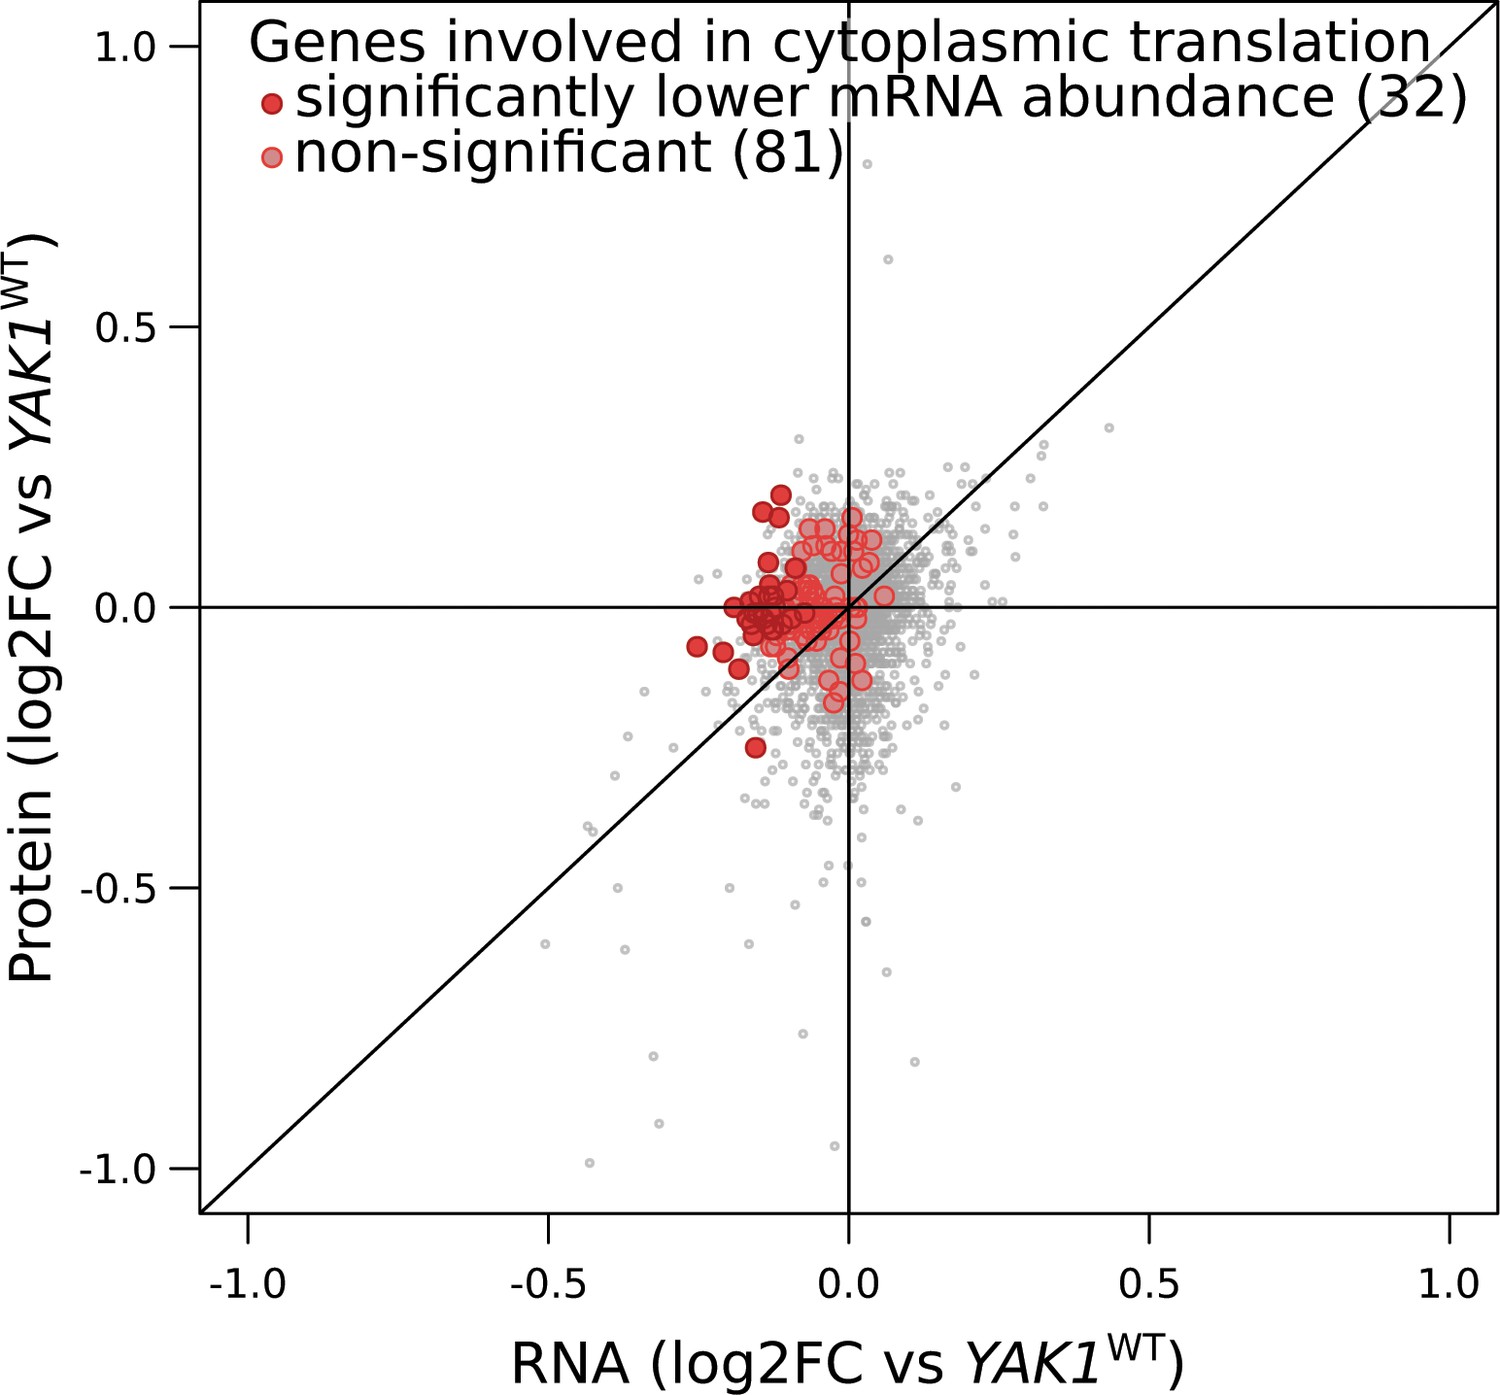
YAK1Q578* effect on the expression of genes involved in cytoplasmic translation.
Each point corresponds to a gene for which mRNA levels (x-axis) and protein levels (y-axis) were quantified by RNA sequencing and mass spectrometry, respectively. Genes with lower mRNA abundance were significantly enriched in cytoplasmic translation: 32 genes annotated to this functional category were significant (dark red; Benjamini-Hochberg adjusted p-value,<0.05), compared to 81 that were not significant (light red): hypergeometric test p-value=2.2 × 10⁻¹⁴. log2FC: log2 of fold-change.
Author response image 1

Author response image 2
Author response image 3
Tables
Key resources table
| Reagent type (species) or resource | Designation | Source or reference | Identifiers | Additional information |
|---|---|---|---|---|
| Gene (S. cerevisiae) | NPR2 | SGD | YEL062W | insertion site for CRISPR reporter |
| Gene (S. cerevisiae) | TDH3 | SGD | YGR192C | tagged gene |
| Gene (S. cerevisiae) | ARO8 | SGD | YGL202W | tagged gene |
| Gene (S. cerevisiae) | BMH2 | SGD | YDR099W | tagged gene |
| Gene (S. cerevisiae) | GPD1 | SGD | YDL022W | tagged gene |
| Gene (S. cerevisiae) | MTD1 | SGD | YKR080W | tagged gene |
| Gene (S. cerevisiae) | UGP1 | SGD | YKL035W | tagged gene |
| Gene (S. cerevisiae) | CYC1 | SGD | YJR048W | tagged gene |
| Gene (S. cerevisiae) | OLE1 | SGD | YGL055W | tagged gene |
| Gene (S. cerevisiae) | TPO1 | SGD | YLL028W | tagged gene |
| Gene (S. cerevisiae) | CTS1 | SGD | YLR286C | tagged gene |
| Gene (S. cerevisiae) | RPS10A | SGD | YOR293W | tagged gene |
| Gene (N.A) | dCAS9 | Addgene 49013, Farzadfard et al., 2013 (doi:10.1021/sb400081r) | ||
| Gene (N.A) | mCherry | Addgene 25444 | ||
| Gene (N.A) | GFP | Huh et al., 2003 (doi:10.1038/nature02026) | ||
| Gene (N.A) | Z3EV | McIsaac et al., 2013 (doi:10.1093/nar/gks1313) | ||
| Strain background (S. cerevisiae) | BY4741 | Albert et al., 2018 (doi:10.7554/eLife.35471) | ||
| Strain background (S. cerevisiae) | RM11.1a | Albert et al., 2018 (doi:10.7554/eLife.35471) | ||
| Strains (S. cerevisiae) | 167 S. cerevisiae strains | this paper | YFA- | Supplementary file 2 |
| Recombinant DNA reagent | 21 Plasmids (Stored in E. coli) | Addgene/this paper | BFA- | Supplementary file 4 |
| Sequence-based reagent | 143 Primers | this paper (IDT) | PFA- | Supplementary file 3 |
| Commercial assay or kit | Phusion Hot Start Flex | NEB | M0535L | Cloning and genome editing |
| Commercial assay or kit | Monarch DNA Gel Extraction Kit | NEB | T1020L | Cloning and genome editing |
| Commercial assay or kit | Taq DNA Polymerase | NEB | M0267L | Cloning and genome editing |
| Commercial assay or kit | NEBuilder HiFi DNA Assembly Cloning Kit | NEB | E5520S | Cloning |
| Commercial assay or kit | ZR Quick-RNA Kit | Zymo Research | R1054 | qPCR |
| Commercial assay or kit | GoScript RT kit | Promega | A5000 | qPCR |
| Commercial assay or kit | GoTaq qPCR kit | Promega | A6001 | qPCR |
| Commercial assay or kit | E-Z-96 Tissue DNA kit | Omega | D1196-01 | WGS |
| Commercial assay or kit | Nextera DNA Library Prep kit | Illumina | FC-121–1030 | WGS |
| Commercial assay or kit | ZR Fungal/Bacterial RNA mini-prep kit | Zymo Research | R2014 | RNA-seq |
| Commercial assay or kit | NEBNext Poly(A) mRNA Magnetic Isolation Module | NEB | E7490L | RNA-seq |
| Commercial assay or kit | EB Ultra II Directional RNA library kit for Illumina | NEB | E7760 | RNA-seq |
| Commercial assay or kit | NEBNext Multiplex Oligos for Illumina | NEB | E7600S | RNA-seq |
| Chemical compound, drug | YNB media | VWR | 97064–162 | growth media |
| Chemical compound, drug | SC complement | Sunrise science | 1342–030 | growth media |
| Chemical compound, drug | Estradiol | Sigma-Aldrich | E1024-1G | Media complement |
| Software, algorithm | R version 3.5.1 | https://www.r-project.org | Data analysis | |
| Software, algorithm | BWA | Li and Durbin, 2009 (doi:10.1093/bioinformatics/btp324) | WGS | |
| Software, algorithm | samtools | Li and Durbin, 2009 (doi:10.1093/bioinformatics/btp352) | WGS | |
| Software, algorithm | MULTIPOOL | Edwards and Gifford, 2012 (doi:10.1186/1471-2105-13-S6-S8) | QTL analysis | |
| Software, algorithm | trimmomatic | Bolger et al., 2014 (doi:10.1093/bioinformatics/btu170) | RNA-seq | |
| Software, algorithm | kallisto | Bray et al., 2016 (doi:10.1038/nbt.3519) | RNA-seq | |
| Software, algorithm | Scaffold 4.9 | http://www.proteomesoftware.com/products/scaffold/ | Mass-Spectrometry | |
| Software, algorithm | Gorilla | Eden et al., 2009 (doi:10.1186/1471-2105-10-48) | GO term enrichment | |
| Other | BioTek Synergy H1 plate-reader | BioTek Instruments | Instrument: Plate-reader | |
| Oher | C1000Touch plate reader | Bio-Rad | Instrument: qPCR device | |
| Other | BD FACSAria II P0287 (BSL2) | BD | Instrument: Cell sorting | |
| Other | BD Fortessa X-30 H0081 | BD | Instrument: Flow cytometry | |
| Other | Illumina HiSeq 2500 | Illumina | Instrument: Sequencer | |
| Other | Illumina NextSeq 550 | Illumina | Instrument: Sequencer | |
| Other | Orbitrap Fusion Tribrid MS-MS instrument | Thermo Scientific | Instrument: Mass-Spectrometry |
Author response table 1
| Gene | mCherry deltaAF (LOD) | RNASeq log2(Fold change) | RNASeq Raw P-value (adjusted p-value) | GFP deltaAF (LOD) | Mass-spec log2(Fold change) | Mass-spec Raw P-value (adjusted p-value) |
|---|---|---|---|---|---|---|
| GPD1 | 0.02 (0.6) | -0.12 | 0.01 (0.10) | -0.4 (94.2) | -0.17 | 0.0001 (0.004) |
| ARO8 | 0.05 (1.8) | 0.05 | 0.24 (0.55) | -0.1 (6.7) | 0.13 | 0.09 (0.4) |
| BMH2 | 0.04 (1.0) | 0.03 | 0.21 (0.51) | -0.20 (22.2) | -0.01 | 0.93 (0.98) |
Additional files
-
Supplementary file 1
Gene expression levels based on previous work: mRNA from RNA-seq Albert et al., 2018 and protein from GFP fluorescence from Huh et al., 2003.
- https://cdn.elifesciences.org/articles/60645/elife-60645-supp1-v2.xlsx
-
Supplementary file 2
List of yeast strains.
- https://cdn.elifesciences.org/articles/60645/elife-60645-supp2-v2.xlsx
-
Supplementary file 3
List of PCR primers and DNA fragments.
- https://cdn.elifesciences.org/articles/60645/elife-60645-supp3-v2.xlsx
-
Supplementary file 4
List of plasmids.
- https://cdn.elifesciences.org/articles/60645/elife-60645-supp4-v2.xlsx
-
Transparent reporting form
- https://cdn.elifesciences.org/articles/60645/elife-60645-transrepform-v2.docx
Download links
A two-part list of links to download the article, or parts of the article, in various formats.
Downloads (link to download the article as PDF)
Open citations (links to open the citations from this article in various online reference manager services)
Cite this article (links to download the citations from this article in formats compatible with various reference manager tools)
Simultaneous quantification of mRNA and protein in single cells reveals post-transcriptional effects of genetic variation
eLife 9:e60645.
https://doi.org/10.7554/eLife.60645


