Inter-membrane association of the Sec and BAM translocons for bacterial outer-membrane biogenesis
- School of Biochemistry, University of Bristol, United Kingdom
- Biological Mass Spectrometry and Proteomics, MRC Laboratory of Molecular Biology, United Kingdom
- Department of Life Sciences, Imperial College London, United Kingdom
- Living Systems Institute, University of Exeter, United Kingdom
- College of Life and Environmental Sciences, University of Exeter, United Kingdom
Figures
Figure 1 with 1 supplement
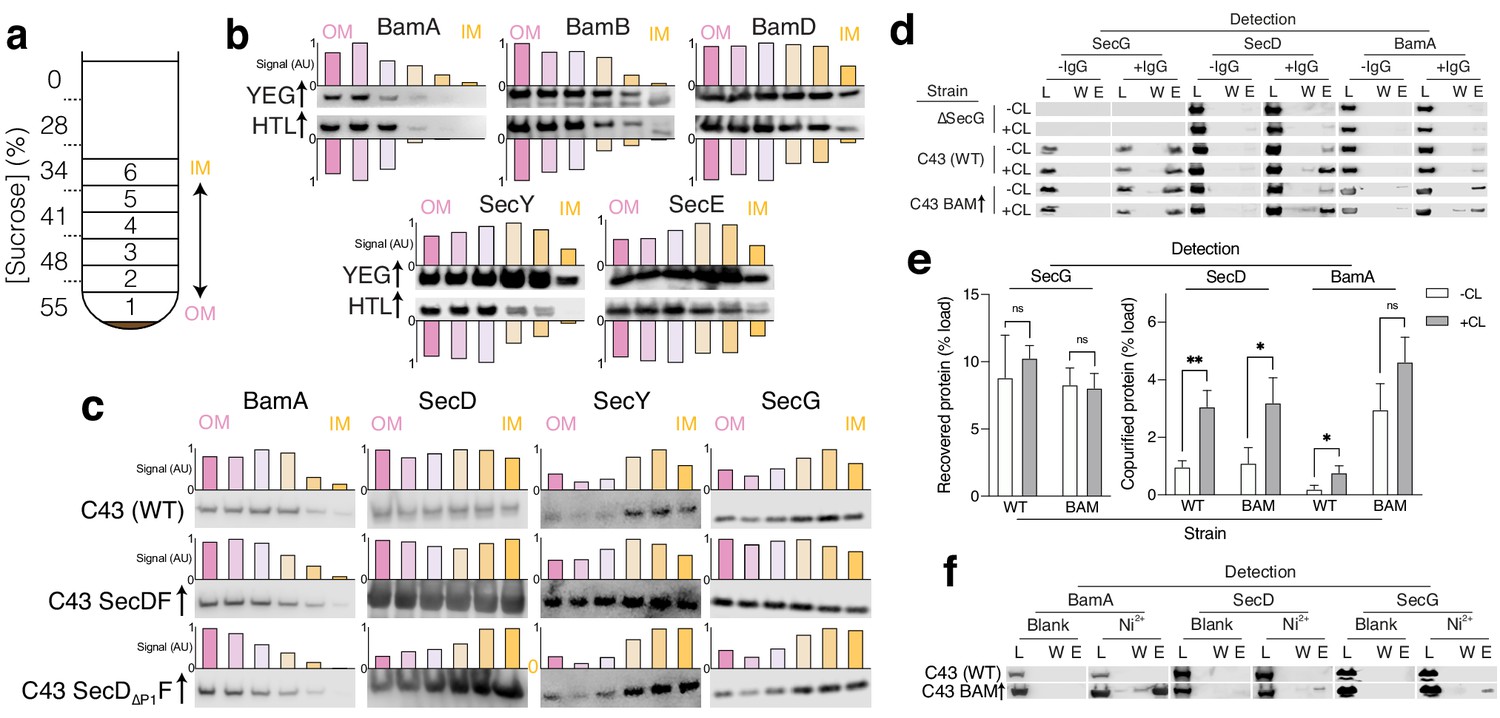
Identification of interactions between HTL and BAM.
(a) Schematic representation of sucrose gradient centrifugation tube for fractionation of E. coli total membranes. Numbers 1–6 indicate the fractions taken for SDS-PAGE and immunoblotting shown in (b, c and d). (b, c) Immunoblots of fractions produced as shown in a for membranes of (b): E. coli C43 overproducing either SecYEG or HTL or for (c): E. coli C43 with no over-expression, and those over-producing either SecDF or SecD∆P1F (lacking the periplasmic domain 1 (P1) of SecD). To help visualise migration shifts, blotting signal was used to quantify relative abundances of proteins of interest in fractions, shown above or below blots as normalised bar charts, where bars from left (pink) to right (yellow) indicate fractions 1 (OM) – 6 (IM), respectively. (d) Co-immunoprecipitations (co-IP) of SecG, SecD, and BamA – pulling with the SecG antibody. Pull-downs were conducted with solubilised crude membrane extracts from E. coli C43 (WT), a strain lacking SecG (∆secG), and C43 over-producing BAM. Experiments were conducted in the presence (+CL) and absence (-CL) of cardiolipin. L = load (1% total material), W = final wash before elution (to demonstrate complete washing of affinity resin, 17% of total material) and E = elution (17% of total material). (e) Quantification of IPs shown in (d). Error bars represent SEM. An unpaired T-test was used to compare samples (p=0.05, n = 3, * = <0.05, ** = <0.01, p values from left to right are 0.4874, 0.8083, 0.0041, 0.0249, 0.0241, and 0.0839). Quantification was performed for cells of E. coli C43 (WT) and the same but overproducing BAM (BAM). (f) Affinity pull-down of recombinant BamA-His6, SecD, and SecG by nickel chelation all in the presence of cardiolipin. L, W, and E as described in (d).
Figure 1—figure supplement 1
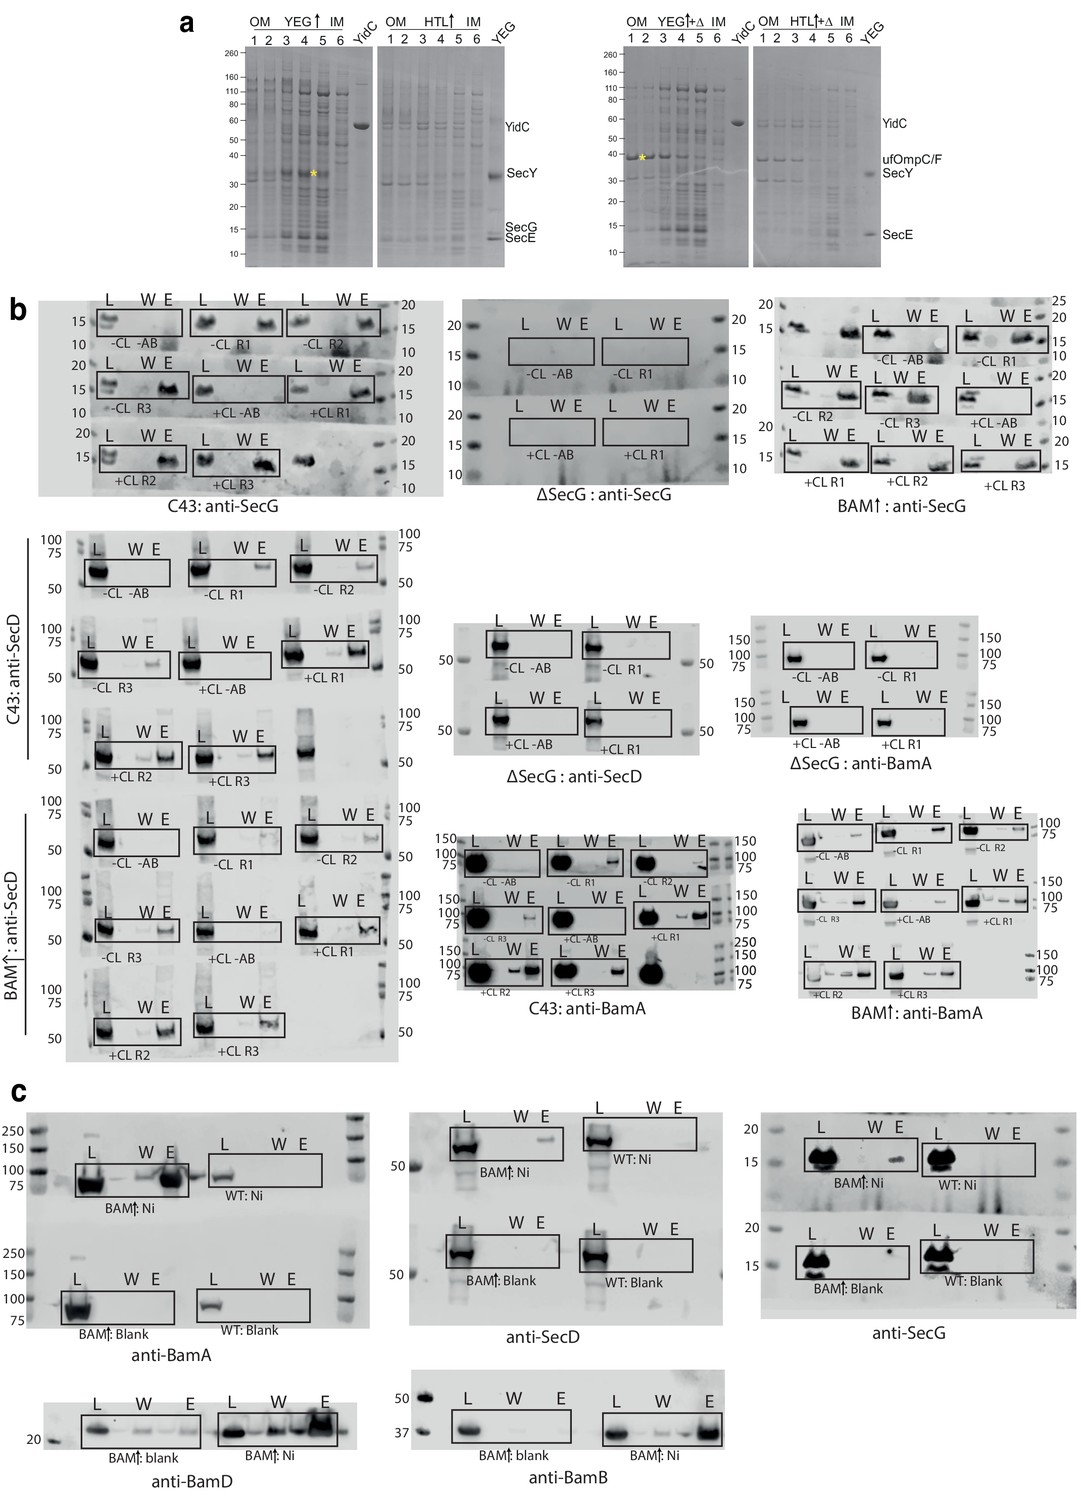
Raw western blots of co-immunoprecipitations and affinity pull-downs.
(a) Coomassie-stained SDS-PAGE of sucrose gradient fractions of E. coli C43 total membranes from cells over-producing SecYEG or HTL. Left and right gels show untreated and heat denatured (+∆) samples, respectively. Purified controls of SecYEG and YidC are also shown. Yellow asterisks indicate the positions of OmpC/OmpF. For (b) and (c), L = load (1% total material), W = final wash before elution (to demonstrate complete washing of affinity resin, 17% of total material) and E = elution (17% of total material). (b) Co-immunoprecipitations from Figure 1d–e. Experiments were conducted in the presence (+CL) or absence (-CL) of augmented cardiolipin. Experiments were also carried out in the presence (+AB) or absence (-AB) of anti-SecG primary antibody, as a control to assess non-specific binding. Solubilised membranes of three cell strains were used: E. coli C43, a strain lacking SecG (∆secG), and C43 over-producing BAM. (c) Affinity pull-downs from Figure 1f. Experiments were conducted with nickel-chelated (Ni) or non-chelated (blank) resin as a control to rule out non-specific binding.
Figure 2 with 5 supplements
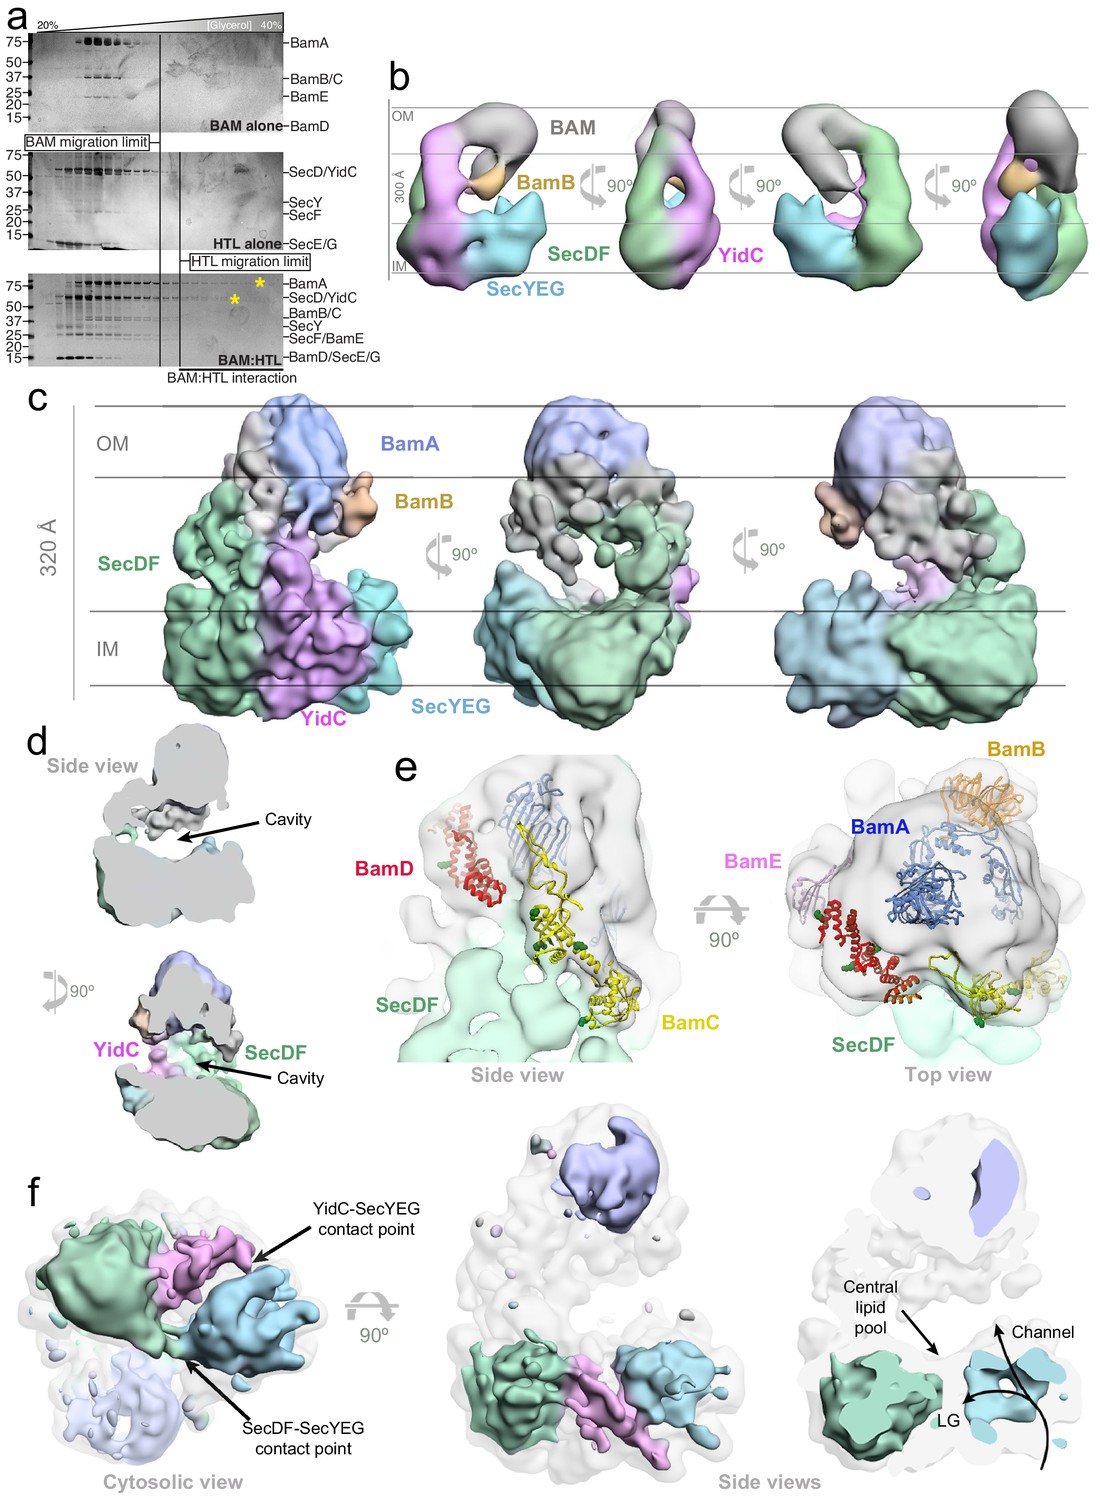
3D characterisation of HTL-BAM by negative stain-EM and cryo-EM in detergent solution, and XL-MS analysis.
(a) Silver-stained SDS-PAGE gels of fractions from glycerol centrifugation gradients, with increasingly large complexes appearing in fractions of higher percentage glycerol, (from left to right). Gels of BAM alone (top) HTL alone (middle) and HTL mixed with BAM (bottom) are shown. The fractions of furthest migration of the individual components, as determined in the top two gels, are marked by vertical lines. HTL-BAM components in heavy fractions are marked with a yellow asterisk. (b) Negative stain analysis of the HTL-BAM complex (37.2 Å resolution) in four representative orthogonal views, with the orientation with respect to the inner and outer membranes inferred. BAM (grey), BamB (orange), SecYEG (cyan), YidC (pink), and SecDF (green) are shown. (c) Three orthogonal views of the cryo-EM HTL-BAM complex 3D reconstruction (18 Å resolution). Colours are as in (a), but with BamA in blue. (d) Side views of the cryo-EM HTL-BAM complex showing the large cavity between the inner-membranes and outer-membrane complexes. (e) Close-up of the outer-membrane region of the HTL-BAM complex. The cryo-EM structure (transparent surface) with BamABCDE atomic structures docked (pdb: 5d0q). The position of BamB (orange) was determined directly by negative stain-EM (Figure 2—figure supplement 3e). BamA (blue), BamC (yellow), BamD (red), and BamE (pink) are docked according to the HTL-BAM cryo-EM density and XL-MS data (Figure 2—figure supplement 5c). Green sphere atoms in BamC and BamD show interacting points with SecD identified by mass apectrometry. (f) Lower threshold map of HTL-BAM overlaid with the standard threshold (transparent grey), with the main components coloured as in (a). The lateral gate (LG) into the membrane and protein-channel both through SecY and the central lipid pool of the HTL are highlighted.
-
Figure 2—source data 1
Parameters of EM analysis of HTL and HTL-BAM structures.
- https://cdn.elifesciences.org/articles/60669/elife-60669-fig2-data1-v2.odt
Figure 2—figure supplement 1
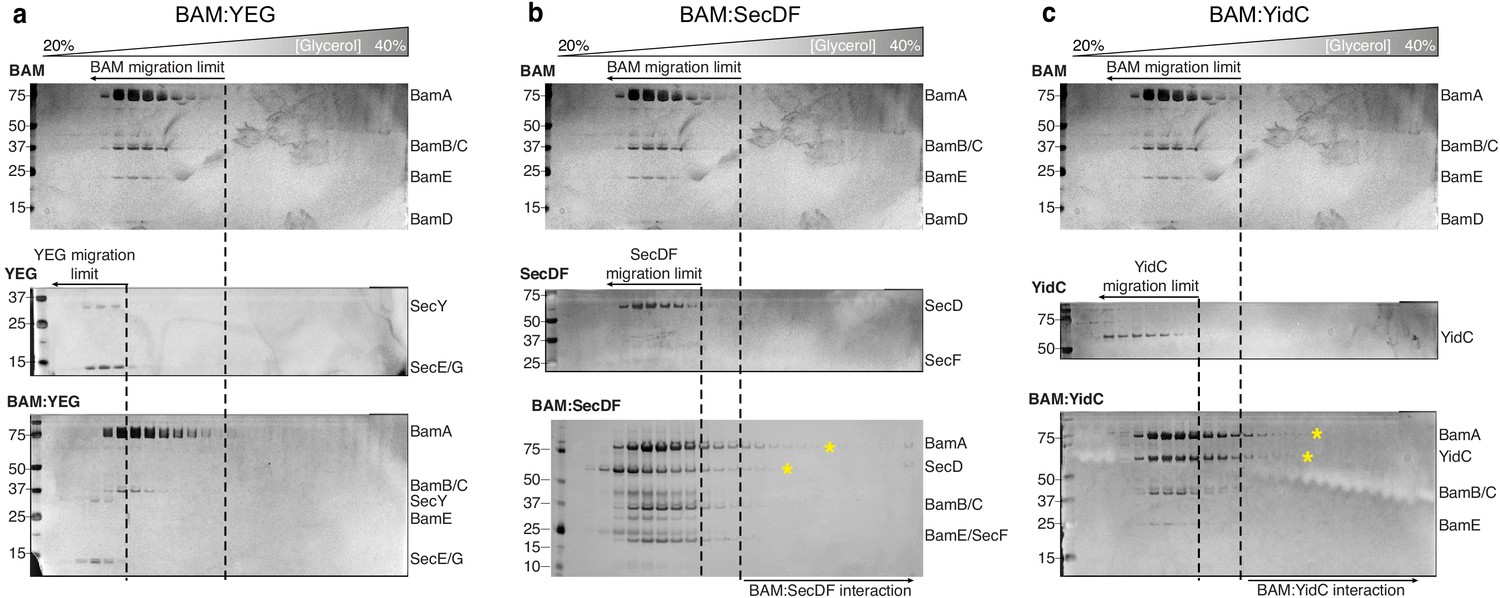
Glycerol centrifugation gradients of HTL and BAM components.
(a, b, c) Silver-stained SDS-PAGE gels of fractions from the glycerol centrifugation gradients are shown, with increasingly large complexes appearing in fractions of higher percentage glycerol (from left to right). For each panel, the glycerol centrifugation gradient of BAM alone is shown (top). The middle gel represents a HTL component (labelled on the top left of the gel). The bottom gel represents the experiment where BAM was mixed with the corresponding HTL component. Dashed lines represent the fraction of furthest migration of the individual components, as determined in the top two gels. Components of HTL-BAM in heavy fractions are indicated by yellow asterisks.
Figure 2—figure supplement 2
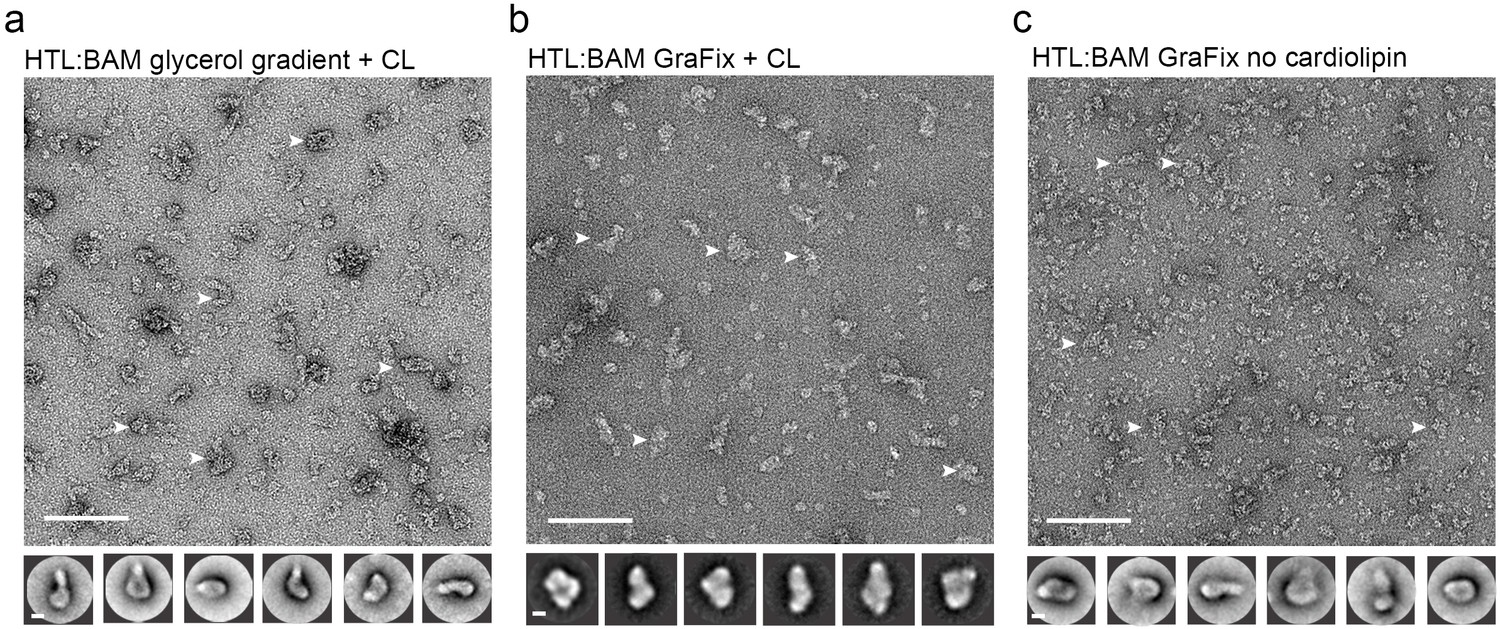
Negative-stained EM micrographs of the HTL-BAM complex.
(a, b, c) Electron micrographs of HTL-BAM complexes in different conditions. Bottom, reference-free (RF) class averages of the largest populations found in the micrographs (top). Micrograph scale bar, 1000 Å. RF scale bar, 100 Å. White arrows indicate representative HTL-BAM complexes used for image processing.
Figure 2—figure supplement 3
3D characterisation and subunit assignment of HTL-BAM by negative stain-EM in detergent solution.
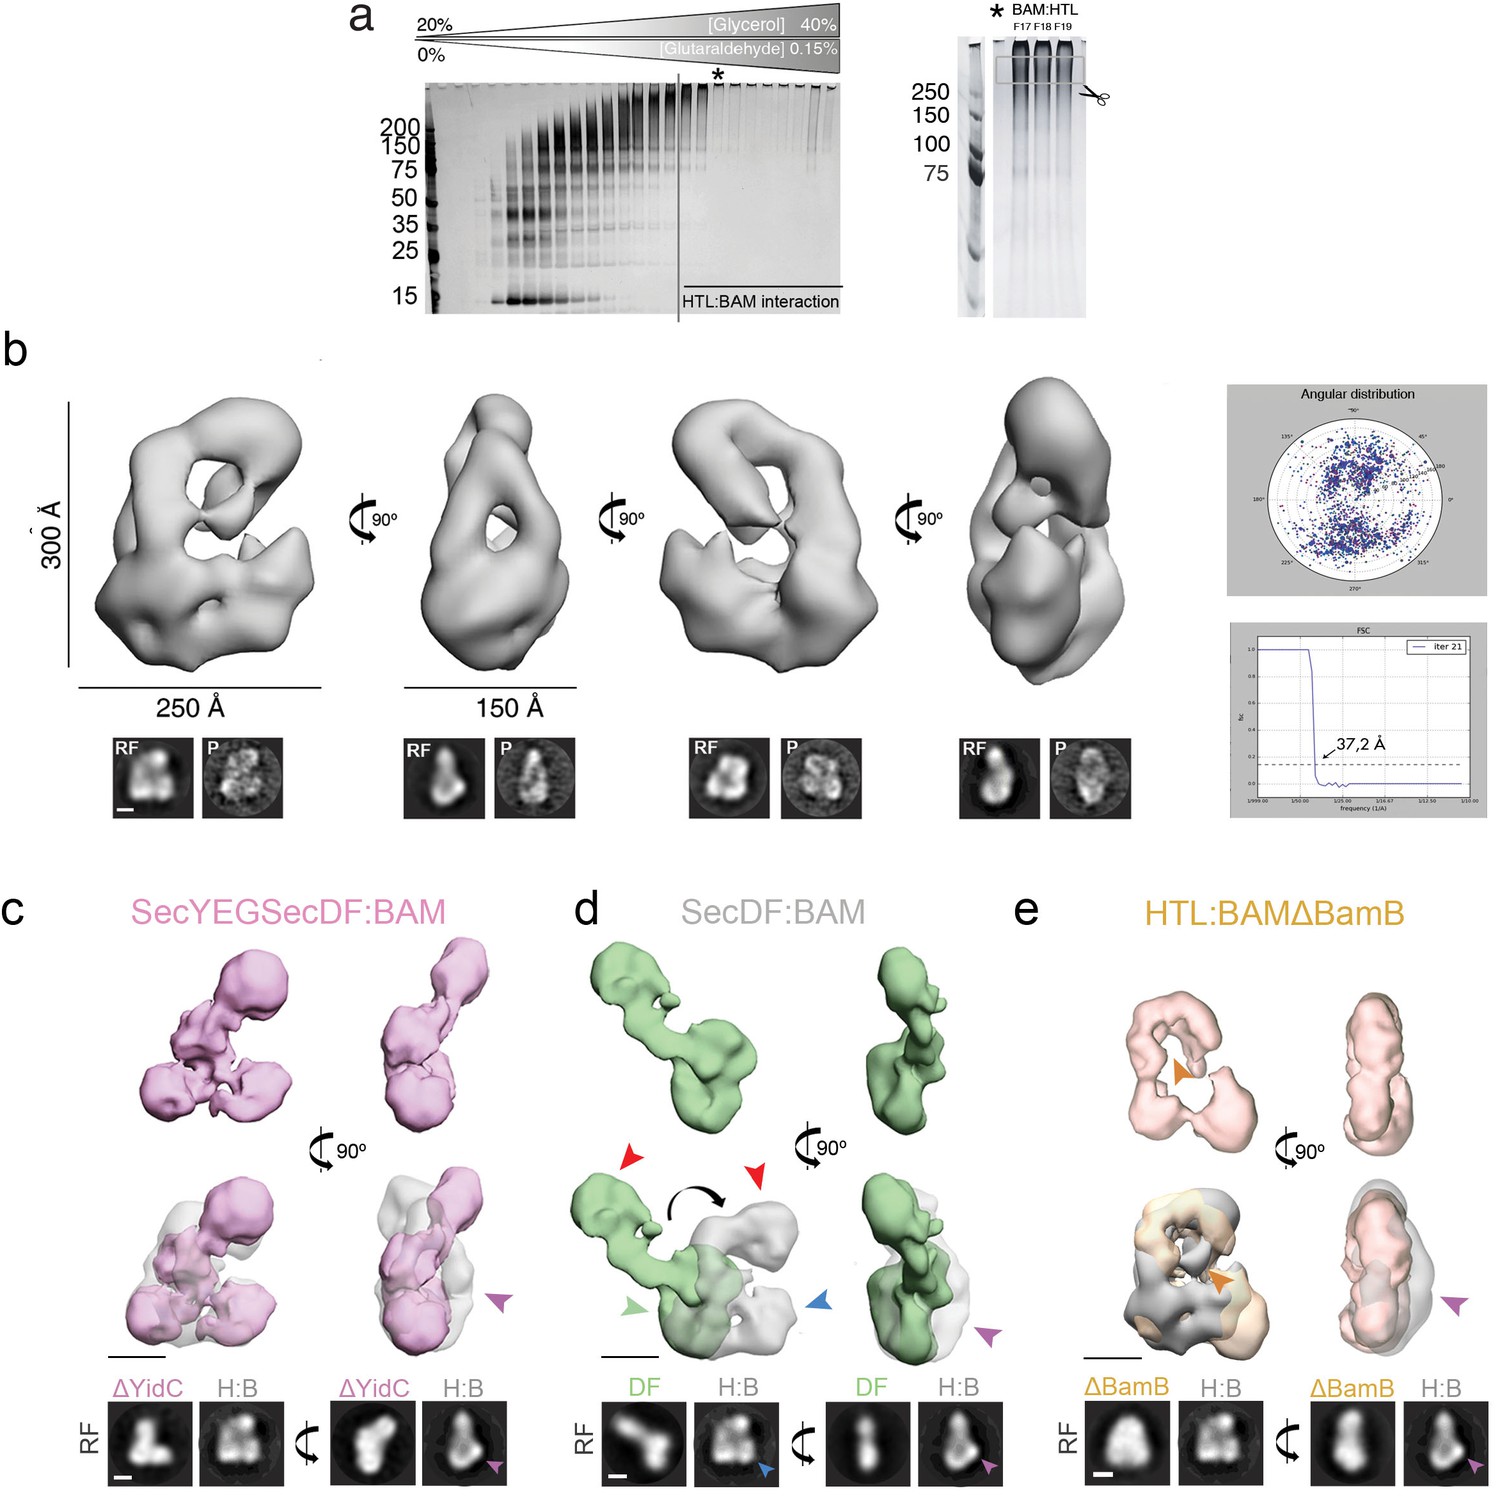
(a) Silver-stained SDS-PAGE analysis of HTL-BAM fractionated by glycerol density gradient centrifugation (left). Experiment is the same as that shown in Figure 2a (bottom panel), but with GraFix treatment. Black asterisk (left panel) marks the fraction chosen for negative stain EM and image processing. For identification of HTL and BAM components by mass spectrometry, the PAGE sample marked with the black asterisk (left panel) was subjected to a longer running time to further purify bands for cutting (right panel). (b) Top left, four orthogonal views of the HTL-BAM complex 3D reconstruction (37.2 Å resolution). Bottom, reference-free (RF) class averages and projections (P) of the final model, shown in the same orientations as the top. Scale bar, 100 Å. See Figure 2—source data 1 for image processing details. Right, angular distribution and Fourier shell correlation of the HTL-BAM complex. For (c–e), top panel shows orthogonal views of different 3D reconstructions, labelled accordingly. Middle panel shows reconstructions superimposed with HTL-BAM (transparent grey) from (b), and bottom shows a comparison of the reference-free (RF) class averages of HTL-BAM with the corresponding structure. Scale bar, 100 Å. See Figure 2—source data 1 or image processing details. (c) SecYEG-SecDF-BAM (without YidC) complex 3D reconstruction (36.7 Å resolution, pink). Pink arrow indicates the mass in HTL-BAM (grey transparent) corresponding to YidC. (d) SecDF-BAM (without SecYEG and YidC) complex 3D reconstruction (39.4 Å resolution, green). Masses for SecDF trans-membrane domain (green arrow), periplasmic region (red arrow), SecYEG (blue arrow), and YidC (pink arrow) are indicated. (e) HTL-BAM(∆BamB) complex 3D reconstruction (33.6 Å resolution, orange). Mass corresponding to BamB (orange arrow) and YidC (pink arrow) are indicated.
-
Figure 2—figure supplement 3—source data 1
Mass spectrometry (MS) analysis of the GraFix fractions for image processing.
Analysis of the protein composition of the HTL-BAM preparations in detergent solution by MS. Only proteins of interest are shown in this table. The SDS-PAGE bands corresponding to the GraFix fractions used for negative stain-EM processing (e.g. Figure 2—figure supplement 3a, middle and right, asterisk) were cut from the gel and prepared for protein digestion, extraction, and MS.
- https://cdn.elifesciences.org/articles/60669/elife-60669-fig2-figsupp3-data1-v2.xls
Figure 2—figure supplement 4
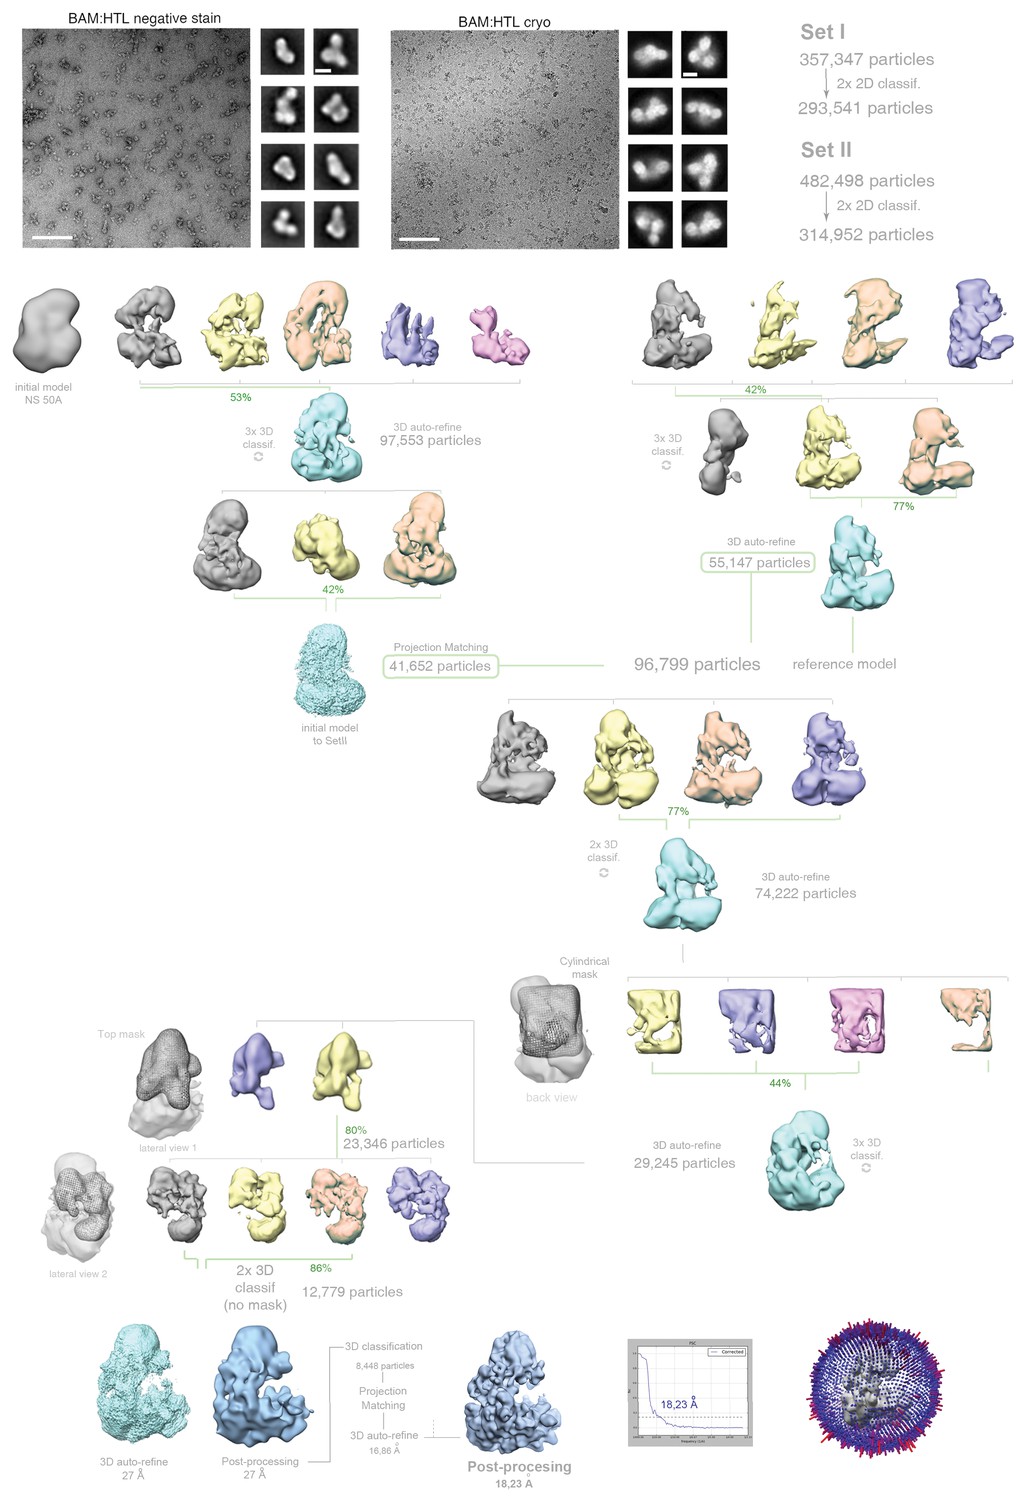
Image processing and classification strategy for the cryo-EM data of the HTL-BAM complex.
Relion 2D classification was used to clean the two preliminary datasets and classify the images. Of Set I, 82% of the particles were used for extensive 3D classifications and auto-refinements. Of Set II, 65% of the particles followed same procedure. High-quality particles from both data sets were grouped and classified again masking the most variable regions. The final stable volume was formed by 8448 particles (1.3% of the particles), indicative of the number of different sub-populations found in the sample. The final post-processing structure (Relion 2.0) has an overall resolution of 18.23 Å.
Figure 2—figure supplement 5
Sample preparation and XL-MS analysis of HTL-BAM.
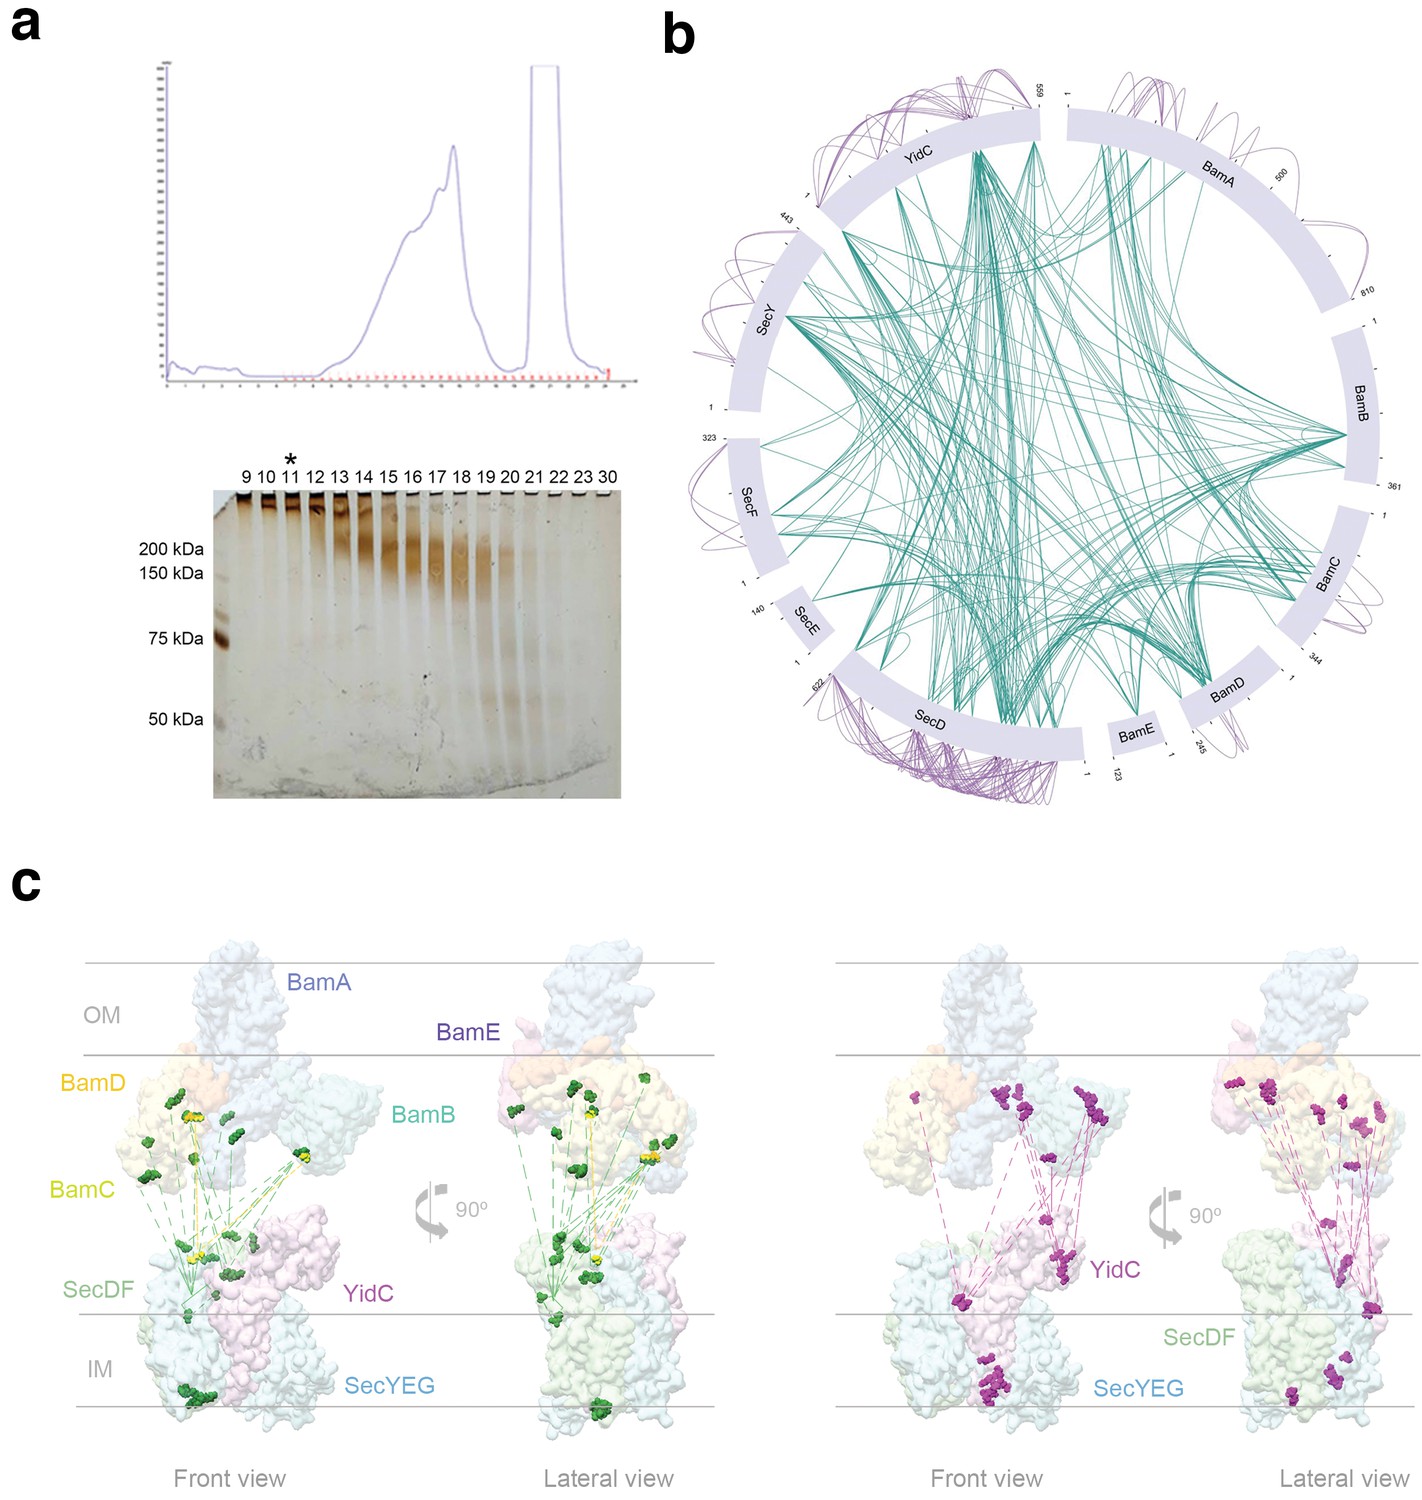
(a) Top, gel filtration chromatography elution profile (Superose 6) of the HTL-BAM complex for cryo-EM and XL-MS analysis. Bottom, silver-stained SDS-PAGE gel of the fractions eluted from the gel filtration at the top. Black asterisk marks the fraction used for XL-MS, and a similar sample was used for cryo-EM. (b) Representation of the interaction network between HTL and BAM determined from XL-MS analysis. Internal green lines represent interprotein connections between HTL-HTL, HTL-BAM, and BAM-BAM components. Purple lines represent intraprotein connections between the individual subunits of HTL and BAM. (c) Representation of inter-protein interactions between HTL and BAM as determined by XL-MS. The specific crosslink residues are mapped onto the structures of the BAM complex (emd_4061 and pdb_5ayw) and the model of the HTL complex (emd_3506 and pdb_5mg3) (Botte et al., 2016). Left, green dots and dashed lines represent positions and interactions, respectively, between SecD residues and BAM components. Yellow, positions and interactions between SecF and BAM components. Right, pink dots and dashed lines represent positions and interactions, respectively, between YidC residues and BAM components. The HTL and BAM structures have been placed artificially separate from one another to best illustrate the cross-linking contacts (rather than to reflect their actual position in the super-complex).
Figure 3 with 1 supplement
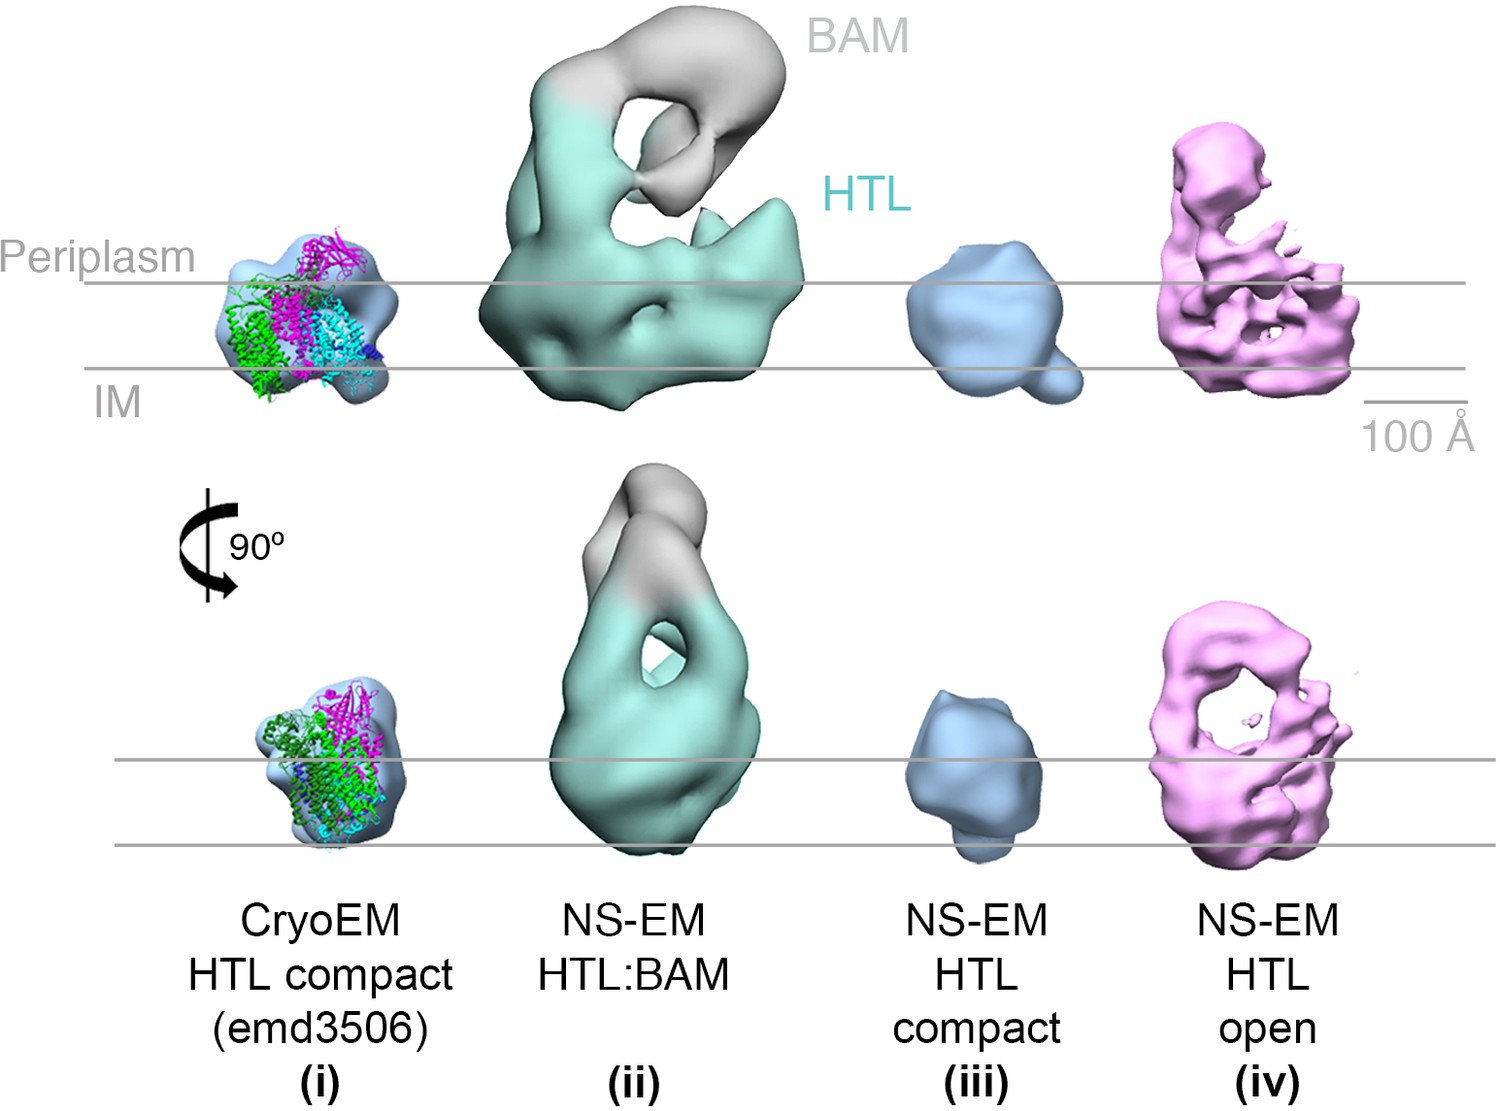
EM structures of HTL in ‘compact’ and ‘open’ states.
Structure and docking of a previously published cryo-EM structure of HTL in the compact state (i) (Botte et al., 2016), the HTL-BAM complex (ii), HTL in the ‘compact’ state (iii) and HTL in the ‘open’ state (iv); structures (ii - iv) are from this study.
Figure 3—figure supplement 1
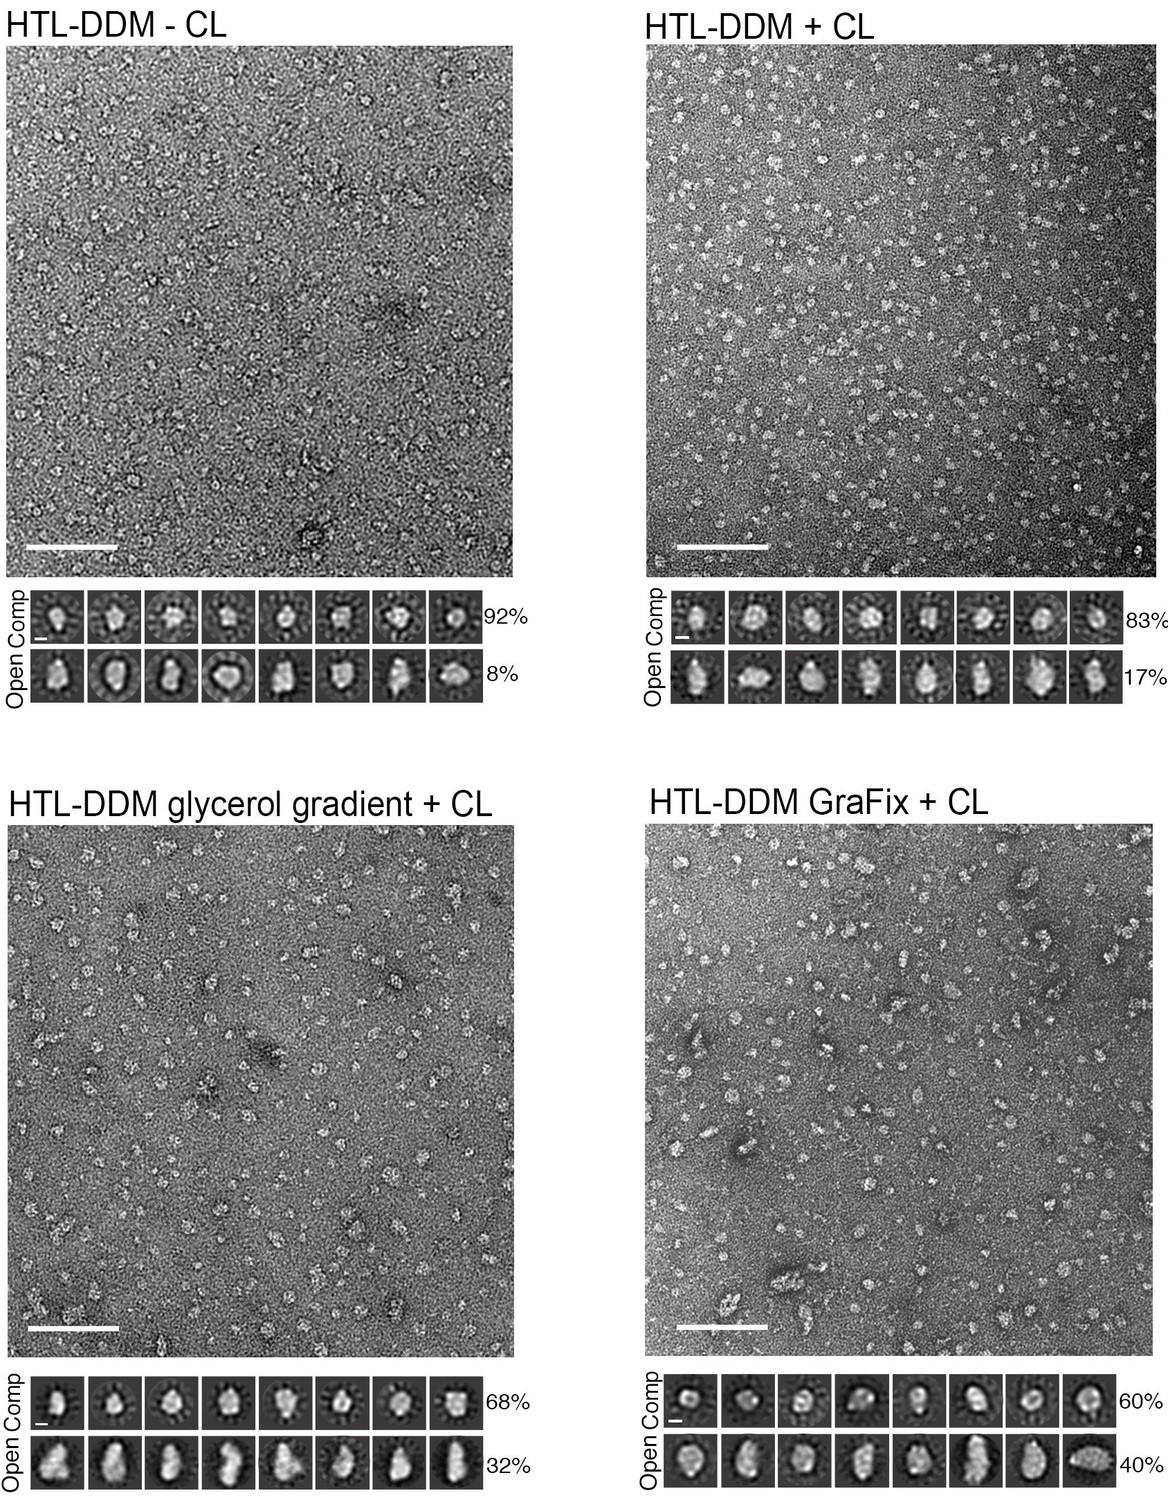
EM field of wild type HTL in different conditions.
Bottom, reference-free (RF) class averages of the ‘compact’ (comp) and ‘open’ populations found in the micrographs. Percentages of the populations are indicated on the right of the RF images. Micrograph scale bar, 1000 Å. RF scale bar, 100 Å. The conditions used for sample preparation are stated above micrographs.
Figure 4 with 1 supplement
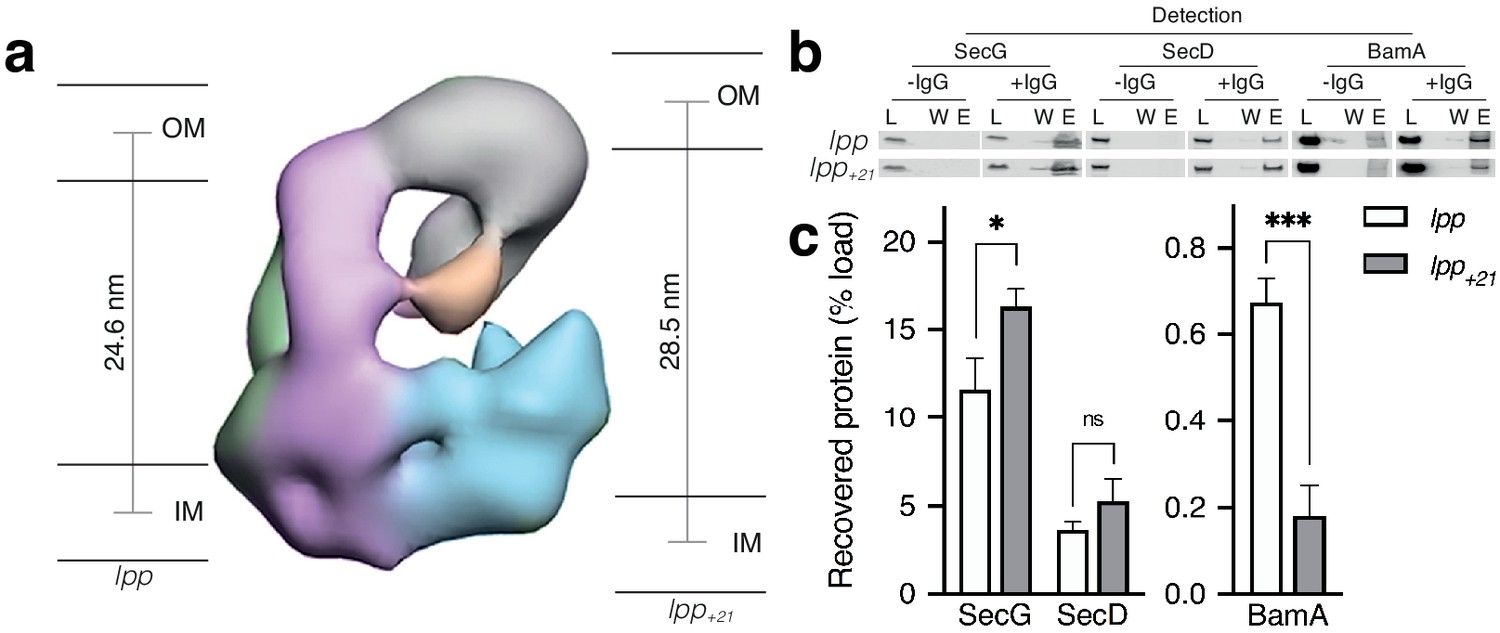
Effect of increasing periplasmic distance on the HTL-BAM interaction.
(a) Negative-stain EM model of HTL-BAM (from Figure 2a), annotated with membranes at the experimentally determined distances between the inner- and outer- membranes of E. coli strains containing wild-type lpp and mutant lpp+21 (Asmar et al., 2017). (b) Co-immunoprecipitation of SecG, SecD, and BamA when pulling from an anti-SecG monoclonal antibody. Co-IPs were conducted in the presence of cardiolipin as in Figure 1d, but with solubilised membranes of strains described in (a). (c) Quantification of IPs from (b). Error bars represent SEM. An unpaired T-test was used to compare samples (p=0.05, n = 3, * = <0.05, *** = <0.001, p values from left to right are 0.0170, 0.0990, and 0.0006).
Figure 4—figure supplement 1
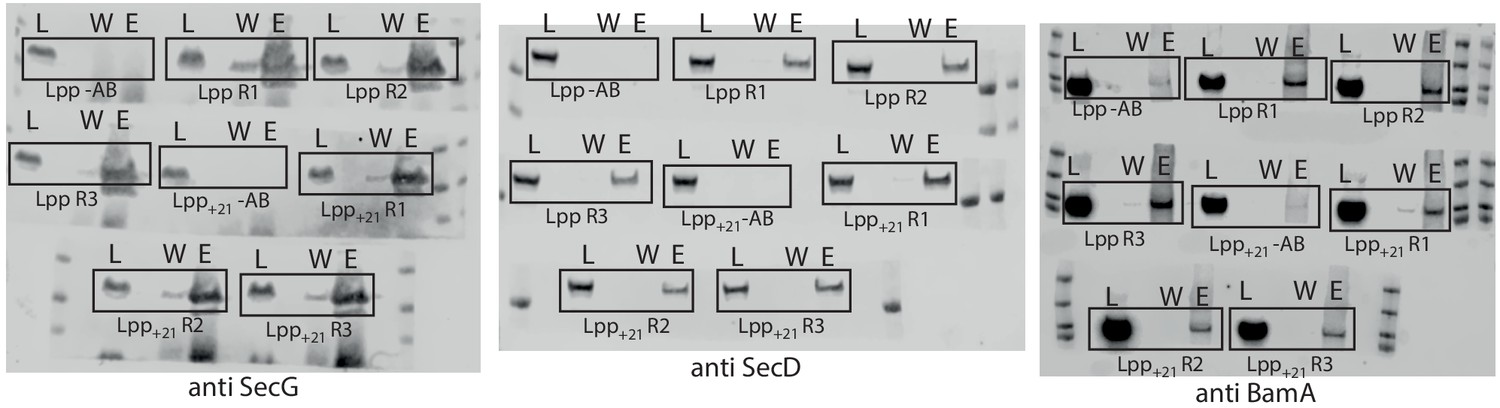
Raw western blots of IPs investigating how periplasmic width effects the HTL-BAM interaction.
Legend is the same as described for Figure 1—figure supplement 1a, but the cell strains used here were either E. coli containing WT lpp or the mutant lpp+21. All IPs were conducted in the presence of cardiolipin.
Figure 5 with 1 supplement
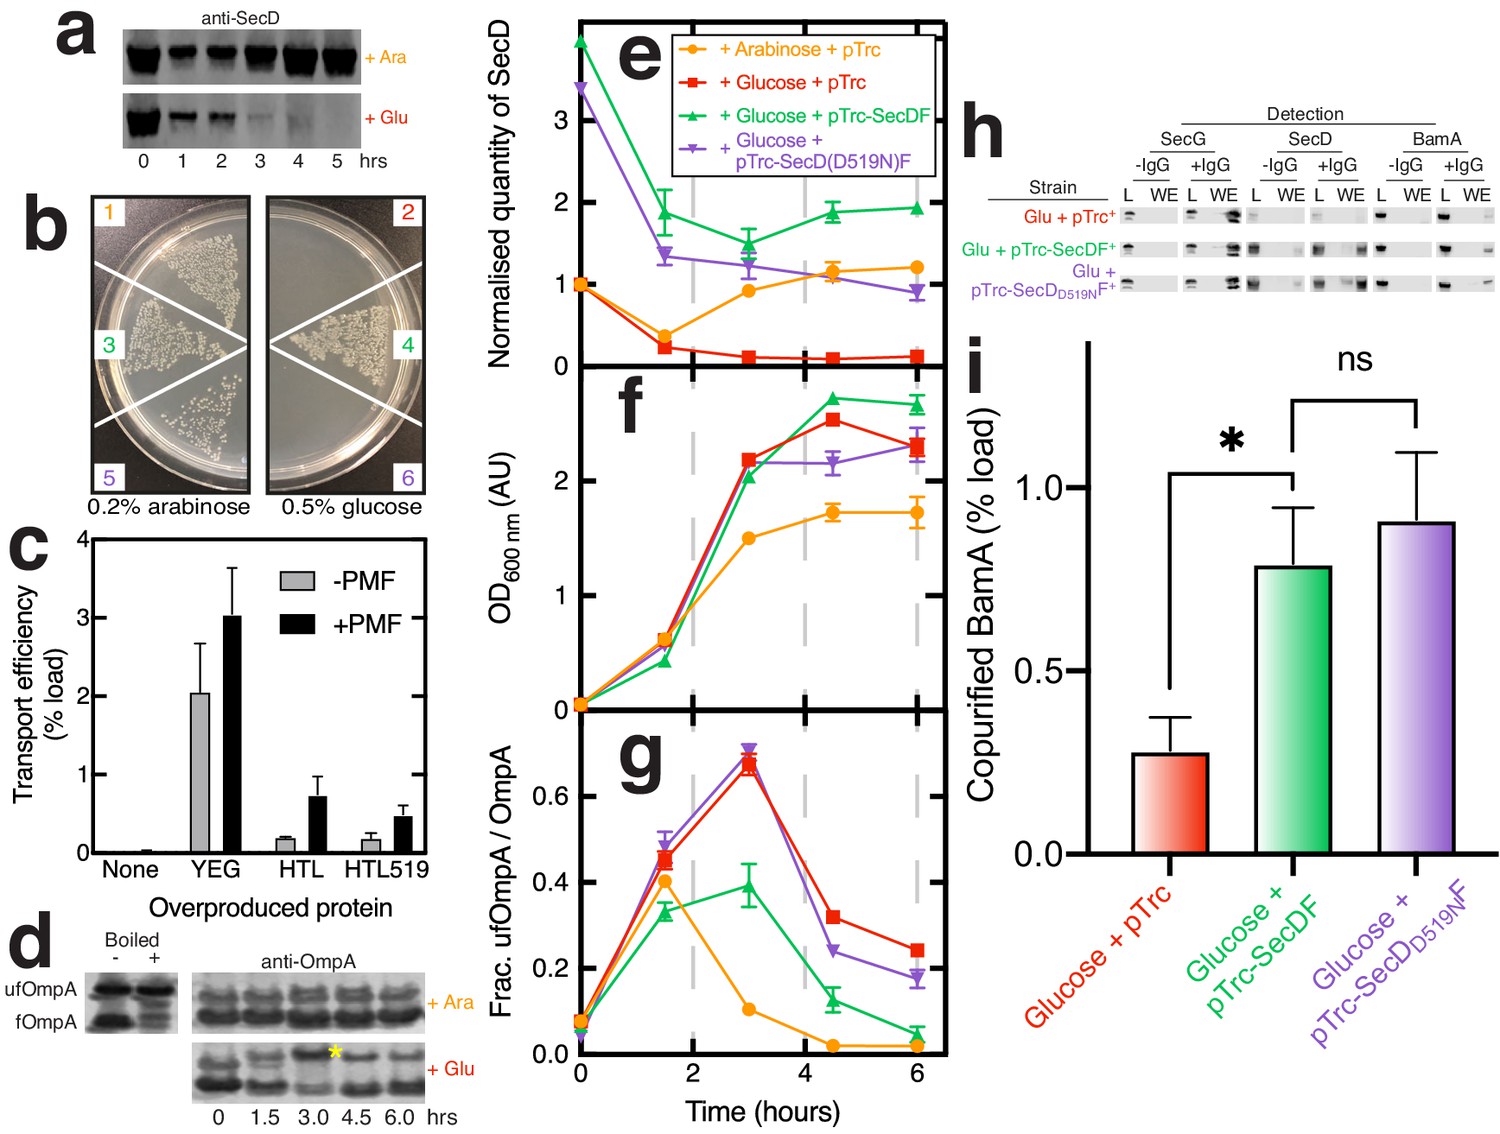
Effects of SecD depletion upon cell growth, OmpA transport across the inner-membrane, and maturation.
(a) Western blot illustrating depletion of SecD in E. coli JP325 whole cells when grown in the presence of arabinose or glucose. t = 0 represents the time at which an overnight culture (grown in arabinose) was used to inoculate a secondary culture containing either arabinose or glucose. (b) Growth of E. coli JP325 transformed with empty vector (pTrc99a, 1 + 2), pTrc99a-secDF (3 + 4), and pTrc99A-secDD519NF (5 + 6). Primary cultures were prepared in permissive conditions (arabinose). Cells were then washed and plated onto LB-arabinose (left panel) or LB-glucose (non-permissive, right panel). (c) Classical SecA-driven in vitro import assay with E. coli inverted inner-membrane vesicles (IMVs) and proOmpA. IMVs contained over-produced protein as stated on the x-axis. Error bars represent SEM (n = 3). (d) Periplasmic fractions of E. coli JP325 immunoblotted for OmpA. Folded OmpA (bottom band fOmpA) and unfolded OmpA (top band, yellow asterisk; ufOmpA) are shown. Also shown are control lanes containing E. coli whole cells with over-produced, mainly ‘folded’ OmpA (fOmpA, bottom band) and the same sample, but boiled, to produce ‘unfolded’ OmpA (ufOmpA, top band). For (e–g), samples were prepared from various cell cultures; see key (inset (e)) for strains used. Error bars represent SEM (n = 3 for experimental samples grown in glucose). (e) Quantification of SecD from western blots such as those shown in (a) (Figure 5—figure supplement 1a). Values are normalised to JP325-pTrc99a at t = 0. (f) Culture growth curves. (g) Analysis of western blots such as those from (d) and Figure 5—figure supplement 1d showing the quantity of ufOmpA as a fraction of the total OmpA in the periplasmic fraction. (h) Representative western blots of co-immuno-precipitations conducted as in Figure 1d in the presence of CL, but with solubilised membranes prepared from E. coli JP325 grown in the presence of glucose and cloned with variants of pTrc99a, as stated in the figure. (i) Quantification of BamA pull-down from co-IPs shown in (h). Error bars represent SEM. An unpaired T-test was used to compare samples (p=0.05, n = 3, * = <0.05, p values from left to right are 0.0449 and 0.6412).
Figure 5—figure supplement 1
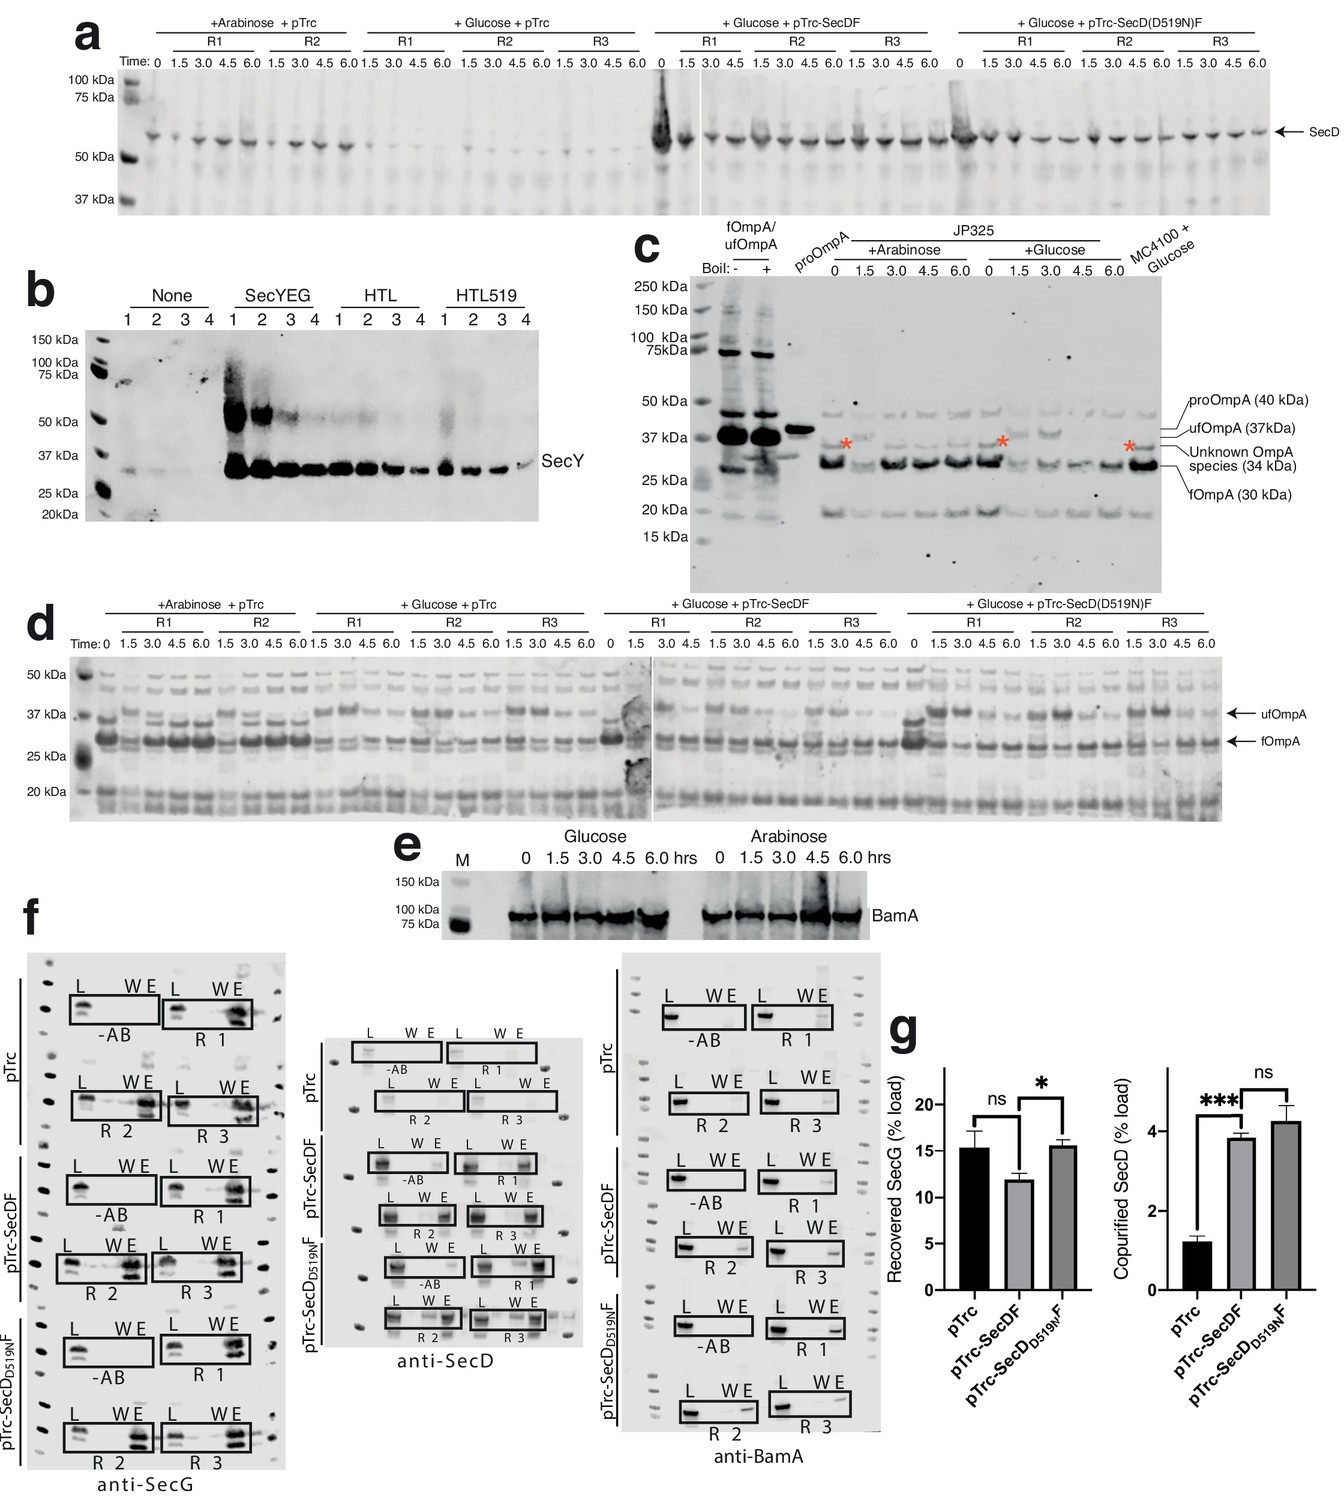
Raw western blots and control quantifications accompanying SecD depletion experiments from Figure 5.
(a) Western blots of whole cells visualised for SecD. Cell strains used were E. coli JP325 containing either empty pTrc99a, pTrc99a-SecDF, or pTrc99a-SecDD519NF. A preculture of JP325 was grown in arabinose. Cells were washed and then used to inoculate secondary cultures containing either arabinose (permissive) or glucose (non-permissive), as indicated in the figure. R1/2/3 represent samples taken from replicate cultures. These blots were quantified to give Figure 5f. (b) Immunoblotting of SecY in inverted membrane vesicles used in Figure 5c. Samples were prepared at four dilutions: neat (1), ½ (2), ¼ (3), and 1/8 (4). SecY is indicated at the expected apparent Mw of 30 kDa. A higher band is also present at approximately 50 kDa, likely due to SecY dimers. (c) OmpA western blots of periplasmic fractions of E. coli JP325 as prepared in (a), but with cells containing no plasmid. Three controls are shown: first, E. coli BL21 whole cells containing overproduced OmpA with no treatment (-, lane2) and with boiling (+, lane 3) to illustrate the presence of fOmpA and ufOmpA; second, purified proOmpA (lane 4); and third, a whole cell fraction of a preculture of the JP325 parent strain, MC4100, grown in the presence of arabinose. Red asterisks indicate an unknown OmpA intermediate (discussed in main text). (d) OmpA western blots of periplasmic fractions of cells from (a). Unfolded (ufOmpA) and folded OmpA (fOmpA) are indicated. These blots were quantified to give Figure 5i. (e) BamA western blot of whole JP325 taken from cultures grown during depletion of SecDF-yajC, as described in (a). (f) Raw western blots of co-IPs conducted in Figure 5e–f. Legend is the same as for Figure 1—figure supplement 1a, except the membranes used here were from strains described in (a), all grown in the presence of glucose for depletion of endogeneous SecDF-yajC. All IPs were conducted in the presence of cardiolipin. (g) Quantification of SecG and SecD from co-IPs shown in (f). An unpaired t-test was used to compare samples (p=0.05, n = 3, * = <0.05, *** = <0.001, p values from left to right are 0.0.1391, 0.0137, 0.0001 and 0.3618).
Figure 6 with 1 supplement
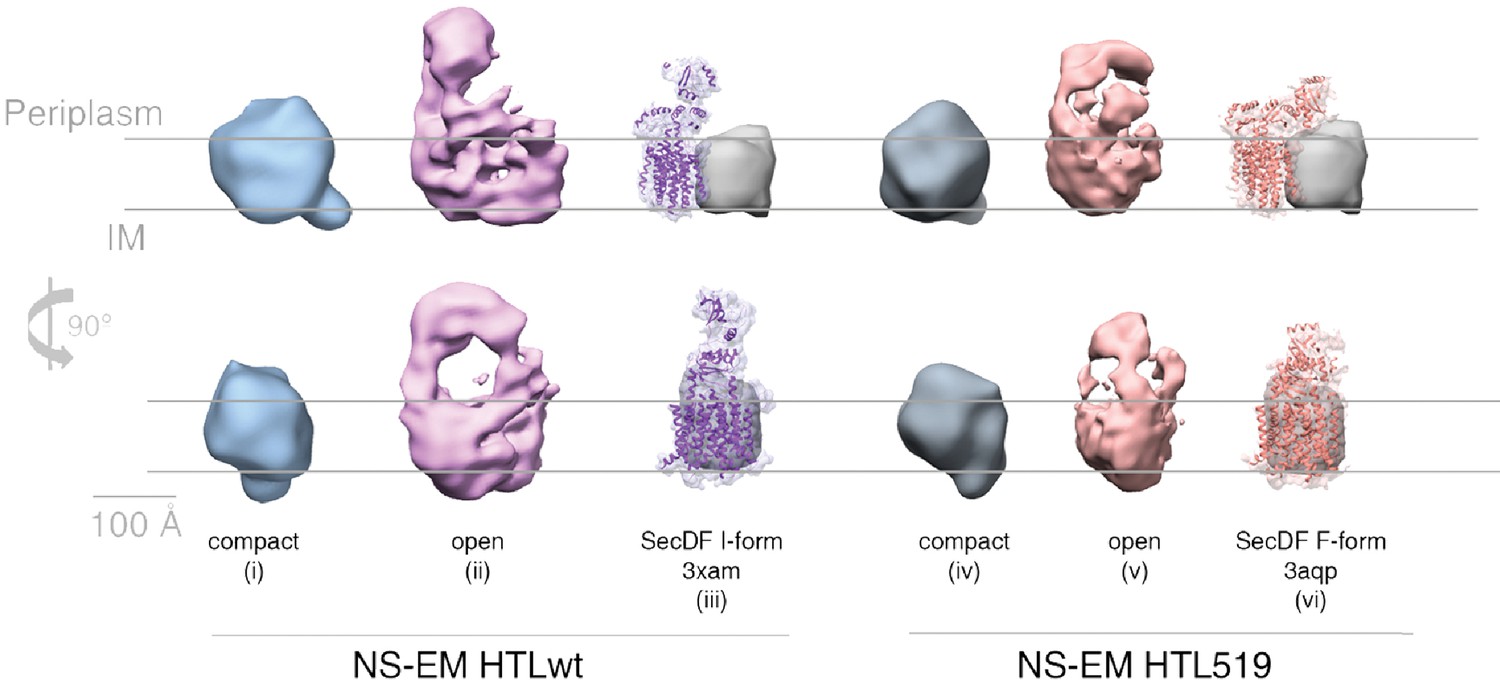
Structural comparison of HTL and HTL519.
Comparison of negative stain-EM structures of ‘compact’ (structures i and iv) and ‘open’ (structures ii and v) conformations of HTL versus the counterpart containing SecDD519NF (HTL519), both in the presence of CL. Atomic structures of SecDF overlaid with filtered maps at 5 Å are shown alongside for the I-form (structure iii, 3XAM) and F-form (structure vi, 3AQP), with the amino acid substitution equivalent to the E. coli SecDD519N in 3AQP. The grey arbitrary mass indicates the approximate position and mass of SecYEG.
Figure 6—figure supplement 1
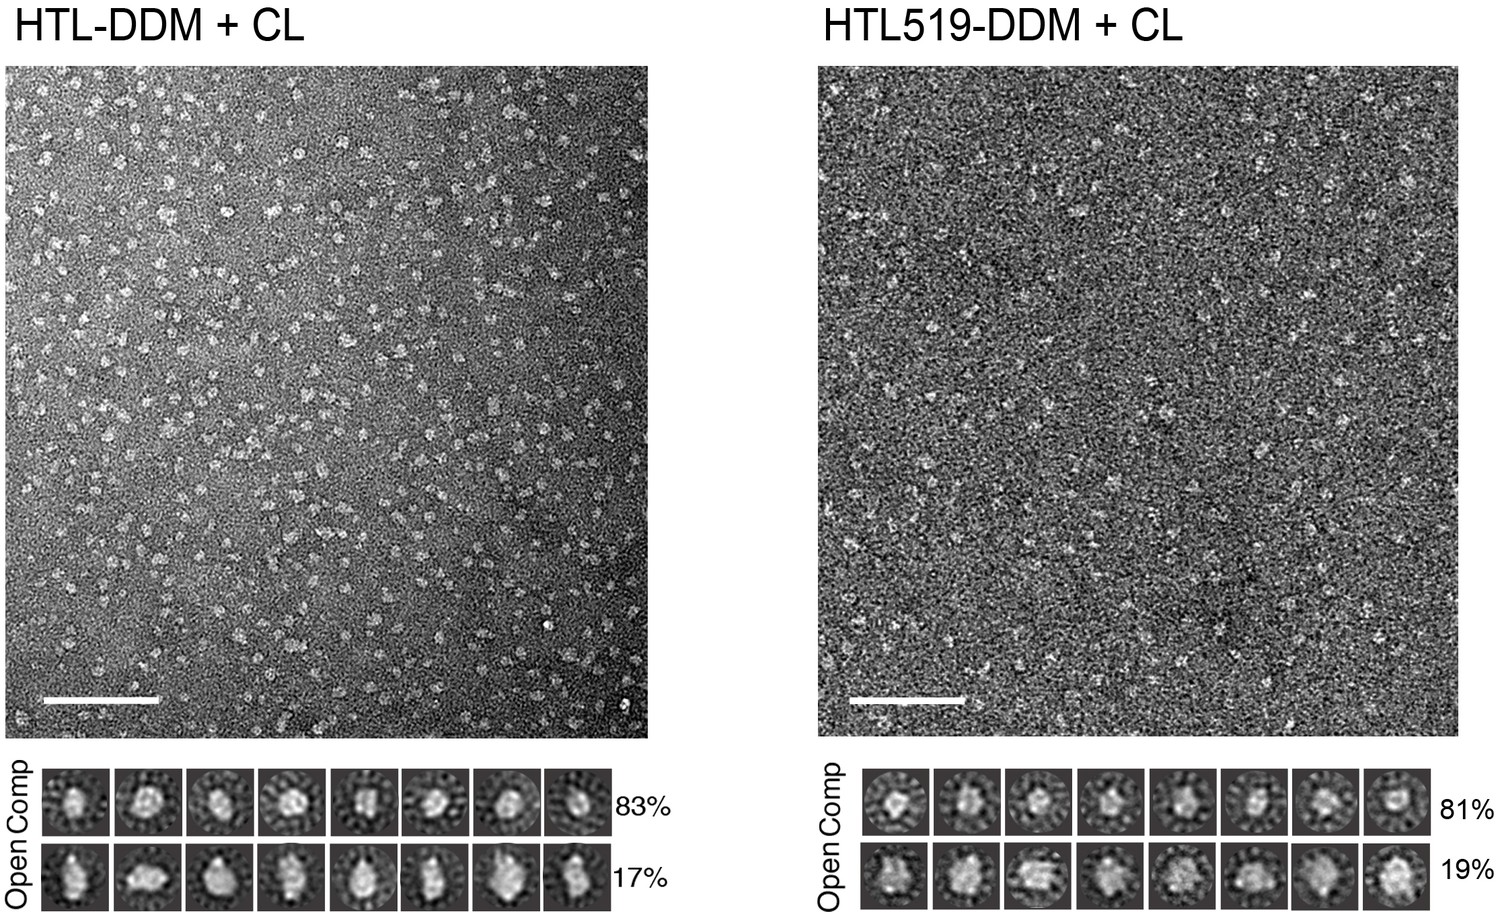
Negative-stain EM of the native HTL and the version containing SecDD519N (HTL519).
Electron micrographs of wild type (wt) HTL and HTL containing SecDD519NF (HTL519) in the same conditions (with cardiolipin, and without GraFix). Bottom, reference-free (RF) class averages of the ‘compact’ (comp) and ‘open’ populations found in the micrographs (top). Percentages of the populations are indicated on the right of RF images. Micrograph scale bar, 1000 Å. RF scale bar, 100 Å.
Figure 7
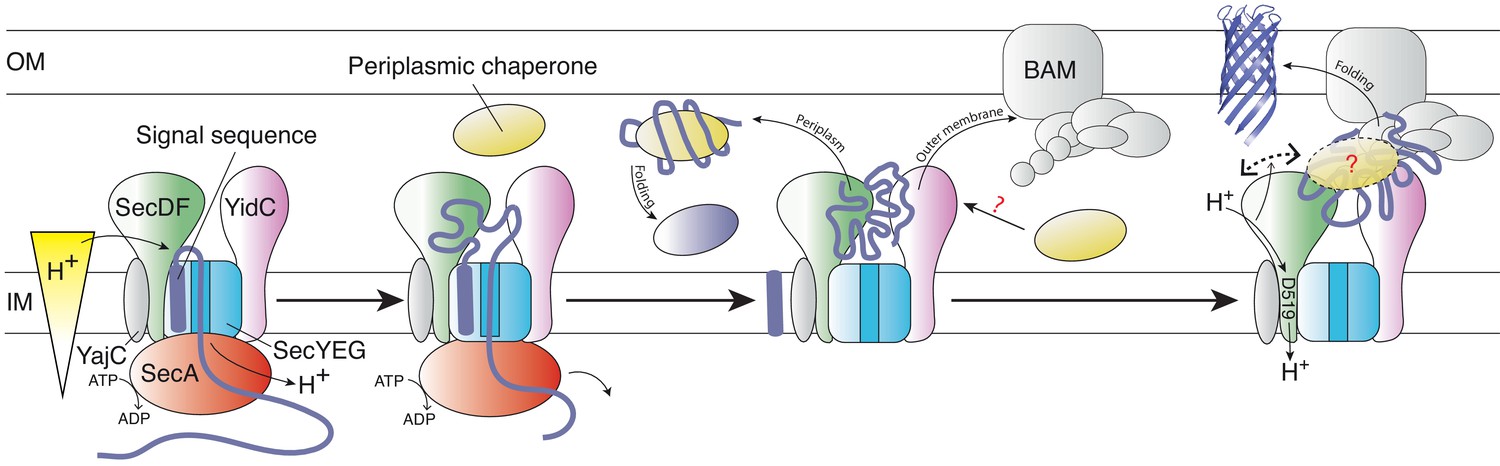
Schematic representation of the HTL-BAM machinery.
Model of OMP transfer through the bacterial envelope, facilitated by HTL-BAM and periplasmic chaperones, such as SurA, Skp, PpiD, and YfgM. From left to right: OMP precursors with an N-terminal signal sequence are driven across the membrane by the ATPase SecA through the Sec translocon – this process is stimulated by the PMF (independent of SecDF). Late in this process, the pre-protein emerges into the periplasm and the signal sequence is removed, releasing the mature protein. Presumably, globular proteins are then guided into the periplasm, where folding will occur assisted by periplasmic chaperones. Otherwise, OMP-chaperone-HTL complexes are recognised by the BAM complex, with interactions forming between BAM and both HTL (this study) and SurA (Sklar et al., 2007). The persistence and variety of chaperones involvement at this stage is unclear (?). This conjunction enables the smooth and efficient passage of OMPs to the outer-membrane, which is enabled by coupling of the inner-membrane proton-motive force with conformational changes in the periplasmic domain of SecDF (right).
Additional files
Download links
A two-part list of links to download the article, or parts of the article, in various formats.
Downloads (link to download the article as PDF)
Open citations (links to open the citations from this article in various online reference manager services)
Cite this article (links to download the citations from this article in formats compatible with various reference manager tools)
Inter-membrane association of the Sec and BAM translocons for bacterial outer-membrane biogenesis
eLife 9:e60669.
https://doi.org/10.7554/eLife.60669


