Humans disrupt access to prey for large African carnivores
- Applied Wildlife Ecology Lab, Ecology and Evolutionary Biology Department, University of Michigan, United States
Figures
Figure 1
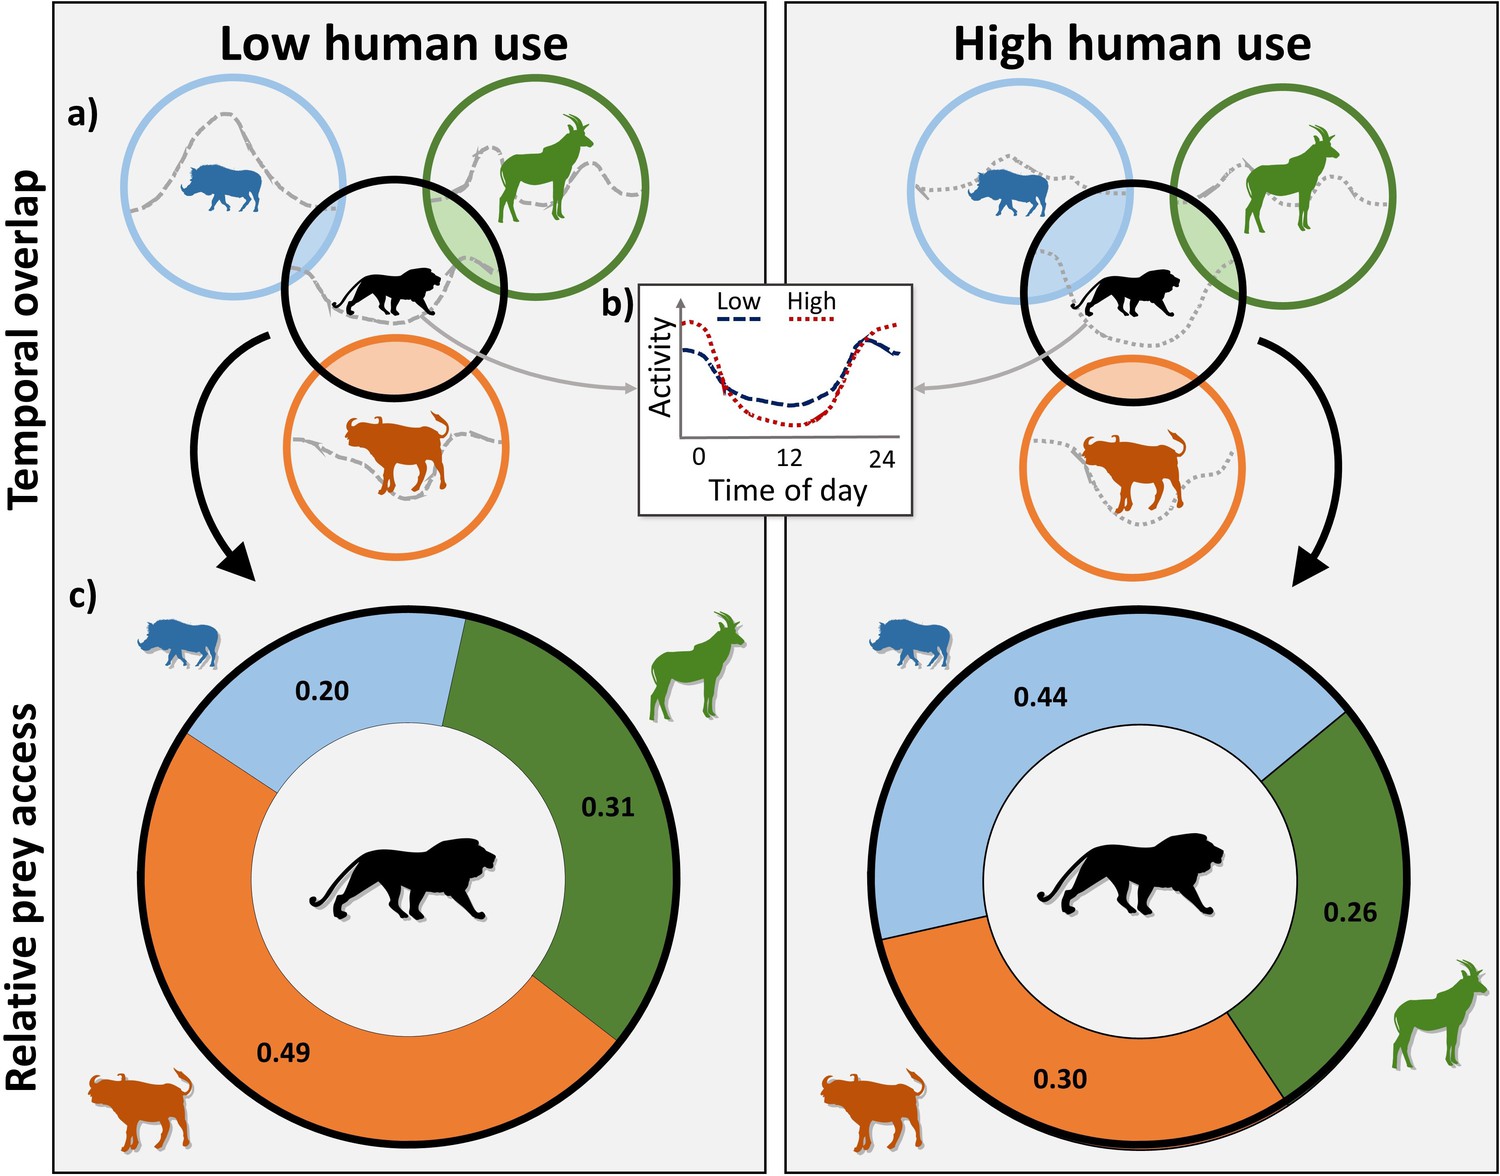
Conceptual framework illustrating the community-level effects of human presence on predator-prey temporal interactions.
(a) Circles represent the temporal niche occupied by each species (three prey and one predator), and shaded regions indicate temporal overlap between the predator and a prey species (i.e. shared temporal niche space). Dotted lines within each circle depict the species’ temporal activity distribution. (b) The diel activity patterns of both predators and prey are expected to shift in response to human presence, generally increasing nocturnal activity to avoid humans during the day. (c) As wildlife diel activity changes, so does predator access to individual prey. Human-induced shifts can lead to intensified or relaxed predation pressures on an individual prey species depending on the diel responses of the prey compared to the predator and other sympatric prey.
Figure 2 with 1 supplement

Results of spatial and temporal human use within the W-Arly-Pendajri protected area complex in Burkina Faso and Niger, West Africa.
(a) Map of study area within the W-Arly-Pendjari complex with surveyed 10-km2 grid cells. Color depicts estimated levels of human occupancy within the study area, averaged across years for grid cells surveyed in multiple years. (b) Corresponding frequencies of grid-level human occupancy for 3 survey years, with dotted line depicting mean human occupancy (0.54). (c) Human diel activity kernel density distribution from camera detections.
Figure 2—figure supplement 1
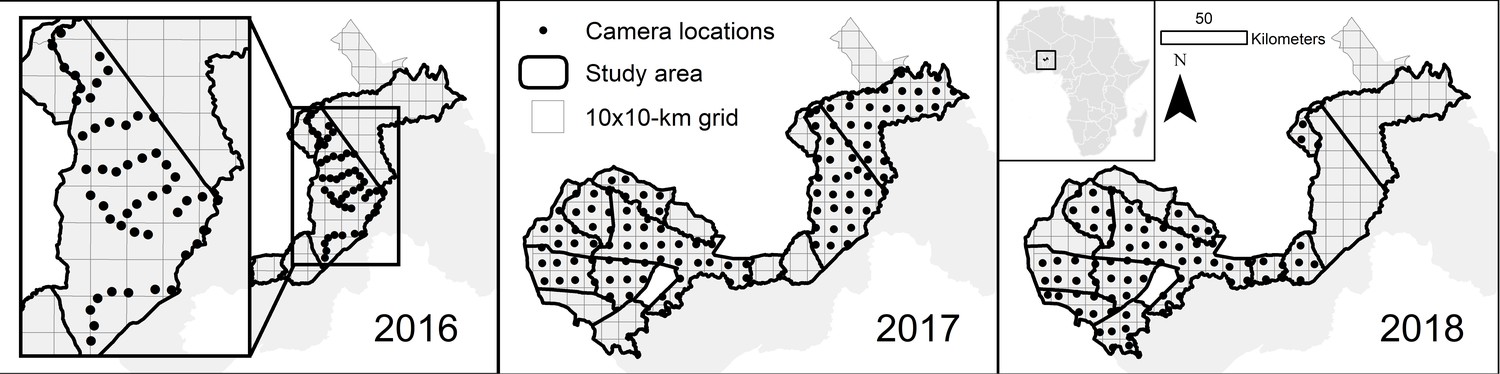
Camera placement in W-Arly-Pendjari protected area complex from 3 survey years.
Fifty cameras were deployed in 2016, 115 cameras in 2017, and 73 cameras in 2018. Modified from Mills et al. (1).
Figure 3 with 1 supplement
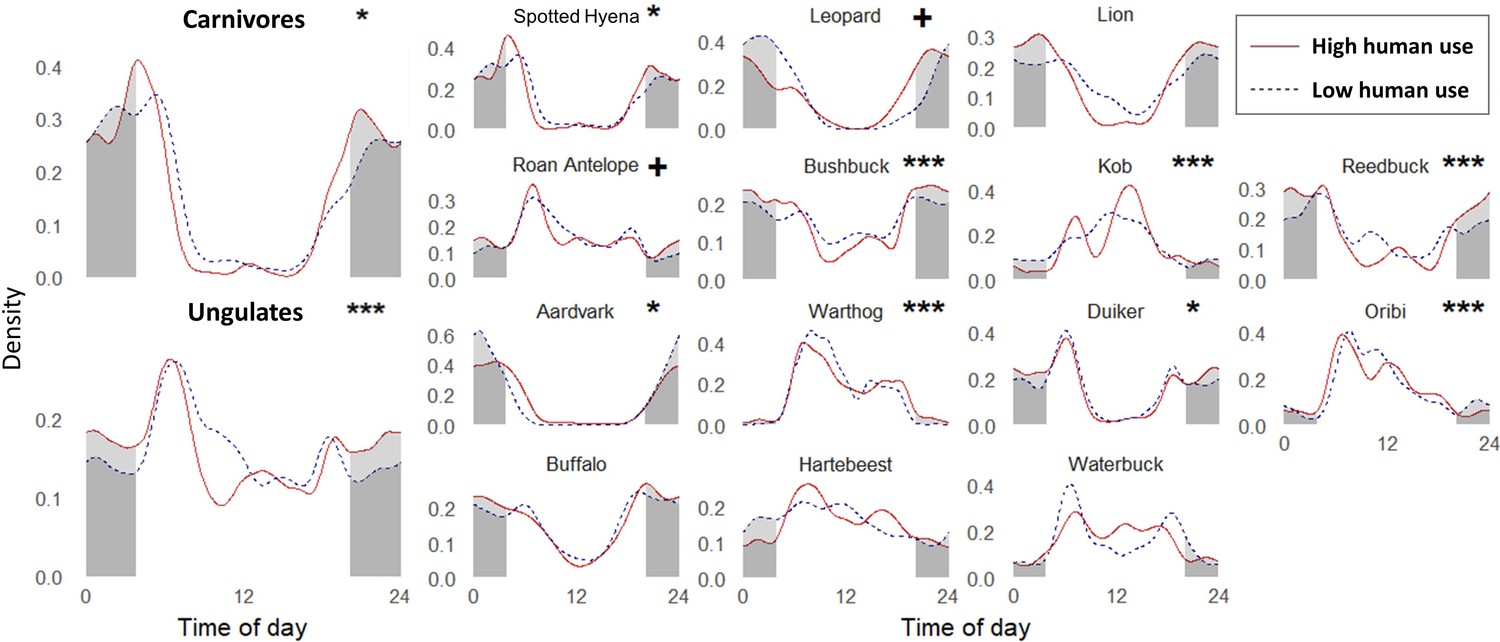
Temporal activity kernel density curves for large carnivores (top row) and ungulates in areas of low and high human use (threshold human occupancy = 0.54).
Nocturnal diel periods (2 hr after sunset to 2 hr before sunrise) are shaded using the average times of sunrise and sunset during our study period, and lighter shading represents the diel-specific nocturnal activity that is different between low and high human areas. Significance levels for bootstrapped randomization test of differences in diel distributions between human zones: *<0.05, **<0.01, ***<0.001. Plus signs (+) represent species with p-values<0.1 which achieved significance when the human occupancy threshold was adjusted ±0.1 (Supplementary file 3).
Figure 3—figure supplement 1
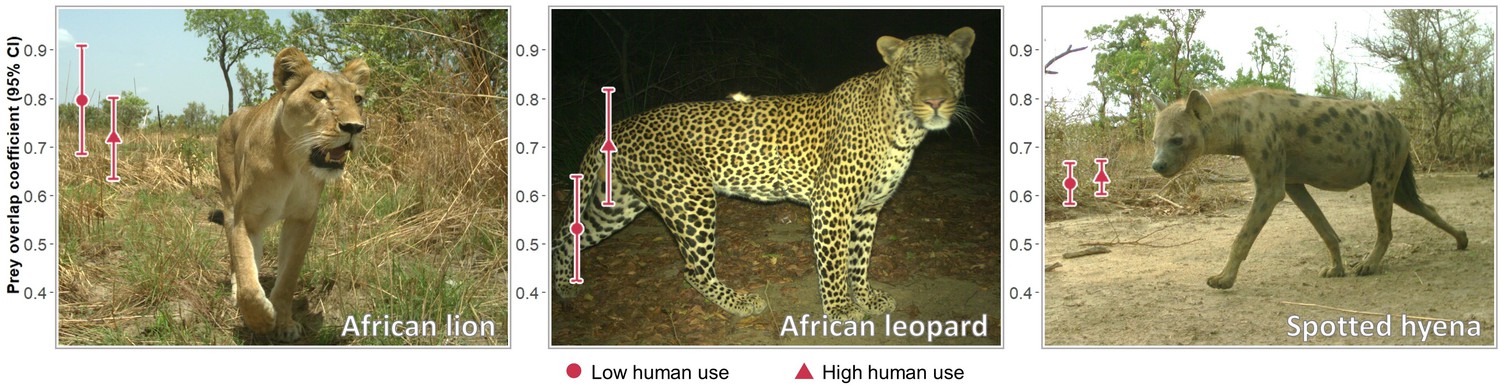
Temporal overlap coefficients (Δ) between each predator and their associated prey species.
Buffalo not included as prey for African leopard. Error bars represent bias-corrected, bootstrapped 95% confidence intervals of coefficient estimates. Photo credit: Applied Wildlife Ecology Lab (AWE), University of Michigan, images from camera trap survey within the study area.
Figure 4
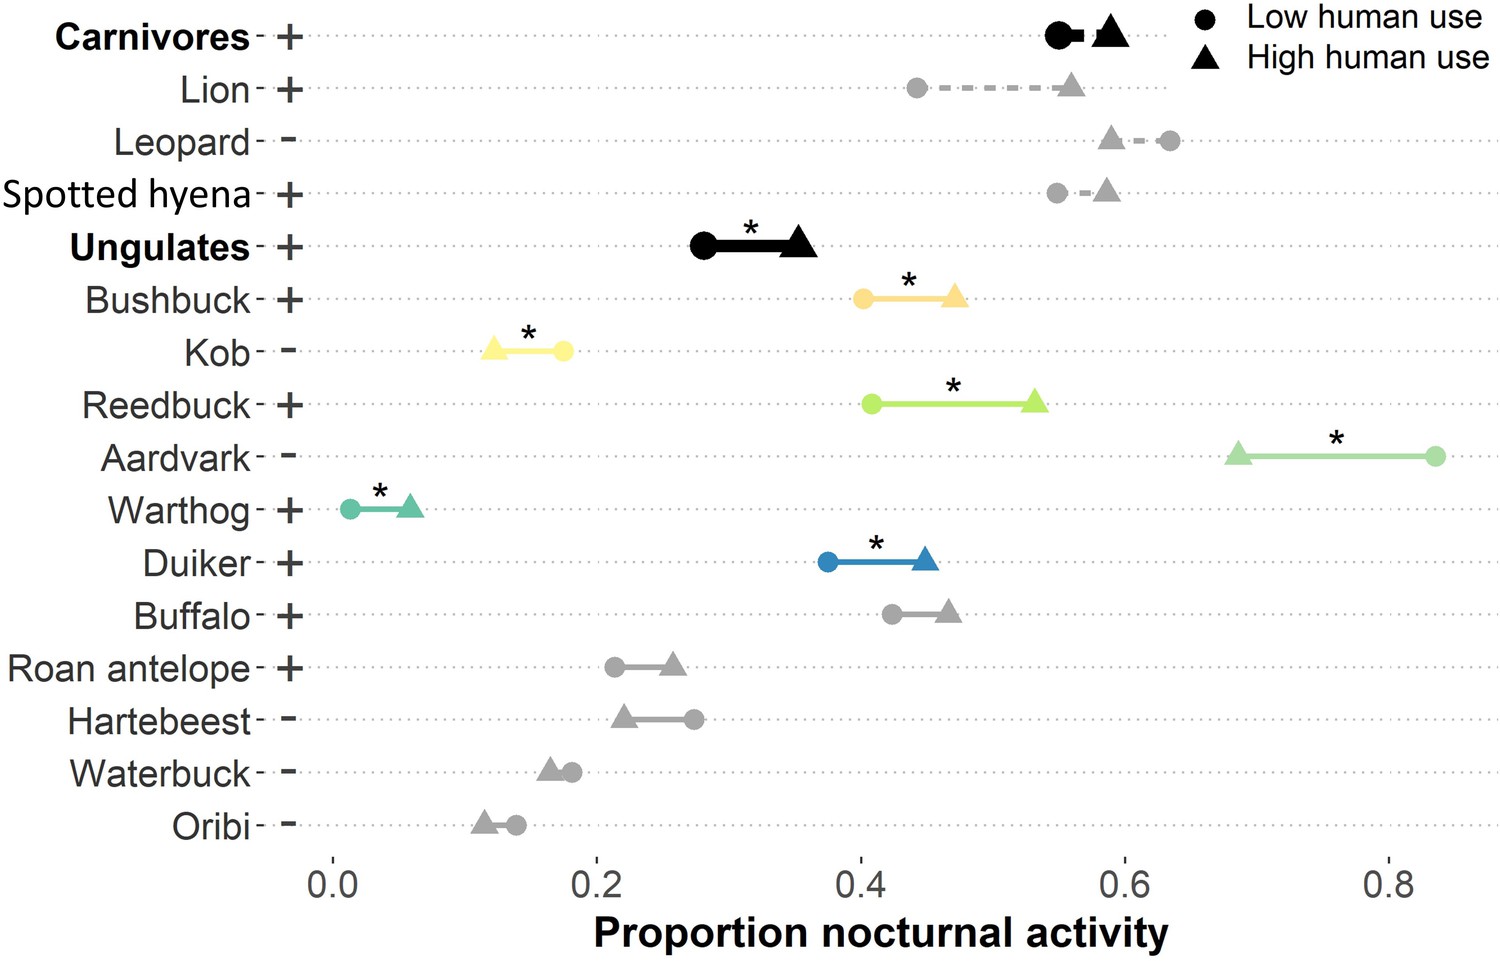
Proportion of activity during the nocturnal diel period (2 hr after sunset to 2 hr before sunrise) between low and high human zones for large carnivores (dashed lines) and ungulates (solid lines).
Increases and decreases in nocturnality from low to high human use areas are indicated by plus (+) and minus (–) labels next to species’ names, respectively. Stars (*) above colored lines indicate species that showed significant differences in nocturnal activity between human zones based on bootstrapped 95% CIs of nocturnality, and the colors of those species’ lines correspond to species colors used in Figure 5.
Figure 5
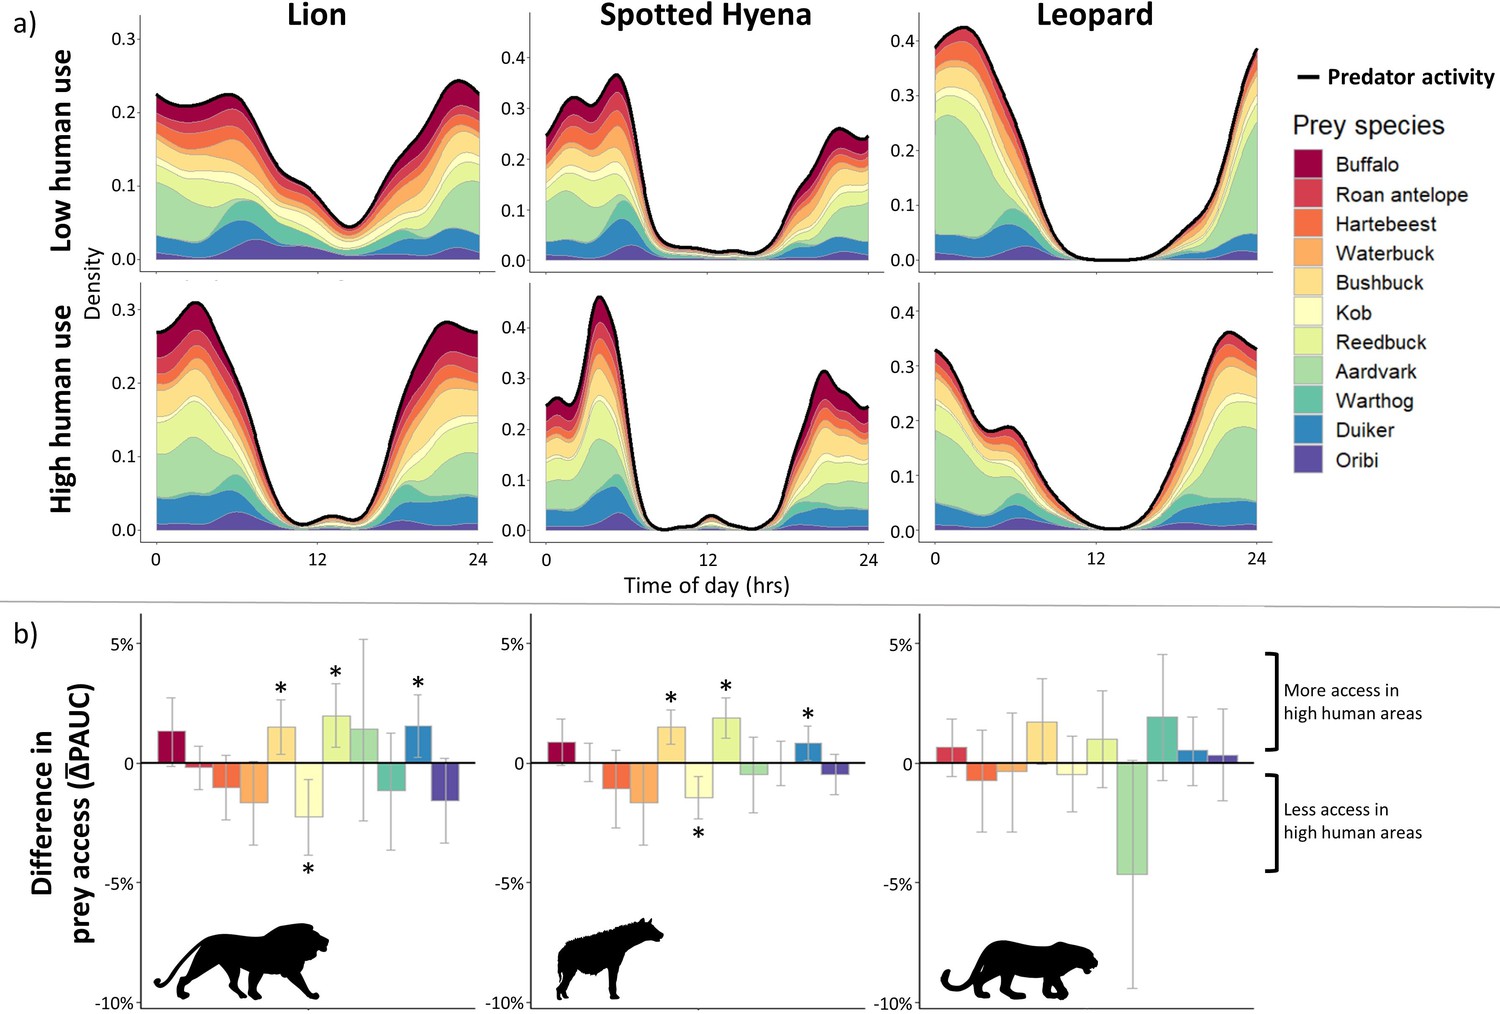
Differences in prey access between human activity zones for African lions, spotted hyenas, and African leopards from new temporally explicit community analysis.
Buffalo was not included as prey for leopard. (a) Temporal overlap heatmaps representing the relative contributions of each prey species to the overall available prey base scaled to predator activity curve (solid black line) over the 24-hr cycle. Density values are calculated from kernel density temporal curves for predators and prey species. (b) Mean differences in prey access based on species-specific area under the predator activity curve (ΔPAUC) between areas of low and high human pressure, averaged among 10,000 parametric bootstrap replicates. Error bars represent bootstrapped 95% confidence intervals of , with asterisks (*) designating significant differences in predator access to prey species.
Additional files
-
Source data 1
Detection histories using 30-minute quiet period for 3 large carnivores and 11 ungulate prey species in the W-Arly-Pendjari complex obtained from a systematic camera survey over 21,430 trap-nights (January-June 2016-2018).
- https://cdn.elifesciences.org/articles/60690/elife-60690-data1-v1.csv.zip
-
Supplementary file 1
Species detections (using 30 min quiet periods) during the camera survey and common diel period.
Asterisks (*) indicate significant shifts in diel activity distributions due to human presence. Changes in nocturnality are depicted for species with significant increases (+) and decreases (-) in response to humans. Empty cells represent no significant changes.
- https://cdn.elifesciences.org/articles/60690/elife-60690-supp1-v1.docx
-
Supplementary file 2
Human occupancy model selection table of top models with ΔAICc < 2 derived from camera data collected over three survey seasons in the W-Arly-Pendjari complex, West Africa.
Detection (p) and occupancy (ψ) were modeled using the following covariates: CAM = camera type, SAV = percent savanna, YR = survey year, SITE = survey site, MGMT = management type (national park or hunting concession).
- https://cdn.elifesciences.org/articles/60690/elife-60690-supp2-v1.docx
-
Supplementary file 3
Sensitivity analysis of species shifts in circular activity distributions, by adjusting the threshold value of human occupancy ±0.1 from the mean.
P-values are given for tests on species shifts using each threshold value. Sig. indicates the observed significance of shifts using the mean threshold value (0.54): + < 0.1, *<0.05, **<0.01, ***<0.001. The number of significant results (p-value<0.05) using different threshold values is given, for which three indicates significance using all thresholds and 0 indicates no significance for any threshold.
- https://cdn.elifesciences.org/articles/60690/elife-60690-supp3-v1.docx
-
Transparent reporting form
- https://cdn.elifesciences.org/articles/60690/elife-60690-transrepform-v1.docx
Download links
A two-part list of links to download the article, or parts of the article, in various formats.
Downloads (link to download the article as PDF)
Open citations (links to open the citations from this article in various online reference manager services)
Cite this article (links to download the citations from this article in formats compatible with various reference manager tools)
Humans disrupt access to prey for large African carnivores
eLife 9:e60690.
https://doi.org/10.7554/eLife.60690


