Application of human liver organoids as a patient-derived primary model for HBV infection and related hepatocellular carcinoma
- Department of Biochemistry, Erasmus University Medical Center, Netherlands
- Biomedical Sciences Research Center ‘Alexander Fleming’, Greece
- Department of Surgery, Erasmus University Medical Center, Netherlands
- Foundation Hubrecht Organoid Technology (HUB), Netherlands
- HybridStat Predictive Analytics, Greece
- Hubrecht Institute-KNAW, University Medical Centre Utrecht, Netherlands
- Department of Viroscience, Erasmus Medical Centre, Netherlands
- Max Plank Institute of Molecular Cell Biology and Genetics, Germany
- Department of Urology, Erasmus University Medical Center, Netherlands
- Department of Pathology, Erasmus University Medical Center, Netherlands
Figures
Figure 1 with 3 supplements
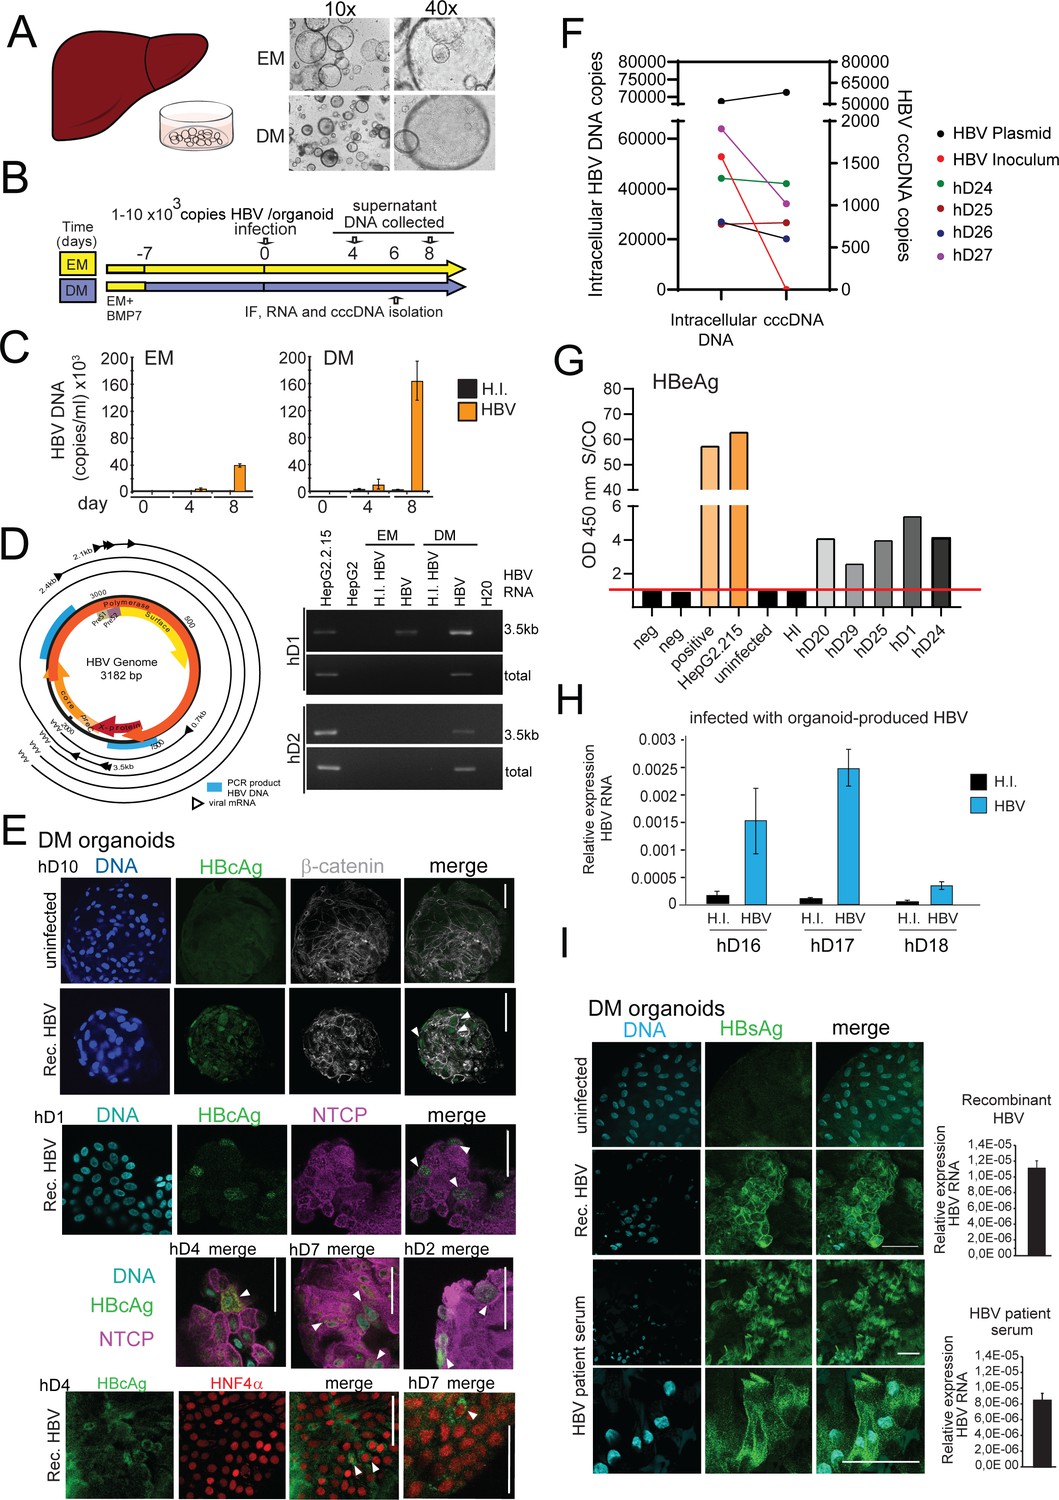
Modeling HBV infection in vitro using human liver organoids.
(A) Representative images of liver organoids in expansion medium (EM) and differentiation medium (DM). (B) Experimental design of infection experiments. Arrows indicate the time points for hepatitis B virus (HBV) detection. (C) Levels of HBV DNA in supernatants of infected organoid cultures were quantified at indicated times by quantitative polymerase chain reaction (qPCR) and compared to the cultures challenged with heat-inactivated (HI) virus. (D) Schematic of the HBV genome showing open reading frames (ORFs) (arrows), HBV RNA transcripts (black circular lines) and the localization of PCR products (blue boxes). The agarose gel demonstrates expression of 3.5kb RNA transcript and total HBV RNA by nested PCR performed on complementary DNA (cDNA) obtained from two in vitro infected healthy donor (hD) organoid lines. (E) Immunofluorescent staining showing the expression of HBV core antigen (HBcAg) (green) together with sodium taurocholate co-transporting polypeptide (NTCP) (magenta), β-catenin (gray), or Hepatocyte Nuclear Factor 4 Alpha (HNF4α) (red) performed in different hD organoids 6 days after HBV infection in the differentiation medium. (F) Quantification of total intracellular HBV DNA (left Y-axis) and covalently closed circular DNA (cccDNA) (right Y-axis) purified from four hD organoid lines 6 days post infection. Quantification of total HBV DNA and cccDNA is also shown from HepG2.2.15-produced virus (inoculum, negative control for cccDNA) and from double-stranded HBV plasmid (as positive control for cccDNA) as indicated. (G) Quantification of HBV early antigen (HBeAg) was performed by enzyme-linked immunosorbent assay (ELISA) from the supernatant of infected organoids. Challenge with HI virus and uninfected organoids was used as a control for HBeAg present in the inoculum. Positive and neg bars correspond to positive and negative controls provided by the kit manufacturer. (H) Expression of intracellular HBV RNA relative to beta-2-microglobulin in three hD organoid lines infected with organoid-produced HBV (concentrated from pooled supernatants of organoid cultures infected with HepG2.2.15-produced HBV). (I) Immunofluorescent staining showing the expression of HBV surface antigen (HBsAg) (green) in DM organoids infected with recombinant HBV and patient serum. Scale bars represent 50 µm. Bar graphs show total HBV RNA levels in the culture at the time of staining.
-
Figure 1—source data 1
Source data for Figure 1F.
- https://cdn.elifesciences.org/articles/60747/elife-60747-fig1-data1-v2.xlsx
-
Figure 1—source data 2
Source data for Figure 1G.
- https://cdn.elifesciences.org/articles/60747/elife-60747-fig1-data2-v2.xlsx
Figure 1—figure supplement 1
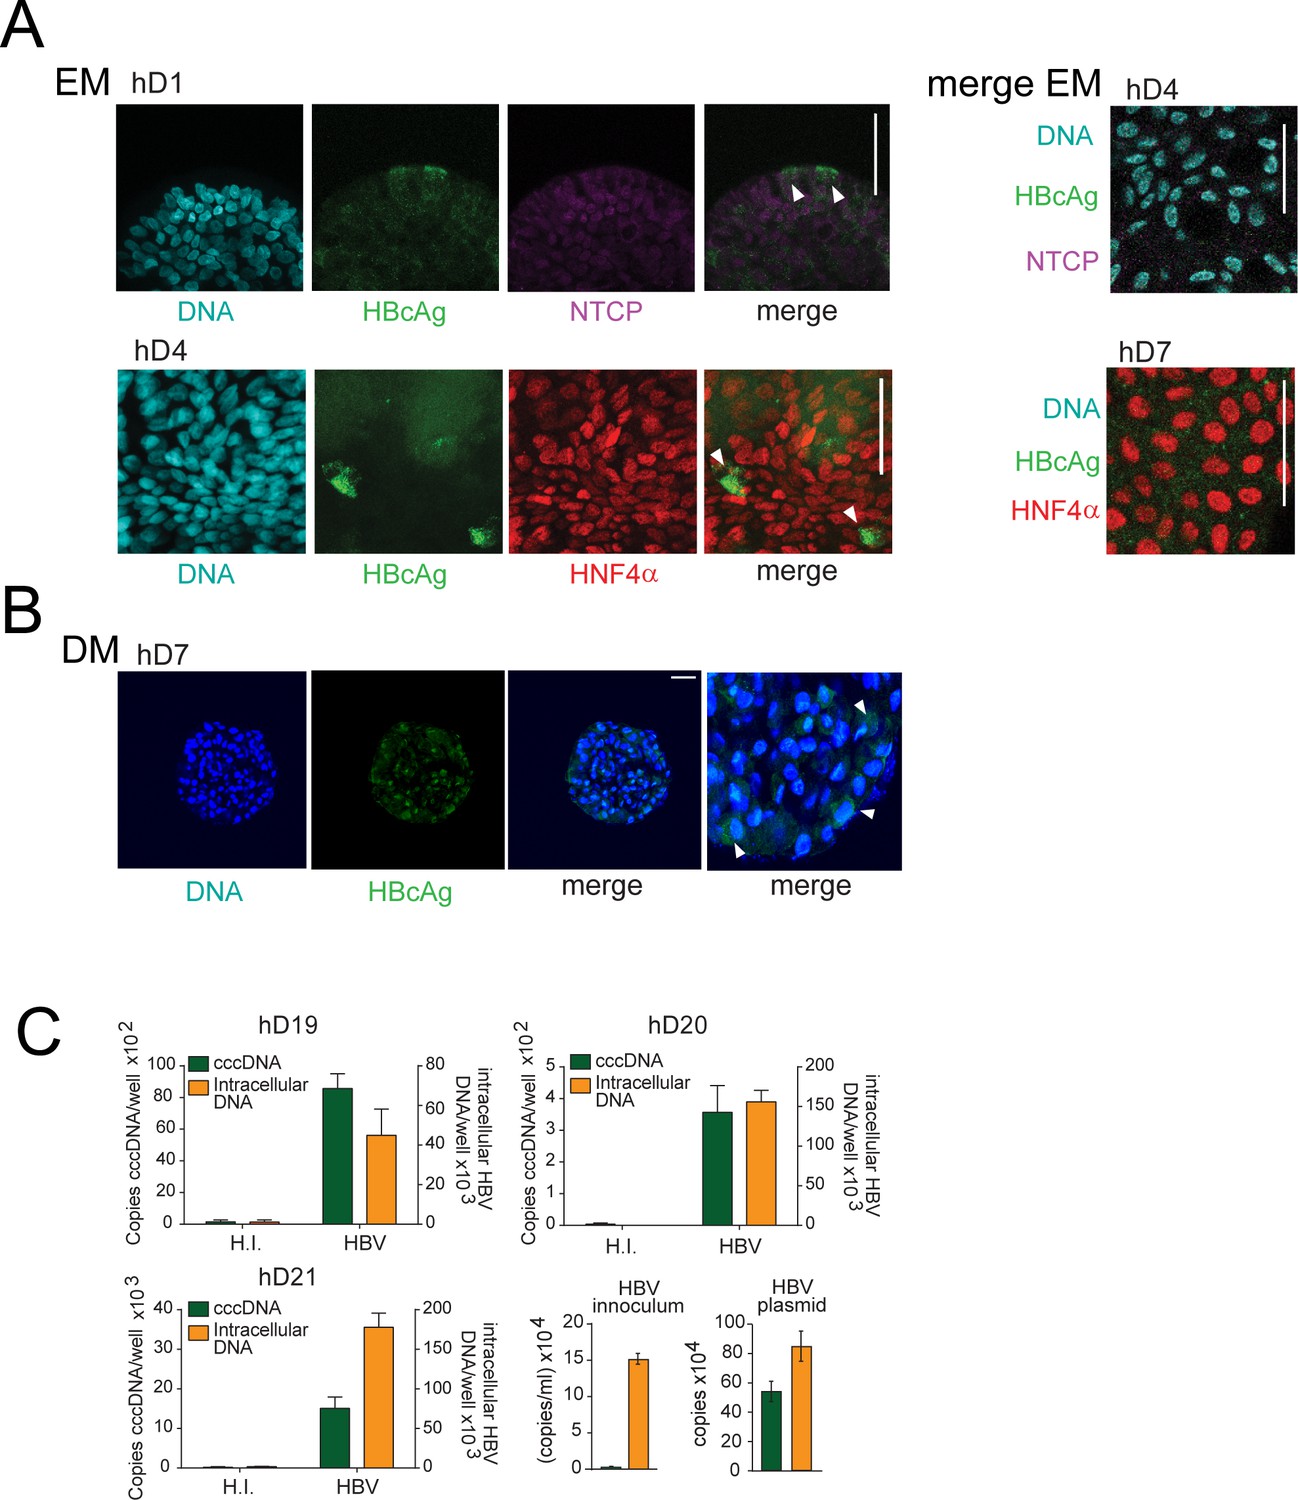
Expression of HBV core Ag in infected human liver organoids.
(A) Immunofluorescent staining showing the expression of hepatitis B virus core antigen (HBcAg) (green) together with sodium taurocholate co-transporting polypeptide (NTCP) (magenta) or HNF4α (red) performed in different healthy donor (hD) organoids 6 days after HBV infection in expansion condition (expansion medium [EM]). (B) Representative immunofluorescent images of differentiated organoid (differentiation medium [DM]) showing the expression of HBcAg (green) 6 days after HBV infection. (C) Quantification of total HBV DNA (orange) and covalently closed circular DNA (cccDNA) (green) present in intracellular DNA purified from three hD organoid lines after 6 days post infection with HBV under DM condition. Quantification of total HBV DNA and cccDNA is also shown from supernatant of infected organoids (inoculum) and from double-stranded HBV plasmid (as a positive control for cccDNA).
Figure 1—figure supplement 2
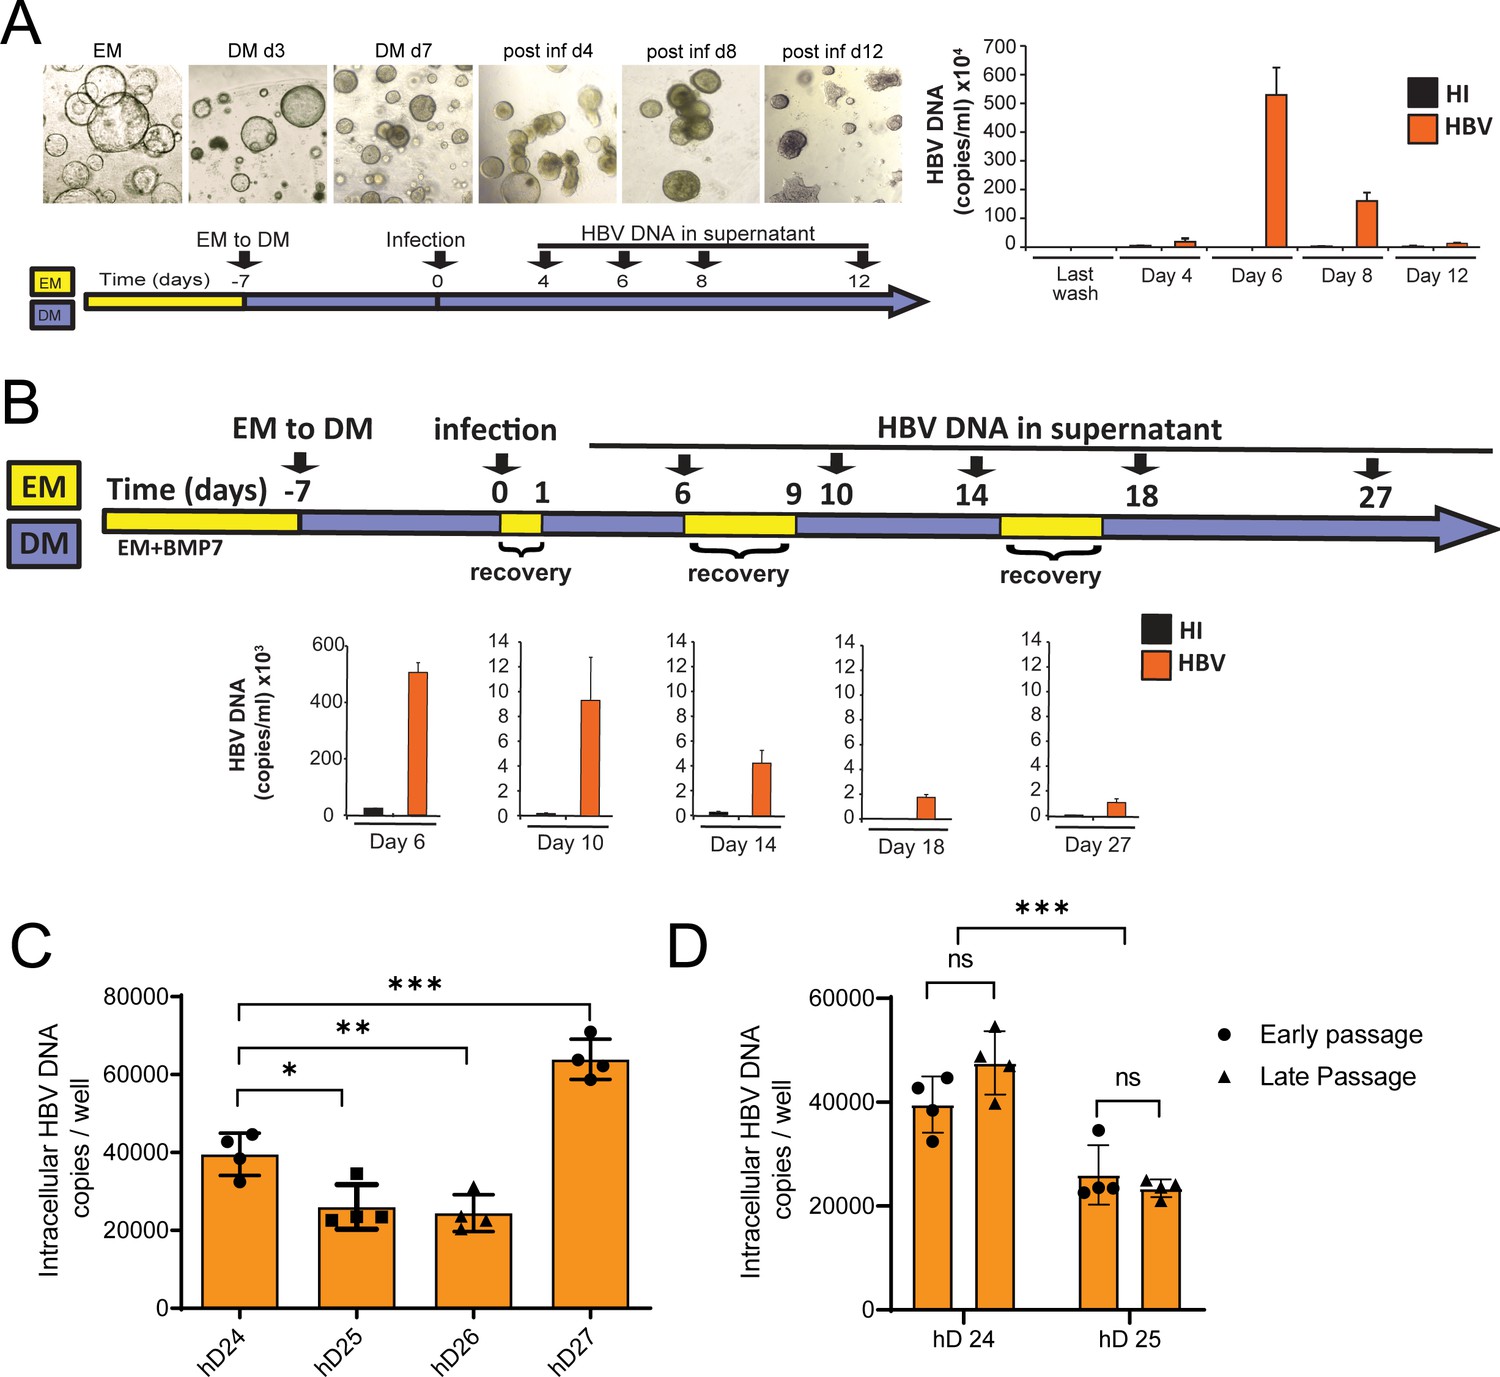
Release of HBV DNA declines over time in hD organoid lines infected in vitro.
(A) Bright-field images and levels of hepatitis B virus (HBV) DNA in the supernatant of infected organoids at different days post infection. (B) HBV DNA in the supernatant of infected organoids undergoing short expansion medium (EM) pulse treatments after infection. HBV DNA was quantified by quantitative polymerase chain reaction (qPCR) and compared to the mock-infected (heat-inactivated, HI) cultures. (C) Quantification of total HBV DNA from intracellular DNA of a healthy donor (hD) organoid after 6 days post infection with HBV. Error bars represent mean ± SD from four independent experiments (unpaired two-tailed t-test); *p<0.05; **p<0.01; ***p<0.001. (D) Quantification of total HBV DNA from intracellular DNA from two hD organoids 6 days post infection with HBV under differentiation medium (DM) in two different passages for each organoid line. Error bars represent mean ± SD from four independent experiments (unpaired two-tailed t-test); ***p<0.001.
-
Figure 1—figure supplement 2—source data 1
Source data for Figure 1—figure supplement 2C.
- https://cdn.elifesciences.org/articles/60747/elife-60747-fig1-figsupp2-data1-v2.xlsx
-
Figure 1—figure supplement 2—source data 2
Source data for Figure 1—figure supplement 2D.
- https://cdn.elifesciences.org/articles/60747/elife-60747-fig1-figsupp2-data2-v2.xlsx
Figure 1—figure supplement 3
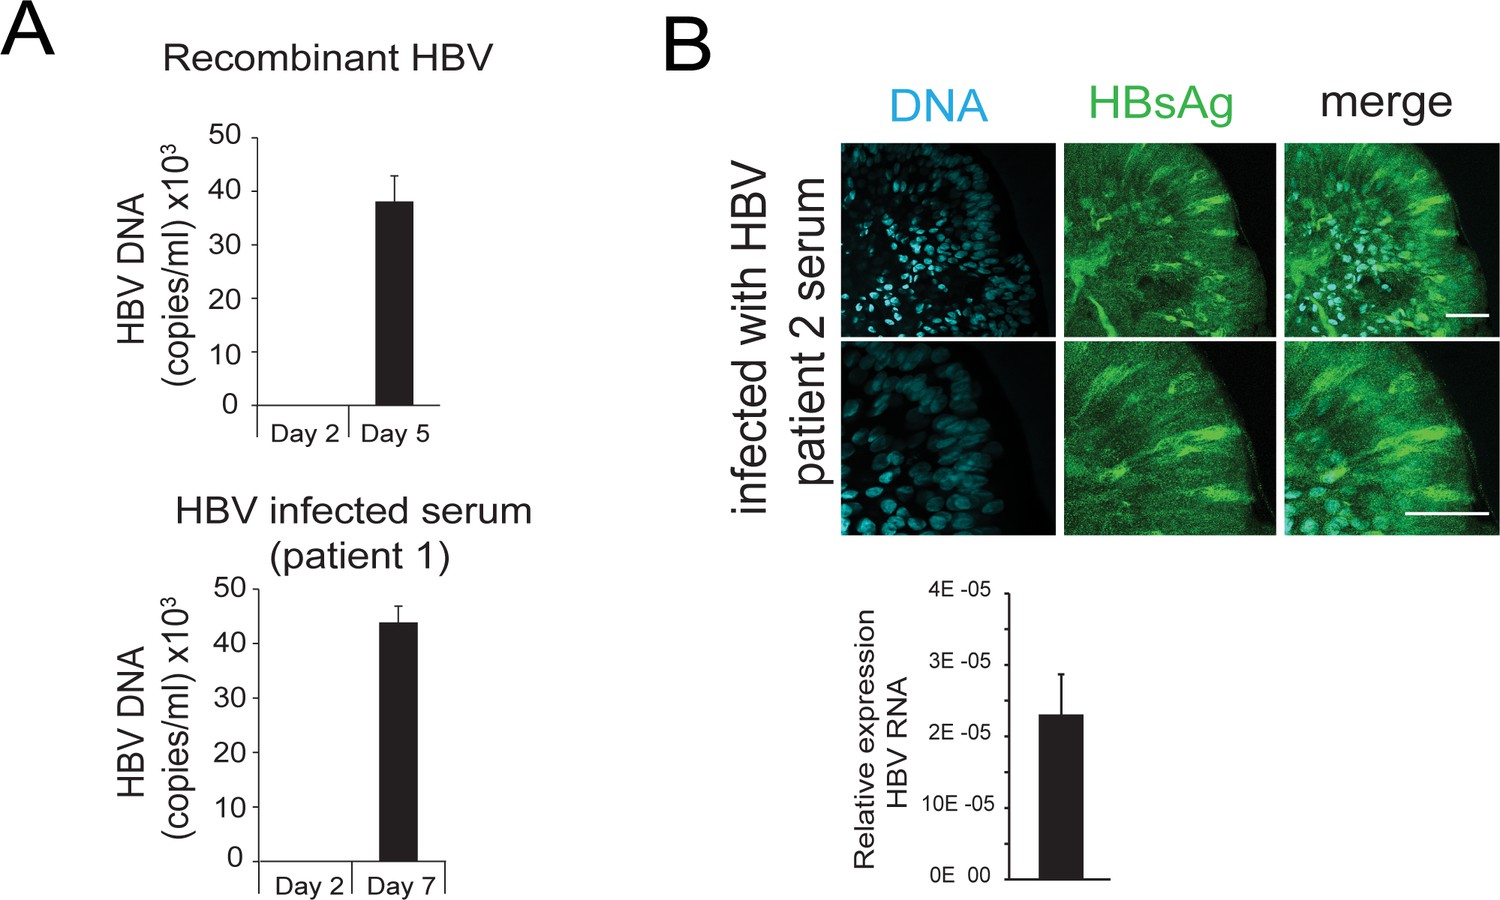
HBV-specific DNA, RNA, and proteins are detected in hD-derived organoids upon infection with recombinant HBV virus as well as with HBV-infected patient’s serum.
(A) Levels of hepatitis B virus (HBV) DNA in the supernatant of healthy donor (hD) organoids infected with either the recombinant virus derived from HepG2.2.15 cells or the serum obtained from HBV-positive individuals. (B) Immunofluorescent staining showing the expression of HBV surface Ag (green) in differentiation medium (DM) organoids 5 days after infection with the serum obtained from HBV-positive individuals (patient 2); scale bars represent 50 µm. Bar graph shows total HBV RNA levels in the culture at the time of staining.
Figure 2 with 1 supplement
HBV-infected liver organoids as a model for HBV antiviral drug screening and toxicity.
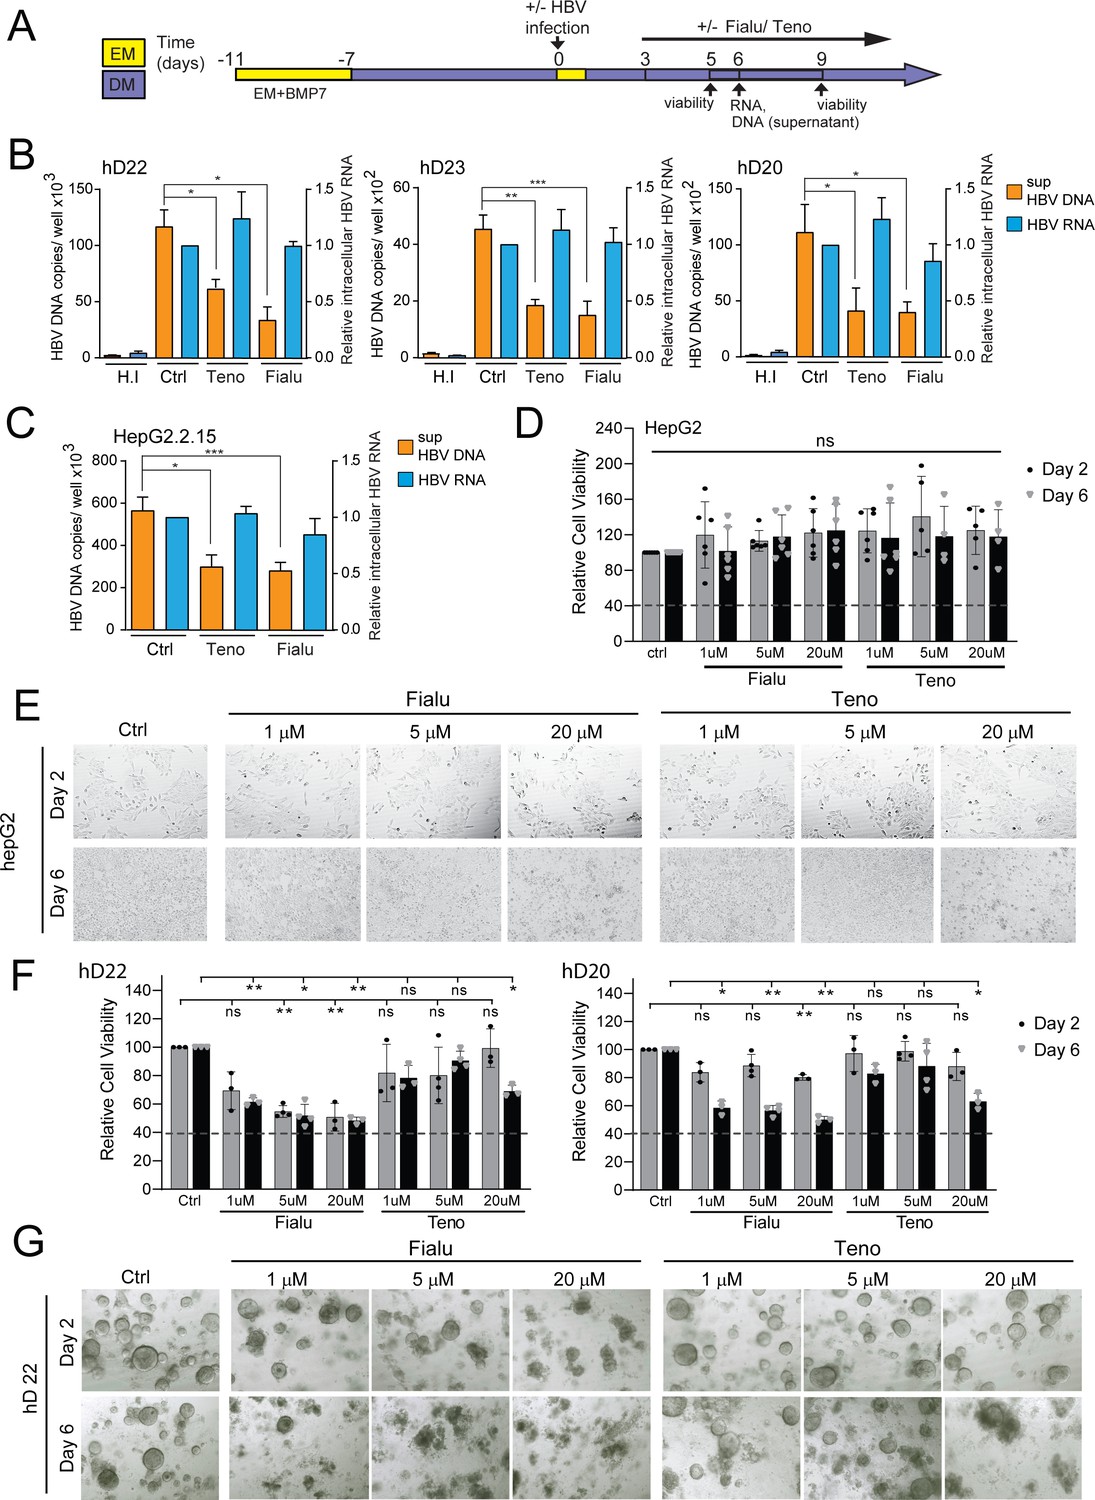
(A) Experimental design of drug treatment of hepatitis B virus (HBV)-infected liver organoids followed by assessment of antiviral activity and toxicity. Arrows indicate time points for HBV detection or assessment of viability. Levels of HBV DNA (orange) in the supernatant and intracellular HBV RNA (blue) (normalized to beta-2-microglobulin) were quantified by quantitative polymerase chain reaction (qPCR) and reverse transcription PCR (RT-PCR), respectively, for three independent healthy donors (B) and HepG2.2.15 cells (C) upon treatment with control vehicle, fialuridine (10 μM), or tenofovir (10 μM) as indicated. Data are shown as mean ± SD of at least three replicate treatments (paired two-tailed t-test); *p<0.05; **p<0.01; ***p<0.001. (D) Relative viability of HepG2 cells was measured using the alamarBlue cell viability assay after treatment with vehicle control, fialuridine, or tenofovir for 2 or 6 days as indicated, normalized to vehicle control, and plotted as the average of percent viability ± SD of at least four replicate treatments (paired two-tailed t-test) (ns = not significant). (E) Representative bright-field images taken of HepG2 cells treated with antiviral drugs for 2 or 6 days as indicated. (F) Bar diagrams representing relative cellular viability of healthy donor (hD) liver organoids after 2 or 6 days of treatment with fialuridine or tenofovir at the different concentrations indicated using the alamarBlue cell viability assay. All values are normalized to the vehicle-treated control and plotted as the average of percent viability ± SD of at least three replicate treatments (paired two-tailed t-test); *p<0.05; **p<0.01. The dotted line represents the lower limit of quantification based on values obtained from wells free of organoids containing the basement membrane matrix (BME) only. (G) Representative bright-field images taken of liver organoids treated for 2 or 6 days with the vehicle control or increasing concentrations of the antiviral drugs tenofovir or fialuridine as indicated.
-
Figure 2—source data 1
Source data for Figure 2B.
- https://cdn.elifesciences.org/articles/60747/elife-60747-fig2-data1-v2.xlsx
-
Figure 2—source data 2
Source data for Figure 2C.
- https://cdn.elifesciences.org/articles/60747/elife-60747-fig2-data2-v2.xlsx
-
Figure 2—source data 3
Source data for Figure 2D.
- https://cdn.elifesciences.org/articles/60747/elife-60747-fig2-data3-v2.xlsx
-
Figure 2—source data 4
Source data for Figure 2F.
- https://cdn.elifesciences.org/articles/60747/elife-60747-fig2-data4-v2.xlsx
Figure 2—figure supplement 1
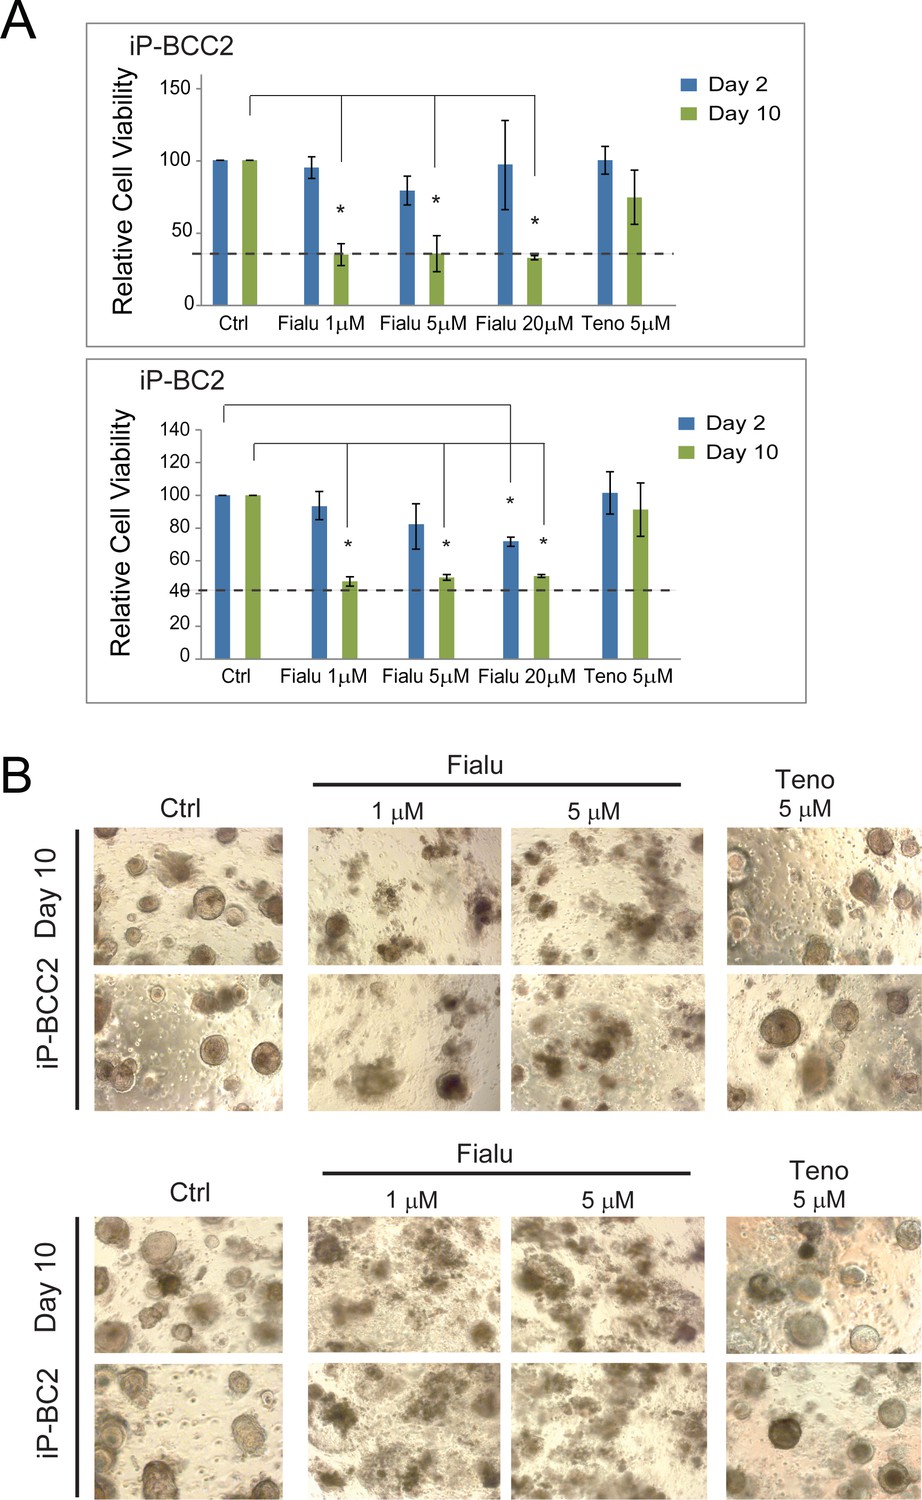
Human liver organoids as a model for anti-HBV drug-induced toxicity screening.
(A) Bar diagrams representing relative cellular viability of differentiated patient-derived liver organoids (iP-BCC2 and iP-BC2) after 2 or 10 days of treatment with fialuridine or tenofovir at the different concentrations indicated using the alamarBlue cell viability assay. All values are normalized to the vehicle-treated control and plotted as the average of percent viability ± SD (n = 3) (paired two-tailed t-test). The dotted line represents the lower limit of quantification based on values obtained from wells free of organoids containing the BME matrix only. (B) Representative bright-field images taken of differentiated patient-derived liver organoids (iP-BCC2 and iP-BC2) as indicated with fialuridine and tenofovir.
Figure 3 with 2 supplements

Lentivirally transduced transgenic liver organoids in the study of HBV.
(A) mRNA expression levels of the hepatitis B virus (HBV) receptor sodium taurocholate co-transporting polypeptide (NTCP) in undifferentiated (EM) and differentiated (DM) organoids (n = 3); mRNA levels were calculated according to the 2ΔCt method using GAPDH as the reference gene. (B) Immunofluorescent staining showing the expression of NTCP (magenta) in EM and DM organoids. Nuclei were counterstained with Hoechst 33343 (cyan). Scale bars represent 50 µm. (C–E) Inhibition of HBV infection of liver organoids by (pre)treatment with myrcludex-B (10 µM). Control or myrcludex-B-treated differentiated liver organoids were infected with HBV, and intracellular HBV RNA (C), copy numbers of HBV DNA genome in the culture supernatant (D), and HBV early antigen (HBeAg) (E) produced in the culture supernatant were determined 5–6 days after inoculation. Error bars represent mean ± SD from three independent donors (unpaired two-tailed t-test); ***p<0.001; ****p<0.0001. (F) Schematic representation of the experimental procedure for the transduction experiments. Following infection with a lentiviral vector expressing Flag-NTCP, organoids were selected with blasticidin for 5 days in order to obtain lines expressing NTCP in the expansion phase. (G) Levels of expression of NTCP were evaluated by reverse transcription polymerase chain reaction (RT-PCR) in the untransduced (parental) and the transduced (NTCP) lines. Expression of NTCP was calculated according to the 2ΔCt method using the housekeeping gene GAPDH as the reference gene and confirmed by immunofluorescence staining targeting NTCP (magenta) or Flag (red) (l). (H) HBV surface antigen (HBsAg) released in the supernatant of parental and NTCP organoid lines grown in EM or DM 10 days after HBV infection was detected by enzyme-linked immunosorbent assay (ELISA). Challenge with heat-inactivated virus was used to control for HBsAg present in the inoculum. Pos and neg bars correspond to positive and negative controls provided by the kit manufacturer. Threshold for positivity (red line) was calculated as the average OD + 2SD of negative controls. (J) HBV DNA in the supernatant of NTCP-expressing organoid cultures was quantified 5 days after infection and compared to DNA detected in the supernatant of untransduced HBV-infected organoids (n = 3). Bars represent the fold increase in HBV DNA detected in the supernatant, and untransduced HBV-infected organoids were used as the reference. Relative amounts of (K) HBV DNA and (L) HBsAg produced by healthy donor (hD) lenti-HBV organoid lines.
-
Figure 3—source data 1
Source data for Figure 3C.
- https://cdn.elifesciences.org/articles/60747/elife-60747-fig3-data1-v2.xlsx
-
Figure 3—source data 2
Source data for Figure 3D.
- https://cdn.elifesciences.org/articles/60747/elife-60747-fig3-data2-v2.xlsx
-
Figure 3—source data 3
Source data for Figure 3E.
- https://cdn.elifesciences.org/articles/60747/elife-60747-fig3-data3-v2.xlsx
Figure 3—figure supplement 1
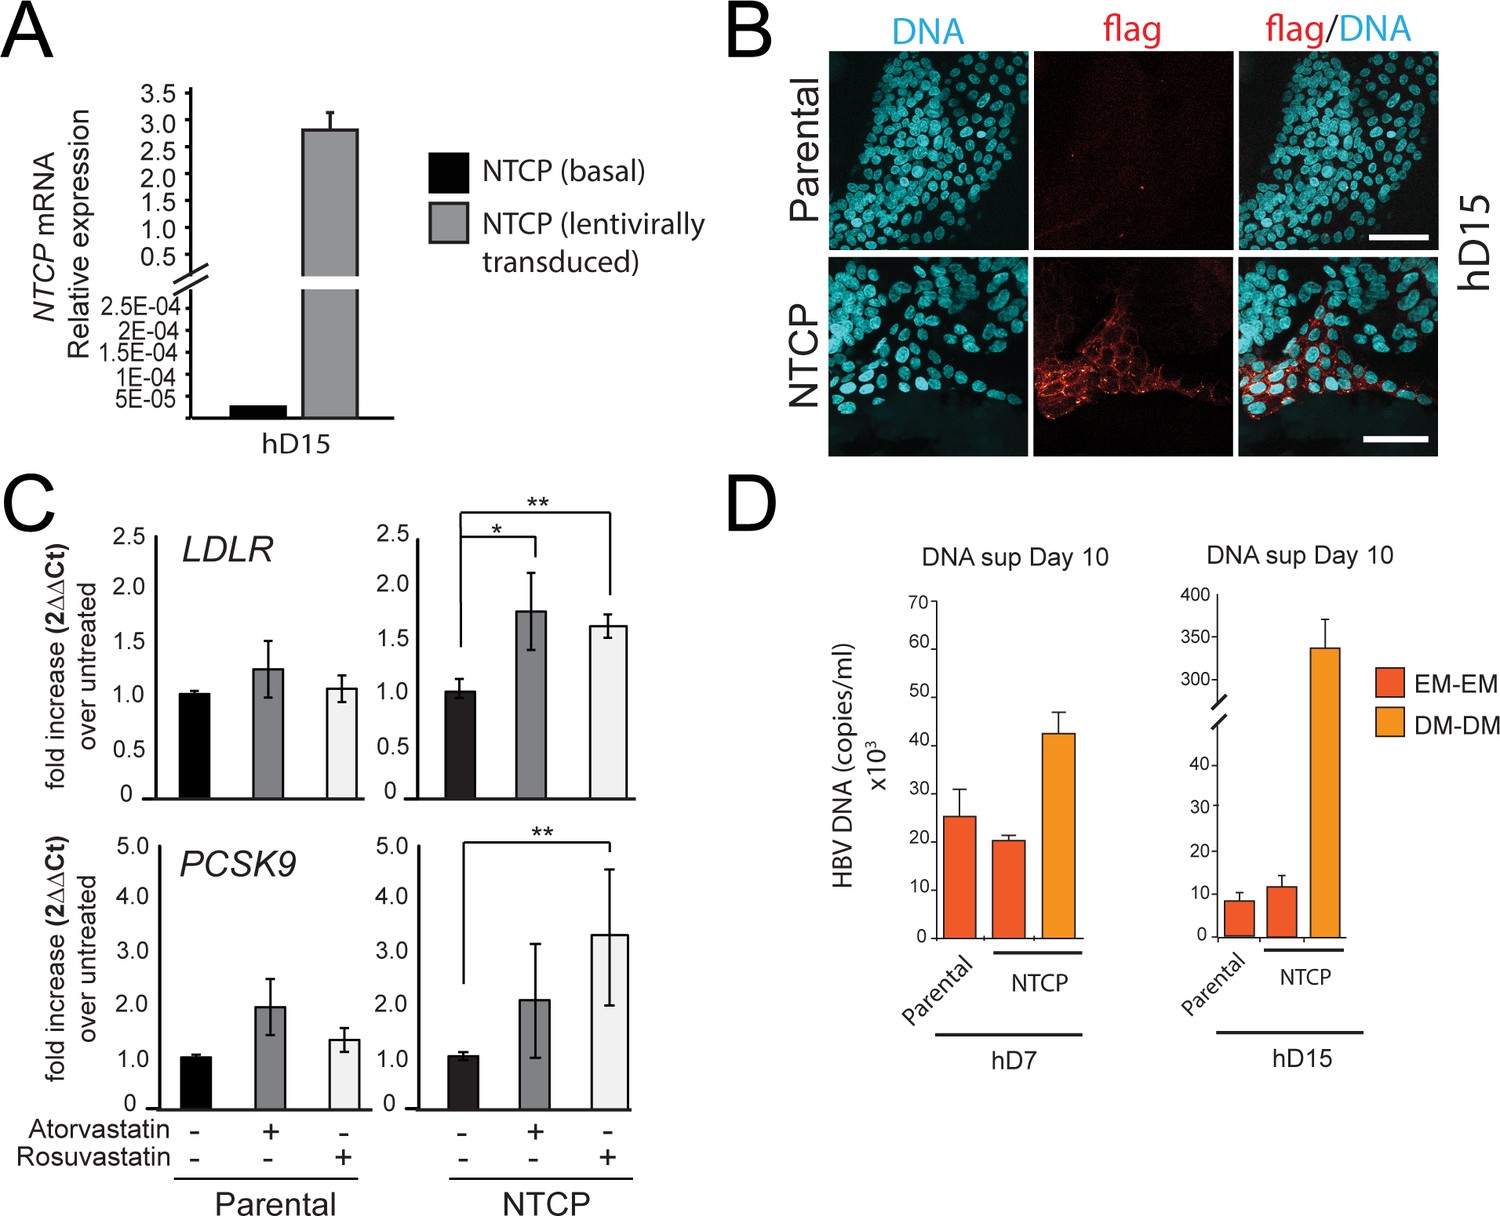
hD organoid lines expressing high levels of functional NTCP can be generated by lentiviral infection.
(A) Levels of expression of sodium taurocholate co-transporting polypeptide (NTCP) were evaluated by reverse transcription polymerase chain reaction (RT-PCR) in the untransduced (parental) and the transduced (NTCP) lines. Expression of NTCP was calculated according to the 2∆Ct method using the housekeeping gene GAPDH as the reference. (B) Expression of NTCP was confirmed by immunofluorescence staining using antibodies against Flag (red). (C) Evaluation of changes in cholesterol metabolism genes following transgenic expression of NTCP in liver organoids. The levels of LDLR and PCSK9 were evaluated by real-time PCR following treatment with atorvastatin and rosuvastatin. Fold difference in gene expression was calculated according to the 2∆∆Ct method using untreated cells as reference. (D) Hepatitis B virus (HBV) DNA levels in the supernatant of parental cultures grown in expansion medium (EM) and NTCP cultures (of donors hD7 and hD15) grown in EM or differentiation medium (DM) were quantified by real-time PCR 10 days after infection.
Figure 3—figure supplement 2
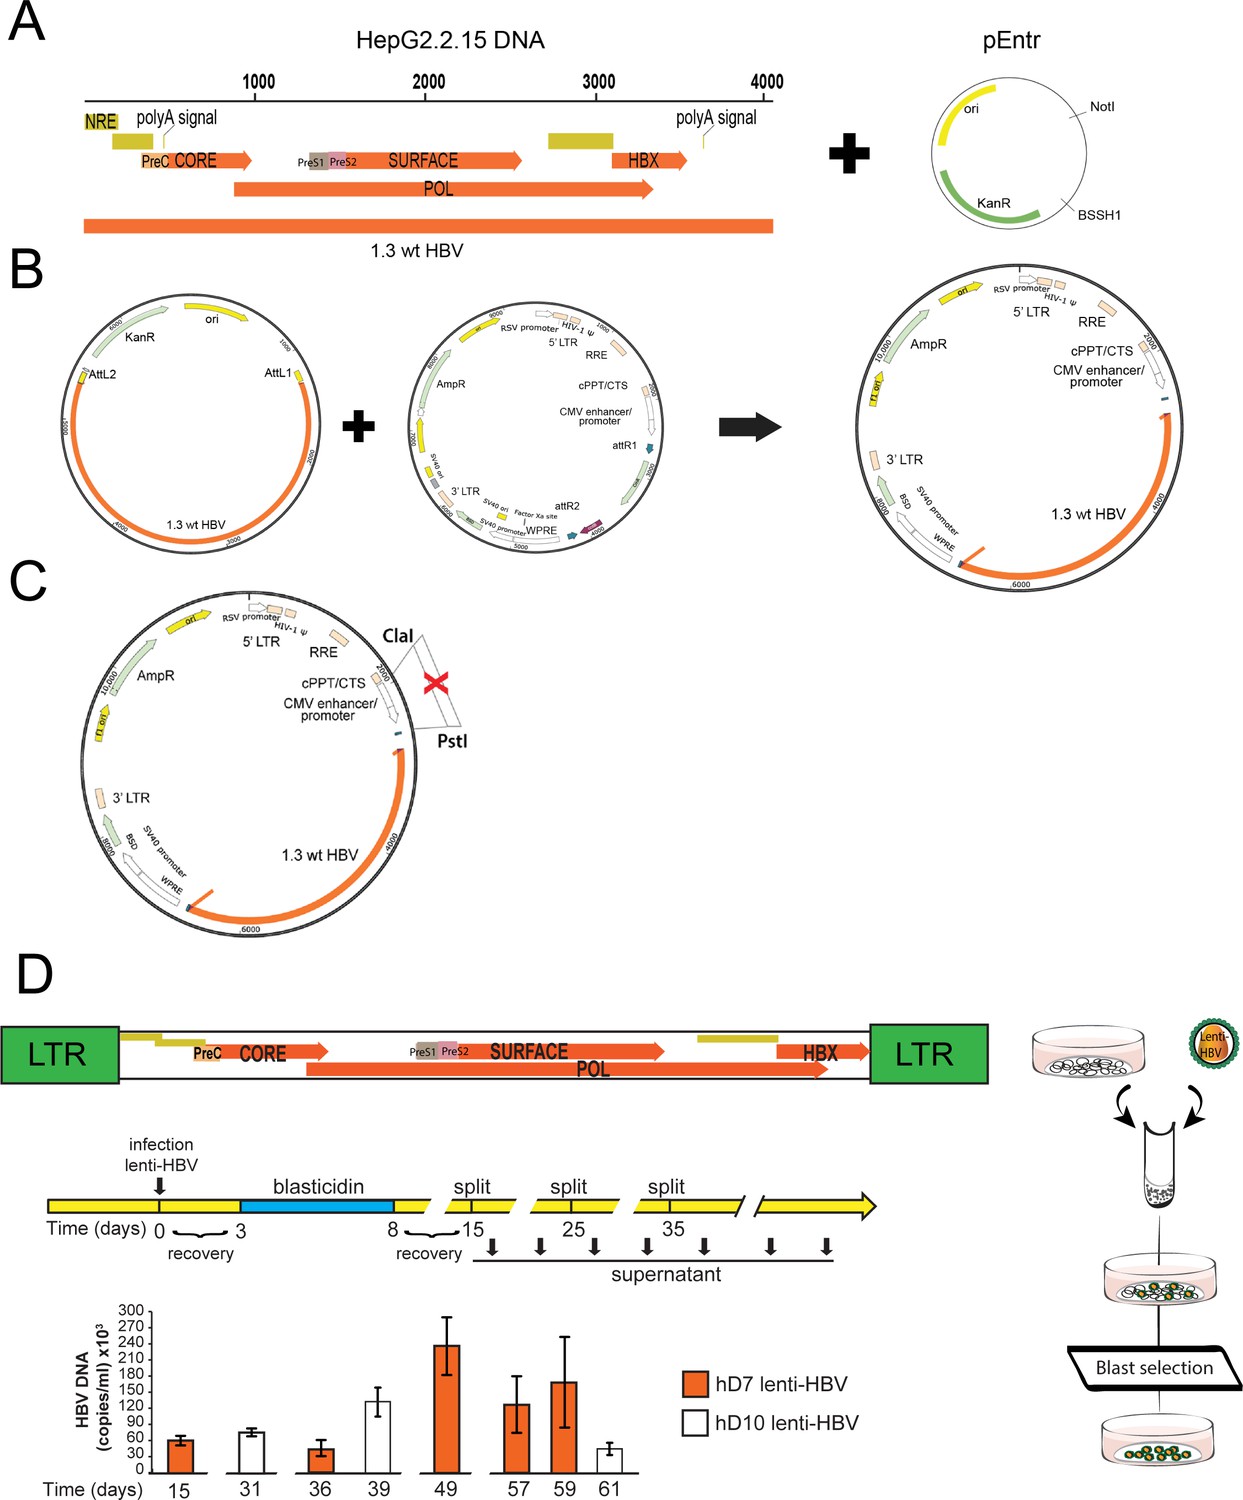
Generation of a lentiviral construct used to establish human liver organoid lines expressing viral RNA and releasing virus in the supernatant.
(A, B) A fragment encoding 1.3 times the wild-type hepatitis B virus (wt-HBV) genome was amplified from HepG2.2.15 and cloned into the pEntr plasmid. Using the gateway system, HBV was then transferred to a lentiviral expression vector under the control of CMV promoter. CMV promoter upstream of HBV genome was then removed from the construct (C). (D) Experimental procedure for the generation of transgenic organoid lines expressing full-length HBV. Undifferentiated (EM) organoids were infected with a lentiviral vector including a construct encoding 1.3 copies of the HBV genome and selected with blasticidin for 5 days in order to obtain stable transgenic organoid lines. Viral production was determined by quantitative polymerase chain reaction (qPCR), measuring the amount of HBV DNA secreted in the supernatant at regular intervals and up to 62 days after lentiviral infection.
Figure 4 with 2 supplements
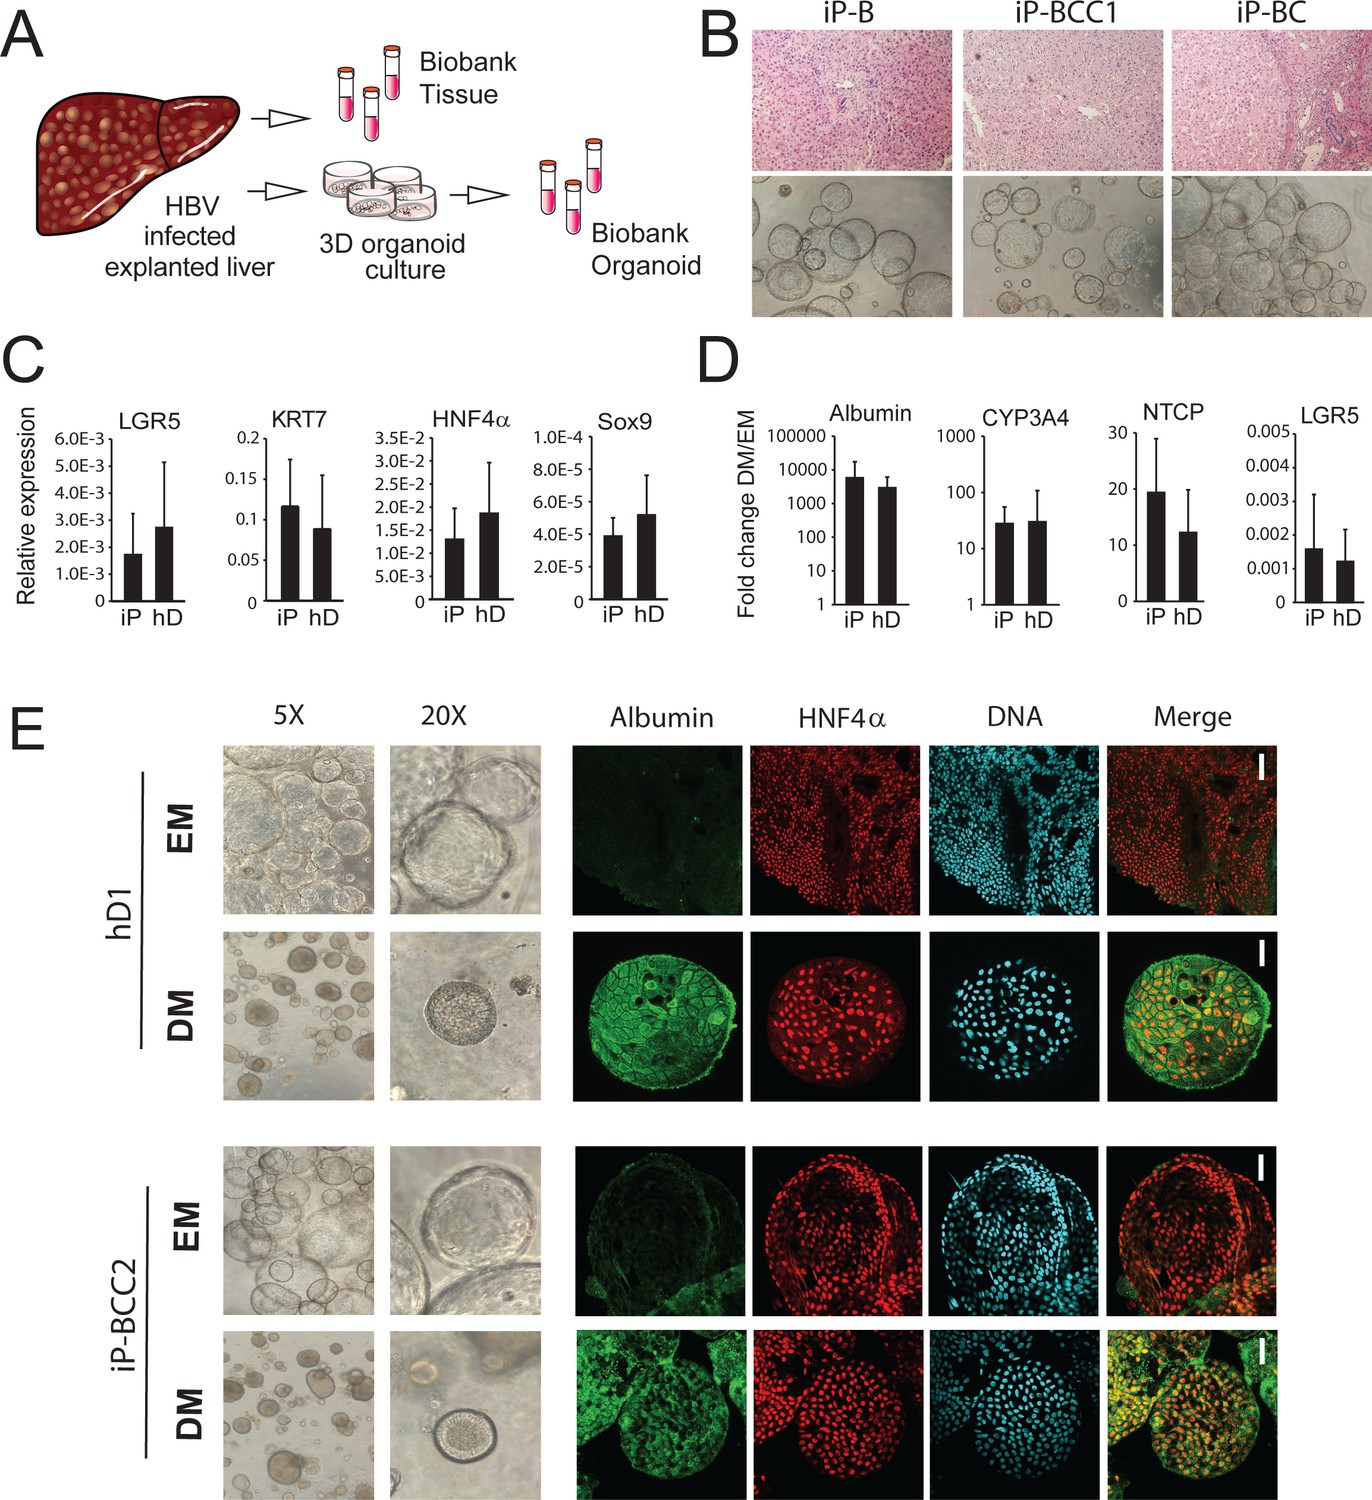
Characterization of organoid cultures from liver explants of HBV-infected patients.
(A) Representative panel showing the procedure to generate organoid cultures or biobanks from liver tissue. (B) Hematoxylin-eosin-stained sections of explanted liver tissue and phase-contrast pictures showing the morphology of liver organoids derived from hepatitis B virus (HBV)-infected individuals. (C) Expression profile of the progenitor markers LGR5, KRT7, HNF4α, and Sox9 in EM (undifferentiated) organoids derived from liver of healthy donors (hD) (n = 4) and HBV-infected individuals (iP) (n = 5). Levels of expression were calculated according to the 2ΔCT method using GAPDH as the reference gene. (D) Differentiation capacity of organoid cultures derived from liver of hDs (n = 4) and iPs (n = 5). Bars represent the fold difference in the expression of hepatocyte-specific genes encoding albumin, cytochrome CYP3A4, and sodium taurocholate co-transporting polypeptide (NTCP), and the progenitor-specific gene LGR5 in DM (differentiated) cultures compared to EM organoids using the 2ΔΔCT method. (E) Immunofluorescent staining targeting albumin (green) and HNF4α (red) was performed in EM and DM organoids. Phase-contrast images, depicting the morphology of the cells, are shown as reference.
Figure 4—figure supplement 1
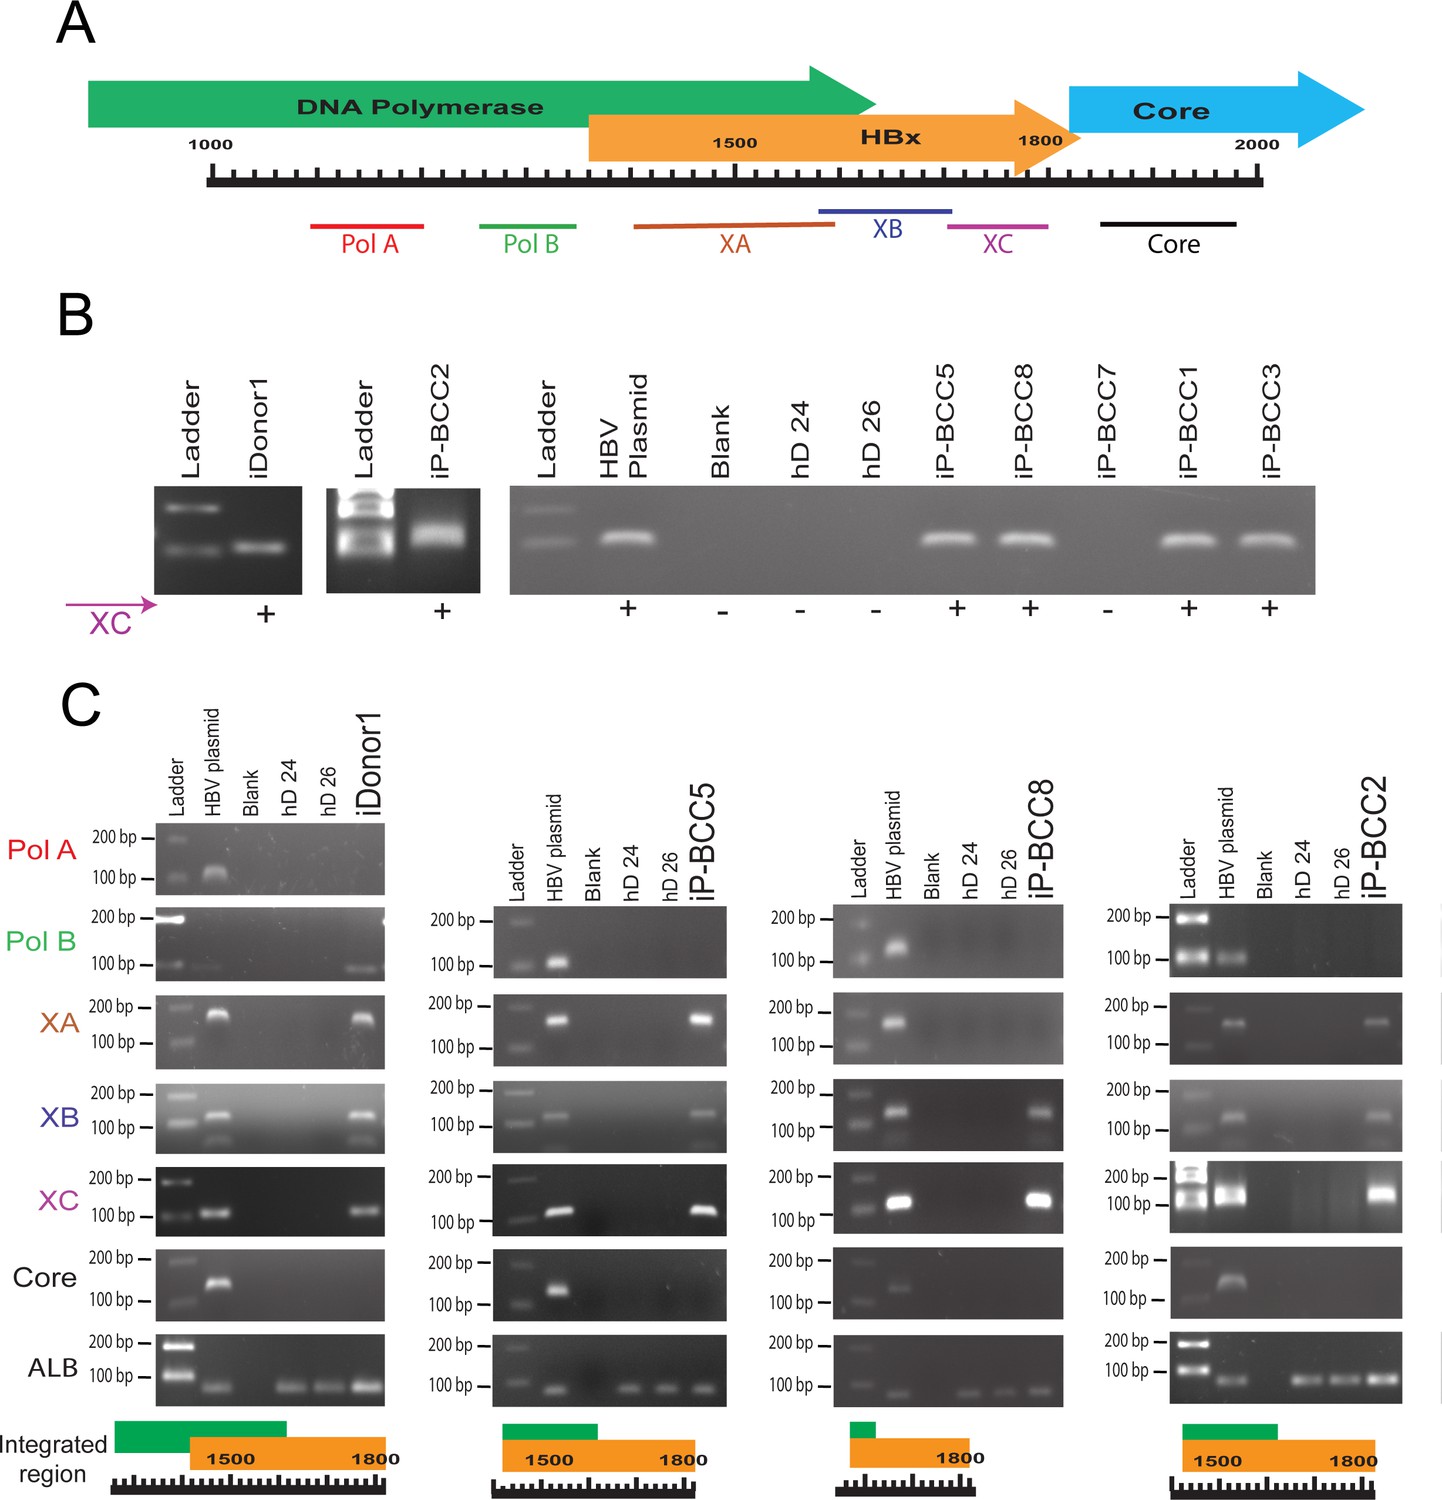
Parts of HBV genome are found integrated in patient-derived liver organoids.
(A) Partial genome map of hepatitis B virus (HBV) with gene names and primer positions used for identifying the integrated regions. (B) Agarose gel electrophoresis of polymerase chain reaction (PCR)-amplified products of six infected patients (iPs) and one infected donor (iDonor1) using XC primer set. (C) Agarose gel electrophoresis of four organoid lines that show integration with XC primer set. Primer pairs in both upstream (PolA, PolB, XA, and XB) and downstream (Core) directions of XC region were used to identify the integrated region of HBV inside the genome of organoid lines.
-
Figure 4—figure supplement 1—source data 1
Source data for Figure 4—figure supplement 1B.
- https://cdn.elifesciences.org/articles/60747/elife-60747-fig4-figsupp1-data1-v2.xlsx
-
Figure 4—figure supplement 1—source data 2
Source data for Figure 4—figure supplement 1C.
- https://cdn.elifesciences.org/articles/60747/elife-60747-fig4-figsupp1-data2-v2.xlsx
Figure 4—figure supplement 2
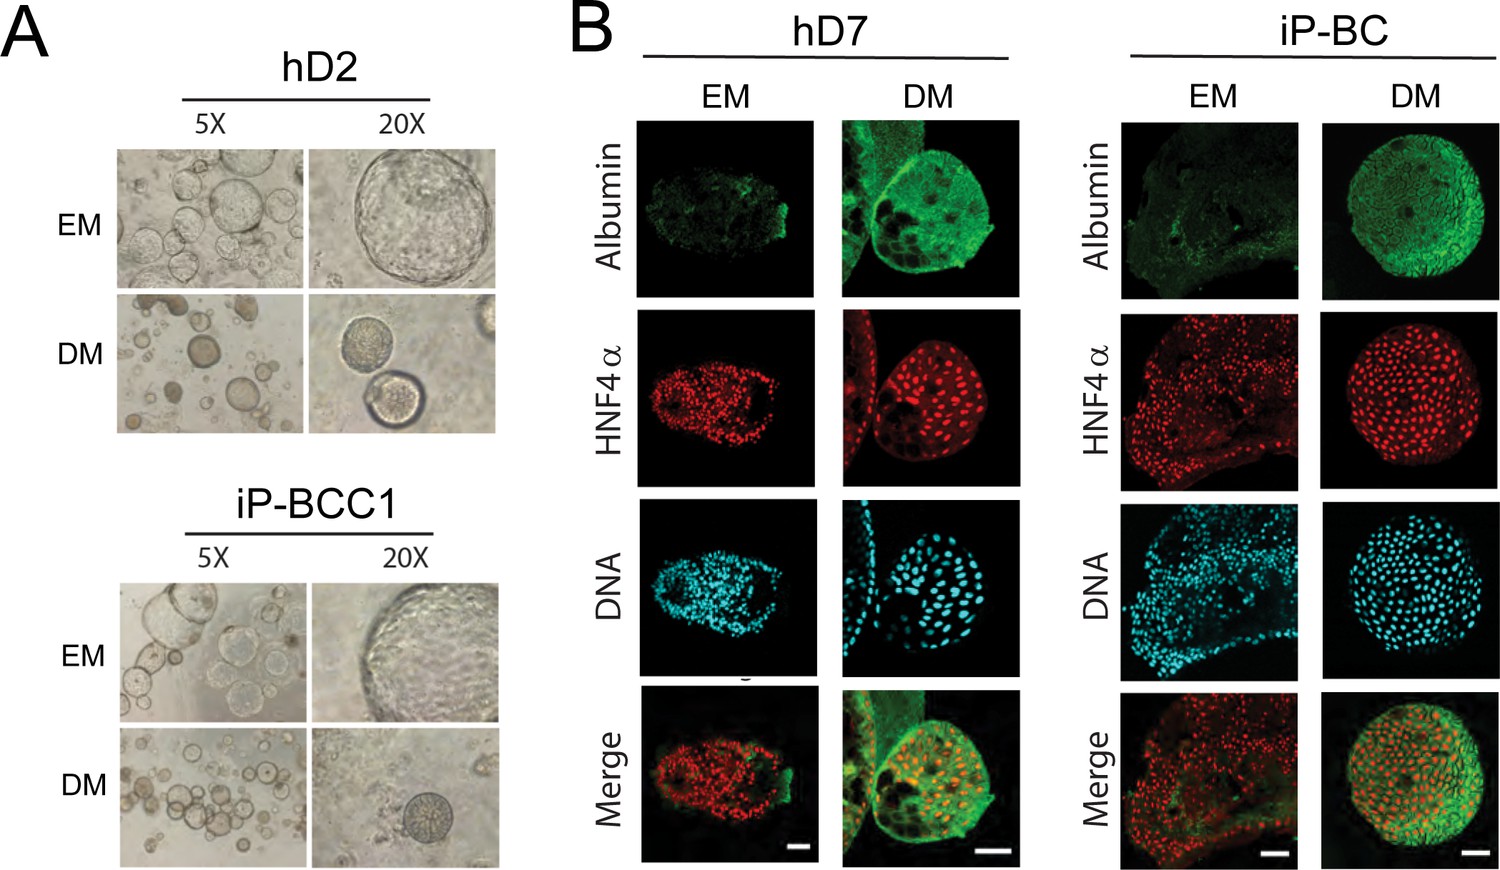
iP-derived and hD-derived organoids have comparable differentiation potential.
(A) Phase-contrast images (5X and 20X magnification) of organoid cultures seeded from healthy donors (hDs) and infected patients (iPs) show comparable morphological changes in the organization upon differentiation of organoid cultures. (B) Immunofluorescent staining indicates comparable expression of the hepatocyte marker Albumin (green) and HNF4α (red) in hD and iP liver organoids in expansion media (EM) and after 7 days of culture in differentiation media (DM). Nuclei are counterstained with Hoechst 33342 (cyan). Scale bars represent 50 µm.
Figure 5 with 1 supplement
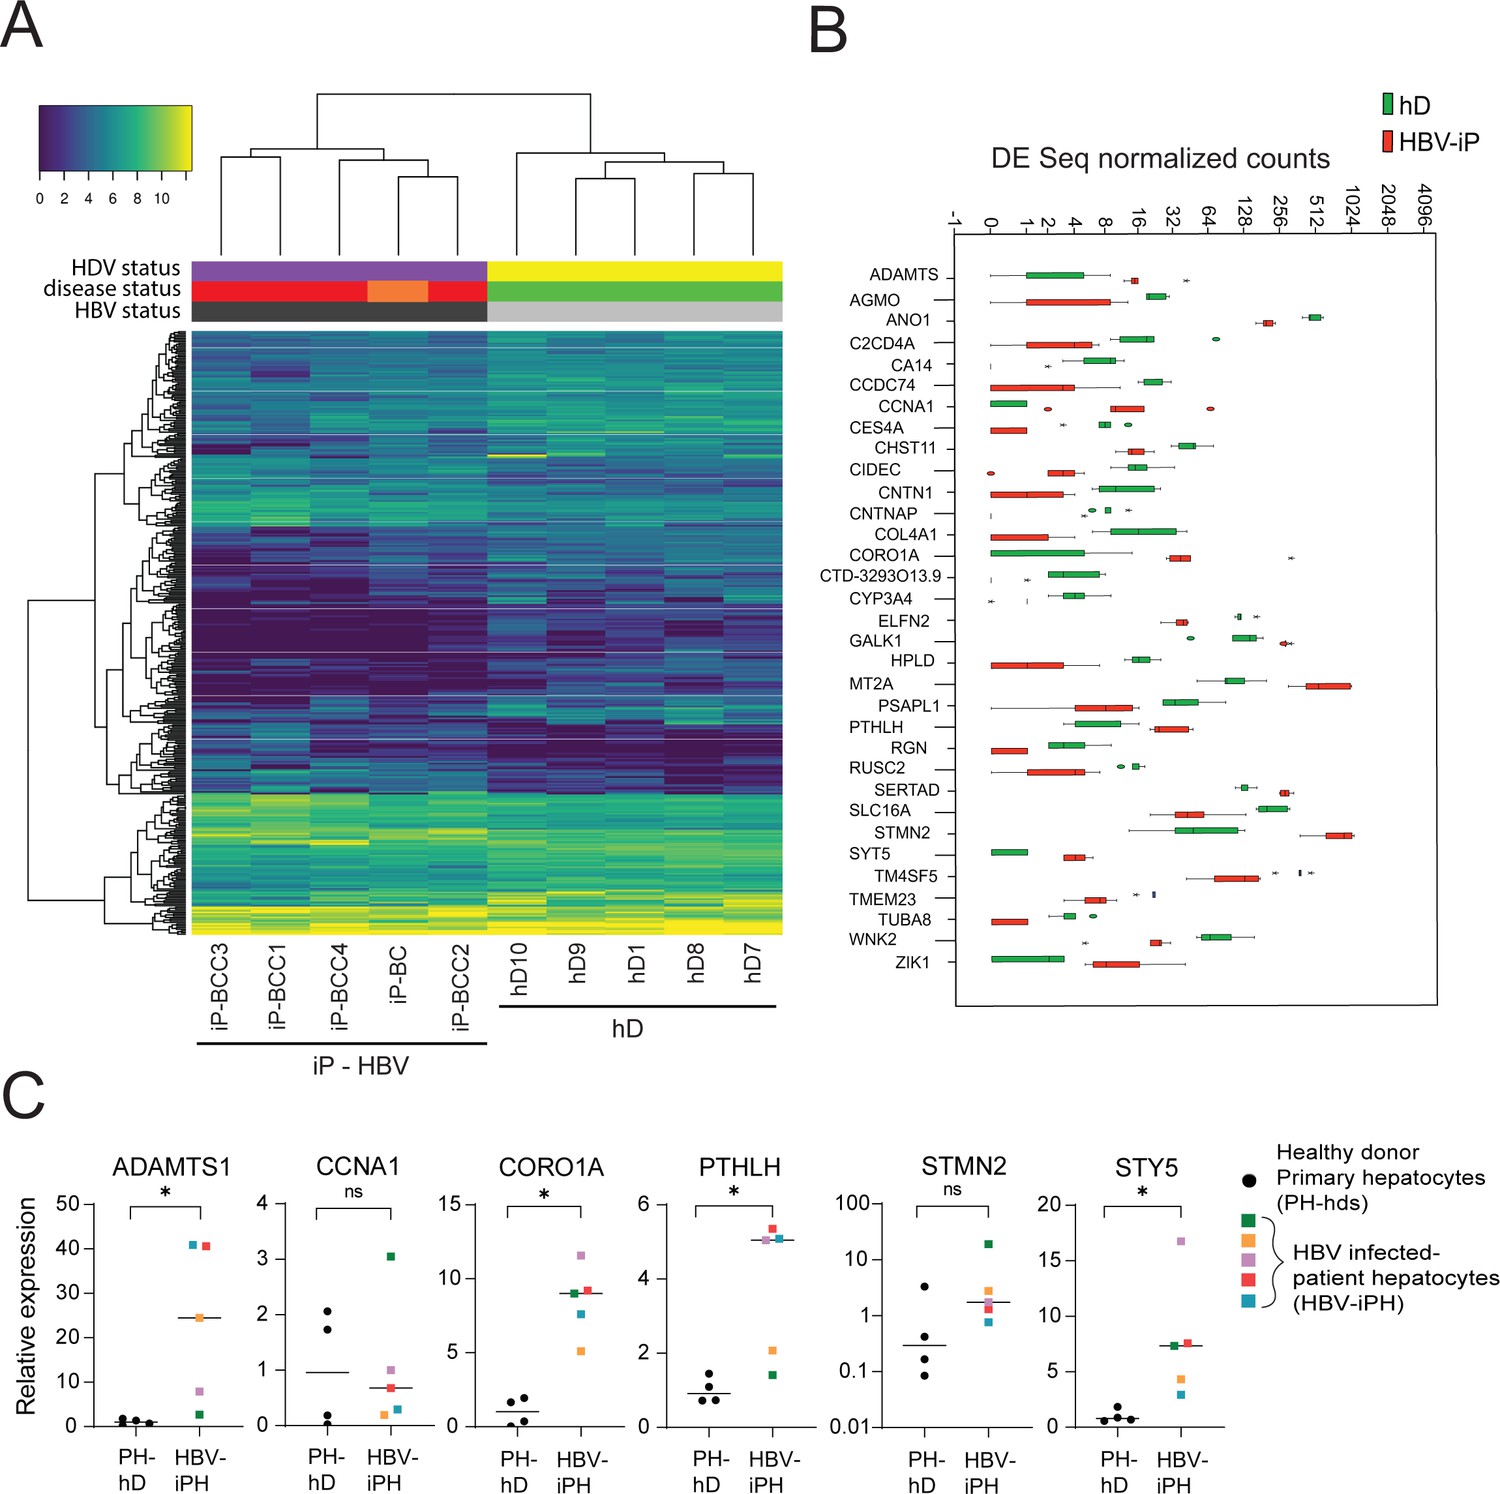
Differential gene expression in patient-derived liver organoids.
(A) Hierarchical clustering heatmap of differentially expressed genes derived from the comparison between the group of five healthy donors (hDs) and five infected patients (iPs) presenting hepatitis B virus (HBV) infection and cirrhosis (all) and hepatocellular carcinoma (HCC) (four out of five). (B) Box plot of DESeq normalized counts of 33 putative biomarker genes obtained from hD organoids (depicted in green) or HBV-iP organoids (depicted in red). (C) Relative expression of mRNAs of signature genes ADAMTS1, CCNA1, CORO1A, PTHLH, STMN2, and STY5 in hD primary hepatocytes (n = 4, black circles) and in hepatocytes from HBV-infected patients (n = 5, each donor with its own colored square) was quantified by reverse transcription polymerase chain reaction (RT-PCR) using cyclophilin A mRNA as an internal control. All expression values are normalized to the average mRNA expression of the hDs (unpaired two-tailed Mann-Whitney test); ns = not significant; *p<0.05.
-
Figure 5—source data 1
Source data for Figure 5C.
- https://cdn.elifesciences.org/articles/60747/elife-60747-fig5-data1-v2.xlsx
Figure 5—figure supplement 1
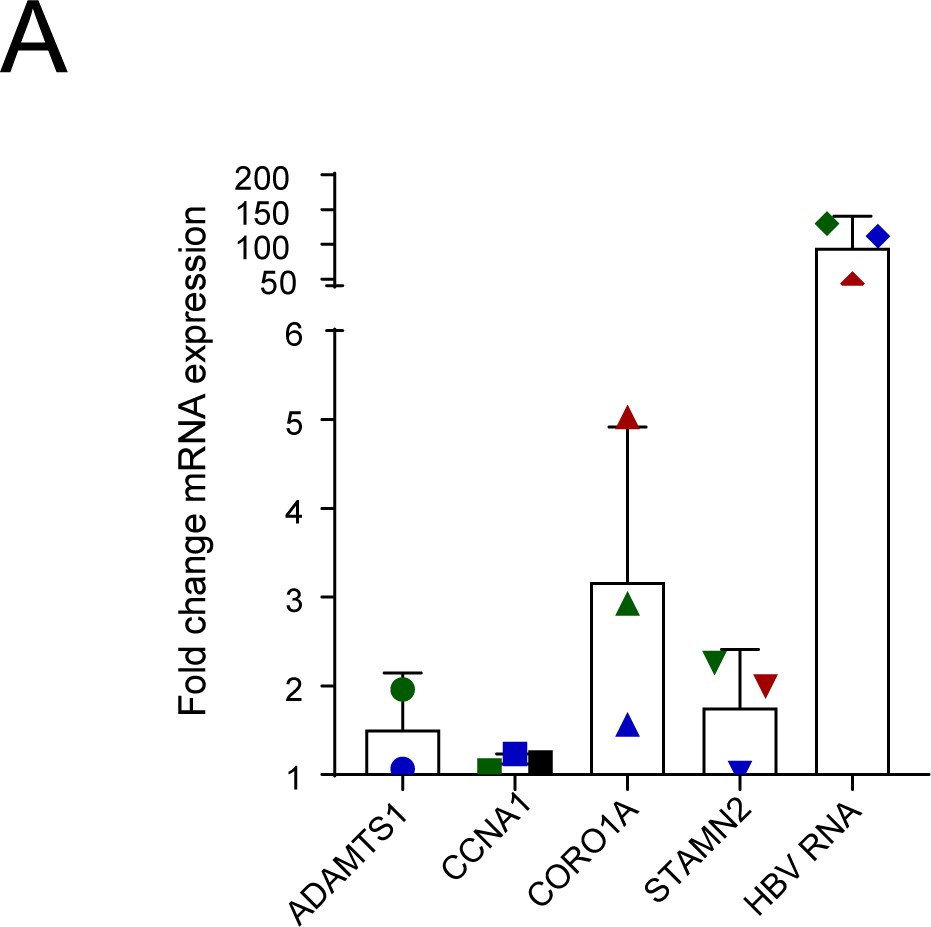
Upregulation of signature genes in ex vivo HBV infected liver organoids.
(A) Relative expression of ADAMTS1, CCNA1, CORO1A, STAMN2, and HBV (Core) mRNA in three healthy donor (hD) organoids 6 days post infection with hepatitis B virus (HBV) (each donor represented by blue, red, or green symbols, respectively) was quantified by reverse transcription polymerase chain reaction (RT-PCR) using cyclophilin A mRNA as an internal control. All expression values are normalized to the average mRNA expression of the target genes in heat-inactivated virus-infected hD organoids.
-
Figure 5—figure supplement 1—source data 1
Source data for Figure 5—figure supplement 1A.
- https://cdn.elifesciences.org/articles/60747/elife-60747-fig5-figsupp1-data1-v2.xlsx
Figure 6

Characterization of early HCC gene signature.
(A) Hierarchical clustering heatmap of six infected patient (iP), six healthy donor (hD), and four infected donor (iDonor) samples depicting the grouping and expression levels of protein-coding differentially expressed genes derived from the comparison between the group of five hDs and five iPs presenting hepatitis B virus (HBV) infection, cirrhosis, and hepatocellular carcinoma (HCC) (four out of five) (from Figure 5A). Colored bars on top of the heatmap indicate HBV status (black for HBV-positive patients, gray for healthy donors) and disease status (maroon for HBV-positive cirrhosis and HCC, orange for healthy donors that have cleared HBV infection, sky blue for healthy donors that have not been infected with HBV). (B) Multidimensional scaling plot of iP (green triangles), hD (orange circles), and iDonor samples (blue squares). (C) Hierarchical clustering heatmap of all 11 iP, 6 hD, 4 CN, and 4 iDonor samples depicting the grouping and expression levels of protein-coding differentially expressed genes derived from the comparison between the group of five hDs and five iPs presenting HBV infection and HCC (four out of five) (from Figure 5A). Colored bars on top of the heatmap indicate HBV status (black for HBV-infectected patients and donors, gray for non-HBV infected healthy donors and CN patients ) and cirrhosis status (green for cirrhotic livers, blue for acute HBV-infected non-cirrhotic livers, and pink for non-cirrhotic livers from both healthy and infected donors). (D) Multidimensional scaling plot of iP (green triangles), hD (orange circles), CN (purple pentagons), and iDonor samples (blue squares). (E) Hierarchical clustering heatmap of liver HCC gene expression data from 342 HCC tissue samples and 47 samples from matched nearby tissue from The Cancer Genome Atlas (TCGA) using the HBV-iP vs hD gene signature (from Figure 5A).
Figure 7

Schematic of applications of human liver organoids in HBV studies.
Author response image 1
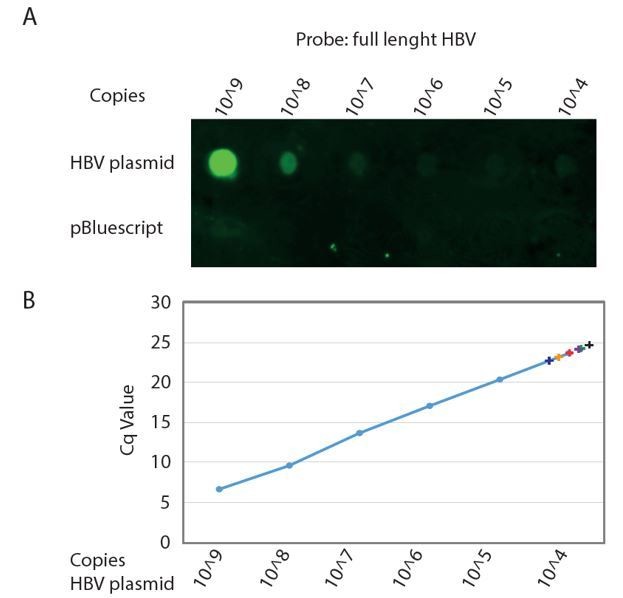
Detection limit of Southern Blot analysis of HBV genome.
A. Serial dilution of cloned HBV genome (top row) and non HBV plasmid (bottom row) was spotted on Hybond-XL membrane and detected using a PCR generated biotinylated near full length HBV probe. Signal was detected using IRDye 800CW Streptavidin on a Li-COR Odyssey Infrared Imager. B. The same serial dilution of cloned HBV genome was analyzed by qPCR. Cq values obtained from DNA isolations corresponding to a single well of a 24 wells plate from six independent infections of different donor organoids are indicated by color coded +.
Tables
Table 1
Characteristics of patients included in the study.
| Patient | Age | Sex | Diagnosis | Treatment (Y/N) | HBsAg (P/N) | HBcAg (P/N) | HBeAg (P/N) | Anti-HBsAg | Anti-HBcAg | Anti-HBeAg | DNA | |
|---|---|---|---|---|---|---|---|---|---|---|---|---|
| iDonor 1 | 44 | F | DONOR, cleared HBV | N | N | NA | NA | P | P | NA | NA | |
| iDonor 2 | 48 | F | DONOR, cleared HBV | N | N | NA | NA | P | P | NA | NA | |
| iDonor 3 | 62 | M | DONOR, cleared HBV | N | N | NA | NA | N | P | NA | NA | |
| iDonor 4 | 56 | M | DONOR, cleared HBV | N | N | NA | NA | P | P | NA | NA | |
| iP-BC | 49 | M | Liver cirrhosis based on chronic HBV infection | Y | P | NA | NA | P | P | NA | <20 | |
| iP-BCC1 | 65 | M | HBV liver cirrhosis with HCC | Y | P | NA | NA | N | P | NA | NA | |
| iP-BCC2 | 54 | M | Chronic liver cirrhosis along with HCC | Y | P | NA | NA | N | P | NA | <20 | |
| iP-BCC3 | 68 | M | Chronic HBV liver cirrhosis with HCC | Y | P | NA | NA | N | P | NA | <20 | |
| iP-BCC4 | 52 | M | HBV liver cirrhosis with multiple HCC | Y | P | NA | N | N | P | P | <20 | |
| iP-BCC5 | 51 | M | HBV liver cirrhosis with HCC | Y | P | NA | NA | N | P | NA | <20 | |
| iP-BCC6 | 63 | M | HBV liver cirrhosis with HCC | Y | P | N | N | N | P | P | <20 | |
| iP-BCC7 | 61 | M | HBV liver cirrhosis with HCC | Y | P | NA | NA | N | P | NA | 28 | |
| iP-BCC8 | 53 | M | HBV liver cirrhosis with HCC | Y | P | NA | N | N | P | P | <20 | |
| iP-BFA | 54 | F | Acute liver failure based on HBV with Crohn’s disease | N | P | NA | N | N | P | P | <20 | |
| iP-BFA2 | 62 | M | Acute liver failure based on HBV | N | P | NA | NA | P | P | NA | NA | |
| iP-BDFA | 28 | M | Acute liver failure based on HBV and HDV co-infection | N | P | NA | N | NA | P | P | 1180 | |
| iP-BDFA2 | 60 | F | Acute liver failure based on HBV and HDV co-infection | Y | P | NA | NA | N | P | NA | 1080 | |
| iP-BDCC | 59 | M | HCC, HBV co-infected with HDV | Y | P | NA | NA | N | P | P | <20 | |
| Patient | Age | Sex | Diagnosis | Treatment (Y/N) | HBsAg (P/N) | HBcAg (P/N) | HBeAg (P/N) | Anti-HBsAg | Anti-HBcAg | Anti-HBeAg | DNA | Nash (Y/N) |
| CN1 | 69 | F | Nash-HCC | N | N | N | N | N | N | N | NA | Y |
| CN2 | 71 | M | Nash-HCC | N | N | N | N | N | N | N | NA | Y |
| CN3 | 66 | F | Nash-HCC | N | N | N | N | N | N | N | NA | Y |
| CN4 | 60 | F | Nash-HCC | N | N | N | N | N | N | N | NA | Y |
Key resources table
| Reagent type (species) or resource | Designation | Source or reference | Identifiers | Additional information |
|---|---|---|---|---|
| Cell line (Homo sapiens) | HepG2 | ATCC | HB-8065 RRID:CVCL_0027 | |
| Cell line (Homo sapiens) | HepG2.2.15 | CCTCC | CCTCC-GDC0141 RRID:CVCL_L855 | |
| Antibody | Hepatitis B Virus Core Antigen Antibody (1-5) (mouse monoclonal) | ThermoFisher | RRID:AB_1075044 | IF: (1:100) |
| Antibody | Anti-Hepatitis B Virus Core Antigen antibody (rabbit polyclonal) | Abcam | RRID:AB_10903422 | IF: (1:400) |
| Antibody | Hepatitis B Virus Surface Antibody (S 26) (mouse monoclonal) | ThermoFisher | RRID:AB_1075056 | IF: (1:200) |
| Antibody | Anti-ALB/Albumin Antibody (F-10) (mouse monoclonal) | Santa Cruz | sc-271605 RRID:AB_10647230 | IF: (1:50) |
| Antibody | HNF-4alpha (H-171) antibody (rabbit polyclonal) | Santa Cruz | sc-8987 RRID:AB_2116913 | IF: (1:50) |
| Antibody | Anti-SLC10A1 antibody produced in rabbit | Sigma-Aldrich | SAB2104761 RRID:AB_10668685 | IF: (1:200) |
| Antibody | Purified Anti-β-Catenin (mouse monoclonal) | BD Transduction Laboratories | 610154 RRID:AB_397555 | IF: (1:200) |
| Antibody | ANTI-FLAG M2 antibody (mouse monoclonal) | Sigma-Aldrich | F3165 RRID:AB_259529 | IF: (1:200) |
| Recombinant DNA reagent | pENTR/D-TOPO (plasmid backbone) | ThermoFisher | Invitrogen: K240020 | |
| Recombinant DNA reagent | pLenti6/V5-DEST Gateway Vector (plasmid backbone) | ThermoFisher | Invitrogen: V49610 | |
| Commercial assay or kit | Monolisa HBsAg ULTRA | Biorad | Biorad: 72346 | |
| Commercial assay or kit | Human Hepatitis B e Antigen (HBeAg) ELISA Kit | Cusabio | CSB-E13557h | |
| Commercial assay or kit | RealiaPrep RNA Cell Miniprep System | Promega | Promega: Z6012 | |
| Commercial assay or kit | DNase I | ThermoFisher | Invitrogen: 18047019 | |
| Commercial assay or kit | SuperScript II Reverse Transcriptase | ThermoFisher | Invitrogen: 18064022 | |
| Commercial assay or kit | GoTaq qPCR Master Mix | Promega | Promega: A6001 | |
| Commercial assay or kit | QIAamp MinElute Virus Spin Kit | Qiagen | Qiagen: 57704 | |
| Commercial assay or kit | DNeasy Blood and Tissue Kits | Qiagen | Qiagen: 69504 | |
| Commercial assay or kit | T5 Exonuclease | New England Biolabs | NEB: M0363 | |
| Commercial assay or kit | Plasmid-Safe ATP-Dependent DNase | Epicentre | E3101K | |
| Chemical compound, drug | Tenofovir disoproxil fumarate | Sigma-Aldrich | SML1794 | |
| Chemical compound, drug | Fialuridine | Cayman Chemical | 15867 | |
| Chemical compound, drug | Myrcludex-B | Creative Peptides | 10-101-139 | |
| Chemical compound, drug | Blasticidine S hydrochloride | Sigma-Aldrich | Sigma: 15205 | |
| Chemical compound, drug | Collagenase D | Sigma-Aldrich | Sigma: 11088858001 | |
| chemical compound, drug | TrypLE Express | ThermoFisher | Gibco:12604013 | |
| Chemical compound, drug | Cultrex Reduced Growth Factor Basement Membrane Extract, Type 2, Pathclear | R and D Systems | 3533-010-02 | |
| Chemical compound, drug | B-27 Supplement, minus vitamin A | ThermoFisher | Gibco: 12587010 | |
| Chemical compound, drug | N-2 Supplement | ThermoFisher | Gibco: 17502048 | |
| Chemical compound, drug | N-Acetyl-L-cysteine | Sigma-Aldrich | Sigma: A7250 | |
| Chemical compound, drug | Nicotinamide | Sigma-Aldrich | Sigma: N3376 | |
| Chemical compound, drug | Recombinant [Leu15]-Gastrin I human | Sigma-Aldrich | Sigma: G9145 | |
| Chemical compound, drug | Recombinant Human EGF | PeproTech | GMP100-15 | |
| Chemical compound, drug | Recombinant Human FGF-10 | PeproTech | 100–26 | |
| Chemical compound, drug | Recombinant Human HGF | PeproTech | 100–39H | |
| Chemical compound, drug | Forskolin | Sigma-Aldrich | Sigma: F3917 | |
| Chemical compound, drug | Recombinant Human Noggin | PeproTech | 120–10C | |
| Chemical compound, drug | A 83–01 | Tocris | Tocris: 2939 | |
| Chemical compound, drug | ROCK Inhibitor (Y-27632) | Sigma-Aldrich | Sigma: SCM075 | |
| Chemical compound, drug | DAPT | Sigma-Aldrich | Sigma: D5942 | |
| Chemical compound, drug | Dexamethasone | Sigma-Aldrich | Sigma: D4902 | |
| Chemical compound, drug | Recombinant Human BMP-7 | PeproTech | 120–03P | |
| Chemical compound, drug | Recombinant Human FGF-19 | PeproTech | 100–32 | |
| Software, algorithm | Code used for RNA-Seq data analysis | Moulos and Hatzis, 2015 | The R package used for the RNA-Seq data analysis is available at https://www.bioconductor.org/packages/release/bioc/html/metaseqR.html | |
| Software, algorithm | GraphPad Prism | https://graphpad.com | RRID:SCR_002798 | Version 5 |
Table 2
Recommended scale of starting material.
| Procedure | Number of wells/condition | Number of organoids/well |
|---|---|---|
| DNA isolation | One well of a 24-well plate | ≈100–200 organoids/well |
| RNA isolation | One well of a 24-well plate | |
| cccDNA isolation | 20–24 wells of a 24-well plate | |
| Immunofluorescence staining | 5–10 wells of a 24-well plate |
Additional files
-
Supplementary file 1
Gene expression signature.
- https://cdn.elifesciences.org/articles/60747/elife-60747-supp1-v2.xlsx
-
Supplementary file 2
GO analysis.
- https://cdn.elifesciences.org/articles/60747/elife-60747-supp2-v2.xlsx
-
Transparent reporting form
- https://cdn.elifesciences.org/articles/60747/elife-60747-transrepform-v2.docx
Download links
A two-part list of links to download the article, or parts of the article, in various formats.
Downloads (link to download the article as PDF)
Open citations (links to open the citations from this article in various online reference manager services)
Cite this article (links to download the citations from this article in formats compatible with various reference manager tools)
Application of human liver organoids as a patient-derived primary model for HBV infection and related hepatocellular carcinoma
eLife 10:e60747.
https://doi.org/10.7554/eLife.60747


