Parabrachial opioidergic projections to preoptic hypothalamus mediate behavioral and physiological thermal defenses
- Department of Anesthesiology, Washington University School of Medicine, United States
- Medical Scientist Training Program, University of Washington, United States
- Center for the Neurobiology of Addiction, Pain and Emotion, Departments of Anesthesiology and Pharmacology, University of Washington, United States
Figures
Figure 1 with 1 supplement
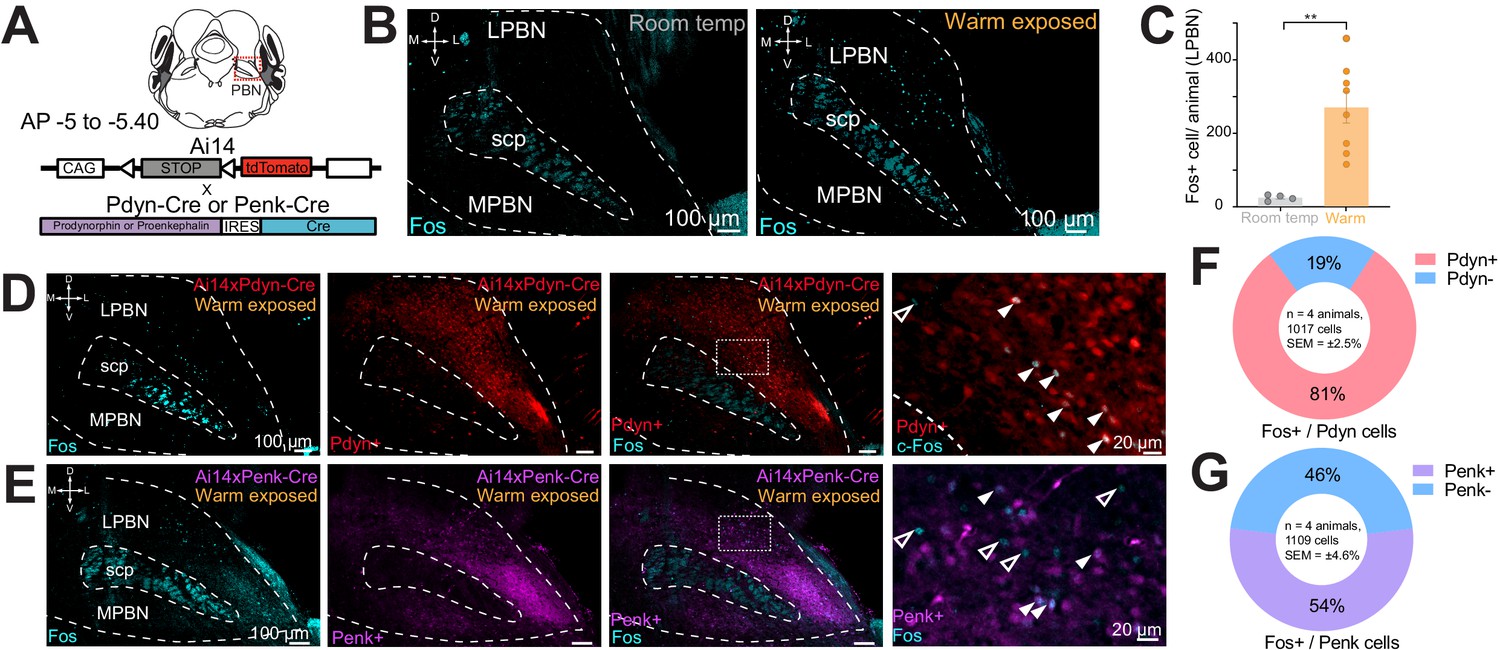
Warm-activated neurons in parabrachial nucleus (PBN) overlap with Pdyn and Penk expression.
(A) Schematized view of PBN regions analyzed for Fos expressing neurons and the genetic cross schemes of Ai14xPdyn-Cre/Ai14xPenk-Cre reporter mouse lines used. (B) Representative images of brain sections harvested from animals exposed to room temperature or 38°C and probed with anti-Fos. Brains from 38°C exposed mice had significantly more neurons in PBN positive for Fos staining. (C) Quantification of Fos positive LPBN neurons per brain. Data are presented as mean ± SEM; n = 4 animals in room temp group, n = 8 animals in warm exposed group; t-test, ∗∗p<0.01. (D) Representative images of Fos labeling (cyan) in Ai14 x Pdyn-Cre brains with Fos labeling of Pdyn+ (red) (filled arrows) neurons and Pdyn- (open arrows). (E) Representative images of Fos labeling in Ai14xPenk-Cre brains with Fos labeling of Penk+ (magenta) (filled arrows) and Penk- neurons (open arrows). (F and G) Quantification of the overlap of Fos staining in Ai14xPdyn-Cre and Ai14xPenk-Cre brains demonstrated 81% or 46% of Fos cells were also overlapped with tdTomato expression in Ai14xPdyn-Cre or Ai14xPenk-Cre brains, respectively.
Figure 1—figure supplement 1
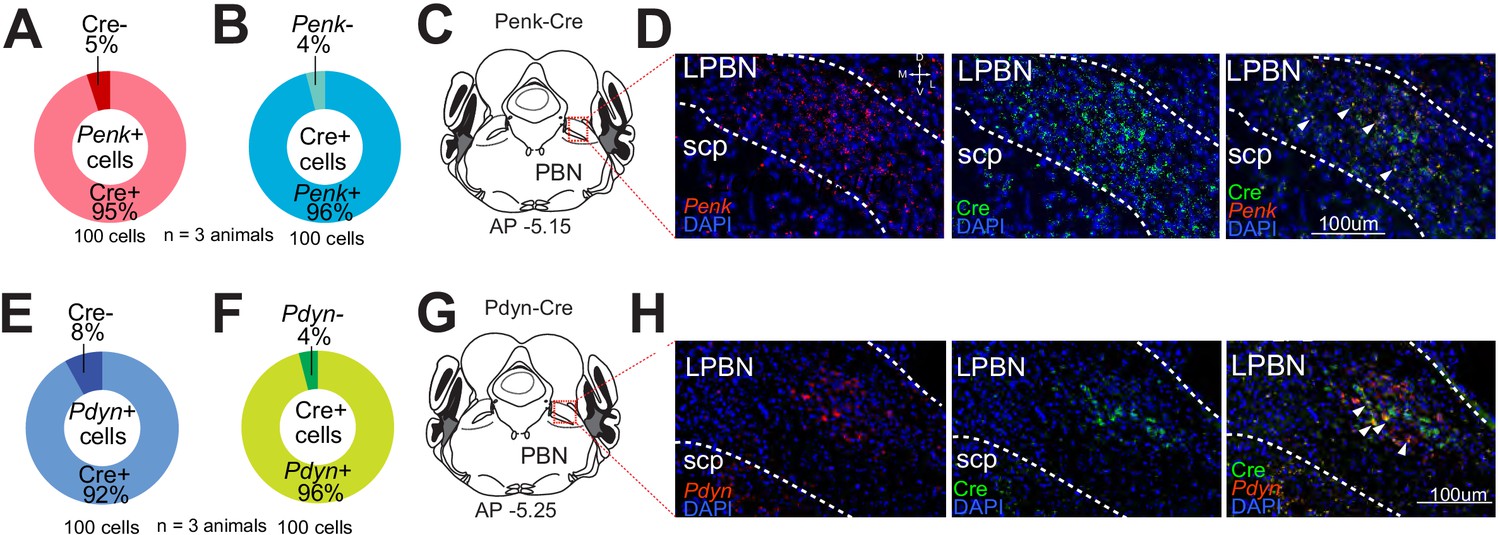
Validation of Penk-Cre and Pdyn-Cre lines in the parabrachial nucleus (PBN).
FISH was performed on brain sections from Pdyn-Cre or Penk-Cre mice using probes for prodynorphin or proenkephalin in combination with a probe for Cre transcripts. (A and B) The co-expression of Cre with proenkephalin was quantified by counting 100 cells from three animals positive for labeling of either (A) proenkephalin or (B) Cre and then counting the number of those cells that were also positive for the other probe. (C) Diagram of the anatomic localization of the PBN sections shown in (D) with labeling of proenkephalin (red), Cre (green) and DAPI (blue). Arrowheads highlight examples of cells labeled by probes for both transcripts. (E and F) The co-expression of Cre with prodynorphin was quantified by counting 100 cells from three animals positive for labeling of either (E) prodynorphin or (F) Cre and then counting the number of those cells that were also positive for the other probe. (G) Diagram of the anatomic localization of the PBN sections shown in (H) with labeling for prodynorphin (red), Cre (green) and DAPI (blue). Arrowheads highlight examples of cells labeled by probes for both transcripts.
Figure 2 with 2 supplements
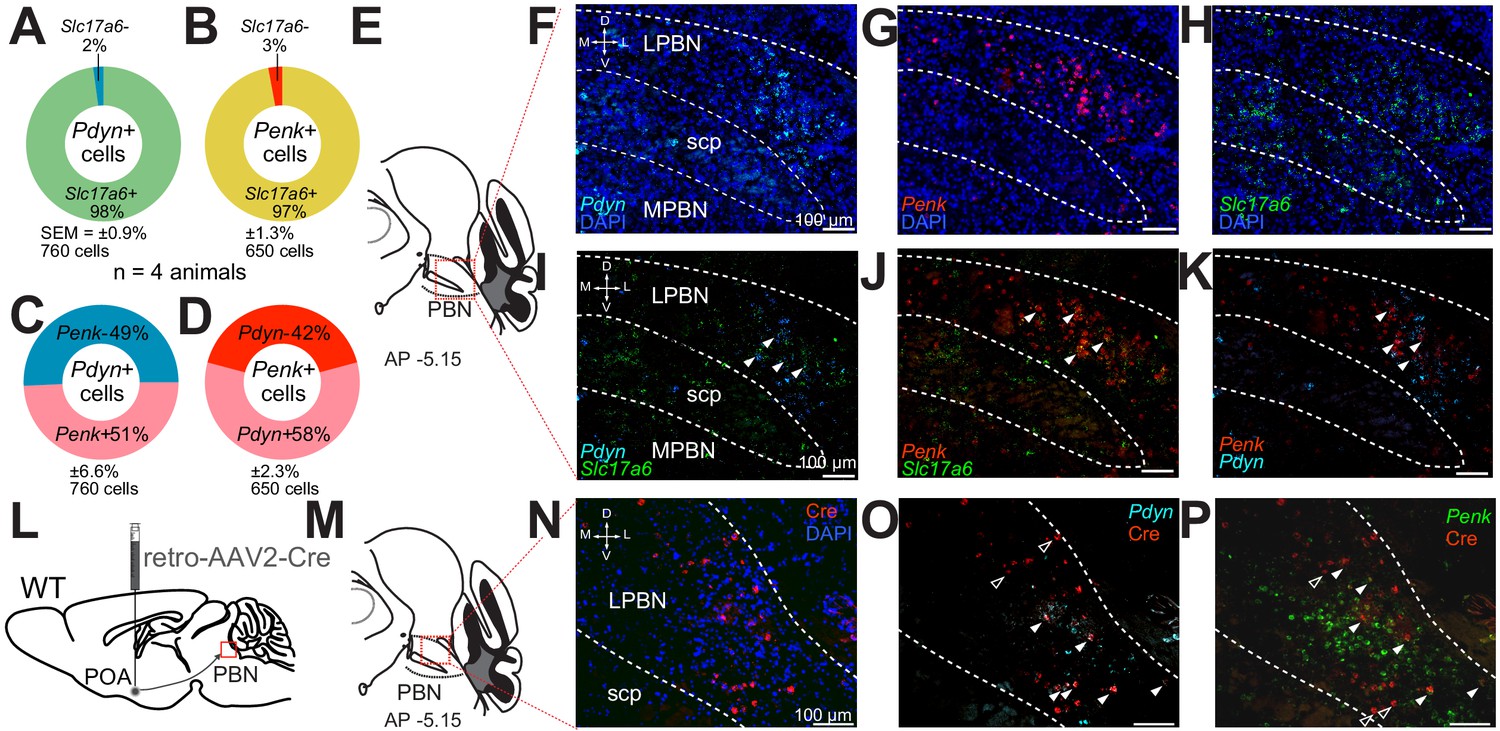
Pdyn+ and Penk+ LPBN neuron populations overlap, express Slc17a6, and project to the POA.
(A–D) Quantification of cells labeled with (A) Pdyn probe (Pdyn+) and Slc17a6 (VGLUT2+) probes, or (B) Penk (Penk+) and Slc17a6 (VGLUT2+) probe, or (C and D) Pdyn and Penk probes. (E) Illustration of area of parabrachial nucleus (PBN) depicted in F–K. (F–H) Representative FISH images of LPBN neurons expressing (F) Pdyn, (G) Penk, and (H) Slc17a6. (I–K) (similar results were obtained in n = 3 mice) Representative images of overlays of (I) Pdyn with Slc17a6 and Penk with Slc17a6 (J), and (K) Pdyn with Penk. Arrowheads mark examples of cells positive for co-labeling of two transcripts. 98% of neurons expressing Pdyn and 97% of neurons labeled for Penk were also labeled with probes for Slc17a6. Data are presented as mean ± SEM; n = 4 animals, 760 cells for Pdyn and n = 4 animals, 760 cells for Penk. Diagram of viral injections into wild-type mice. (M) Anatomical location of representative FISH images shown in (N and O) that show overlap of (N) Cre expression, mediated by retrovirus transduction, with (O) Pdyn and (P) Penk. Arrowheads mark cells expressing Cre, with filled arrowheads co-expressing (O) Pdyn or (P) Penk and open arrowheads only expressing Cre.
Figure 2—figure supplement 1

POA-projecting parabrachial nucleus (PBN) neurons are VGLUT2+ and a subpopulation is Pdyn+.
(A) Illustration of injections of a retrograde recombinase dependent red-to-green (tdTomato to EGFP) color changing virus (AAV-retro-DO_DIO-tdTomato_EGFP) into the POA of Pdyn-Cre or VGLUT2-Cre mice. (B) Anatomical location of representative brain sections displayed in panels (C) (Pdyn-Cre) and (D) (VGLUT2-Cre). Sections were analyzed for GFP and/or tdTomato expression in LPBN. Cre- neurons transduced by the virus express tdTomato (red), Cre+ neurons express EGFP. (C) In brain sections taken from Pdyn-Cre mice, neurons expressing tdTomato (Cre-, red) and EGFP (Cre+, green) are observed. White arrowheads mark EGFP expressing Cre+ cells; red arrowheads mark tdTomato expressing Cre- cells (n = 3 animals). (D) In brain sections taken from VGLUT2-Cre mice, only Cre+ cells expressing EGFP are observed (white arrowheads). (E) Illustration of viral injections into PBN of VGLUT2-Cre mice to label VGLUT2PBN→POA projections. (F) Anatomical location of representative brain sections displayed in panel G. (G) Expression of eYFP in medial and lateral PBN of VGLUT2+ mice after injection of AAV5-DIO-ChR2eYFP into the PBN. (H) Anatomical location of representative brain sections displayed in panel (I) showing the POA projections of PBN VGLUT2+ neurons. (J) Illustration of injections into the PBN of Pdyn-Cre mice to label anterograde projections and (lower) showing the plane of the sagittal section containing the PBN and the POA in (K) highlighting the dense projections of Pdyn+ PBN neurons to the POA and other brain areas (n = 4 animals).
Figure 2—figure supplement 2
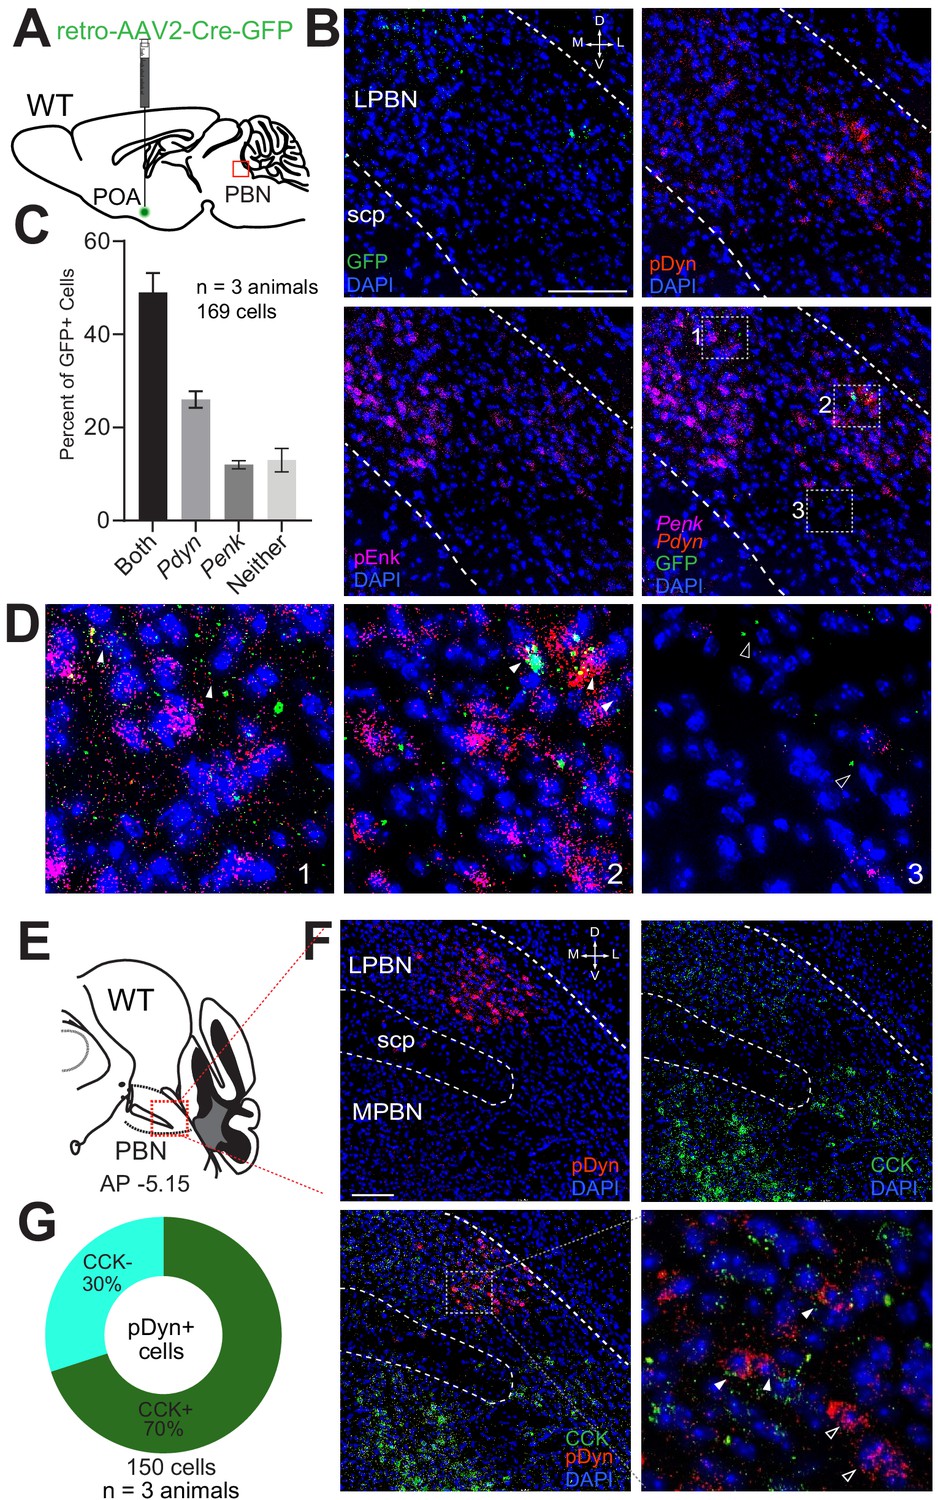
Expression of Pdyn and/or Penk in parabrachial nucleus (PBN)→POA projecting neurons and partially overlapping expression of Cck and Pdyn in LPBN.
We examined the expression of Pdyn and Penk in PBN→POA neurons. (A) PBN→POA neurons were marked by injection of retrograde AAV constructs expressing GFP into the POA. (B and C) We performed FISH to label neurons for GFP, Penk, and Pdyn. We found that of cells in LPBN labeled by retroAAV-eGFP 49 ± 4% (mean ± SEM) were also labeled by Penk and Pdyn. (D) The detailed view for the three numbered areas in the overlaid image. Closed arrows mark GFP, Penk, and Pdyn labeled neurons and open arrows mark neurons only labeled for GFP. Of the remaining GFP labeled LBPN neurons 26 ± 2% were labeled by either Pdyn or 12 ± 1% (mean ± SEM) by Penk but not both. 13 ± 3% (mean ± SEM) of GFP labeled LPBN neurons were not labeled by either. n = 3 mice, 169 cells (B and C). We also performed FISH in brain sections from WT mice to examine expression of Cck and Pdyn in PBN neurons. (E and F) Pdyn labeled cells were seen in the lateral PBN and (F) Cck labeled cells were seen in both medial and lateral areas with a more intensely labeled population in the MPBN. Pdyn cells were found to both co-label with Cck (closed arrows) and not co-label with Cck (open arrows). (G) Quantification of randomly selected Pdyn labeled cells in serial PBN sections from three animals demonstrated a mean ± SEM co-labeling with Cck in 70 ± 0.7% of Pdyn cells (n = 3 mice, 150 cells). Scale bars 100 µM.
Figure 3
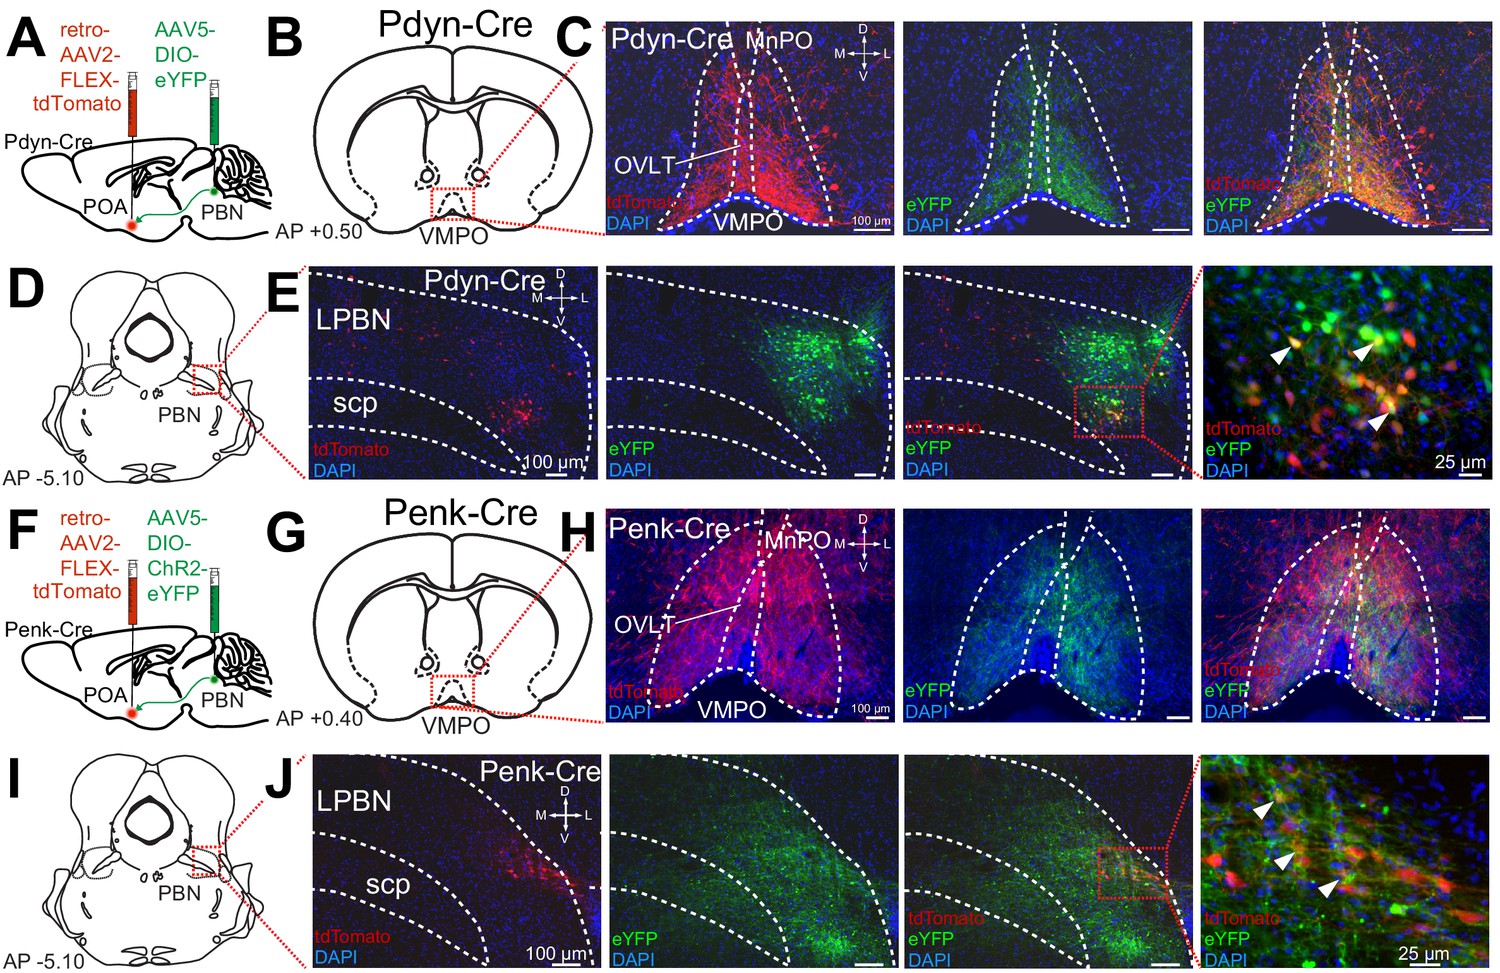
Pdyn+ and Penk+ LPBN neurons project to VMPO.
(A) Illustration of injection of retroAAV-DIO-tdTomato in POA and AAV5-DIO-eYFP in a Pdyn-Cre mouse. (B) Diagram of POA region depicted in (C) showing antero- (green) and retrograde (red) labeling of Pdyn+ neurons in POA. (D) Diagram of parabrachial nucleus (PBN) region depicted in (E) showing retrograde labeling from POA (red) and eYFP expression (green). Yellow cells in overlay image, marked with arrow heads, illustrate dual labeling by locally injected and retrograde viruses. (F) Illustration of injection of retroAAV-DIO-tdTomato in POA and AAV5-DIO-eYFP in an Penk-Cre mouse. (G) Diagram of POA region depicted in (H) show antero- (green) and retrograde (red) labeling of Penk+ neurons in POA. (I) Diagram of PBN region depicted in (J) showing retrograde labeling from POA (red) and eYFP expression (green). Yellow cells in overlay image, marked with arrow heads, illustrate dual labeling by locally injected and retrograde viruses.
Figure 4 with 1 supplement
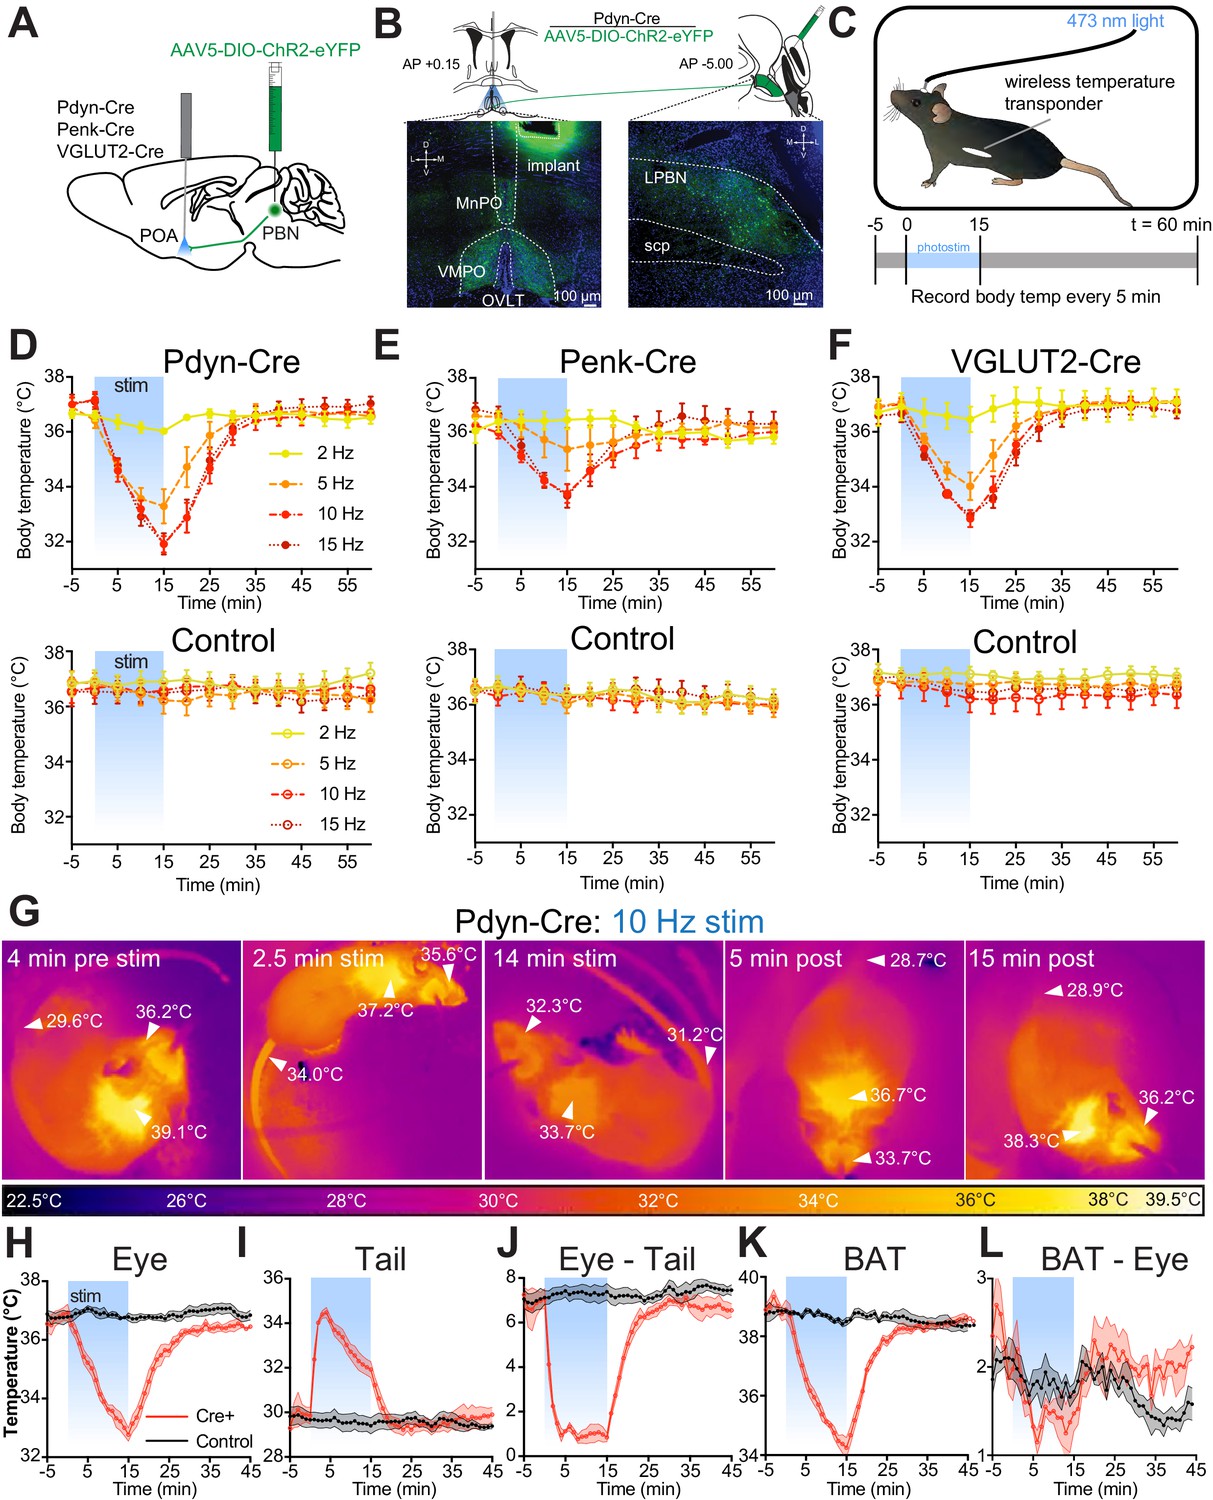
Photostimulation of PdynPBN→POA, PenkPBN→POA, and VGLUT2PBN→POA causes acute hypothermia by evoking thermal heat defenses.
(A) Illustration of viral injections in parabrachial nucleus (PBN) and fiber optic implantation over POA in Pdyn-Cre, Penk-Cre, or VGLUT2-Cre mice. (B) Illustration shows viral and fiber optic delivery in a Pdyn-Cre mouse along with representative expression of ChR2-eYFP (green) in PBN injection site and POA implantation site. (C) Diagram shows core body temperature measurement method and paradigm for photostimulation for 15 min and temperature recording for 65 min trials. (D–F) Body temperature vs. time graphs for 2 (yellow), 5 (orange), 10 (red), and 15 (dark red) Hz photostimulation of (D) PdynPBN→POA, (E) PenkPBN→POA, (F) VGLUT2PBN→POA, and controls for each. Photostimulation was delivered from t = 0 to t = 15 min and led to a frequency dependent reduction in body temperature in Pdyn-Cre, Penk-Cre, and VGLUT2-Cre mice. Body temperature of control animals was stable throughout the trials. Data are presented as mean ± SEM. For experimental animals, n = 6 (D and E) and n = 8 (F). For control animals, n = 8 (D) and n = 7 (E and F). (G) Representative quantitative thermal imaging from a representative trial showing a mouse before, during, and after 10 Hz photostimulation of PdynPBN→POA. Arrows show temperatures of eye, BAT, or tail. Eye and BAT temperature decreased as a result of stimulation; tail temperature increased as a result of stimulation. (H–L) Quantitative thermal imaging measurements of (H) eye, (I) tail, (J) eye minus tail, (K) BAT, and (L) BAT minus eye temperature vs. time graphs for 10 Hz photostimulation of PdynPBN→POA. Photostimulation was delivered from t = 0 to t = 15 min and led to decreases in eye and BAT temperatures, an increase in tail temperature. Tail and eye temperatures equilibrated in Cre+ animals. BAT thermogenesis was suppressed with a decline in the difference between eye and BAT temperatures during stimulation. Data are presented as mean ± SEM. See Figure 4—figure supplement 1 for data from Penk-Cre animals.
Figure 4—figure supplement 1
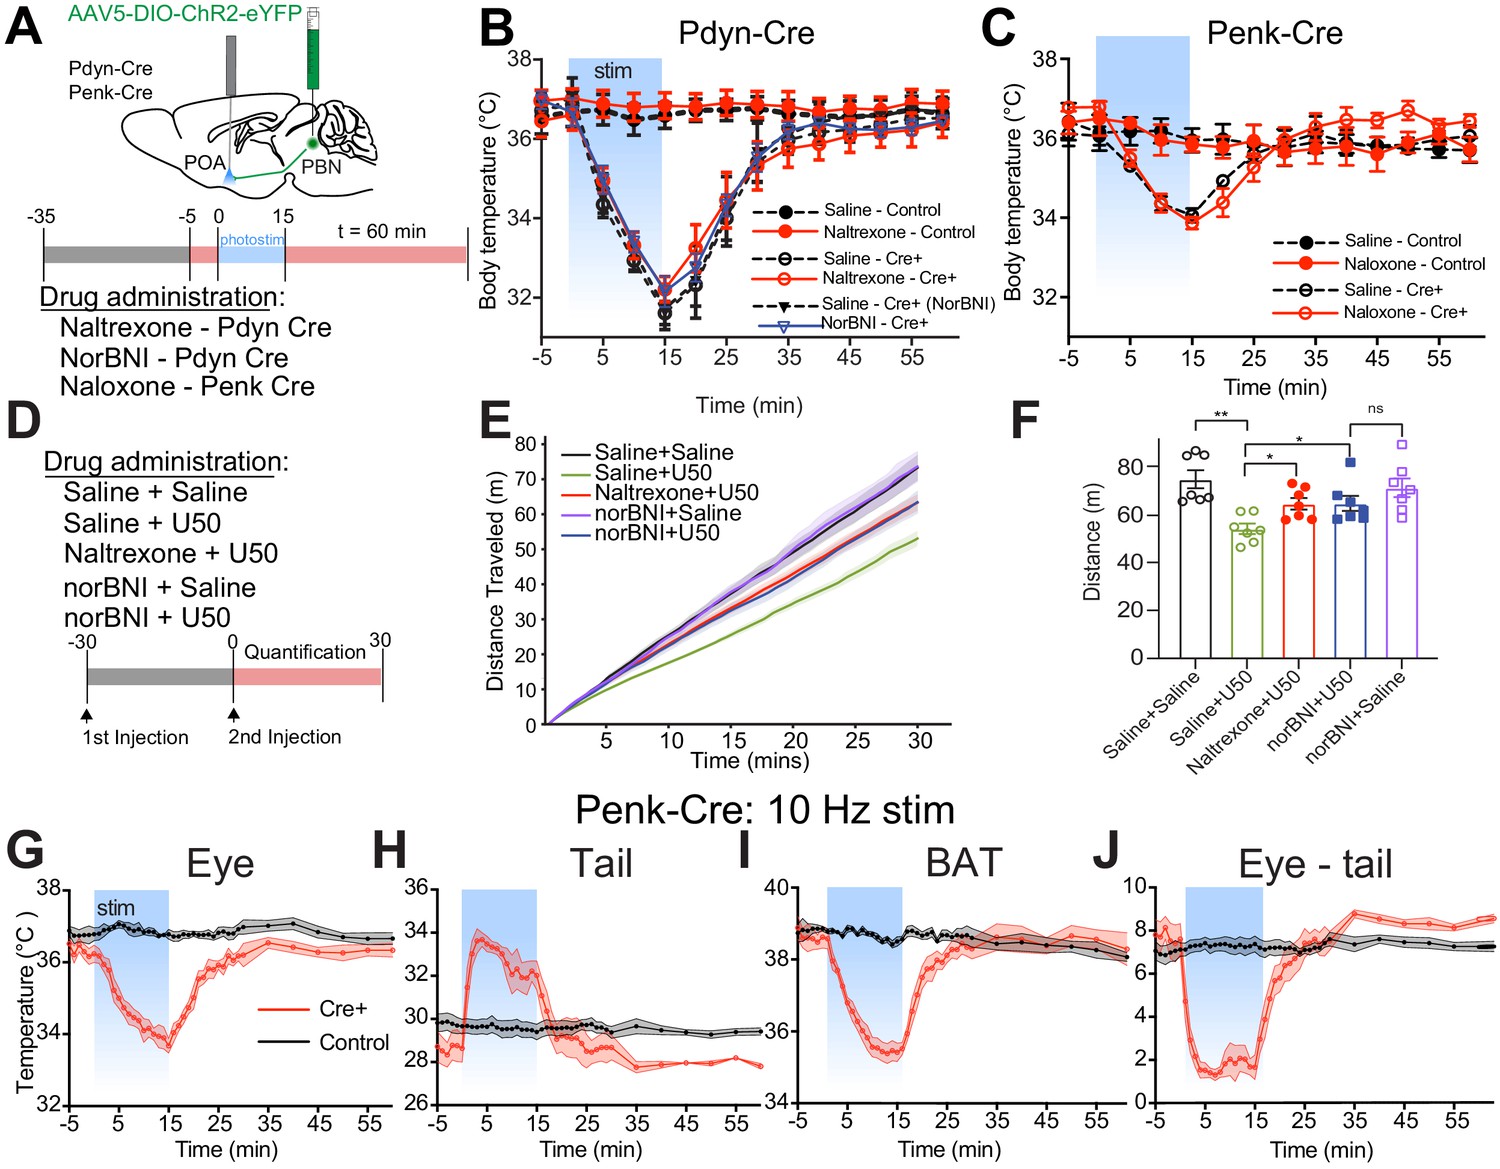
PdynPBN→POA or PenkPBN→POA photostimulation-induced hypothermia is independent of opioid system.
(A) Illustrations of viral injections and fiber optic implantation in Pdyn-Cre and Penk-Cre mice and timeline of drug administration/photostimulation/temperature recording trials. (B) Body temperature vs. time graphs for 10 Hz photostimulation of PdynPBN→POA and control with IP saline, naltrexone (red), or norBN (blue) administration. Photostimulation was delivered from t = 0 to t = 15 min and led to equivalent levels of hypothermia in Cre+ mice regardless of pharmacologic pretreatment. Body temperature of controls was consistent throughout the trial. Data are presented as mean ± SEM. n = 6–7 animals/group. (C) Body temperature vs. time graphs for 10 Hz photostimulation of PenkPBN→POA in Penk-Cre and control mice with prior IP naloxone or saline administration. Pretreatment did not alter the responses to photostimulation in Penk-Cre mice. Data are presented as mean ± SEM. n = 5 animals in each group. (D–F) To examine effectiveness of antagonist pretreatment we examined the impact of administration naltrexone and norBNI on U50 (5 mg/kg) mediated suppression of locomotor activity. (D) Saline or antagonists were administered 30 min prior to U50 (or saline) in the combinations listed and locomotor activity tracked for 30 min after U50 injection. (E) The cumulative distance traveled and total distanced traveled show marked suppression of movement by U50 which was ameliorated by pretreatment with naltrexone or norBNI (24 hr plus 30 min prior). (F) Total distance traveled at 30 min after U50 administration significantly (p=0.002) reduced compared to saline. This decrease in locomotion was reduced significantly by pretreatment naltrexone (p=0.014) or norBNI (p=0.025). norBNI followed by U50 was not significantly different from norBNI followed by saline. n = 5 mice. (G–H) Results obtained using quantitative thermal imaging to measure tail, eye, and BAT temperatures in Penk-Cre mice during 10 Hz photostimulation as done for Pdyn-Cre mice in Figure 4. (G) Eye, (H) tail, (I) BAT, and (J) eye minus tail temperature vs. time graphs for 10 Hz photostimulation of PenkPBN→POA. Photostimulation was delivered from t = 0 to t = 15 min and led to drops in eye and BAT temperatures. Tail temperature rose and the gradient between eye and tail temperatures declined in Cre+ animals but not control mice. Data are presented as mean ± SEM. n = 5 in each group.
Figure 5 with 1 supplement

VGLUT2+ parabrachial nucleus (PBN) neurons are necessary for heat-defensive tail vasodilation.
(A) Illustrations depict viral injections in VGLUT2-Cre mice and purpose-built heat challenge arena that allowed for rapid changing of environmental temperature between two stable set points. (B) Tail temperature as determined using quantitative thermal imaging vs. time graph for 34°C thermal heat challenge for mice expressing hM4D(Gi) DREADDs in VGLUT2+ PBN neurons treated either with CNO or saline. Heat challenge was delivered from t = 0 to t = 15 min, and arena temperature measured using thermal imaging during the trial is represented by the orange line. In mice injected with CNO 2.5 mg/kg, tail temperature passively equilibrated with arena temperature (34°C) over the 15 min heat challenge. In mice injected with saline, tail temperature rose above arena temperature after 5 min of heat challenge representing heat release through vasodilation. Data are presented as mean ± SEM. n = 5 animals, paired between CNO and saline conditions. (C) Tail temperature vs. time graph for 34°C heat challenge between t = 0 and t = 5 min. Note the separation between average tail temperatures of the saline condition vs. the CNO condition. Data are presented as mean ± SEM. n = 5 animals, paired between CNO and saline conditions. (D) Tail temperature at t = 15 min of 34°C heat challenge. Tail temperatures in the saline condition were an average of 2.3 ± 0.68°C higher than those in the CNO condition. (E) Representative thermal images of trials for mice treated with CNO and measurement of tail temperature showing tail temperatures remain close to the temperature of the area floor. (F) Representative thermal images of trials for mice treated with saline and tail temperature exceed floor temperature. Data are presented as mean ± SEM. n = 5 animals, paired between CNO and saline conditions. Student’s t-test, ∗p<0.05. See Figure 5—figure supplement 1 for data from the same assay in Pdyn-Cre mice.
Figure 5—figure supplement 1
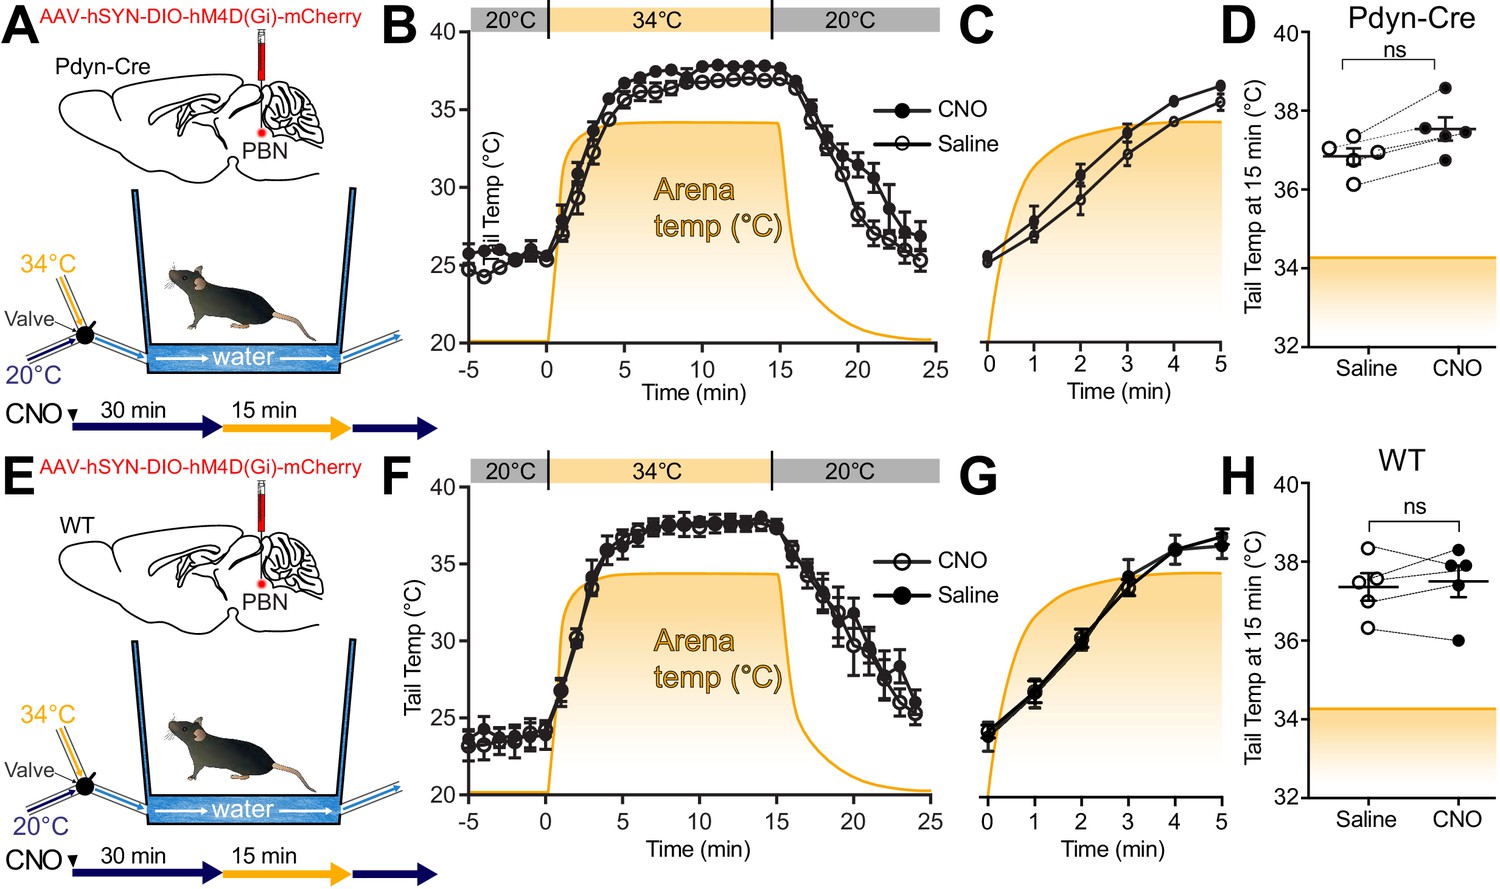
Gi DREADD mediated inhibition of Pdyn+ parabrachial nucleus (PBN) neurons does not block thermal challenge evoked tail vasodilation and CNO in WT mice does not alter responses to warmth challenge.
(A and E) Illustrations depict viral injections in Pdyn-Cre or WT mice and arena that allowed for rapid changing of environmental temperature between two stable set points. Tail temperature vs. time graph for 34°C heat challenge for (B) Pdyn-Cre or (F) WT mice. Heat challenge was delivered from t = 0 to t = 15 min, and arena temperature throughout the trial is displayed by the orange line. In mice injected with CNO 2.5 mg/kg or in mice injected with saline, tail temperature rose above arena temperature after 4–5 min of heat challenge. Data are presented as mean ± SEM. n = 5 animals, paired between CNO and saline conditions. Tail temperature vs. time graph for 34°C heat challenge between t = 0 and t = 5 min for Pdyn-Cre (C) or WT (G) mice. Note the overlap between average tail temperatures of the saline condition vs. the CNO condition across time. Data are presented as mean ± SEM. n = 5 animals, paired between CNO and saline conditions. (D and H) Tail temperature at t = 15 min of 34°C heat challenge. The average difference between tail temperatures in the saline condition and those in the CNO condition was not significantly different. For Pdyn-Cre mean difference ± SEM was 0.18 ± 0.22 (p=0.46). For WT mean ± SEM difference 0.14 ± 0.24°C (p=0.59). Data are presented as mean ± SEM. n = 5 animals in each group, paired between CNO and saline conditions for both Pdyn-Cre and WT.
Figure 6 with 1 supplement
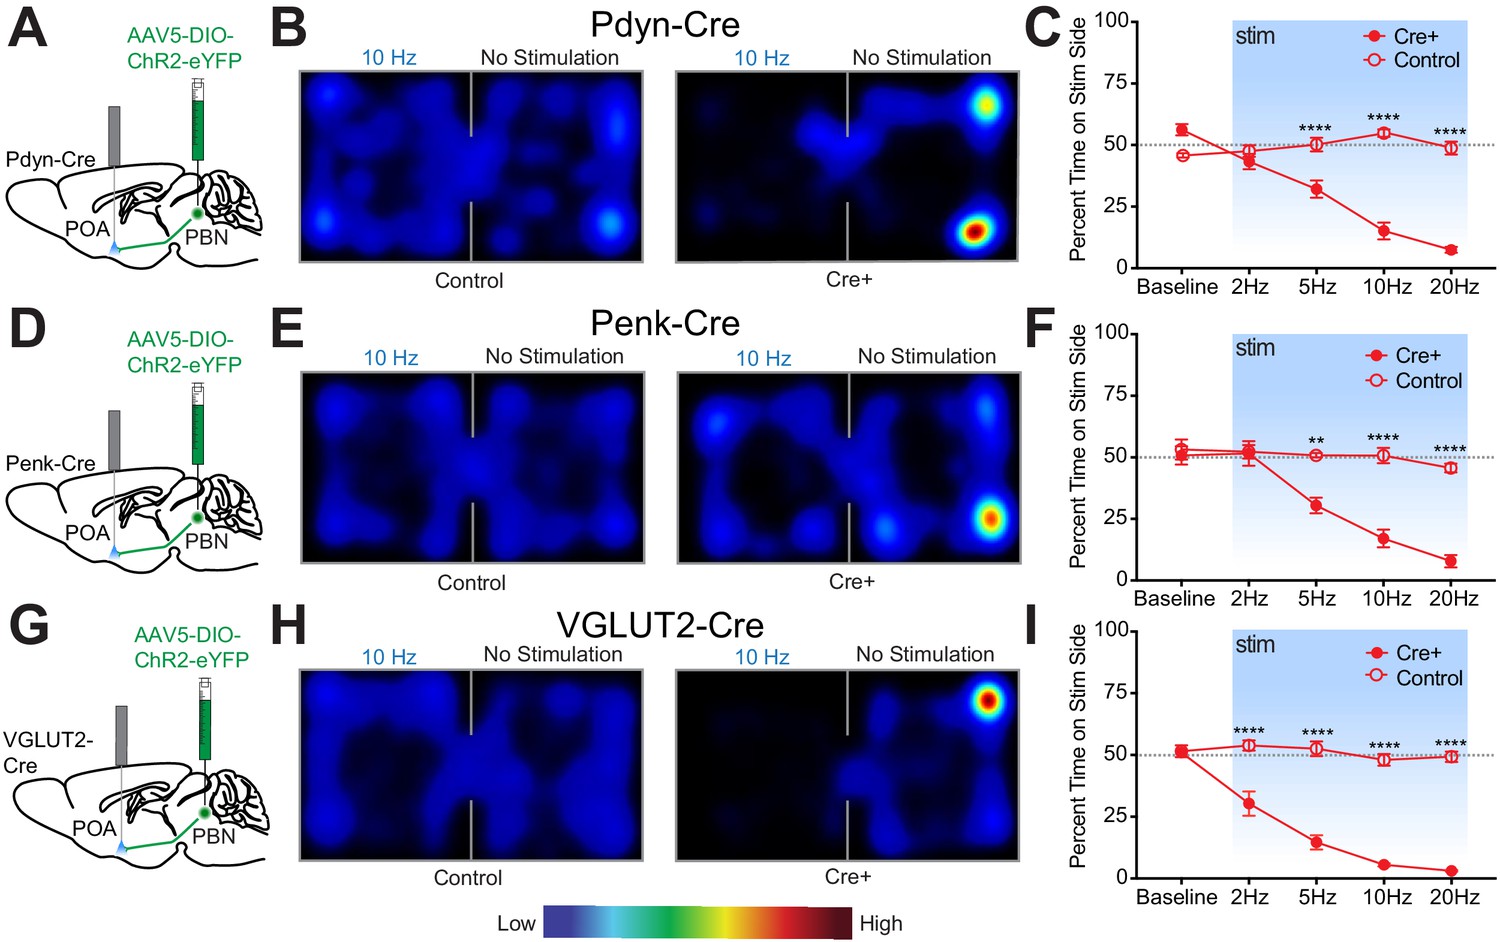
Photostimulation of PdynPBN→POA, PenkPBN→POA, and VGLUT2PBN→POA terminals induces real time place aversion.
(A, D, and G) Illustrations of viral injections in parabrachial nucleus (PBN) and fiber optic implantations over POA in Pdyn-Cre mice, Penk-Cre, and VGLUT2-Cre mice, respectively. (B, E, and H) Representative heat maps showing spatial distribution of time-spent behavior resulting from side-conditional 10 Hz photostimulation of control or Pdyn-Cre, Penk-Cre, and VGLUT2-Cre mice, respectively. (C) For Pdyn-Cre vs control mice, frequency response of RTPP at 0 (baseline), 2, 5, 10, and 20 Hz. Data are presented as mean ± SEM; n = 6 Cre+, eight control; two-Way ANOVA, Bonferroni post hoc. (F) Penk-Cre frequency response of RTPP at 0 (baseline), 2, 5, 10, and 20 Hz. Data are presented as mean ± SEM; n = 6 Cre+, seven control; two-Way ANOVA, Bonferroni post hoc (5 Hz ChR2 vs. 5 Hz control ∗∗∗p<0.001, 10 Hz ChR2 vs. 10 Hz control ∗∗∗∗p<0.0001, 20 Hz ChR2 vs. 20 Hz control ∗∗∗∗p<0.0001). (I) VGLUT2-Cre frequency response of RTPP at 0 (baseline), 2, 5, 10, and 20 Hz. Data are presented as mean ± SEM; n = 8 Cre+, seven control; two-Way ANOVA, Bonferroni post hoc (2 Hz ChR2 vs. 20 Hz control ∗∗∗∗p<0.0001, 5 Hz ChR2 vs. 5 Hz control ∗∗∗∗p<0.0001, 10 Hz ChR2 vs. 10 Hz control ∗∗∗∗p<0.0001, 20 Hz ChR2 vs. 20 Hz control ∗∗∗∗p<0.0001). See also Figure 6—figure supplement 1.
Figure 6—figure supplement 1

Total distance traveled for Pdyn-Cre, Penk-Cre, and VGLUT2-Cre mice in real-time place aversion assay and male vs. female photostimulation-induced body temperature change in Pdyn-Cre and VGLUT2-Cre mice.
(A) Distance moved during RTPP trials displayed in Figure 6C (Pdyn-Cre). Data are presented as mean ± SEM; n = 6 Cre+, eight control; two-way ANOVA, Bonferroni post hoc (20 Hz ChR2 vs. 20 Hz control ∗∗p<0.01). (B) Distance moved during RTPP trials displayed in Figure 6F (Penk-Cre). Data are presented as mean ± SEM; n = 6 Cre+, seven control; two-Way ANOVA, Bonferroni post hoc (not significant at all frequencies ns p>0.05). (C) Distance moved during RTPP trials displayed in Figure 6I (VGLUT2-Cre). Data are presented as mean ± SEM; n = 8 Cre+, seven control; two-Way ANOVA, Bonferroni post hoc (not significant at all frequencies ns p>0.05). (D and E) The change in body temperature of Pdyn-Cre female (n = 4) and male (n = 2) and VGLUT2-Cre female (n = 6) and male (n = 2) mice was similar at all stimulation frequencies (2, 5, 10, and 15 Hz) tested.
Figure 7
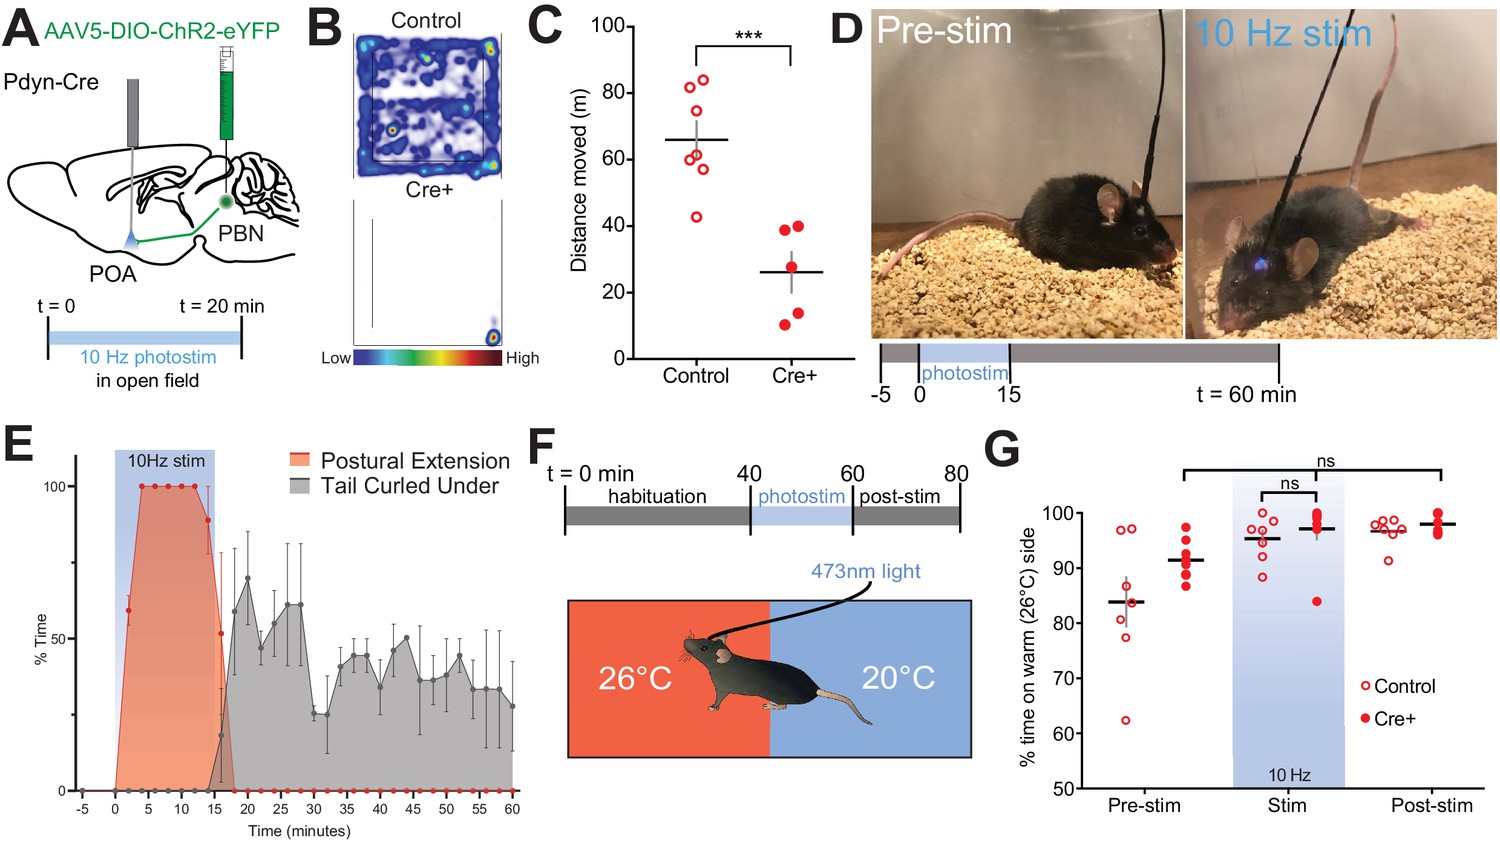
Photostimulation of PdynPBN→POA suppresses locomotion, evokes postural extension but does not alter temperature preference.
(A) Illustration of injection in parabrachial nucleus (PBN) and fiber implantation over POA in Pdyn-Cre mice. (B) Representative heat maps show spatial distribution of time-spent behavior resulting from constant 20 min 10 Hz photostimulation of control or PdynPBN→POA. (C) Quantification of movement during open field testing. Control animals moved an average of 39.84 ± 8.33 meters more than Cre+ animals during open field trials. Data are presented as mean ± SEM; n = 5 Cre+, seven control; Student’s t test, ∗∗∗p<0.001 (D) 10 Hz photostimulation of PdynPBN→POA leads to postural extension behavior as shown. Representative images of a mouse pre stimulation and during 10 Hz photostimulation of PdynPBN→POA. (E) Quantification of percent time spent in time spent engaged in postural extension in Pdyn-Cre mice in two min time bins. Following onset of photostimulation mice engaged in postural extension (red). With termination of stimulation mice, we noted to switch to a posture with their tails curled under their bodies (grey). Postural extension was not observed in any control mice. (F) Overview of paradigm with three epochs: 40 min of pre-stim, 10 Hz photostimulation for 20 min, and post-stim for 20 min in an arena with aluminum floor held at 20°C and 26°C on opposing sides. (G) Quantification of time spent in each temperature area showed non-significant changes in percent time spent in each area during delivery of stimulation, with a strong preference for the 26°C side during all epochs. Data presented as mean ± SEM with individual values, n = 9 Pdyn-Cre (ANOVA ns = 0.7341 for Pdyn-Cre mice across epochs) and (t-test ns p>0.99 for Pdyn-Cre vs Control during stimulation epoch).
Figure 8
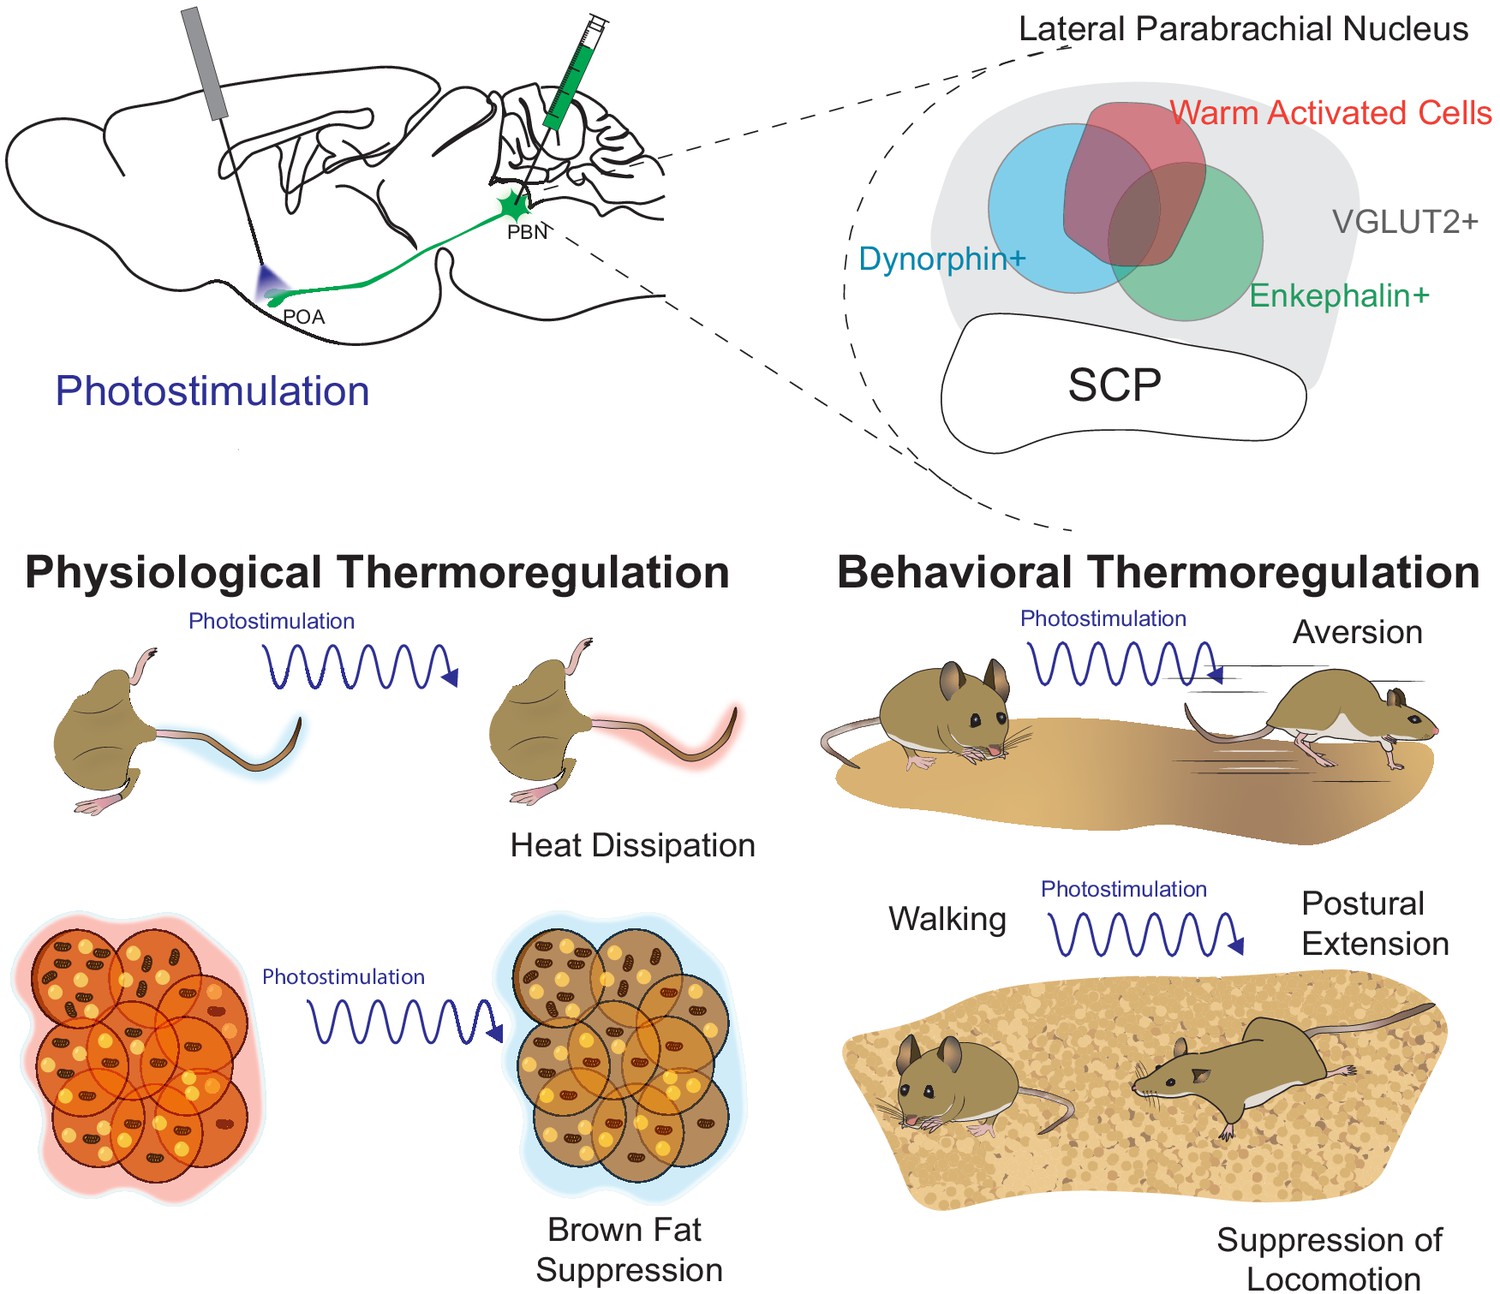
Graphical summary.
The presented studies focused on parabrachial nucleus (PBN)→POA projecting cells by photostimulating terminals in the POA. We identified warm-activated neurons (red circle) in the lateral PBN that incompletely overlap with Penk+ and Pdyn+ PBN neuronal populations. Further, we found that these Penk (green circle) and Pdyn (blue circle) neurons express VGLUT2 (gray) and partially overlap with each other. Photostimulation of PBN→POA projections revealed that PBN VGLUT2+, Pdyn+, or Penk+ projections drive physiological and behavioral heat defenses including vasodilation to promote heat loss, avoidance, suppression of BAT thermogenesis, and postal extension to promote heat loss.
Tables
Key resources table
| Reagent type (species) or resource | Designation | Source or reference | Identifiers | Additional information |
|---|---|---|---|---|
| Antibody | Alexa Fluor 633 goat polyclonal anti-rabbit IgG | Invitrogen | Cat# A-21070, RRID:AB_2535731 | 1:1000 |
| Antibody | Phospho-c-Fos (Ser32) Rabbit monoclonal | Cell Signaling Technology | Cat# 5348S RRID:AB_10557109 | 1:500 |
| Chemical compound, drug | Clozapine N-oxide dihydrochloride | Hellobio | Cat# HB6149 | |
| Chemical compound, drug | Naloxone hydrochloride | Tocris | Cat# 0599 | |
| Chemical compound, drug | Naltrexone hydrochloride | Sigma-Aldrich | Cat# N3136 | |
| Chemical compound, drug | Norbinaltorphimine (norBN) | Sigma-Aldrich | Cat# N1771 | |
| Chemical compound, drug | U50,488 (U50) | Sigma-Aldrich | Cat# D8040 | |
| Strain, strain background (Mus musculus) | Pdyntm1.1(Cre)Mjkr | Gift from Brad Lowell, Harvard | RRID:MGI:5562890 | |
| Strain, strain background (Mus musculus) | B6;129S-Penktm2(Cre)Hze/J | The Jackson Laboratory | RRID: IMSR_JAX: 025112 | |
| Strain, strain background (Mus musculus) | Slc17a6tm2(cre)Lowl/J | Gift from Brad Lowell, Harvard | RRID: IMSR_JAX: 028863 | |
| Strain, strain background (Mus musculus) | B6.Cg-Gt(ROSA)26Sortm14(CAG-tdTomato)Hze/J | The Jackson Laboratory | RRID: IMSR_JAX: 007914 | |
| Strain, strain background (Mus musculus) | C57BL/6J | The Jackson Laboratory | RRID: IMSR_JAX:000664 | |
| Strain, strain background (AAV5) | AAV5-EF1a-DIO-hChR2(H134R)-EYFP | Washington University Hope Center Viral Vector Core | N/A | (2.5 × 10¹³ vg/ml) |
| Strain, strain background (AAV5) | AAV5-hSyn-DIO-hM4D(Gi)-mCherry | Addgene | Addgene_44362-AAV5 | (7 × 10¹² vg/ml) |
| Strain, strain background (rAAV2-retro) | AAV2-retro-DIO-ChR2-eYFP | Washington University Hope Center Viral Vector Core | N/A | (2.8 × 10¹² vg/ml) |
| Strain, strain background (AAV) | AAV-retro-CAG-FLEX-tdTomato-WPRE | Addgene | Addgene_51503-AAVrg | (1 × 10¹³ vg/ml) |
| Strain, strain background (AAV2) | AAV2-retro-DO_DIO-tdTomato_EGFP-WPRE-pA | Addgene | RRID:Addgene_37120 | (8 × 10^12 GC/ml) |
| Strain, strain background (AAV5) | AAV5-Ef1a-DIO-eYFP | Washington University Hope Center Viral Vector Core | N/A | (1.4 × 10¹³ vg/ml) |
| Strain, strain background (rAAV2-retro) | AAV2-retro-GFP-Cre | Washington University Hope Center Viral Vector Core | N/A | (3 × 10¹³ vg/ml) |
| Strain, strain background (AAV5) | AAV5/hSyn-dio-hm4D(Gi)-mcherry | Addgene | RRID:Addgene_44362 | (7.8 × 10^12 vg/ml) |
| Sequence-based reagent | RNAscope probe Pdyn | Advanced Cell Diagnostics | accession number NM_018863.3 | probe region 33–700 |
| Sequence-based reagent | RNAscope probe Penk | Advanced Cell Diagnostics | accession number NM_001002927.2 | probe region 106–1332 |
| Sequence-based reagent | RNAscope probe Slc17a6 | Advanced Cell Diagnostics | accession number NM_080853.3 | probe region 1986–2998 |
| Sequence-based reagent | RNAscope probe GFP | Advanced Cell Diagnostics | accession numberAF275953.1 | probe region 12–686 |
| Sequence-based reagent | RNAscope probe Cre | Advanced Cell Diagnostics | accession number KC845567.1 | probe region 1058–2032 |
| Sequence-based reagent | RNAscope probe Cck | Advanced Cell Diagnostics | accession number NM_031161.3 | probe region 23–679 |
| Software, algorithm | ImageJ | NIH | RRID: SCR_003070 | |
| Software, algorithm | ResearchIR | FLIR Systems Inc | N/A | |
| Software, algorithm | Leica Application Suite Advanced Fluorescence | Leica Microsystems | N/A | |
| Software, algorithm | Bonsai | Bonsai-rx.org | N/A | |
| Software, algorithm | DeepLabCut | Mathis Lab (Mathis et al., 2018) | N/A |
Additional files
Download links
A two-part list of links to download the article, or parts of the article, in various formats.
Downloads (link to download the article as PDF)
Open citations (links to open the citations from this article in various online reference manager services)
Cite this article (links to download the citations from this article in formats compatible with various reference manager tools)
Parabrachial opioidergic projections to preoptic hypothalamus mediate behavioral and physiological thermal defenses
eLife 10:e60779.
https://doi.org/10.7554/eLife.60779


