Reduction of elevated proton leak rejuvenates mitochondria in the aged cardiomyocyte
- Department of Laboratory Medicine and Pathology, University of Washington, United States
- Department of Molecular and Cell Biology, University of Connecticut, United States
- Mitochondria and Metabolism Center, Department of Anesthesiology and Pain Medicine, University of Washington, United States
- Social Profit Network Research Lab, Alexandria LaunchLabs, United States
- Department of Radiology, University of Washington, United States
Figures
Figure 1 with 2 supplements
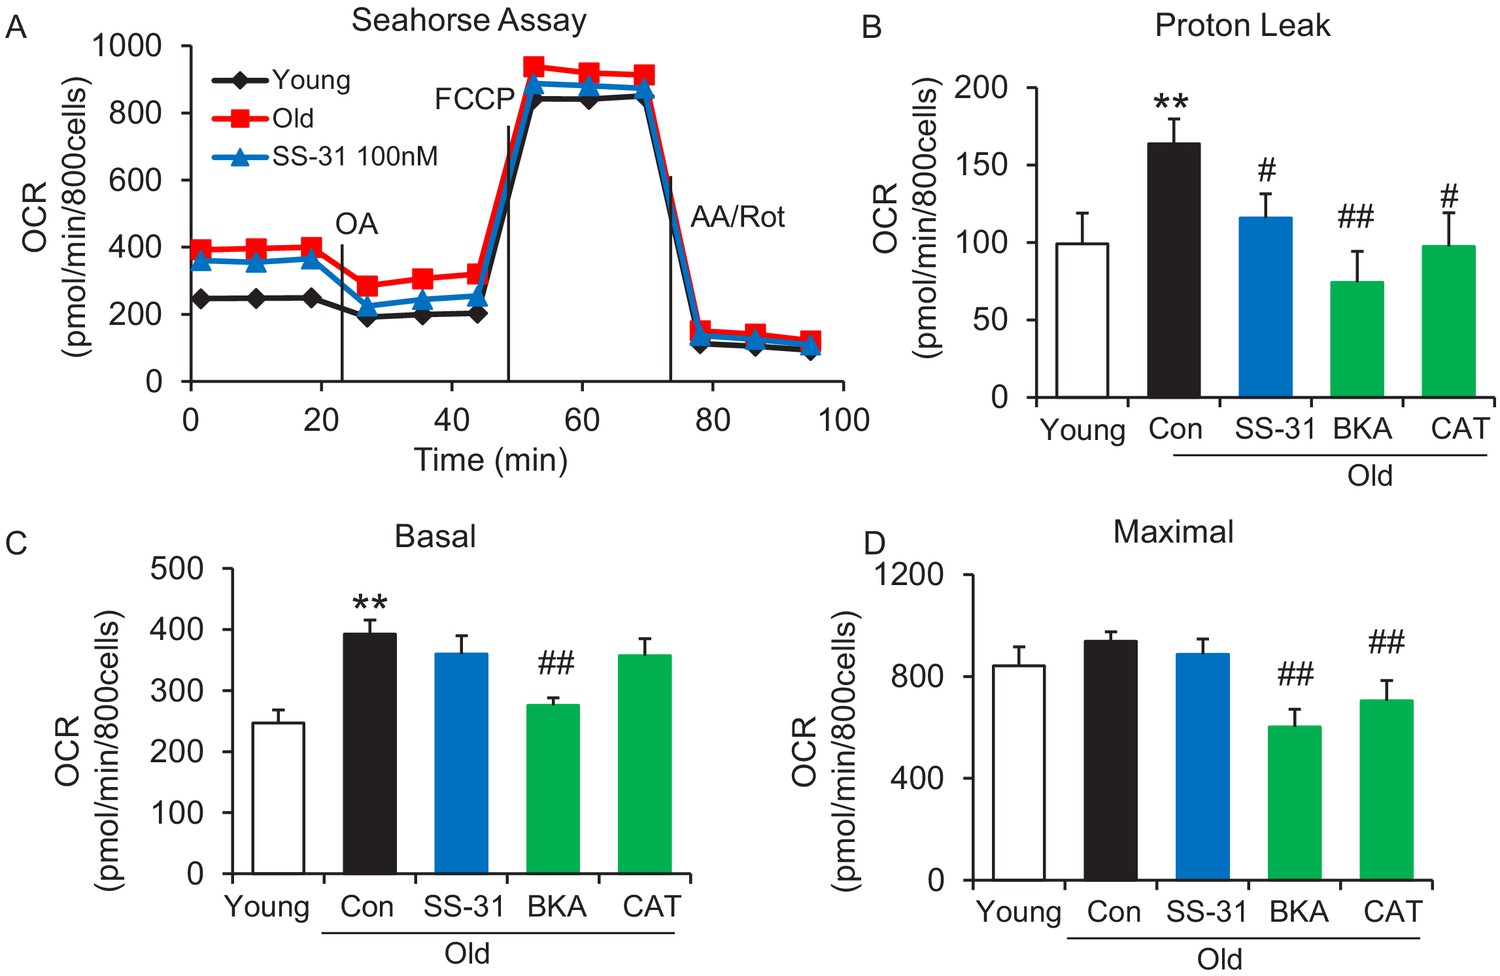
SS-31 alleviates the excessive mitochondrial proton leak of cardiomyocytes from 24 mo old mice.
(A) Representative Seahorse assay traces of cardiomyocytes isolated from untreated young and old mice, then exposed or not to 100 nM SS-31 for 2 hr in vitro. Aging-increased basal respiration (C), which was attributable to the augmentation of proton leak (B), but did not affect maximal respiration (D). ANT1 inhibitors Bongkrekic acid (BKA, 10 μM) and carboxyatractyloside (CAT, 20 μM) 2 hr treatment decreased the proton leak (B) and basal respiration (C) but also decreased maximal respiration (D) in old cardiomyocytes. N = 5–14 mice in each group; one-way ANOVA followed by Fisher’s LSD test. *p<0.05, **p<0.01 vs young; #p<0.05, ##p<0.01 vs old controls.
Figure 1—figure supplement 1
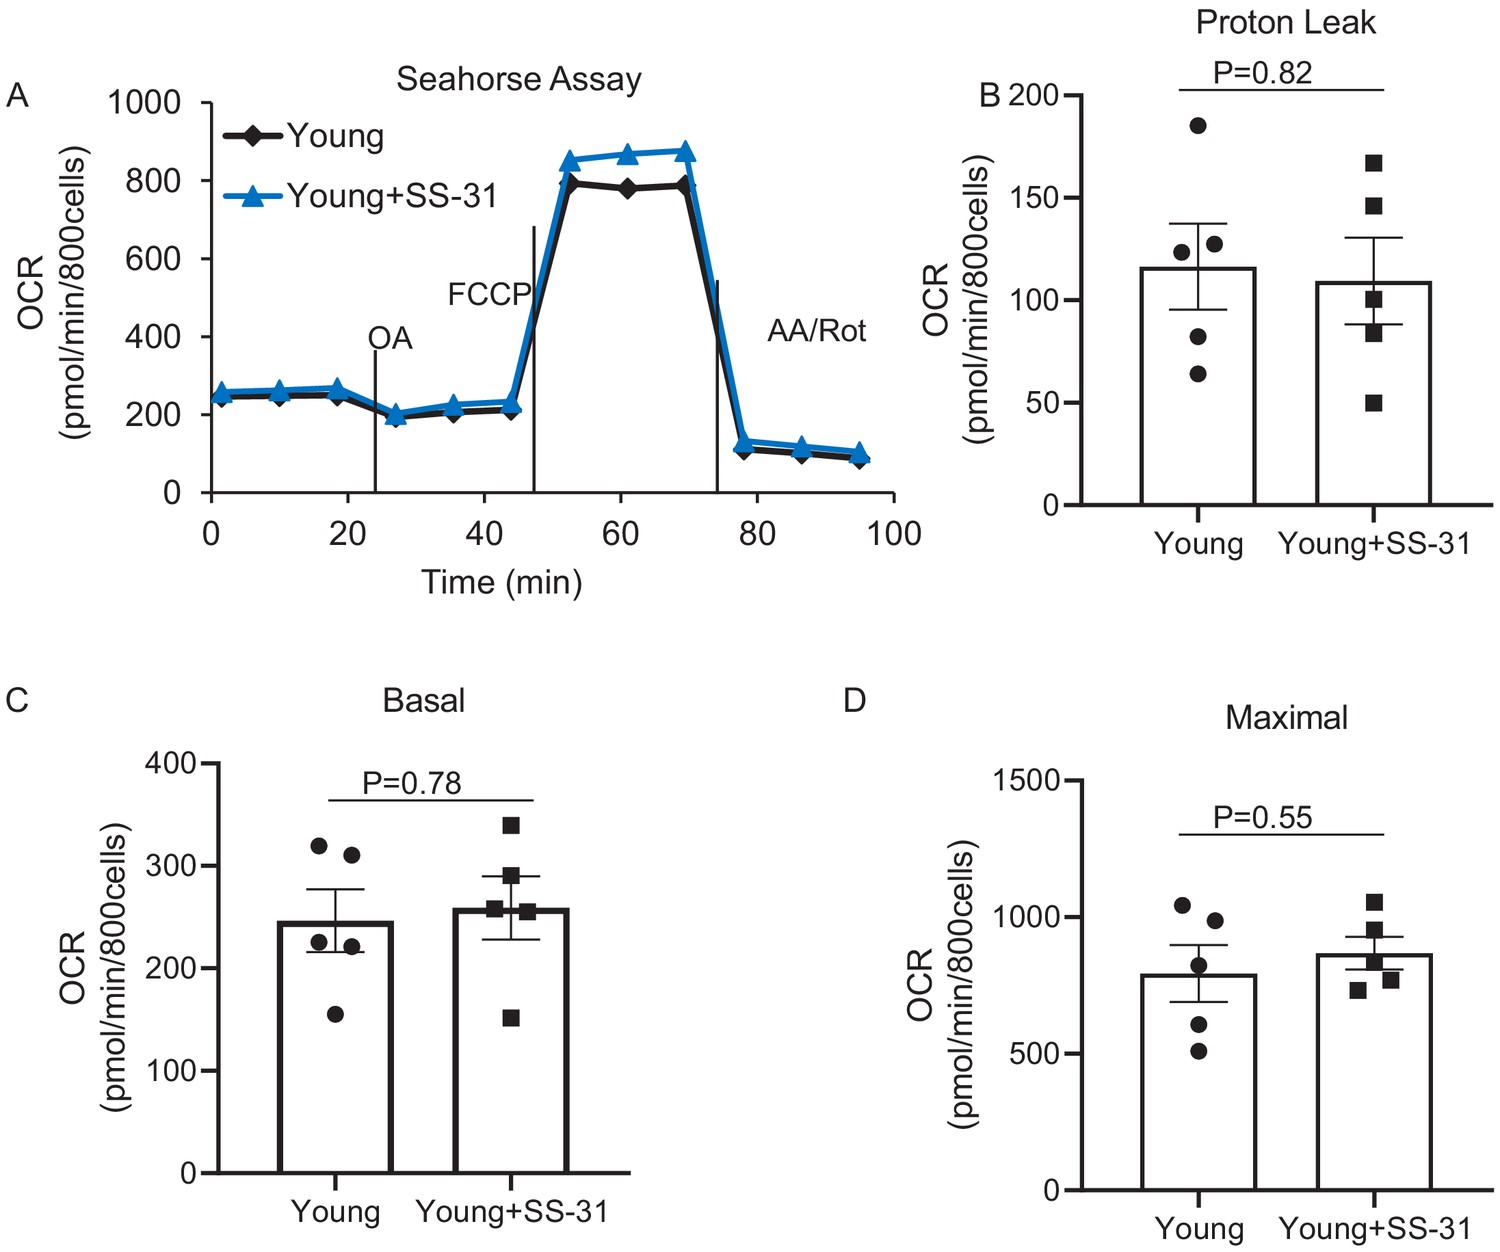
SS-31 has a minor effect on mitochondrial respiration in the young cardiomyocytes.
None of the differences are significant. N = 5 mice in each group. Student’s t-test was applied to determine the statistical significance.
Figure 1—figure supplement 2
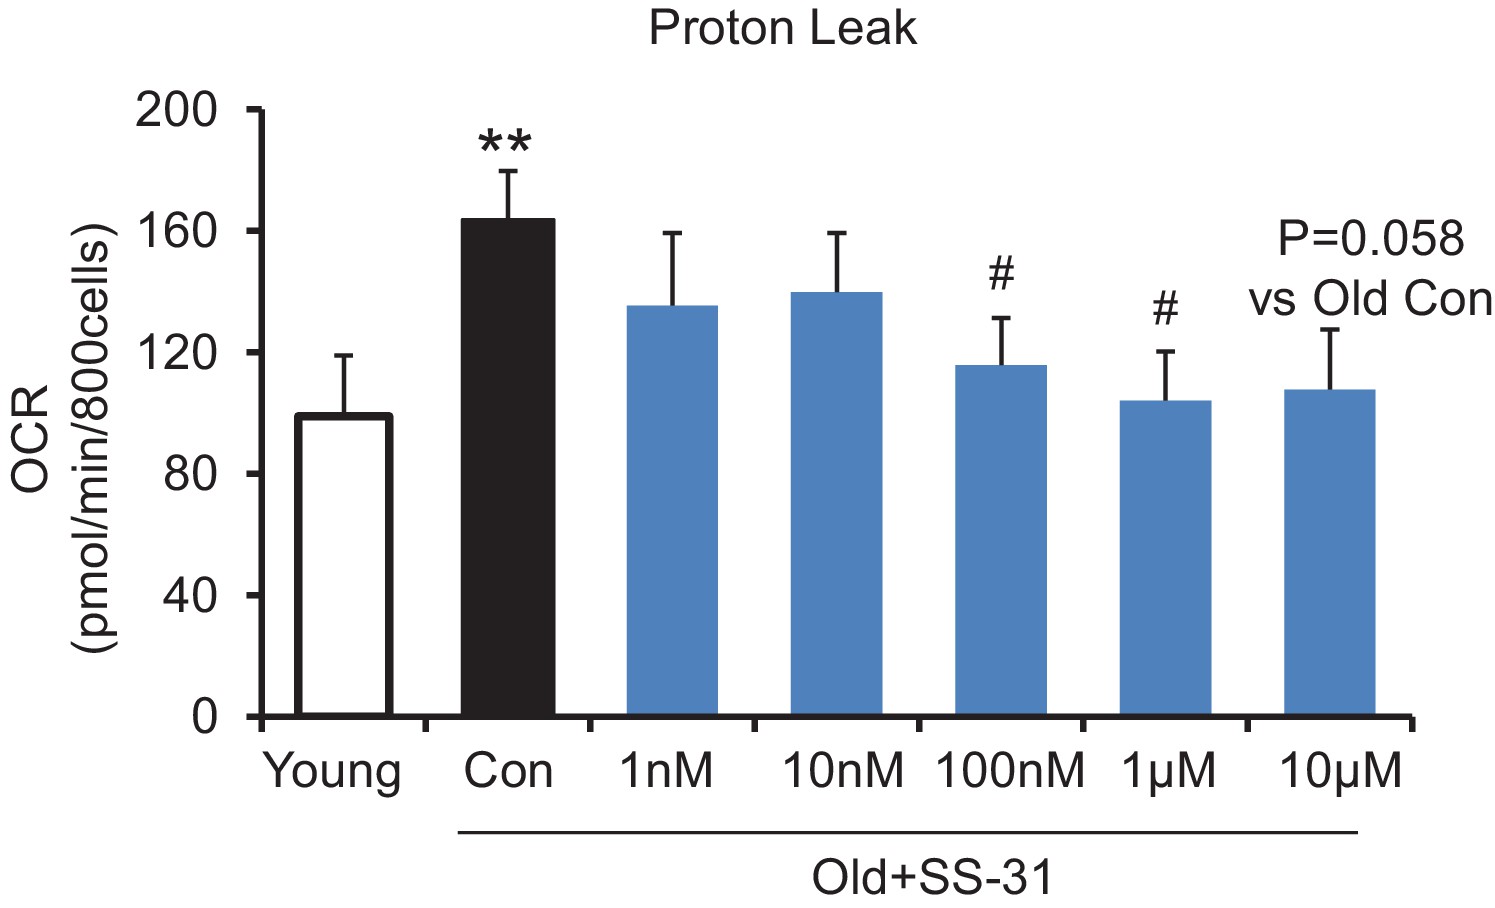
SS-31 reaches its inhibitory effect on proton leak suppression at low concentrations.
SS-31 decreased the mitochondrial proton leak. N = 6–14 mice in each group. **p<0.01 vs young, #p<0.05 vs old controls. One-way ANOVA with Fisher’s LSD test was applied.
Figure 2 with 3 supplements
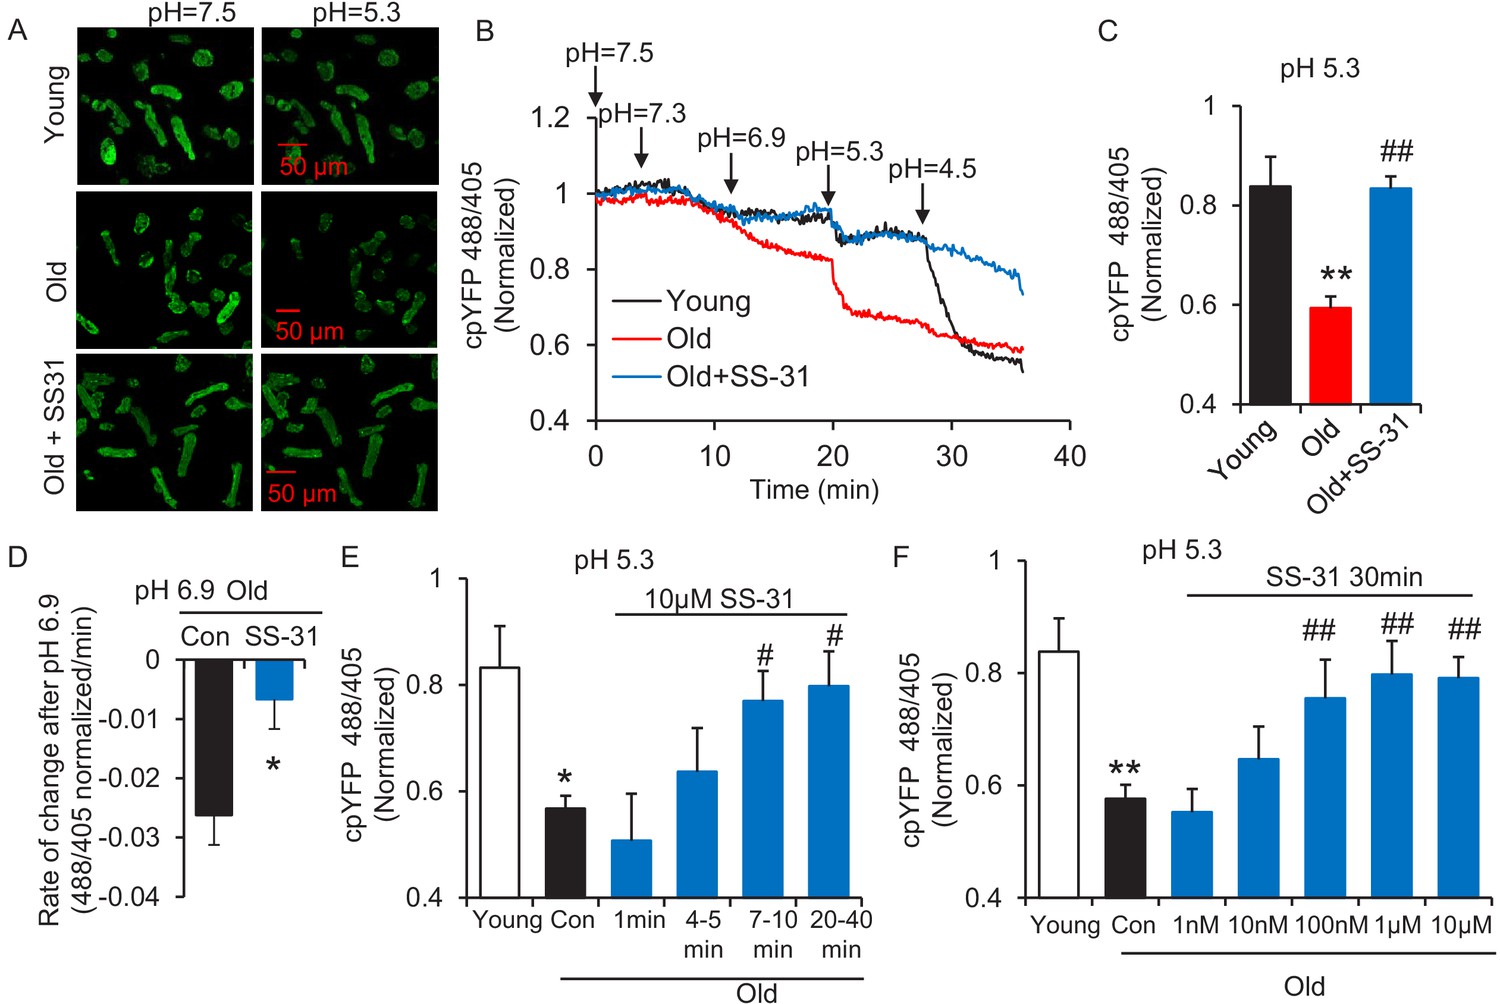
SS-31 restores the resistance of cardiomyocytes from old rat to proton entry into the mitochondrial matrix during external pH gradient stress.
(A) Typical image of the effects of pH gradient stress on permeabilized rat cardiomyocyte mt-cpYFP fluorescence. Upper panel, young, middle panel, old, lower panel, old+SS-31 (10 μM, 3 days) visualized after exposure of the cells to pH 7.5 and, later, to pH 5.3. The excitation is 488 nm and collection is at 505–730 nm. (B) Saponin (50 μg/ml) permeabilized cardiomyocytes expressing mt-cpYFP were exposed to progressively lower external pH. Proton permeability of old mitochondria was greater than that of young mitochondria, but preincubation of old cells with 10 μM SS-31 for 3 days enhanced the mitochondrial inner membrane resistance to the pH stress. The traces were averaged from 4 to 19 experiments. The arrows indicate the changes of pH. (C) Quantitation of the SS-31 treatment effect on the mitochondrial matrix cpYFP ratio at pH 5.3. The data are from 7 to 8 min after the pH was adjusted to 5.3. The mean value of the normalized 488/405 ratio in old group is 0.59 with a SD ±0.10 and the range is from 0.46 to 0.77. N = 5–19 rats in each group, analyzed by one-way ANOVA with Dunnett’s test. (D) SS-31 decreased the rate of cpYFP 488/405 ratio drop at pH 6.9. N = 4–10 rats in each group. The rate is calculated as indicated in Figure 2—figure supplement 3. Student’s t-test was applied to determine the statistical significance. The time dependence (N = 3–4 rats in each group) (E) and dose dependence (N = 3–14 rats in each group) (F) of SS-31 protection of mitochondrial resistance to pH gradient stress are shown and analyzed by one-way ANOVA with Fisher’s LSD test. After cardiomyocyte permeabilization, 10 μM SS-31 was added for the times shown in (E) or at the doses shown in (F) for 30 min, followed by pH stress. *p<0.05, **p<0.01 vs Young; #p<0.05, ##p<0.01 vs Old.
Figure 2—figure supplement 1
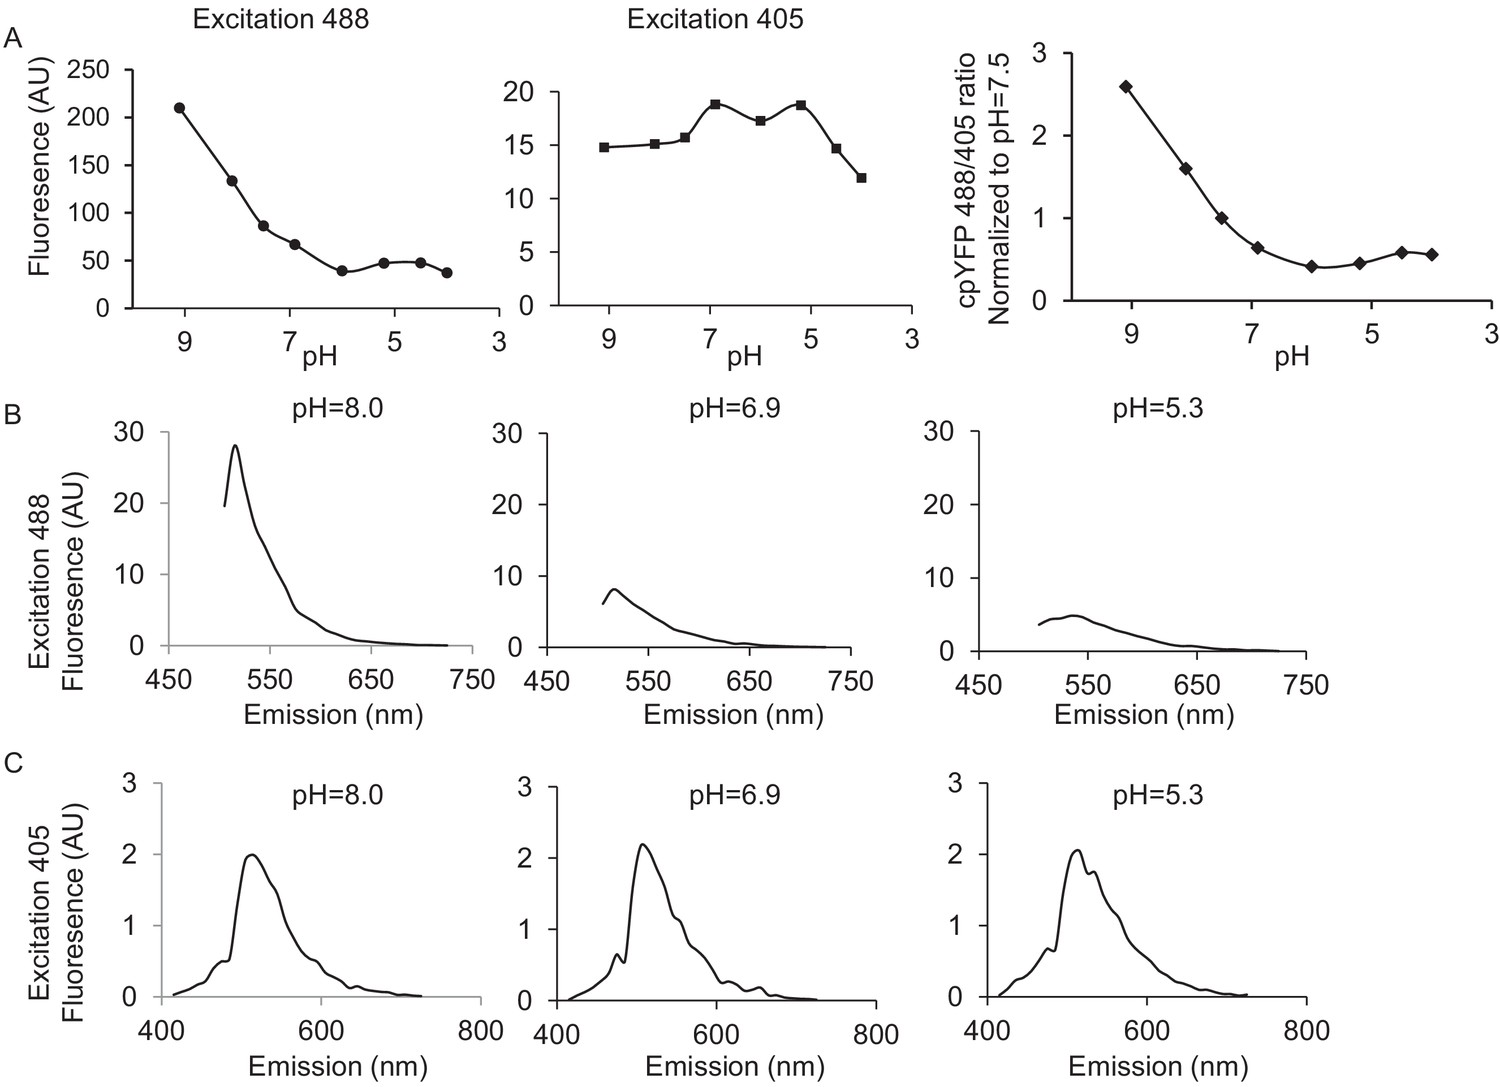
pH calibration of mt-cpYFP in adult cardiac myocytes with Nigericin.
10 μM Nigericin was added to the mitochondrial permeabilization buffer. (A) shows the pH calibration of 488 nm and 405 nm, the ratio of 488/405 (normalized to that of the value at pH = 7.5) as the pH is gradually lowered. The ratio of 488/405 reaches the lowest point at pH 6.0, followed by a small increase starting at pH 5.5, consistent with the known pH response of this dye (Wei-LaPierre et al., 2013). (B) shows the emission spectra of mt-cpYFP pH 8.0, 6.9, and 5.3 when excited at 488 nm (C) shows the emission spectra of mt-cpYFP pH 8.0, 6.9, and 5.3 when excited at 405 nm. The 488 nm excitation is sensitive to the pH change but the 405 nm excitation is much less pH dependent.
Figure 2—figure supplement 2
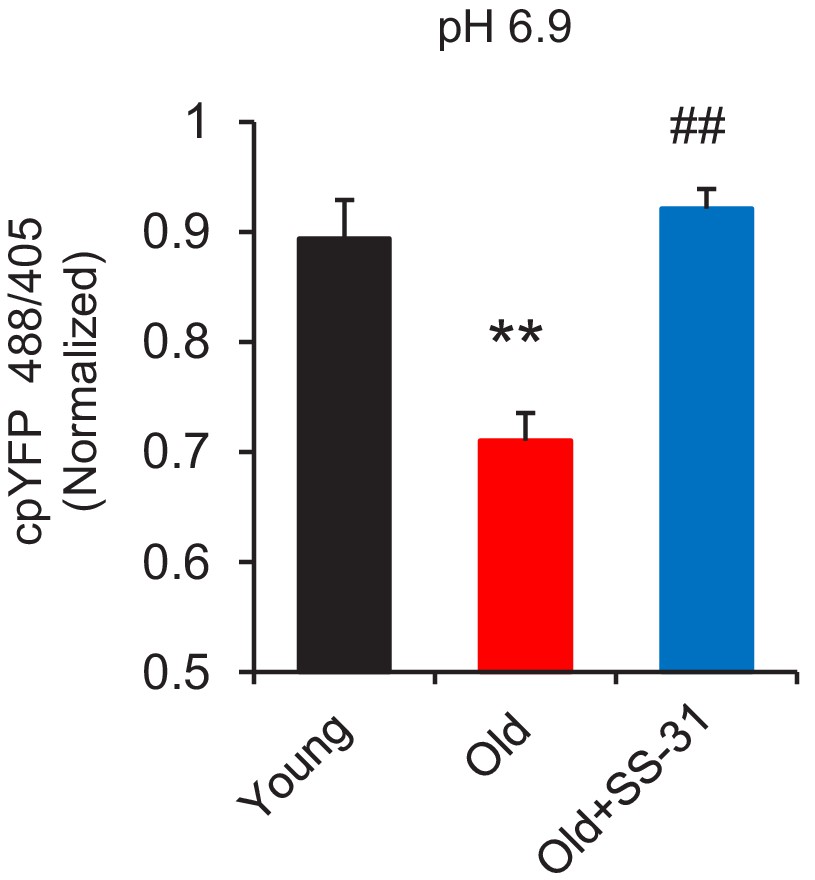
SS31 restores the resistance to external pH gradient stress in the old cardiomyocytes at pH 6.9.
N = 5–18 in each group. One-way ANOVA with Dunnett’s test was applied. **p<0.01 vs young, #p<0.05 vs old controls.
Figure 2—figure supplement 3
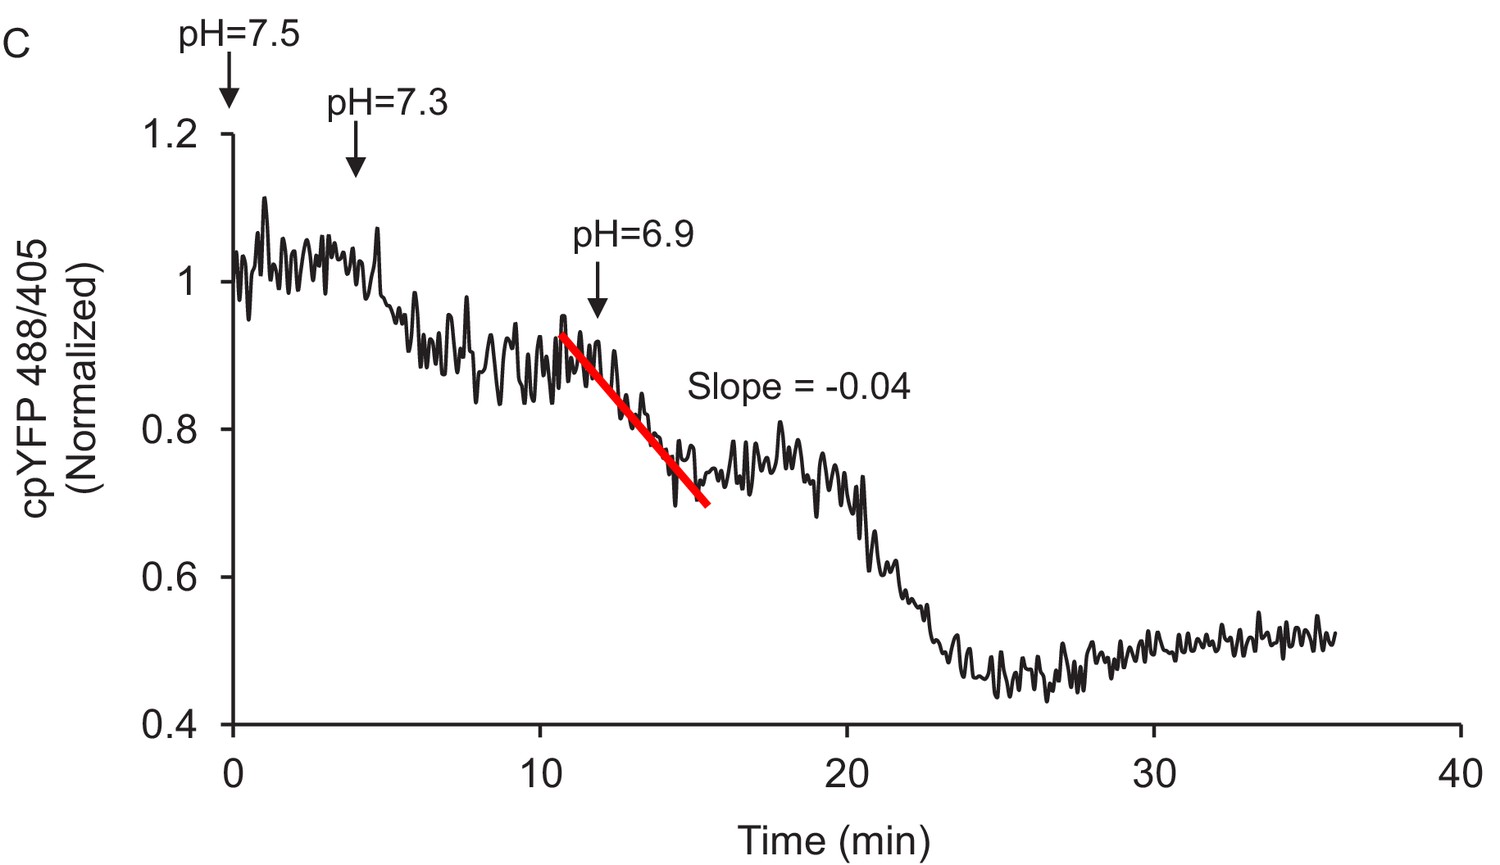
Method of quantitation of the slope of mt-cpYFP fluorescence ratio change after permeabilized cells are exposed to external pH 6.9.
The trace is from old rat cardiomyocytes.
Figure 3 with 2 supplements
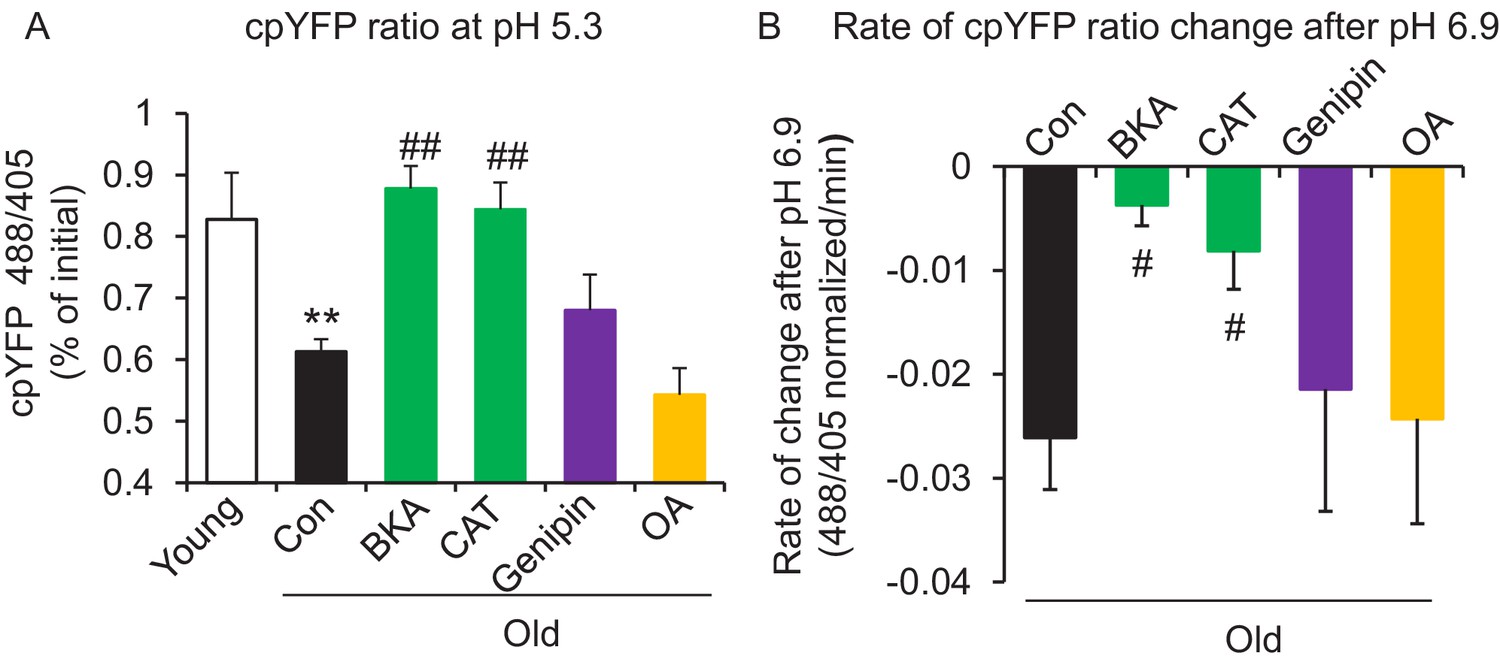
ANT1 inhibitors restore resistance to proton leak of mitochondria in old rat cardiomyocytes.
ANT1 inhibitors 10 μM Bongkrekic Acid (BKA) and 20 μM carboxyatractyloside (CAT), but not 50 μM Genipin (UCP2 inhibitor) or 1 μM oligomycin A (OA, ATPase inhibitor), protected the mitochondrial matrix from decreased pH after exposure to external pH 5.3 (N = 4–19 rats in each group) (A) and reduced the rate of 488/405 decline after exposure to pH 6.9 (N = 4–10 rats in each group) (B). BKA, CAT, Genipin, or OA were added immediately after the mitochondria permeabilization. One-way ANOVA with Fisher’s LSD test was applied. *p<0.05, **p<0.01 vs Young, #p<0.05, ##p<0.01 vs Old.
Figure 3—figure supplement 1

Aging effect on ANT1 and UCP2 cardiac protein abundance.
Aging slightly, but significantly decreases ANT1 levels in the mouse heart. Western blot of ANT1 (A, C) and UCP2 (B, D). N = 6 mice in each group. Student’s t-test was applied to determine the statistical significance. *p<0.05 vs young. The total protein loading control was stained with MemCode Reversible Protein Stain Kit for Polyvinylidene difluoride Membranes (Pierce, Rockford, IL). The identity of the band as UCP2 in B was confirmed using a recombinant UCP2 protein standard (Origene, CAT#: TP761109), as shown in E.
Figure 3—figure supplement 2

Mitochondrial proton entry in buffer without phosphate.
Mitochondrial pH stress on permeabilized rat cardiomyocytes in a buffer that did not contain phosphate.
Figure 4 with 1 supplement
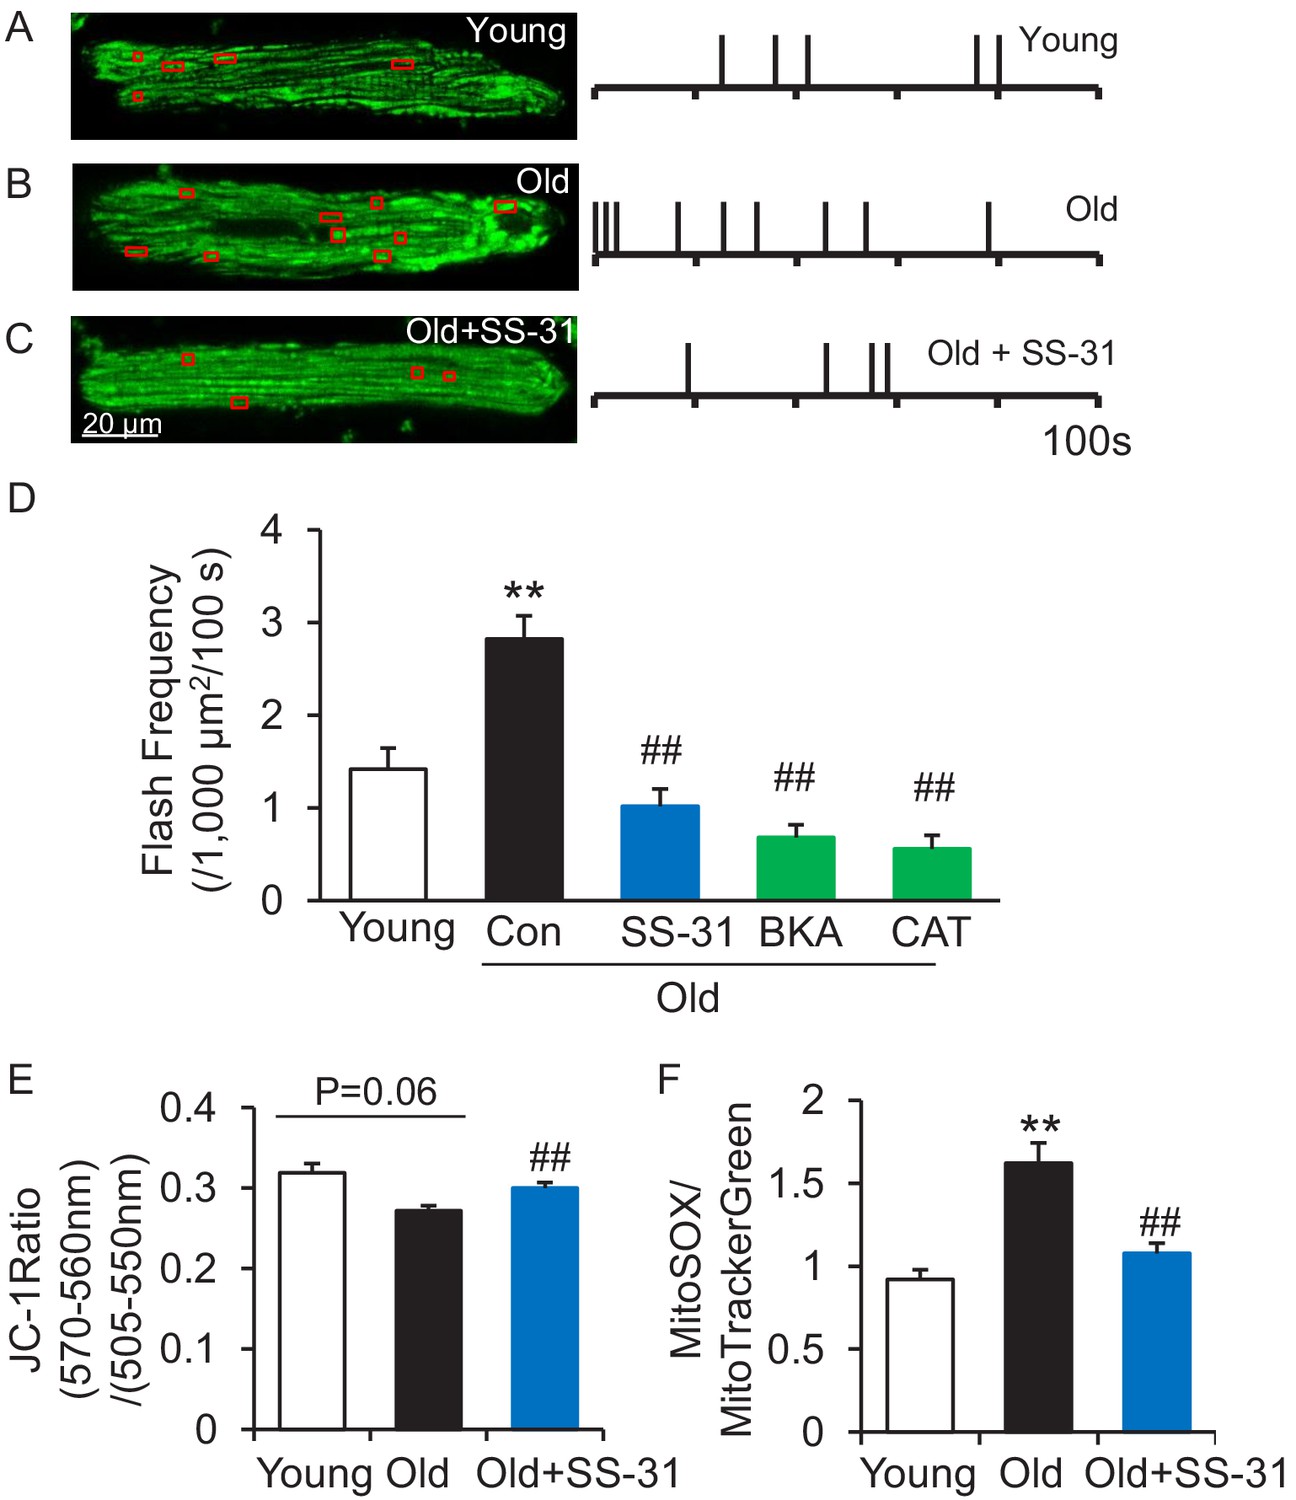
SS-31 attenuates excessive mitoflash activity in aged rat cardiomyocytes.
(A–C) Mitoflash events within the regions shown in the red boxes took place at the times shown by vertical bars during the 100 s scanning time in the representative cardiomyocytes from young (A), old (B) and old+SS-31 (C) rat hearts. (D) The rate of mitoflash activity was increased in old rat cardiomyocytes compared to young, but 1 hr SS-31, Bongkrekic Acid (BKA) (10 μM) and Carboxyatractyloside (CAT) (20 μM) treatments decreased the mitoflash frequency in old cells to or below that of young cells. N = 26–87 cells from 3 to 14 rats. **p<0.05 vs young. ##p<0.05 vs old. (E) JC-1 red to green fluorescence ratio, indicative of mitochondrial membrane potential, in cells from young and old mice and old mouse cardiomyocytes treated with SS-31 (10 μM for 12 hr). N = 84–218 cells from 3 to 4 mice. p=0.06 vs young. ##p<0.01 vs old. (F) Mitochondrial ROS production in mouse cardiomyocytes measured by the fluorescence ratio of MitoSOX (5 μM, excitation 540 nm, emission >560 nm) to Mitotracker green (200 nM, excitation 488 nm, emission 505–530 nm). One-way ANOVA with Dunnett’s test was applied. N = 40–84 cells from 3 to 5 mice. **p<0.05 vs young. ##p<0.05 vs old.
Figure 4—figure supplement 1
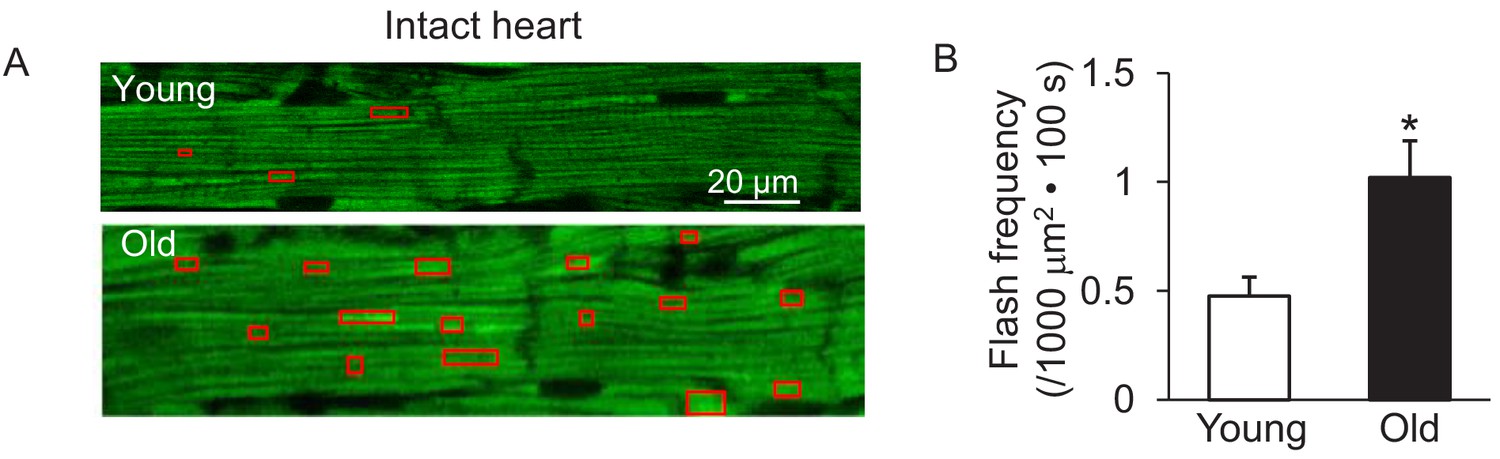
Increased mitochondrial flash activity in the intact perfused mouse aged heart.
(A) Typical images from the young (upper panel) and old (lower panel) mouse hearts. (B) Statistical analysis of mitoflash frequency in the analyzed regions indicated by the red boxes in panel A. Young: N = 18 regions from three mice. Old: N = 16 regions from four mice. Student’s t-test was applied to determine the statistical significance. *p<0.05 vs Young.
Figure 5
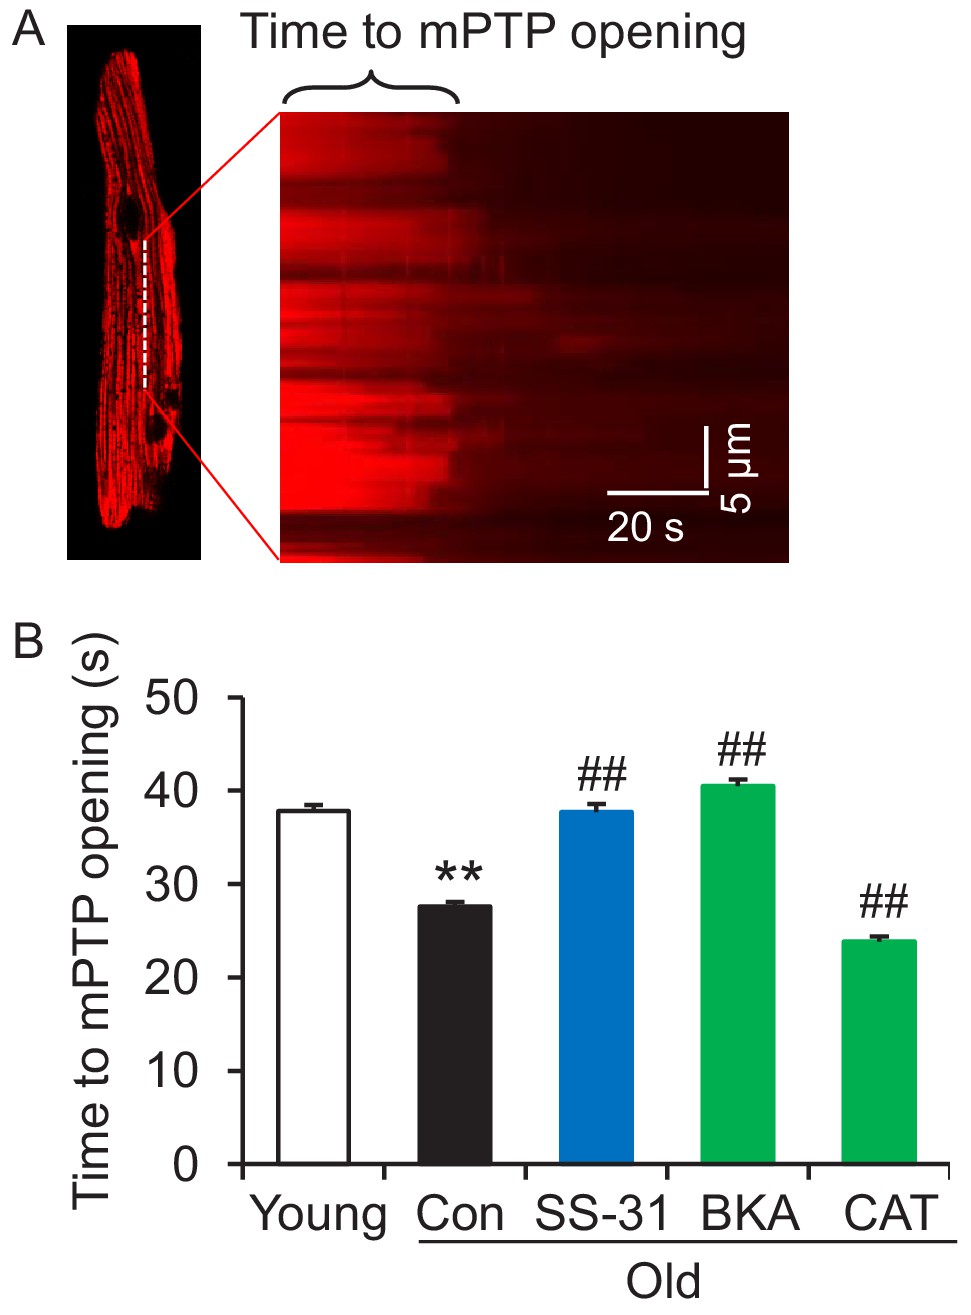
SS-31 reverses the increased speed of mitochondrial permeability transition pore (mPTP) opening in aged mouse cardiomyocytes.
(A) A typical image shows 1 Hz line-scanning photo-excitation induced mPTP opening in a cardiomyocyte loaded with the mitochondrial membrane potential (Δψm) dye Tetramethylrhodamine methyl ester (TMRM). The sudden decline of TMRM fluorescence with time (rightward) indicates mPTP opening and Δψm loss. (B) 1 hr SS-31 and Bongkrekic Acid (BKA), but not carboxyatractyloside (CAT) treatments protect the photo-excitation induced mPTP opening. Quantification of time to mPTP opening from 418 to 658 mitochondria from 19 to 32 cells isolated from 3 to 4 mice in each group. One-way ANOVA with Dunnett’s test was applied. **p<0.01 vs young, ##p<0.01 vs old.
Figure 6 with 1 supplement
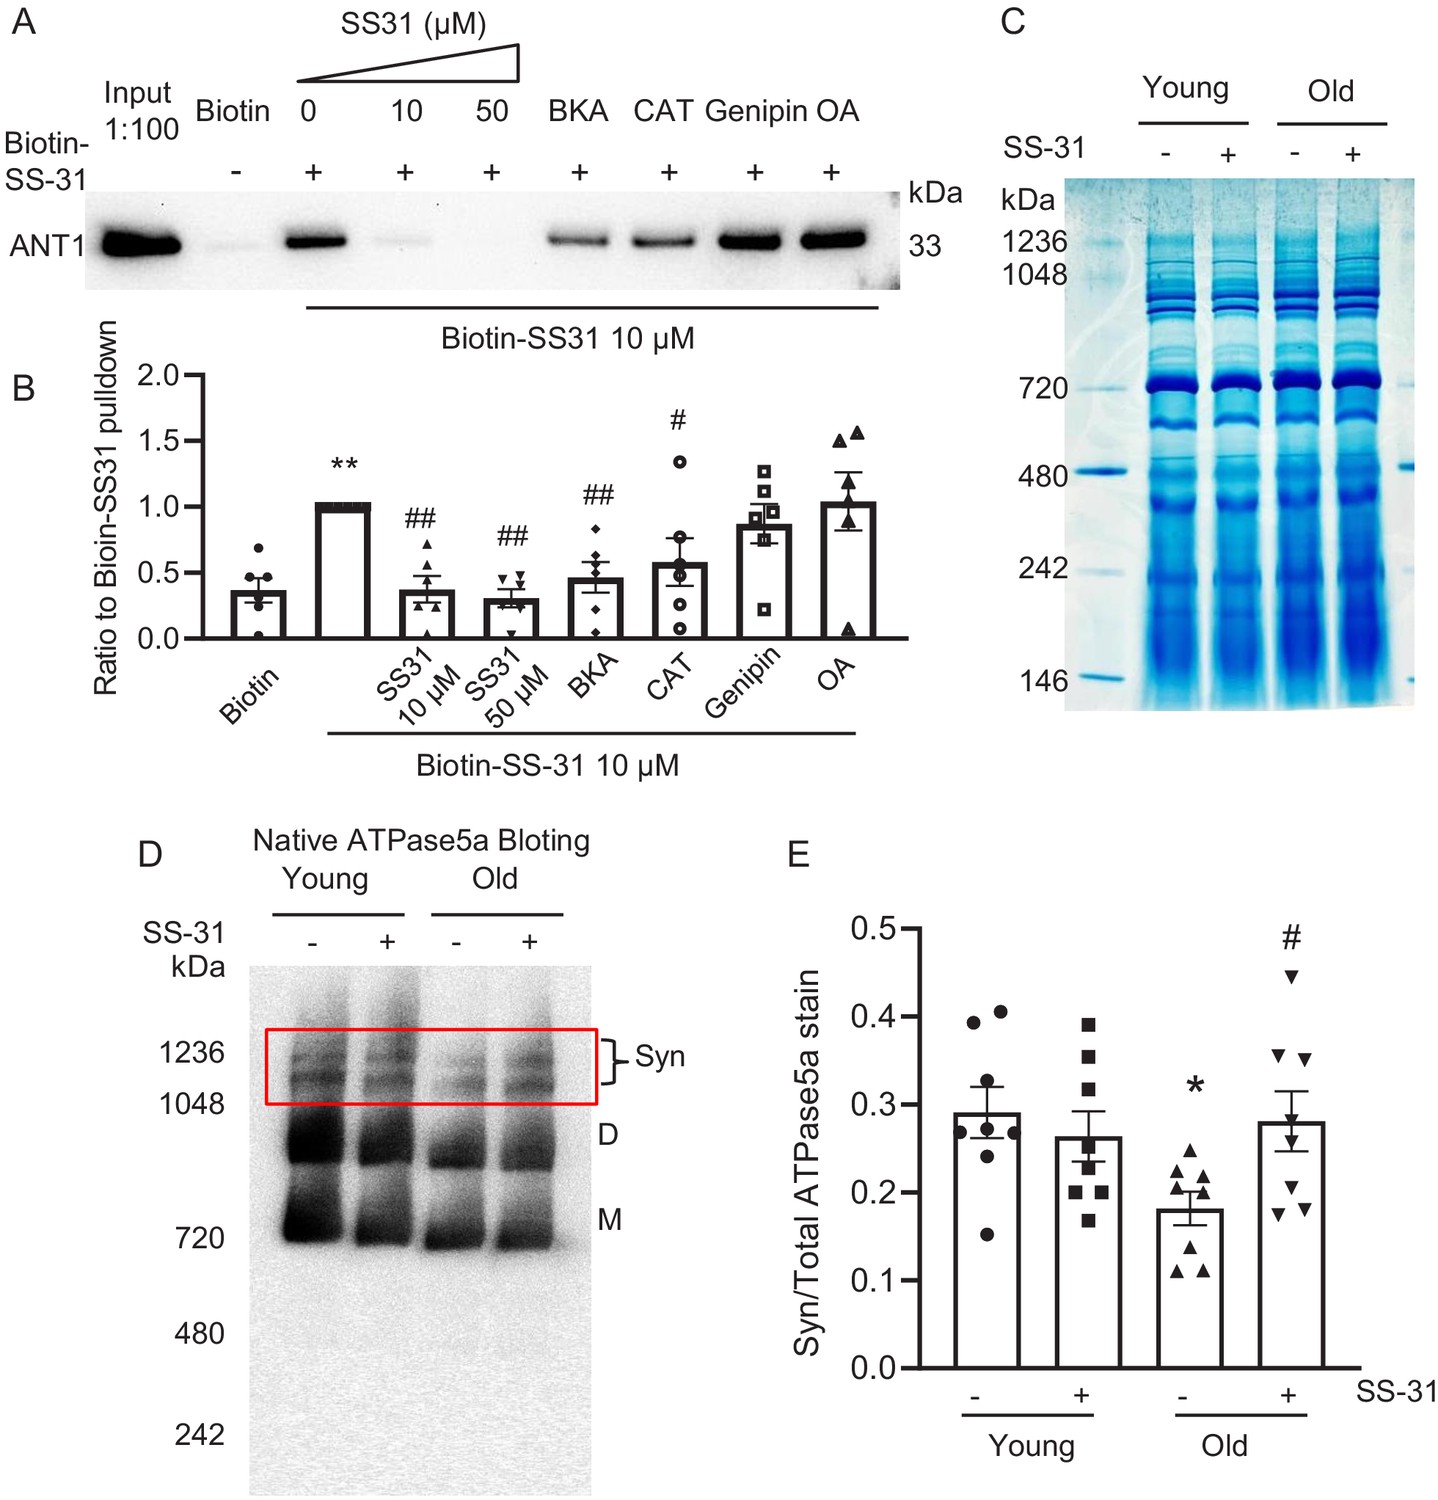
SS-31 interacts with ANT1 and stabilizes the ATP synthasome in the old mouse heart mitochondria.
(A, B) Biotin-SS-31 pulldown shows the association of biotin-SS-31 to ANT1. Free SS-31 competes with this interaction, while Bongkrekic Acid (BKA) and carboxyatractyloside (CAT) inhibit the interaction of biotin-SS-31 with ANT1. Panel A shows a representative Western blot. N = 6 mice in each group. One-way ANOVA with Fisher’s LSD test was applied. **p<0.01 vs Biotin control, #p<0.05, ##p<0.01 vs Biotin-SS31 pulldown. (C) Coomassie blue staining of isolated mitochondria in a native gel. (D) Left panel is the total protein loading control for the Native gel blot. (D, E) Native gel blotting shows that 10 μM SS-31 stabilizes the mitochondrial synthasome (Syn) in isolated mitochondria. The Syn is highlighted in the red box. The Syn and ATPase Dimer (D) and Monomer (M) were labeled using anti-ATP5A. N = 8 mice in each group. One-way ANOVA with Fisher’s LSD test was applied. *p<0.05 vs young, #p<0.05 vs old.
Figure 6—figure supplement 1
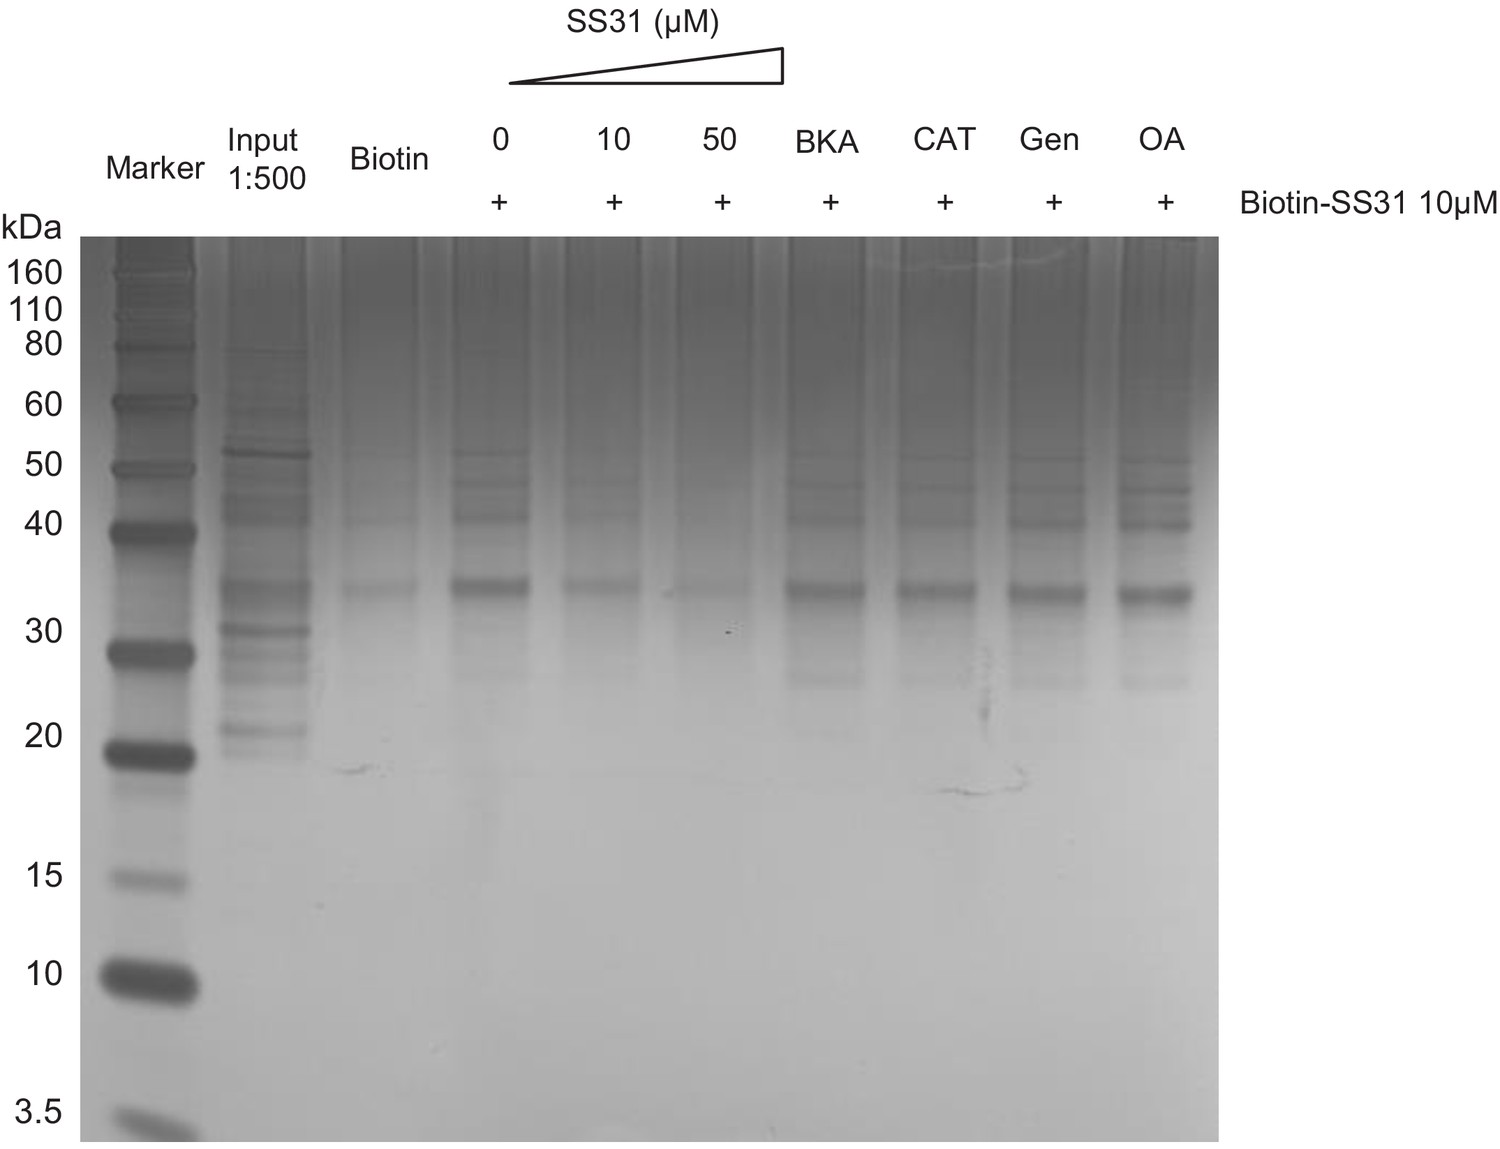
Silver staining of the Biotin-SS-31 pulldown of Figure 6A from the old mouse heart mitochondria.
The great majority of bands present in the input are not present in the biotin-SS-31 pulldown; those that are show suppression by SS-31 competition.
Figure 7

Schematic of the mechanism of SS-31 protection of proton leak and rejuvenation of mitochondrial function.
Due to increased mitochondrial proton leak, the mitochondria work harder to maintain ATP production, and thus the work load is increased in the aged heart.
Tables
Key resources table
| Reagent type (species) or resource | Designation | Source or reference | Identifiers | Additional information |
|---|---|---|---|---|
| Strain, strain background (M. musculus; male and female) | C57BL/6J | National Institute of Aging Charles River colony | RRID:IMSR_JAX:000664 | See Materials and method |
| Strain, strain background (Rattus norvegicus) | F344 | National Institute of Aging F344 rats | See Materials and method | |
| Genetic reagent (M. musculus) | mt-cpYFP | Wang lab, PMID:25252178 | See Materials and method | |
| Transfected construct (Adenovirus) | mt-cpYFP | Wang lab, PMID:25252178 | Adenovirus to transfect and express mt-cpYFP | |
| Antibody | anti- ANT1 | Abcam | Cat# ab102032 | 1:3000 |
| Antibody | anti-UCP2 | Cell signaling technology | Cat# 89326S | 1:2000 |
| Antibody | anti-ATP5a | Abcam | Cat# ab14748 | 1:3000 |
| Peptide, recombinant protein | SS-31 peptide (Elamipretide) | Stealth BioTherapeutics | ||
| Commercial assay or kit | Seahorse XF Cell Mito Stress Test Kit | Aligent/Seahorse Bioscience | 103015–100 | |
| Commercial assay or kit | MitoSOX Red | ThermoFisher | M36008 | |
| Chemical compound, drug | Bongkrekic acid | Cayman Chemical | 19079 | |
| Chemical compound, drug | Carboxyatractyloside | Cayman Chemical | 21120 | |
| Chemical compound, drug | Genipin | Sigma | G4796 | |
| Chemical compound, drug | Oligomycin A | Sigma | 75351 | |
| Chemical compound, drug | carbonyl cyanide-p-trifluoromethoxyphenylhydrazone | Sigma | C2920 | |
| Chemical compound, drug | Antimycin A | Sigma | A8674 | |
| Chemical compound, drug | Rotenone | Sigma | R8875 | |
| Commercial assay or kit | MitoTracker Green | ThermoFisher | M7514 | |
| Commercial assay or kit | JC-1 Dye | ThermoFisher | T3168 | |
| Commercial assay or kit | Biotin | ThermoFisher | B20656 | |
| Commercial assay or kit | Streptavidin Agarose beads | ThermoFisher | 20349 | |
| Commercial assay or kit | Pierce Reversible Protein Stain Kit for PVDF Membranes | Thermo Scientific | 24585 | |
| Commercial assay or kit | BCA protein assay | Thermo Scientific | 23225 | |
| Commercial assay or kit | SuperSignal West Pico PLUS Chemiluminescent Substrate | Thermo Scientific | 34580 | |
| Software, algorithm | Graphpad Prism | Graphpad | RRID:SCR_002798 | |
| Software, algorithm | AlphaView Software | ProteinSimple |
Additional files
Download links
A two-part list of links to download the article, or parts of the article, in various formats.
Downloads (link to download the article as PDF)
Open citations (links to open the citations from this article in various online reference manager services)
Cite this article (links to download the citations from this article in formats compatible with various reference manager tools)
Reduction of elevated proton leak rejuvenates mitochondria in the aged cardiomyocyte
eLife 9:e60827.
https://doi.org/10.7554/eLife.60827


