Anti-fibrotic activity of a rho-kinase inhibitor restores outflow function and intraocular pressure homeostasis
- Department of Ophthalmology, Duke University, United States
- Department of Biomedical Engineering, Georgia Institute of Technology/Emory University, United States
- Department of Mechanical Engineering, Georgia Institute of Technology, United States
- Aerie Pharmaceuticals, Inc, United States
- Department of Biomedical Engineering, Duke University, United States
- Washington State University Floyd Elson School of Medicine, United States
Figures
Figure 1 with 1 supplement
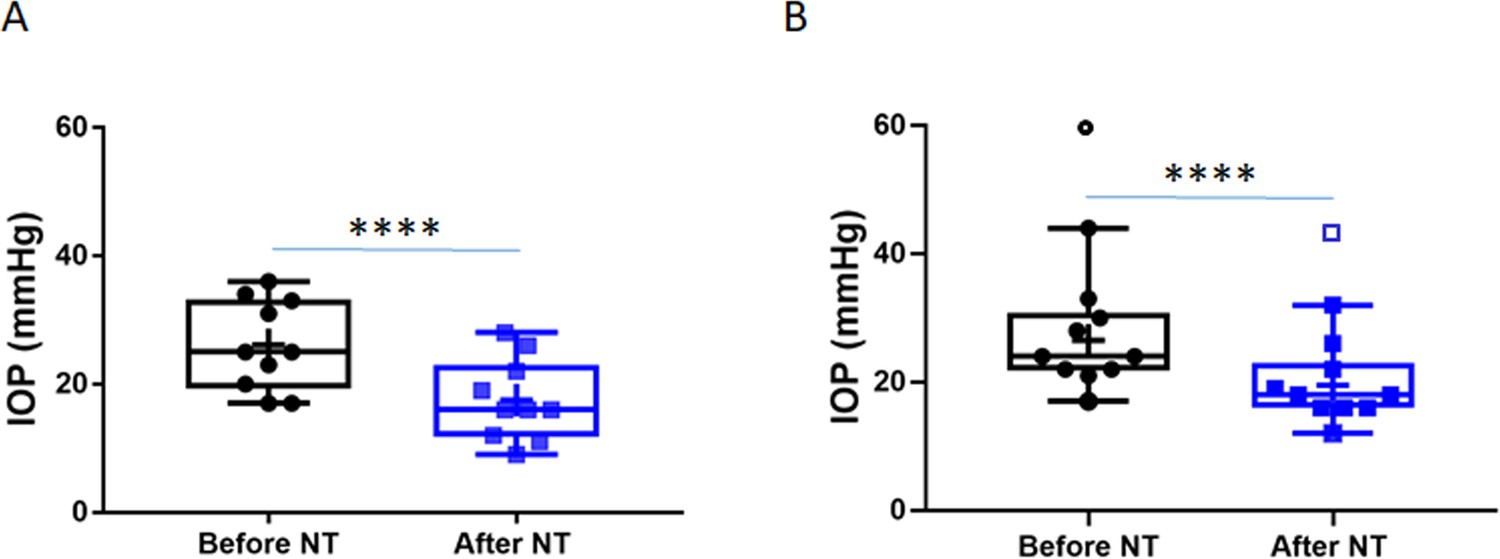
Netarsudil (NT) efficaciously lowered intraocular pressure (IOP) in patients with steroid-induced elevated IOP poorly controlled with standard glaucoma medications.
IOPs were measured by Goldmann applanation tonometry in patients who demonstrated ocular hypertension (OHT) after steroid treatment for a variety of ocular conditions (Table 1). These individuals were initially treated with aqueous humor suppressants and/or prostaglandin analogues but showed persistent OHT, and were thus treated with NT. (A) Shows IOPs of patient cohort 1 (n = 21 eyes of 19 patients) and (B) Shows IOPs of patient cohort 2 (n = 11 eyes of 8 patients). ‘Before NT’ indicates IOPs measured before initiating NT in these patients, and ‘after NT’ shows IOP after daily treatment with NT for 1 month or less. The central line in box and whisker represents the median, the top and bottom edges are 25th and 75th percentiles, respectively, the whiskers extend to the most extreme data points, and ‘+’ indicates the mean. Empty symbols were statistically determined to be outliers of data sets. ****p<0.0001.
Figure 1—figure supplement 1
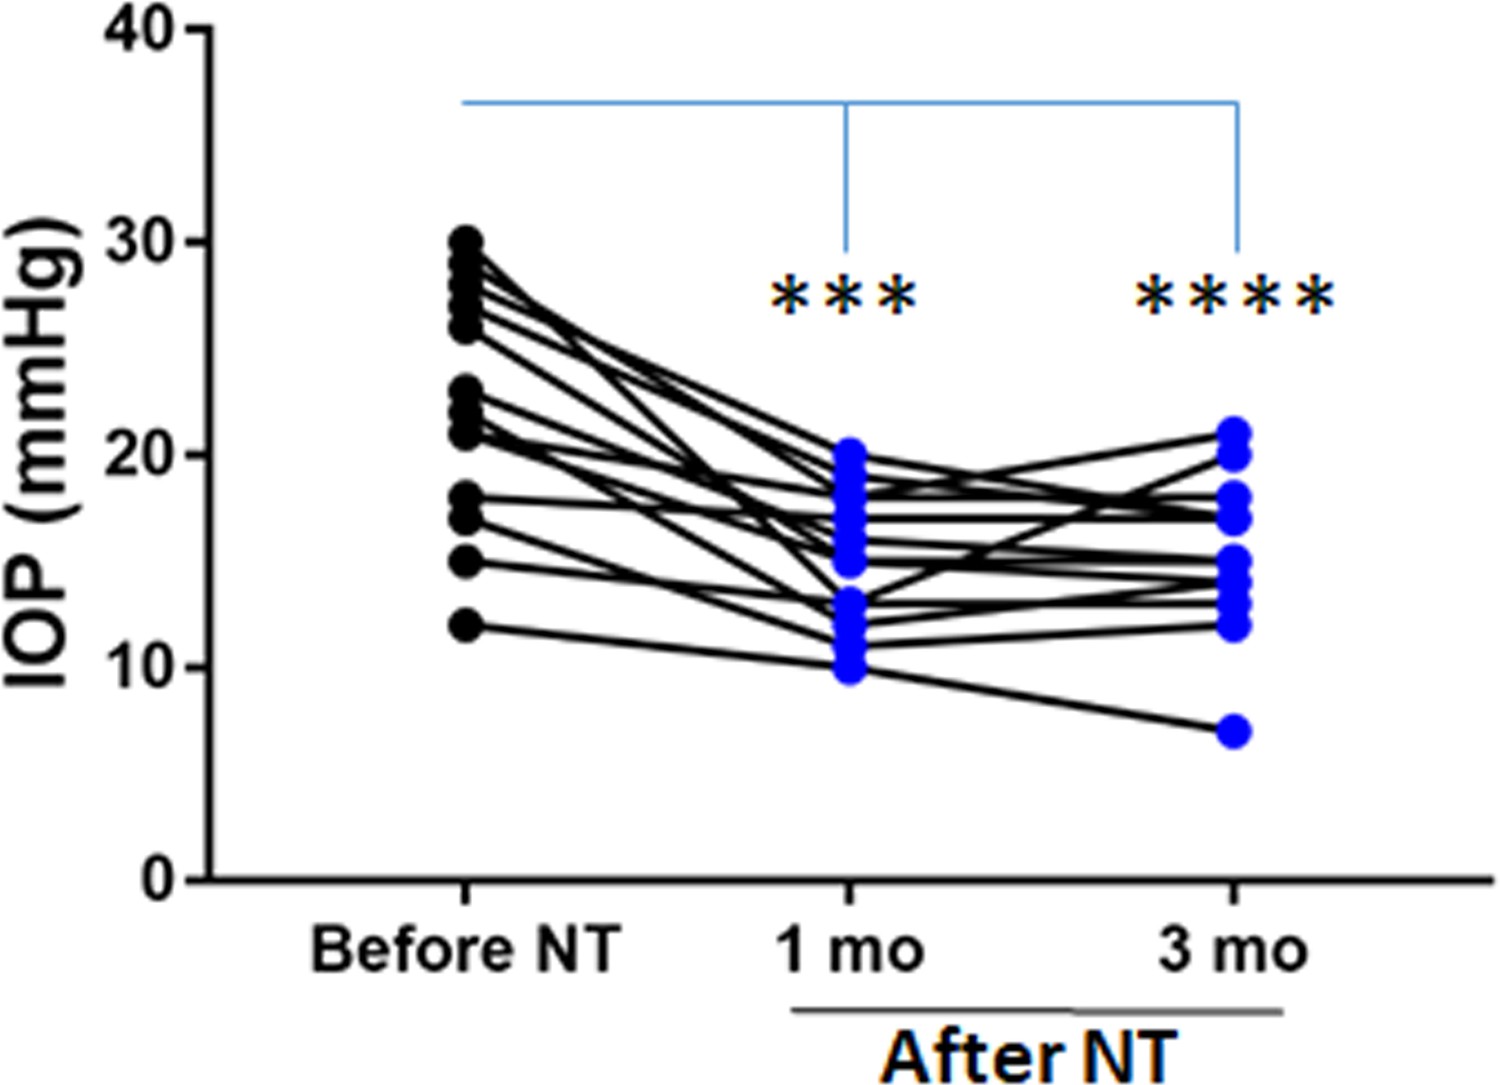
Time course of netarsudil (NT) effects on intraocular pressure (IOP) in patients with steroid-induced elevated IOP poorly controlled with standard glaucoma medications.
IOPs were measured by Goldmann applanation tonometry in patients who demonstrated ocular hypertension (OHT) after steroid treatment for a variety of ocular conditions (Table 1). These individuals were initially treated with aqueous humor suppressants and/or prostaglandin analogues but showed persistent OHT, and were thus treated with NT. We show IOPs of the subset of individual patients in cohort 1 that were monitored over 3 months of treatment. ‘Before NT’ indicates IOPs measured before initiating NT in these patients, and ‘after NT’ shows IOP after daily treatment with NT. Source data for patient IOPs in Table 1.
Figure 2 with 1 supplement
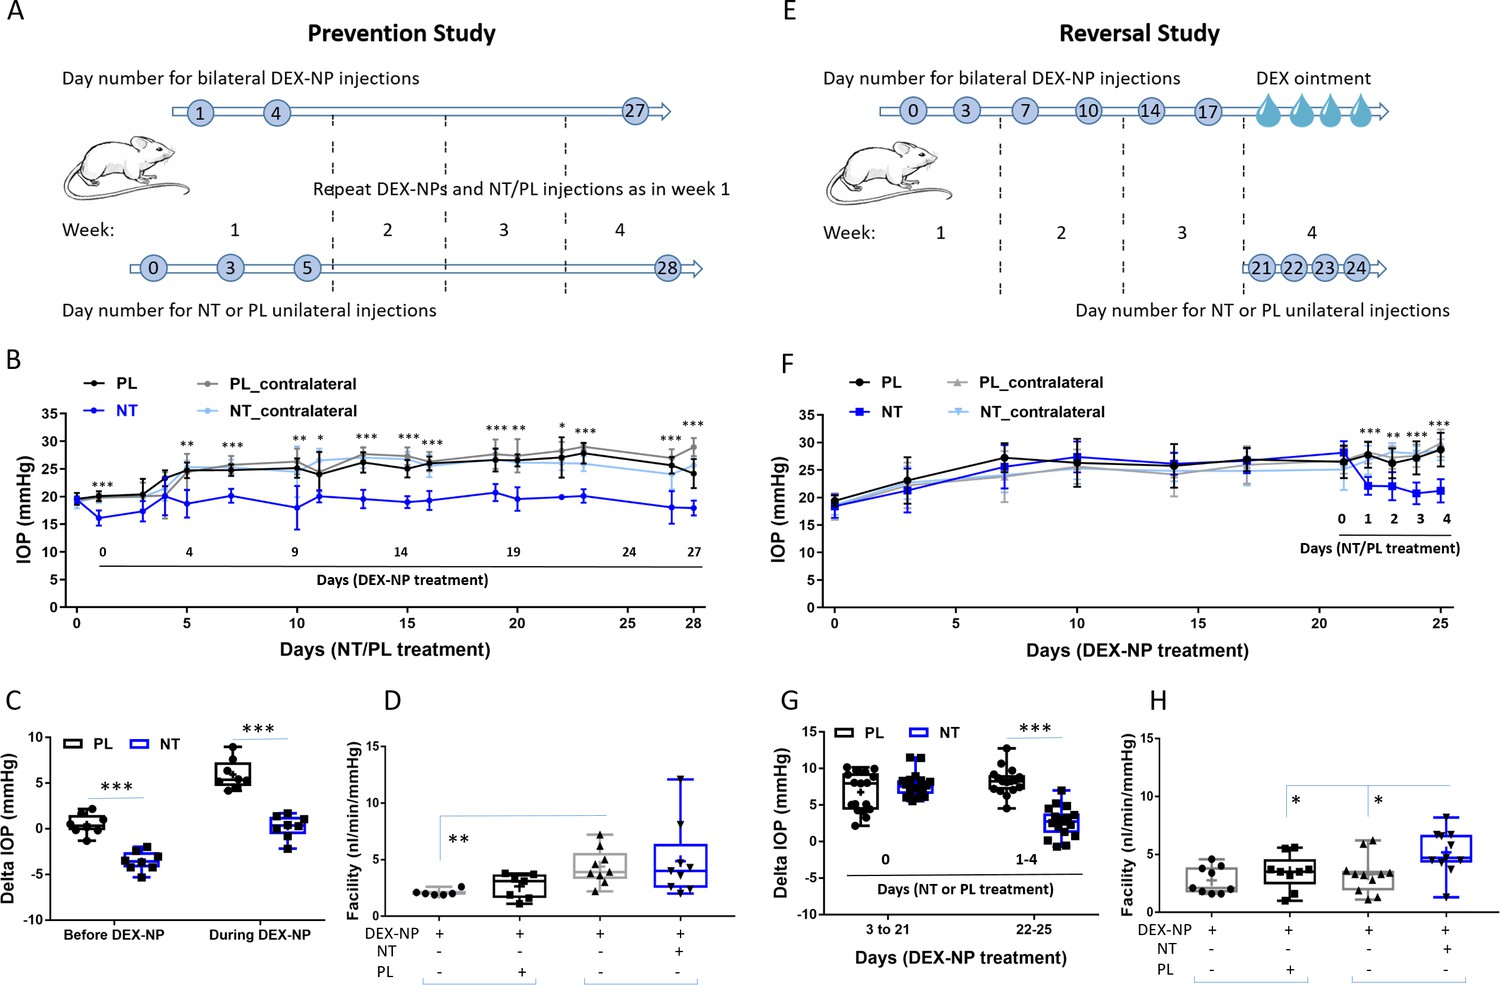
Netarsudil (NT) prevented and reversed steroid-induced ocular hypertension by improving outflow function.
(A) In the prevention study, intraocular pressure (IOP) was measured in two groups of age- and gender-matched wild-type C57BL/6 mice receiving NT or placebo (PL) unilaterally by subconjunctival injections. The day after NT/PL treatment was started, dexamethasone-loaded nanoparticles (DEX-NPs) were delivered bilaterally into the periocular space to release DEX and create steroid ocular hypertension. We continued to apply NT or PL 2–3 times per week to the same eye and to deliver DEX-NPs 1–2 times per week bilaterally for 4 weeks. (B) The IOP data over time are displayed as mean ± SD (n = 8 for each group). *p<0.05, **p<0.01, ***p<0.001 comparing NT vs. PL groups. (C) We summarize the data from Panel B by showing the average IOP elevation over baseline (‘delta IOP’) following NT or PL treatment in the presence of continuous DEX-NP delivery. ‘Before DEX-NP’ refers to IOP elevations at 1 day post-NT or -PL treatment but before delivery of DEX-NPs, and ‘during DEX-NP’ refers to IOP elevations averaged over 4–28 days of NT or PL treatment, i.e., over 3–27 days of DEX-NP delivery. ***p<0.001 comparing NT vs. PL groups. (D) After 4 weeks of PL or NT treatment, outflow facility was measured in freshly enucleated eyes (p=0.08 for comparison of DEX-NP+PL vs. DEX-NP+NT, n = 7–9). Brackets indicate paired eyes. (E) In the second (reversal) study, IOP was measured in two groups of age- and gender-matched mice receiving DEX-NPs bilaterally 1–2 times per week for 3 weeks. During the last 5 days, NT or PL was administered unilaterally and DEX ointment bilaterally, once per day for four consecutive days. (F) We found that NT rapidly reversed three weeks of DEX-NP-induced ocular hypertension. The data show mean ± SD (n = 17 for PL group and n = 19 for NT group). **p<0.01, ***p<0.001 comparing NT vs. PL groups. (G) We summarize the data from Panel F by showing average IOP elevations above baseline (‘delta IOP’) for DEX-NP-treated eyes in both groups prior to NT or PL treatment (left side) or averaged over 1–4 days of NT or PL treatment (right side). ***p<0.001 comparing NT vs. PL groups. (H) On day 5 of NT/PL treatment, both eyes were enucleated and outflow facility was measured (*p=0.038, n = 9 for DEX-DP+PL and n = 11 for DEX-NP+NT group). Brackets indicate paired eyes. See Figure 1 for interpretation of box and whisker plots. Source data for IOPs and outflow facilities in Figure 2—source data 1.
-
Figure 2—source data 1
Source data for IOPs and outflow facilities in Figure 2.
- https://cdn.elifesciences.org/articles/60831/elife-60831-fig2-data1-v1.xlsx
Figure 2—figure supplement 1
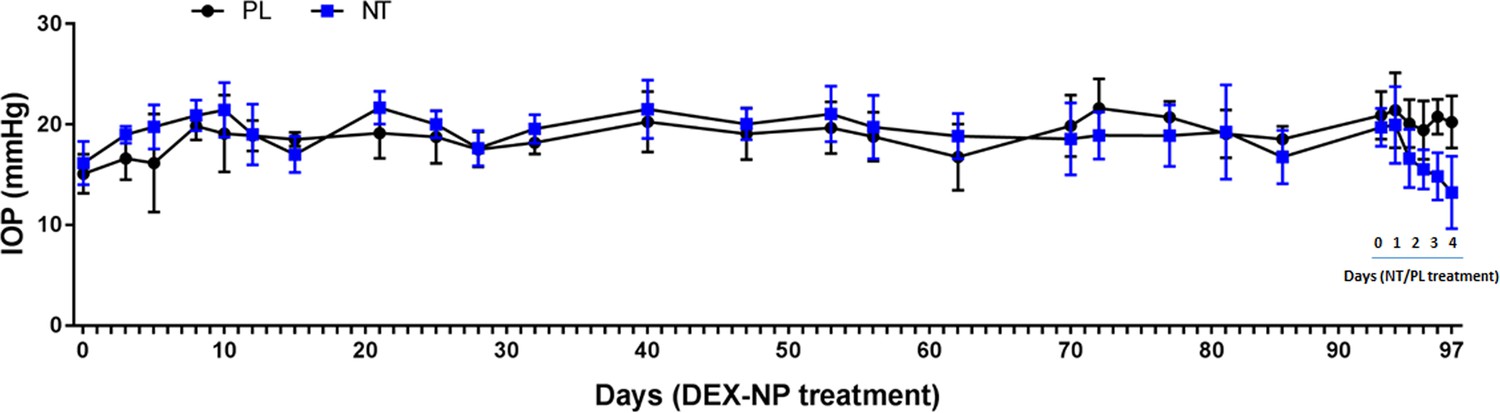
Netarsudil (NT) reversed dexamethasone-loaded nanoparticle (DEX-NP)-induced intraocular pressure (IOP) elevation even after 3 months.
Two groups of age- and gender-matched wild-type C57BL/6 mice were treated unilaterally with DEX-NPs twice per month for 3 months. During the last week, eyes were treated with NT or placebo (PL) once per day for 4 days. IOP was measured at indicated time points. N = 7 animals per group. Notably, this regimen (e.g., twice per month DEX-NPs) gives a more modest IOP increase (3–4 mmHg) and differs from regimen described for the 4-week studies in Figure 2.
Figure 3 with 3 supplements
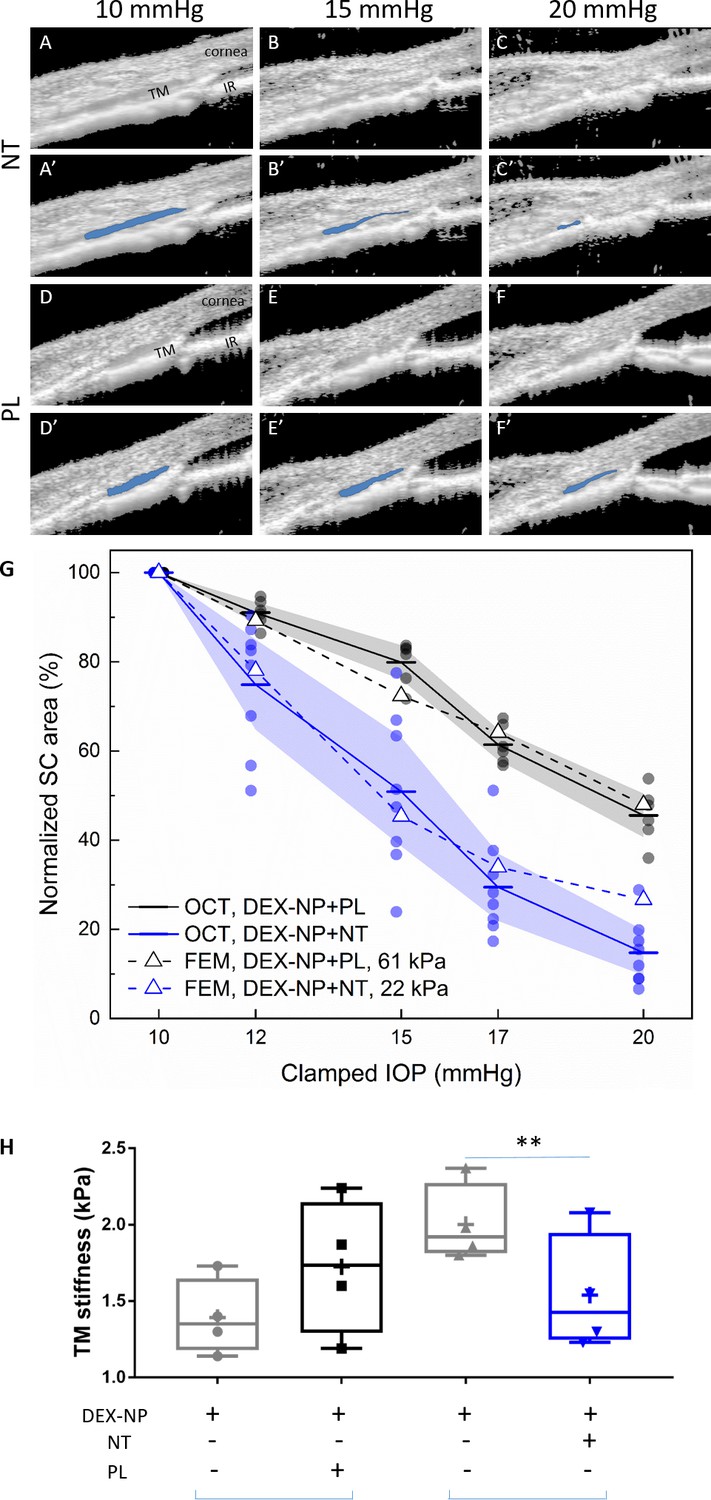
Netarsudil (NT) reduced steroid-induced trabecular meshwork (TM) stiffening visualized in living mice by spectral domain-optical coherence tomography (SD-OCT) and estimated by inverse finite element modeling (iFEM) and measured directly by atomic force microscopy (AFM).
Wild-type C57BL/6 mice received dexamethasone-loaded nanoparticles (DEX-NPs) bilaterally for 4 weeks. During the last week, mice received either NT or placebo (PL) unilaterally for 4 consecutive days. (A–F) On day 5, living mouse eyes were cannulated to control intraocular pressure (IOP) and were subjected to sequentially increasing pressure steps (10–20 mmHg) while imaging conventional outflow tissues using OCT. Images were analyzed and Schlemm’s canal (SC) lumen semi-automatically segmented (in blue) using custom SchlemmSeg software (A’–F’). The increased tendency toward SC collapse in NT- vs. PL-treated eyes is evident. (G) Quantitative comparison of SC lumen areas (blue regions in Panels A’-F’) in both NT and PL treatment group at five clamped IOPs (10, 12, 15, 17, and 20 mmHg). The plotted quantity is relative SC area (normalized to value at 10 mmHg), and the data show an increased tendency toward SC collapse in NT-treated eyes compared to PL-treated eyes. The dots indicate individual eyes, and bars represent mean values for each IOP. Shaded regions indicate 95% confidence intervals. N = 6 for PL and n = 8 for NT treatment groups. We conducted iFEM to structurally analyze the response of anterior segment tissues to varying IOP levels, mimicking the experimental measurements. Dashed lines show results of the iFEM analysis for least squares best fit TM stiffness values, yielding estimated stiffnesses of 61 kPa for PL-treated eyes and 22 kPa for NT-treated eyes. Abbreviations: IR = iris. (H) At day 5, eyes were collected and processed for atomic force measurements of TM stiffness (Young’s modulus). We observed that NT softened the TM vs. control eyes. Brackets indicate paired eyes. We point out that the magnitudes of the AFM and OCT/iFEM measurements of TM stiffness differ due to the well-known dependence of soft tissue stiffness on loading mode (compression by AFM vs. tension by SC lumen pressurization) (Ethier and Simmons, 2007), as discussed in more detail in Wang et al., 2017a. An average of 135 measurements were made from three quadrants on four biological samples for both cohorts, p=0.007. Blue brackets indicate paired eyes. See Figure 1 for interpretation of box and whisker plots. Source data for area of SC lumen in Figure 3—source data 1. Source data for FEM in Figure 3—source data 2. Source data for AFM measurements in Figure 3—source data 3.
-
Figure 3—source data 1
Source data for segmentation of area of SC lumen in Figure 3.
- https://cdn.elifesciences.org/articles/60831/elife-60831-fig3-data1-v1.xlsx
-
Figure 3—source data 2
Source data for FEM in Figure 3.
- https://cdn.elifesciences.org/articles/60831/elife-60831-fig3-data2-v1.xlsx
-
Figure 3—source data 3
Source data for AFM measurements in Figure 3.
- https://cdn.elifesciences.org/articles/60831/elife-60831-fig3-data3-v1.xlsx
Figure 3—figure supplement 1
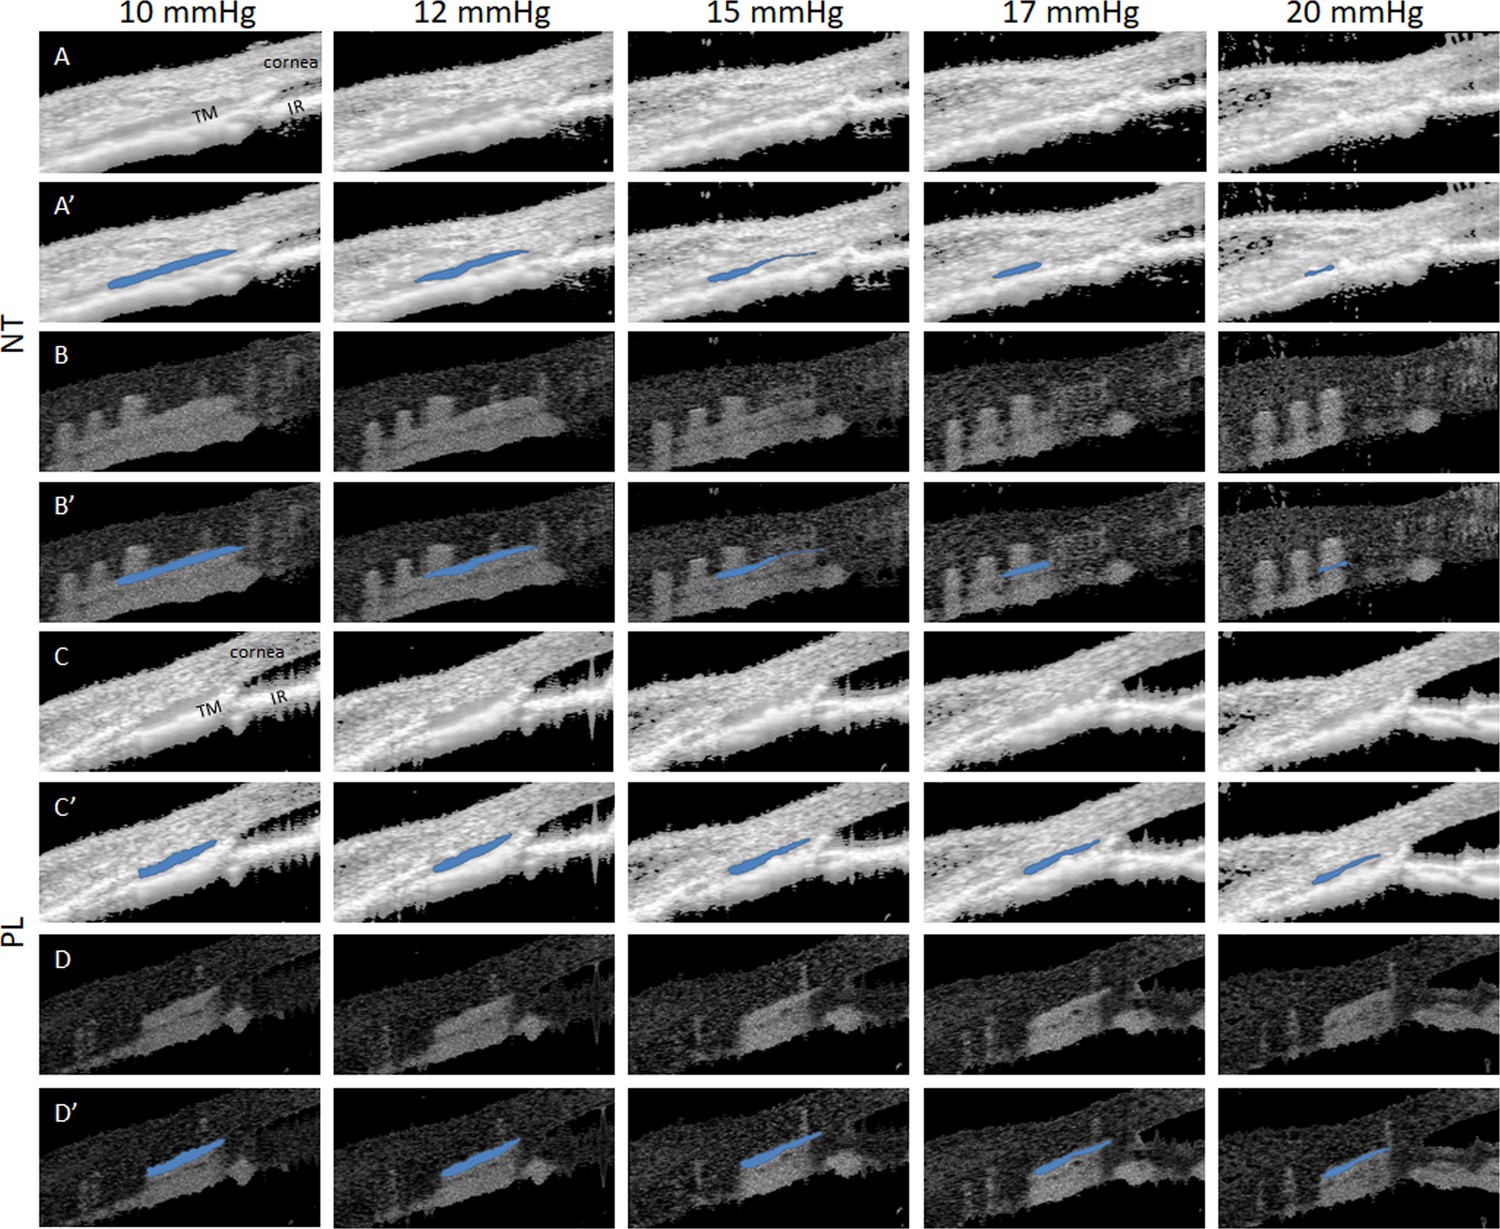
Netarsudil (NT) enhanced intraocular pressure (IOP)-induced collapse of Schlemm’s canal (SC) lumen in ocular hypertensive eyes as visualized by spectral domain-optical coherence tomography (SD-OCT).
Mice were treated with dexamethasone-loaded nanoparticles (DEX-NPs) in both eyes for 4 weeks and unilaterally with NT or placebo (PL) for 4 consecutive days. On day 5, living mouse eyes were cannulated to control IOP and were subjected to sequentially increasing pressure steps to create IOPs of 10, 12, 15, 17, and 20 mmHg. OCT imaging of conventional outflow tissues was conducted in both NT- and PL-treated eyes, and the images were averaged to reduce noise at each pressure step. (A) Shows NT-treated eyes, while C) shows PL-treated eyes. Corresponding images (A’, C’) Show SC lumen segmentation by SchlemmSeg software with lumens indicated in blue. Panels B, B’, D, and D’ show the corresponding speckle variance images and SC segmentations. TM, trabecular meshwork; IR, iris.
Figure 3—figure supplement 2
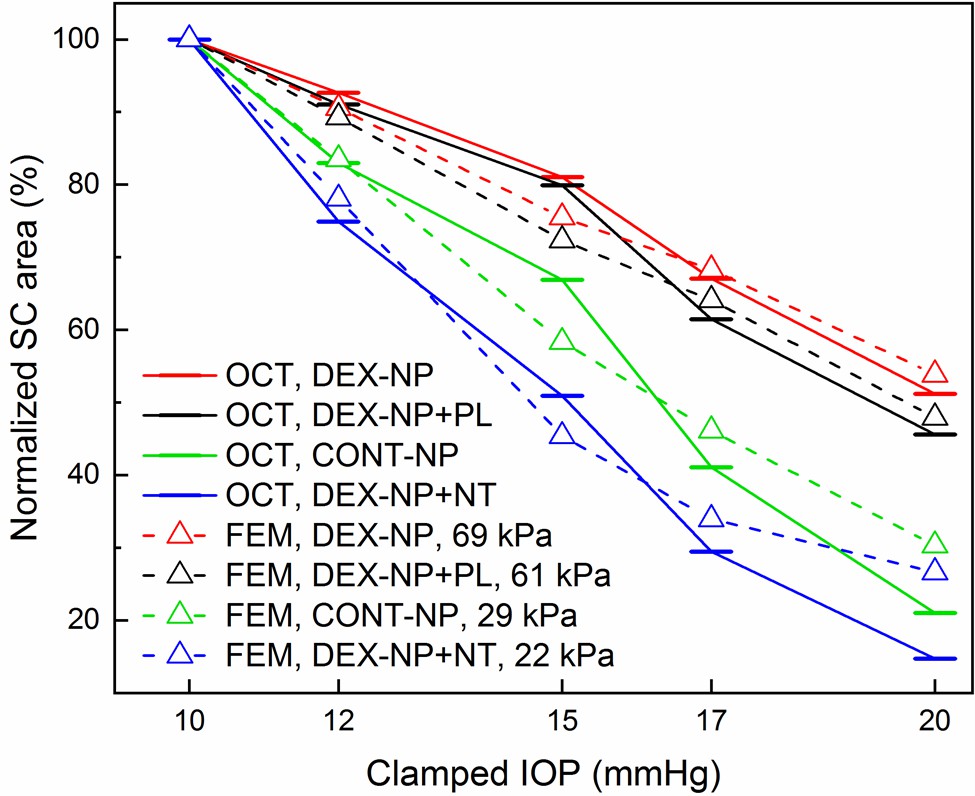
Quantitative comparison of normalized Schlemm’s canal (SC) lumen areas in netarsudil (NT) and placebo (PL) treatment groups at five clamped intraocular pressures (IOPs) (10, 12, 15, 17, and 20 mmHg).
This figure is similar to Figure 3G, but also includes results from eyes with dexamethasone-loaded nanoparticle (DEX-NP) treatment without administration of either NT or PL (DEX-NP, red) and from control eyes that received no glucocorticoids (CONT-NP, green), both adopted from our previous study (McMurtry et al., 2010). The plotted quantity is relative SC area (normalized to value at 10 mmHg) and the bars represent mean values for each IOP. We conducted inverse finite element modeling (iFEM) to structurally analyze the response of anterior segment tissues to varying IOP levels, mimicking the experimental measurements. Dashed lines show results of the iFEM analysis for least squares best fit trabecular meshwork (TM) stiffness values, yielding estimated stiffnesses of 61 kPa for PL-treated DEX-NP eyes, 22 kPa for NT-treated DEX-NP eyes, 69 kPa for eyes receiving only DEX-NPs, and 29 kPa for eyes receiving CONT-NPs.
Figure 3—figure supplement 3
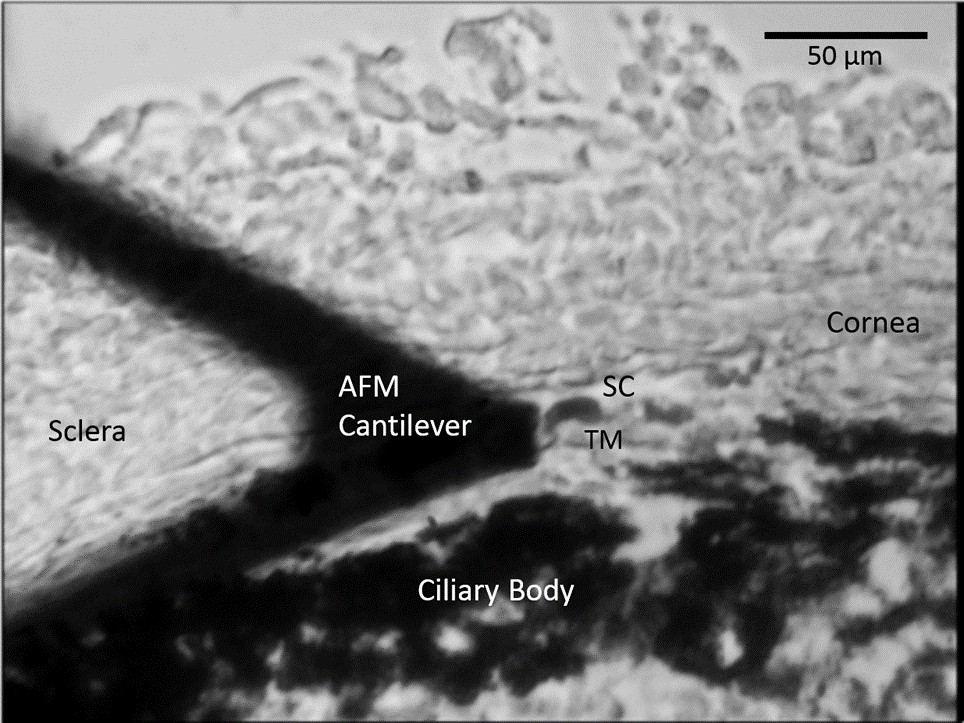
A representative cryosection showing the limbal region during AFM measurements of TM stiffness, acquired on a tissue sample immersed in PBS.
AFM, atomic force microscopy; PBS, phosphate buffered saline; SC, Schlemm’s canal; TM, trabecular meshwork. Section thickness 10 µm.
Figure 4 with 1 supplement

Netarsudil (NT) decreased fibrotic markers in ocular hypertensive mouse eyes.
Two groups of age- and gender-matched wild-type C57BL/6 mice had dexamethasone-loaded nanoparticles (DEX-NPs) delivered bilaterally 1–2 times per week for 4 weeks to create ocular hypertension. During the last week of DEX-NP exposure, mice were split into two subgroups and treated unilaterally with either NT or placebo (PL) once per day for 4 consecutive days. At day 5, eyes were collected and processed for histological analysis and compared to untreated control eyes. (A–C) Representative sagittal sections of iridocorneal tissues visualized by light microscopy after methylene blue staining, showing normal gross morphology in NT-treated eyes. Boxes in A–C indicate areas of interest displayed in Panels D–I. Control, PL- or NT-treated ocular hypertensive eyes were sectioned and iridocorneal tissues were probed with antibodies recognizing fibronectin (FN) (D–F) or alpha-smooth muscle actin (αSMA; G–I). Identical confocal settings were used for all samples, which were imaged on the same day. Data shown are representative of samples from 10 images from seven control mice, and 10 images from five mice treated with NT or PL. Nuclei were counterstained with DAPI in (C–F). Asterisks indicate Schlemm’s canal (SC) lumen, arrowheads show trabecular meshwork. (J, K) Fluorescence intensity from the trabecular meshwork region of each image was quantified in a masked fashion (Figure 4—figure supplement 1) as summarized in box and whisker plots. Data show average fluorescence intensity measurements of trabecular meshwork (TM) from different sections of eyes under different treatment conditions. See Figure 1 for interpretation of box and whisker plots. n = 5 eyes for PL- and NT-treated eyes, n = 7 for untreated eyes (CON). *p<0.05 and **p<0.01. Source data for quantification of FN and αSMA fluorescence in TM in Figure 4—source data 1 and Figure 4—source data 2, respectively.
-
Figure 4—source data 1
Source data for quantification of FN in Figure 4.
- https://cdn.elifesciences.org/articles/60831/elife-60831-fig4-data1-v1.xlsx
-
Figure 4—source data 2
Source dat for quantification of SMA in Figure 4.
- https://cdn.elifesciences.org/articles/60831/elife-60831-fig4-data2-v1.xlsx
Figure 4—figure supplement 1
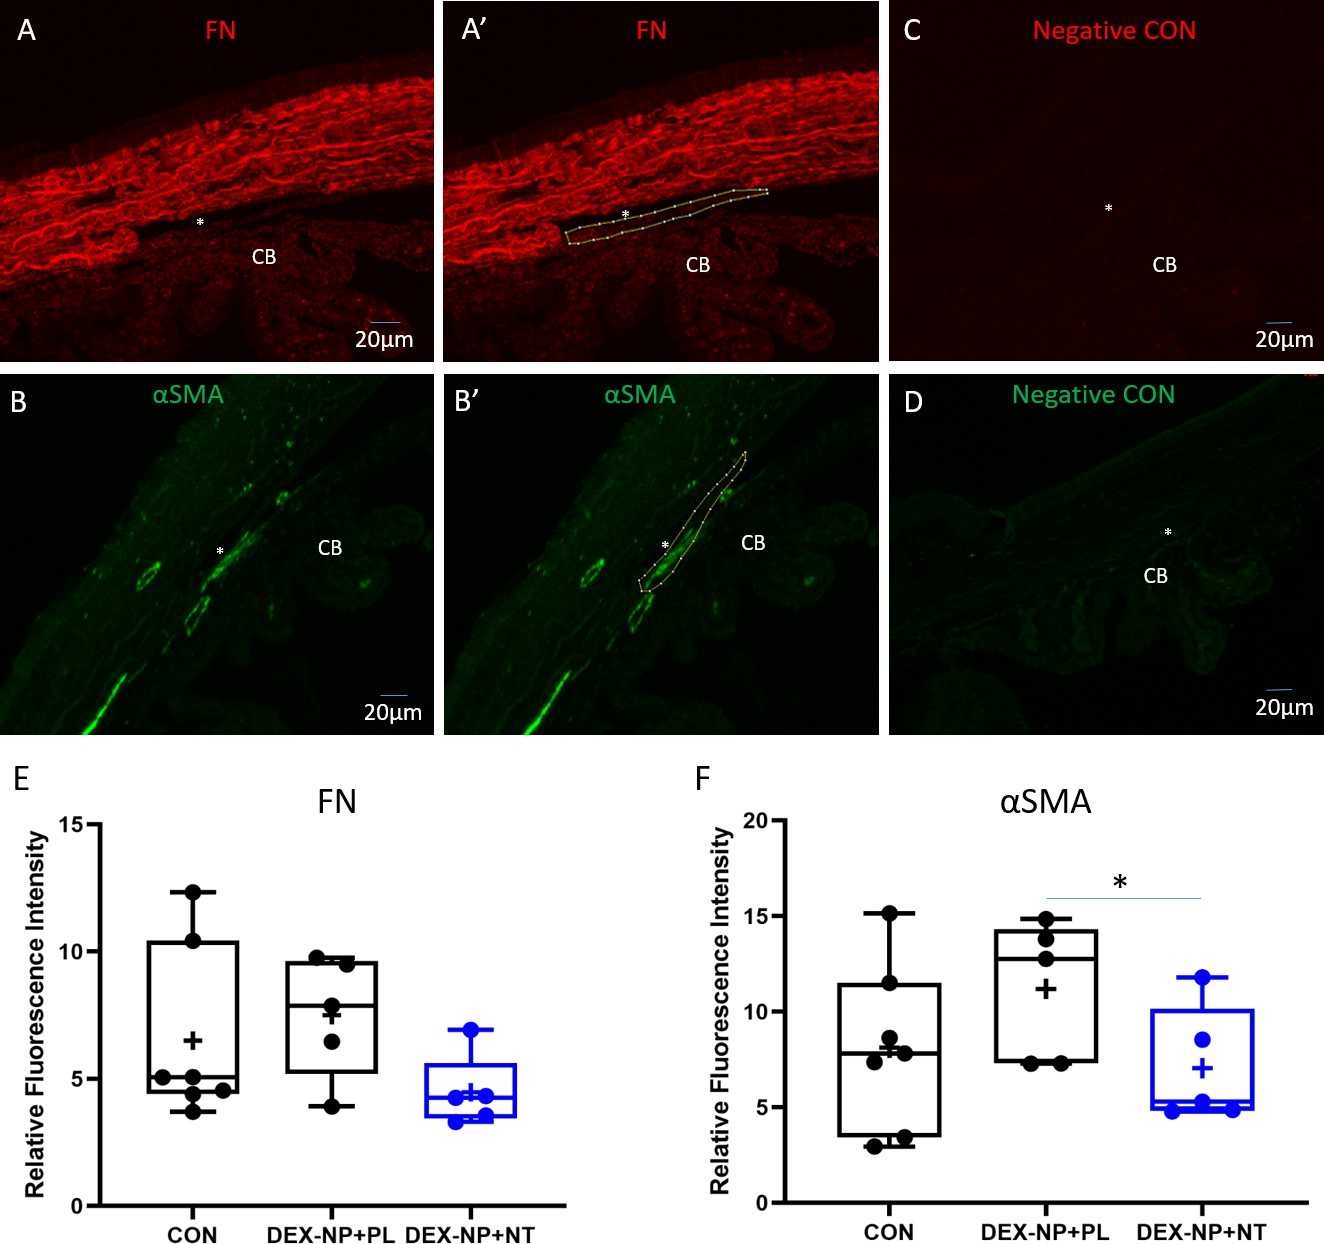
Quantitative analysis of fibronectin (FN) and alpha-smooth muscle actin (αSMA) expression in trabecular meshwork (TM).
Wild-type C57BL/6 mice were injected subconjunctivally/periorbitally with dexamethasone-loaded nanoparticles (DEX-NPs), delivered bilaterally 1–2 times per week for 3 weeks to induce ocular hypertension, followed by DEX ophthalmic ointment once per day for 4 days. During the last 4 days of DEX-NP exposure, mice were split into two subgroups and treated unilaterally with either netarsudil (NT) or placebo (PL) once per day for 4 consecutive days. At day 5, eyes were collected, sectioned, and iridocorneal tissues were probed with antibodies recognizing FN or αSMA. Fluorescent secondary antibody binding was visualized under identical confocal microscopic settings between experimental and control groups. Using ImageJ software, the TM from each image was manually delineated and fluorescence within the TM was quantified in a masked fashion. Representative images show marking of TM region in sections labeled with antibodies specific for FN (panels A and A’) and αSMA (panels B and B’). Panels C and D show companion images from sequential sections where primary antibodies were omitted. Panels E and F show summaries of fluorescent intensity in the TM region (averaged for each analyzed eye) under different conditions and are displayed in a box and whisker plot. Figure 4 shows a similar plot where average fluorescent intensity is shown for each section. See Figure 1 for interpretation of the box and whisker plots. CON indicates untreated naïve eyes. *p<0.05.
Figure 5 with 1 supplement
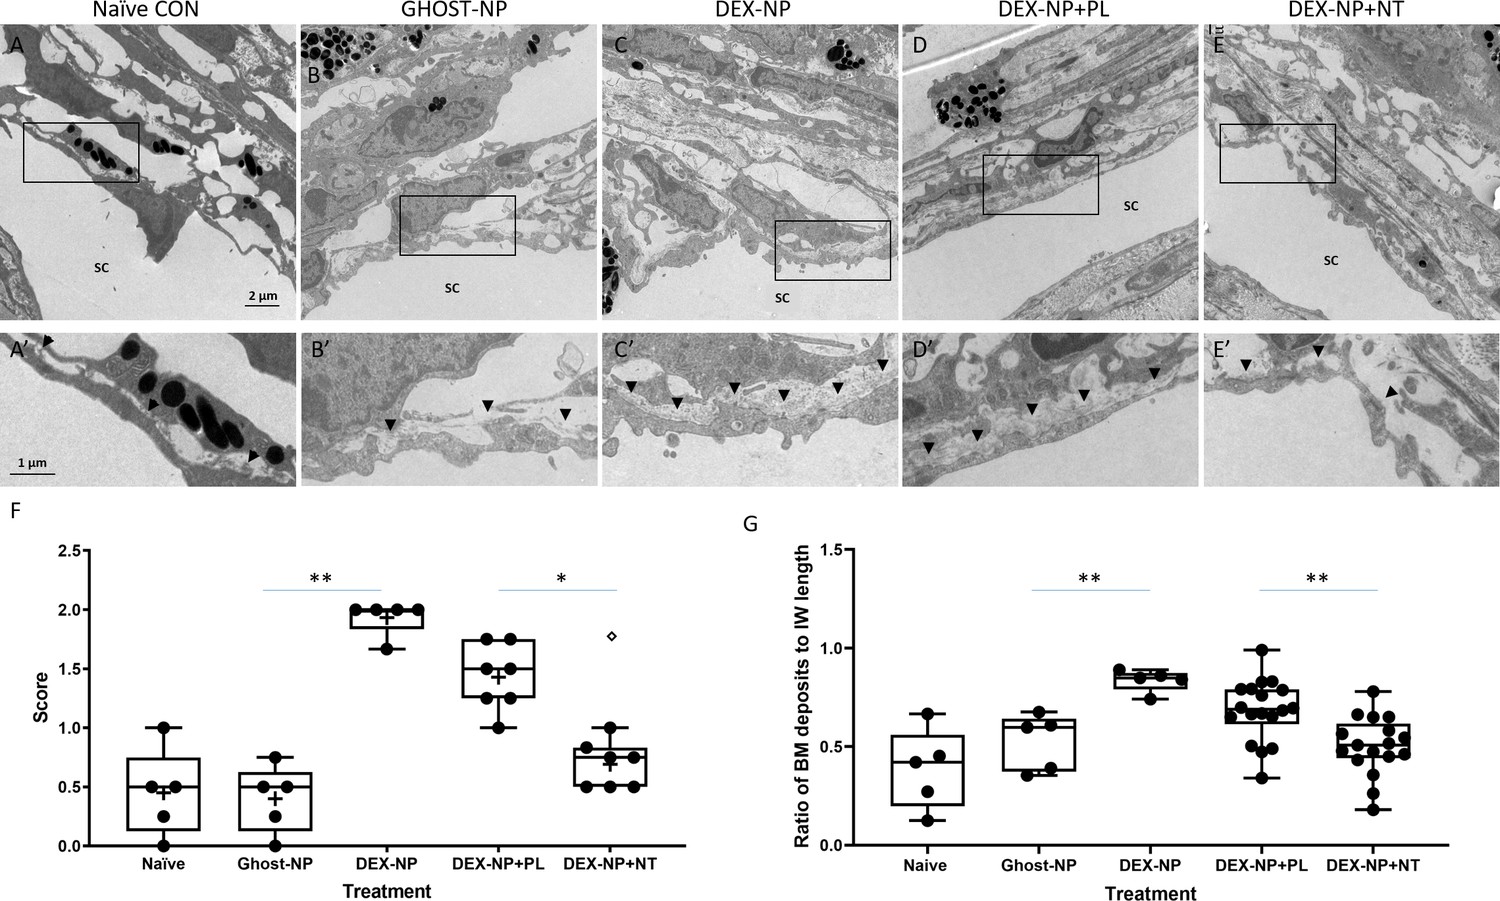
Netarsudil (NT) partially normalized ultrastructure of conventional outflow tissues in ocular hypertensive eyes.
Two groups of age- and gender-matched wild-type C57BL/6 mice were bilaterally treated with dexamethasone-loaded nanoparticles (DEX-NPs) 1–2 times per week for 4 weeks. During the last week of DEX-NPs exposure, one group of mice was unilaterally treated with NT and another group with placebo (PL) once per day for 4 consecutive days. At day 5, eyes were collected and fixed with 4% PFA plus 1% glutaraldehyde in phosphate buffered saline (PBS) for 1–3 days at 4°C. The anterior segments were embedded in Epon, sectioned, stained with uranyl acetate/lead citrate, and examined with a JEM-1400 electron microscope. We show representative images from (A) five eyes naïve to NPs or treatment, (B) five control eyes (injected with NPs not loaded with DEX [Ghost-NP]), (C) five DEX-NP treated eyes, (D) 11 PL-treated eyes, and (E) nine NT-treated eyes. (A’–E’) show enlarged areas indicated by boxes in (A–E). Arrowheads point to basement membrane materials (BMM) underlying Schlemm’s canal (SC) inner wall endothelial cells. (F) Summary of results from semi-quantitative scoring of extracellular matrix (ECM) in juxtacanalicular (JCT) region, paying particular attention to ECM underlying SC endothelial cells. Images in Panels A and B were scored as ‘0’ (normal appearance), while the image in Panel C was scored as ‘2’ (continuous and extensive ECM below SC and ECM in JCT). Shown are mean values for each eye, corresponding to 10, 13, 18, 12, and 8 images in each group that were graded. **p<0.01 comparing Ghost-NP vs. DEX-NP; *p<0.05 comparing DEX-NP+PL vs. DEX-NP+NT. The empty symbol was statistically determined to be an outlier of the DEX-NP+NT data set. (G) Summary of results from quantifying the amount of BMM underlying the inner wall of SC. The BMM ratio was calculated by measuring the length of the BMM underlying the SC inner wall and dividing the value by the SC inner wall’s total length (Figure 5—figure supplement 1). Shown are mean values for each eye taken from 8, 10, 12, 34, and 33 images in each group. **p<0.01 comparing Ghost-NP vs. DEX-NP or DEX-NP+PL vs. DEX-NP+NT. Source data for semi-quantitative scoring of JCT and quantitative measurements of BMM in Figure 5—source data 1 and Figure 5—source data 2, respectively.
-
Figure 5—source data 1
Source data for semi-quantitative scoring of JCT in Figure 5.
- https://cdn.elifesciences.org/articles/60831/elife-60831-fig5-data1-v1.xlsx
-
Figure 5—source data 2
Source data for quantitative measurements of BMM in Figure 5.
- https://cdn.elifesciences.org/articles/60831/elife-60831-fig5-data2-v1.xlsx
Figure 5—figure supplement 1
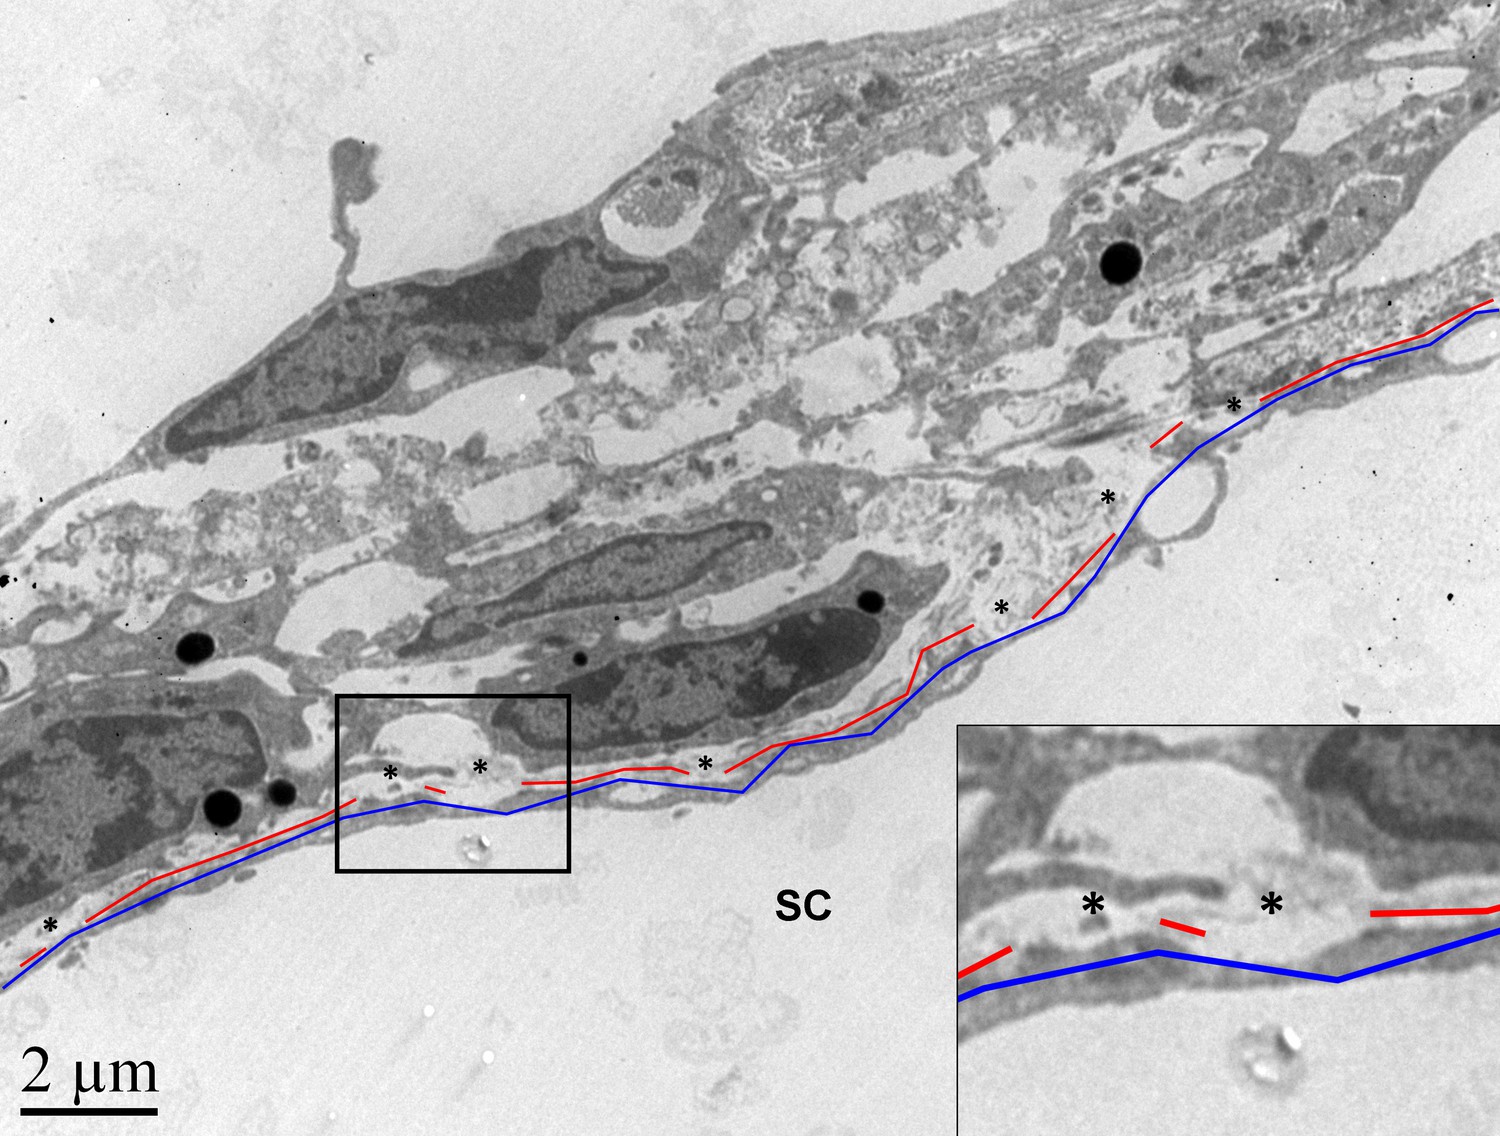
Quantification of basement membrane material (BMM) underlying the inner wall of Schlemm’s canal.
Shown is a representative example of the quantification approach that was performed on 97 images. The lengths of the continuous BMM (in red) and the total length of the inner wall (in blue) were measured using ImageJ software, and the sum of the continuous BMM length was divided by the total inner wall length. Only continuous BMM in contact with the inner wall was included. Ratios from multiple images from the same eye were averaged to produce a single value per eye. Asterisks: regions where BMM material was not included in the quantification due to separation of BMM from inner wall.
Figure 6

Schematic representation of a feed-forward model of fibrotic disease in the conventional outflow pathway responsible for ocular hypertension, incorporating a number of pathophysiological aspects of ocular hypertension (Stamer and Acott, 2012, Schmidl et al., 2015).
The broader literature suggests that this feed-forward loop can be triggered by multiple factors, including aging, oxidative stress, or genetic predisposition. In this work we triggered this loop by corticosteroid administration and restored tissue function through rho-kinase inhibition. TM, trabecular meshwork.
Tables
Table 1
Netarsudil (NT) effectively lowered steroid-induced ocular hypertension in patients whose IOP was not well controlled with standard glaucoma medications.
| Patient/ eye | Age (years) | Gender | Race | Ocular condition | Steroid type | Glaucoma medications | IOP before NT (mmHg) | IOP < 1 month after NT (mmHg) |
|---|---|---|---|---|---|---|---|---|
| Cohort 1 | ||||||||
| 1/OD | 50 | M | AA | POAG | Durezol | Brim, Cos | 23 | 16 |
| 2/OD | 74 | F | AA | CACG | PF | Apra, Meth, Lat | 33 | 22 |
| 3/OD | 27 | M | HIS | TG | PF | Bet, Brim, Dor; Lum | 36 | 28 |
| 4/OD | 66 | F | CAU | Uveitis | Retisert | Cos, Brim | 17 | 9 |
| 5/OS | 76 | F | CAU | POAG | PF | Lum, Cos | 17 | 11 |
| 6/OS | 53 | M | CAU | SR | Ozurdex | Com, Dor | 31 | 12 |
| 7/OS | 74 | F | CAU | SR | PF | Cos, Brim | 25 | 16 |
| 8/OS | 61 | F | AA | Uveitis | Durezol | Cos, Brim, Lat | 34 | 26 |
| 9/OD | 81 | M | UNK | POAG | PF | Cos, Brim, Lat | 25 | 19 |
| 9/OS | 20 | 16 | ||||||
| 10/OS | 51 | F | CAU | Uveitis; SR | PF; Fluti | Cos, Brim | 26 | 15 |
| 11/OS | 78 | F | CAU | POAG; SR | Oral Pred | Lat, Tim, Dor, Dmx | 22 | 12 |
| 12/OD | 76 | F | CAU | SIG | Lotemax | Brim, Cos, Vyzulta | 28 | 20 |
| 12/OS | 27 | 19 | ||||||
| 13/OD | 62 | F | CAU | SIG | PF | Tim, Dor, Lat | 21 | 15 |
| 14/OD | 78 | M | AA | POAG; SR | PF | Com, Dor, Lat | 30 | 13 |
| 15/OS | 72 | F | CAU | LTG; SIG | PF | Brim, Lat | 15 | 13 |
| 16/OS | 83 | F | AA | Glaucoma | PF; Retisert | Com, Lat | 21 | 18 |
| 17/OD | 76 | M | CAU | POAG; SIG | Durezol | Cos, Brim | 12 | 10 |
| 18/OS | 83 | F | CAU | POAG; SIG | PF | Cos, Brim | 29 | 18 |
| 19/OD | 49 | F | CAU | POAG; SIG | Lotemax | Cos, Brim | 18 | 17 |
| 66.8 | 6M/13F | 2.7 ± 0.7 | 24.3 ± 6.6 | 16.4 ± 4.9 | ||||
| Cohort 2 | ||||||||
| 20/OS | 60 | M | CAU | Uveitis | Ivt. Dex | Com, Lat | 60 | 44 |
| 21/OS | 92 | F | CAU | SR | Ozurdex | Lat, Alph, Dor, Tim | 17 | 12 |
| 22/OD | 77 | F | CAU | SR | Oral Pred | Lat | 24 | 19 |
| 22/OS | 24 | 18 | ||||||
| 23/OD | 65 | F | CAU | SR | Ozurdex | Lum | 30 | 26 |
| 23/OS | 33 | 22 | ||||||
| 24/OD | 16 | F | CAU | PCG | Topical Pred | Tim, Azo, Lat | 21 | 16 |
| 25/OD | 67 | M | CAU | POAG | Topical Pred | Lat, Azo, Bet | 28 | 18 |
| 26/OS | 3d | M | CAU | POAG | Oral Pred | Tim, Lat, Alph | 44 | 32 |
| 27/OD | 90 | M | CAU | POAG | Topical Pred | Azo, Lat | 22 | 16 |
| 27/OS | 22 | 16 | ||||||
| 58.4 | 4M/4F | 2.4 ± 1.1 | 26.5 ± 7.7 | 19.5 ± 5.8 | ||||
-
IOP, intraocular pressure; OD, right eye; OS, left eye; M, male; F, female; AA, African American; HIS, Hispanic; CAU, Caucasian; UNK, unknown; POAG, primary open-angle glaucoma; CACG, chronic angle-closure glaucoma; TG, traumatic glaucoma; OHT, ocular hypertension; PCG primary congenital glaucoma; PF=Pred Forte; Dex=Dexamethasone; Pred=Prednisone; Ivt=intravitreal; Brim=Brimonidine; Com=Combigan; Cos=Cosopt; Apra=Apraclonidine; Meth=Methazolamide; Lat=Latanoprost, Bet=Betaxolol; Dor=Dorzolamide; Lum=Lumigan; Com=Combigan; Alph=Alphagan; Tim=Timolol; Azo=Azopt. IOPs of patient 10/OS were statistically determined to be outliers and the numbers are removed from the analysis.
Key resources table
| Reagent type (species) or resource | Designation | Source or reference | Identifiers | Additional information |
|---|---|---|---|---|
| Software, algorithm | Schlemm3_2 | PMID:30651311 | Version 3.0 | Schlemm’s canal segmentation |
| Software, algorithm | FEBio | https://febio.org/ | Version 3.0 | Finite element modeling |
| Antibody | Anti-αSMA (rabbit polyclonal) | Abcam, Cambridge, MA | ab5694 | IF (1:100) |
| Antibody | Anti-FN (mouse monoclonal) | Santa Cruz, Dallas, TX | sc8422 | IF (1:50) |
Additional files
-
Supplementary file 1
Estimated pressures within Schlemm’s canal (SC) lumen as a function of clamped intraocular pressure (IOP) levels using two-series resistor model of conventional outflow pathway described previously.
- https://cdn.elifesciences.org/articles/60831/elife-60831-supp1-v1.docx
-
Transparent reporting form
- https://cdn.elifesciences.org/articles/60831/elife-60831-transrepform-v1.pdf
Download links
A two-part list of links to download the article, or parts of the article, in various formats.
Downloads (link to download the article as PDF)
Open citations (links to open the citations from this article in various online reference manager services)
Cite this article (links to download the citations from this article in formats compatible with various reference manager tools)
Anti-fibrotic activity of a rho-kinase inhibitor restores outflow function and intraocular pressure homeostasis
eLife 10:e60831.
https://doi.org/10.7554/eLife.60831


