CD14 release induced by P2X7 receptor restricts inflammation and increases survival during sepsis
- Línea de Inflamación Molecular, Instituto Murciano de Investigación Biosanitaria IMIB-Arrixaca, Hospital Clínico Universitario Virgen de la Arrixaca, Spain
- Plataforma de Patología, Instituto Murciano de Investigación Biosanitaria IMIB-Arrixaca, Spain
- Unidad de Reanimación, Hospital Clínico Universitario Virgen de la Arrixaca, Spain
Figures
Figure 1 with 2 supplements
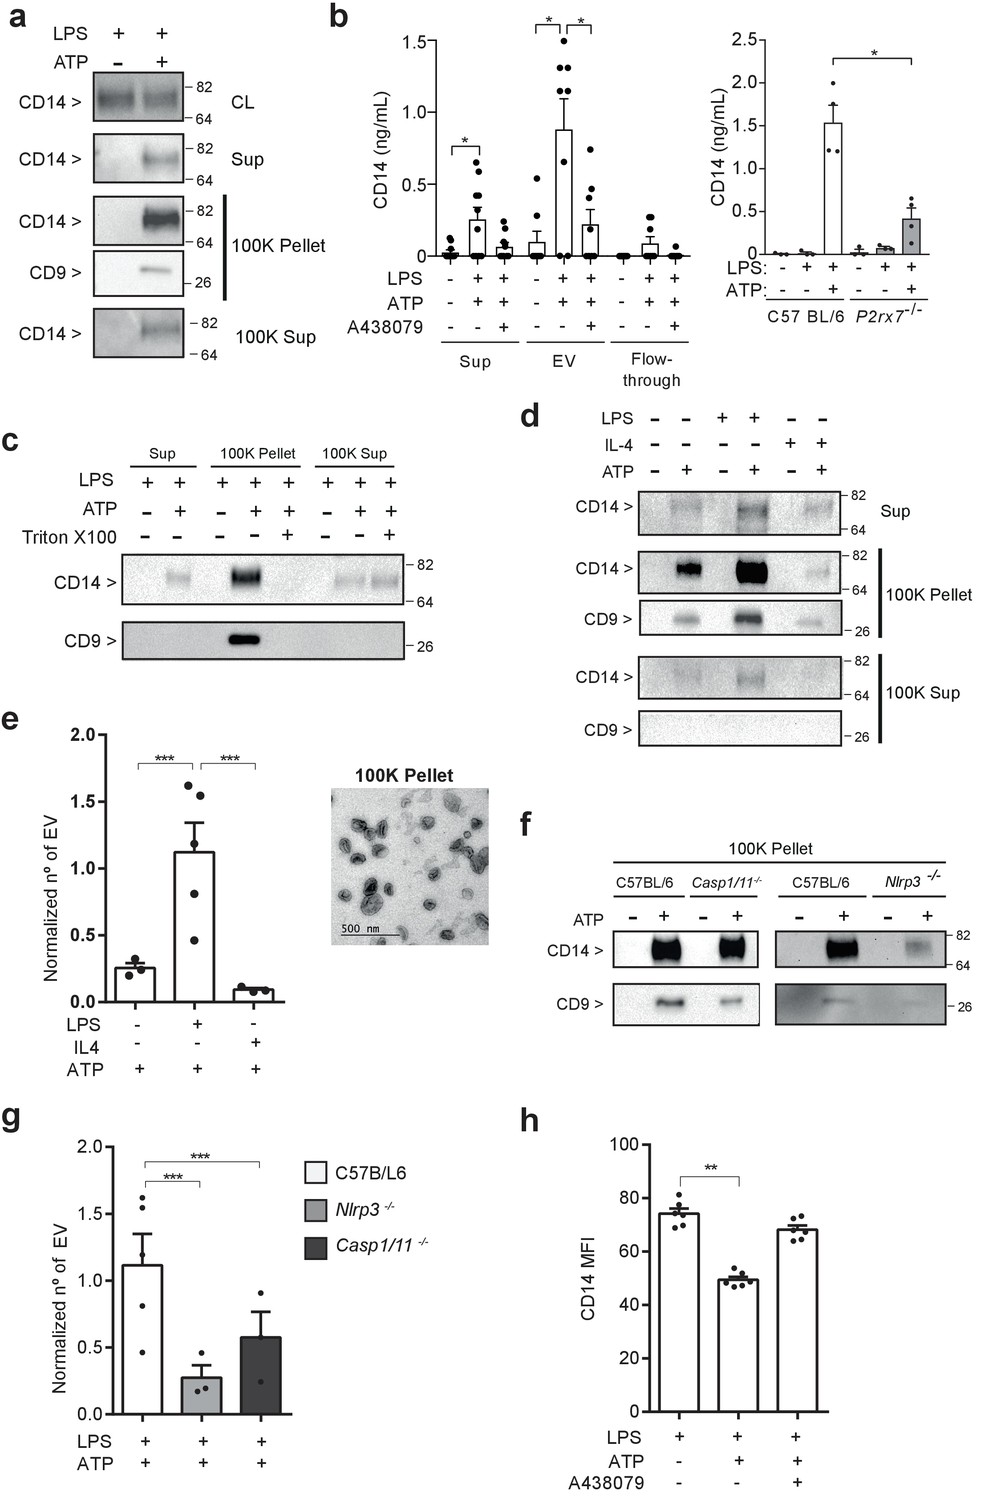
P2X7 receptor stimulation induces the release of extracellular vesicles containing CD14.
(a) Immunoblot for CD14 and CD9 in cell lysate (CL), cell-free supernatant (Sup) and supernatant fractions (100K pellet and 100K supernatant) obtained from extracellular vesicle (EV) isolation from BMDMs treated for 4 hr with LPS (10 ng/ml) and then stimulated or not for 20 min with ATP (3 mM); representative of n = 3 experiments. (b) Quantification of extracellular CD14 by ELISA in Sup, EV isolated with the Exo-Quick kit and flow-through fraction obtained in cell-free supernatants from BMDM treated as in (a), but before ATP application cells were treated for 10 min with A438079 (20 μM) as indicated (left) or from EV isolated with the Exo-Quick in supernatants from P2rx7−/− macrophages (right); each dot represents an independent experiment (n = 4 to 8). (c) Immunoblot for CD14 and CD9 in Sup, 100K pellet and 100K supernatant from BMDM cell-free supernatants treated as in (a), but after the first step of EV isolation, Sup was treated with 2% of Triton X-100; representative of n = 3 independent experiments. (d) Immunoblot for CD14 and CD9 in Sup, 100K pellet and 100K supernatant in cell-free supernatants from BMDM unprimed or primed for 4 hr with LPS (10 ng/ml) or IL-4 (20 ng/ml) and then treated with ATP as in (a); representative of n = 3 experiments. (e) Quantification of EV released from BMDM treated as in (d), left panel; each dot represents an independent experiment (n = 3 to 5); Normalized number of EV to the number of cells obtained in each treatment is shown. Representative transmission electron microscopy image obtained from the 100K pellet, right panel. (f) Immunoblot for CD14 and CD9 in 100K pellet obtained from cell-free supernatants of C57BL/6 (wild-type), Nlrp3−/− or Casp1/11−/− BMDM treated as in (a), representative of n = 3 independent experiments. (g) Quantification of EV in cell-free supernatants of C57BL/6 (wild-type), Nlrp3−/− or Casp1/11−/− BMDM treated as in (a); each dot represents an independent experiment (n = 3 to 5); Normalized number of EV to the number of cells obtained in each treatment is shown. (h) Quantification of CD14 mean fluorescence intensity (MFI) in BDMD treated as in (b); each dot represents an independent experiment (n = 6). *p<0.05, **p<0.01, ***p<0.001, Mann-Whitney test. For a, c, d, and f numbers on the right of the blots correspond to the molecular weight in kDa.
-
Figure 1—source data 1
Source data file for Figure 1.
- https://cdn.elifesciences.org/articles/60849/elife-60849-fig1-data1-v2.xlsx
Figure 1—figure supplement 1
Characterization of P2X7 receptor-induced extracellular vesicles.
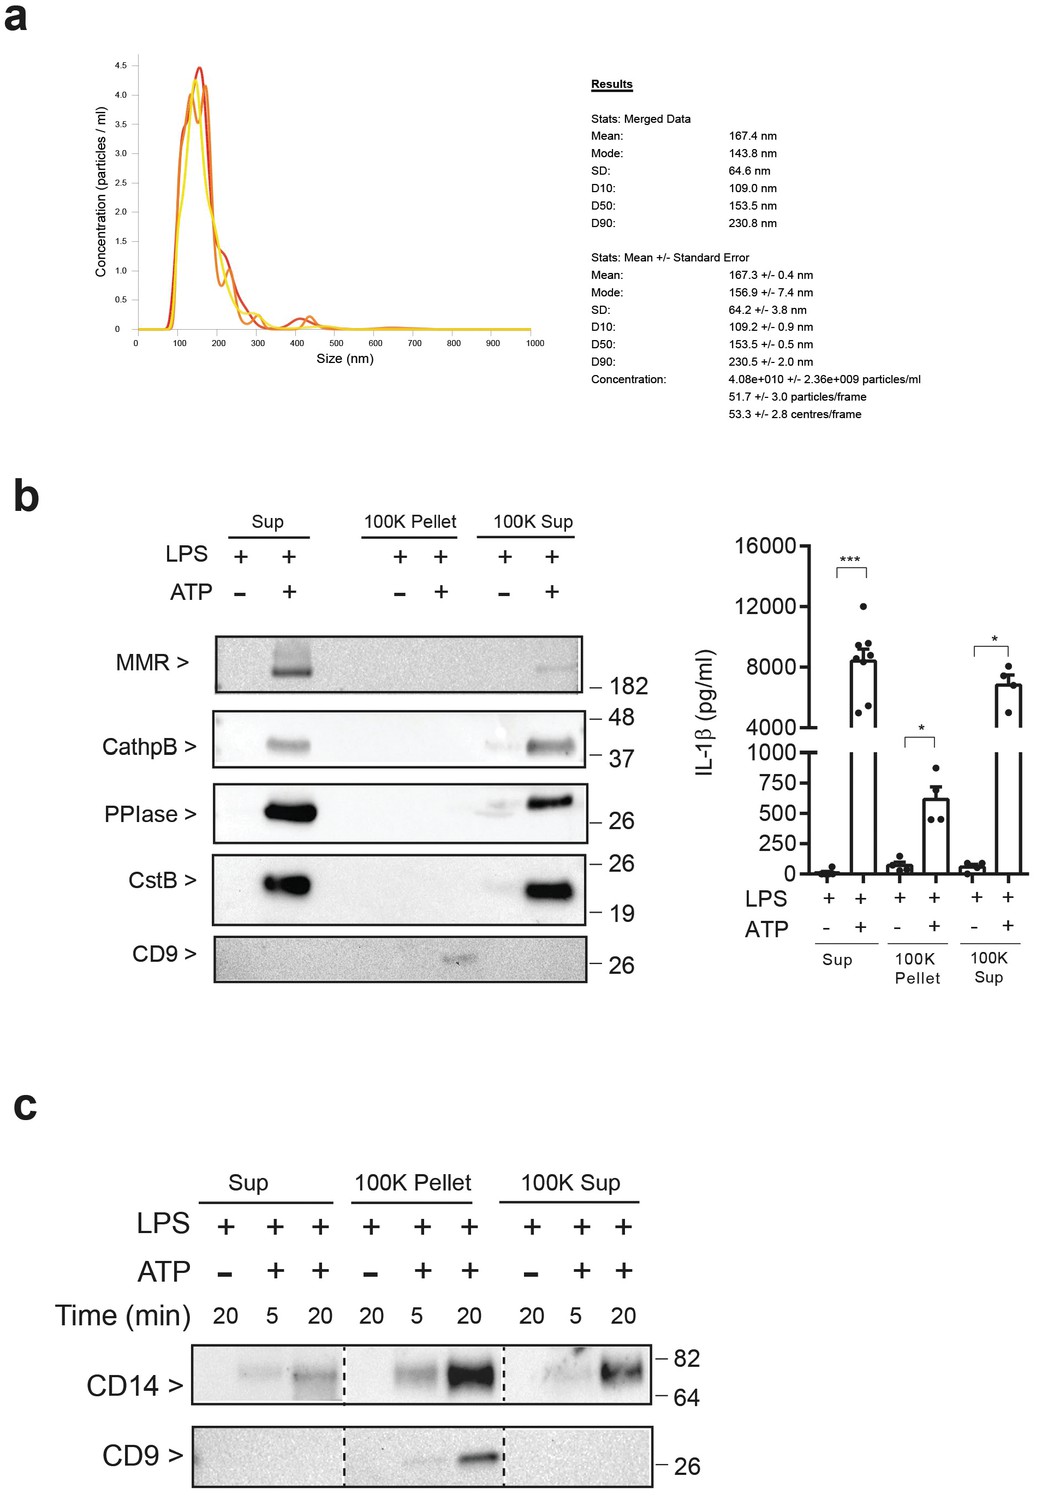
(a) Nanoparticle tracking analysis of extracellular vesicles isolated from BMDM cell-free supernatant primed for 4 hr with LPS (10 ng/ml) and then stimulated during 20 min with ATP (3 mM); n = 3. (b) Immunoblot for macrophage mannose receptor 1 (MMR), peptidyl-prolyl cis-trans isomerase A (PPIase), cathepsin B (CathpB), cystatin B (CstB) and CD9 (left panel) or ELISA for IL-1β (right panel) in cell-free supernatant (Sup) and fractions (100K pellet and 100K supernatant) obtained from extracellular vesicles isolated from BMDM cell-free supernatant primed for 4 hr with LPS (10 ng/ml) and then stimulated or not during 20 min with ATP (3 mM); results are representative from n = 2 independent experiments (left panel), or n = 4 to 8 independent experiments (right panel); *p<0.05, ***p<0.001, Mann-Whitney test. (c) Immunoblot for CD14 and CD9 in cell-free supernatant (Sup) and fractions (100K pellet and 100K supernatant) obtained from extracellular vesicles isolated from BMDM cell-free supernatant treated for 4 hr with LPS (10 ng/ml) and then stimulated or not at indicated times with ATP (3 mM); representative of n = 3 independent experiments. For b and c numbers on the right of the blots correspond to the molecular weight in kDa.
Figure 1—figure supplement 2
Electron microscopy of P2X7 receptor-induced extracellular vesicles.
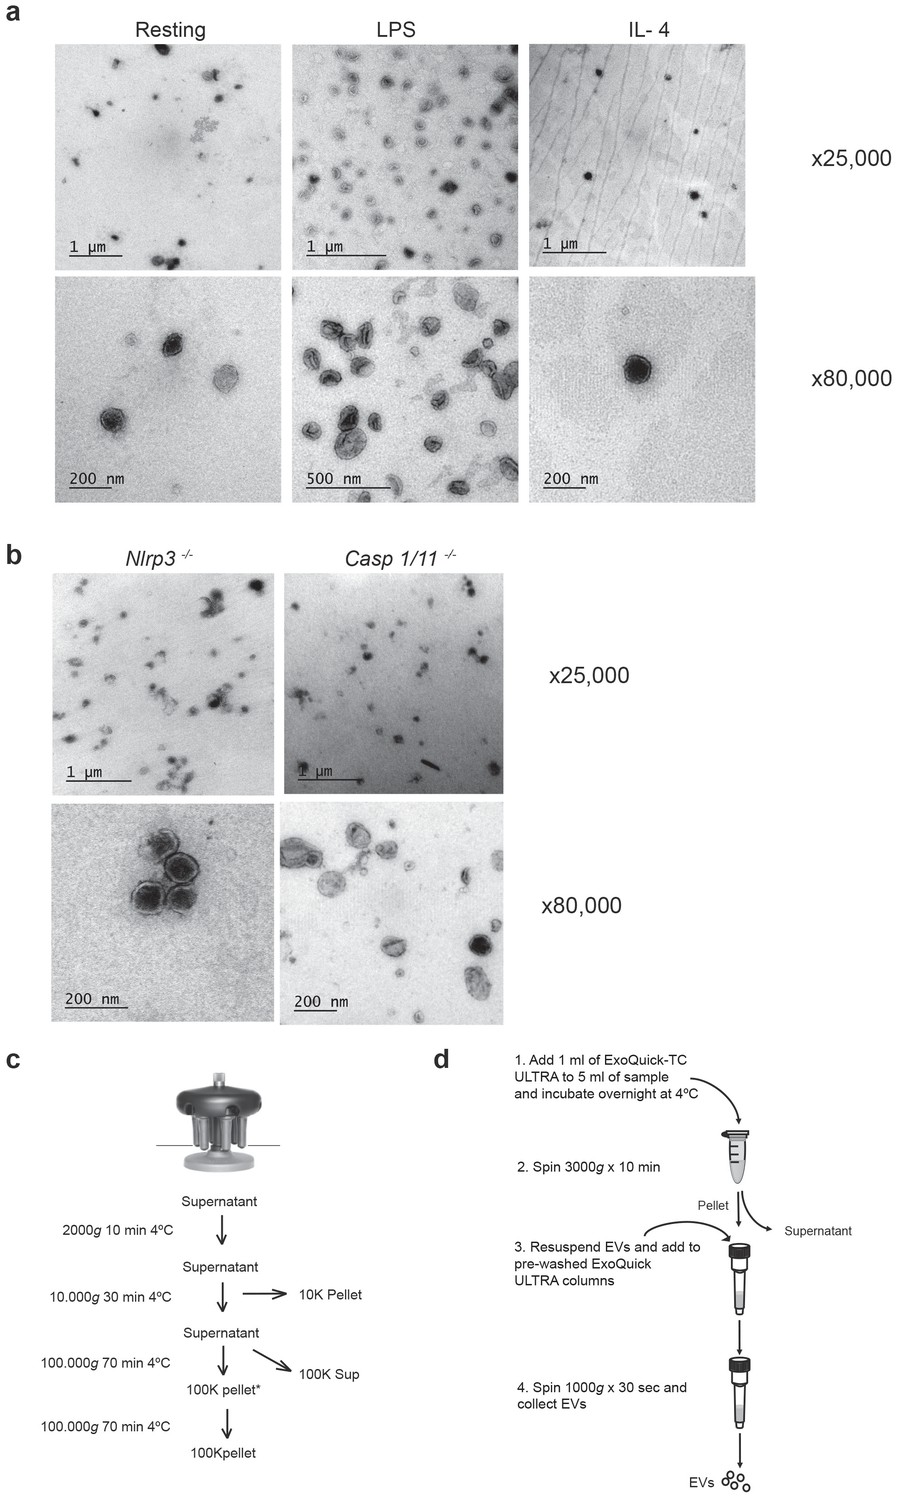
(a) Representative transmission electron microscopy images obtained from extracellular vesicle fraction isolated from cell-free supernatants of BMDM untreated (resting) or primed for 4 hr with LPS (10 ng/ml) or IL-4 (20 ng/ml) and then stimulated during 20 min with ATP (3 mM). Representative images from n ≥ 3 independent experiments. (b) Representative transmission electron microscopy images obtained from 100K pellet fraction obtained from cell-free supernatant of Casp1/11−/− and Nlrp3−/− BMDM primed for 4 hr with LPS (10 ng/ml) and then stimulated during 20 min with ATP (3 mM). Representative images of n = 3 independent experiments. (c) Diagram for extracellular vesicle isolation protocol based on differential centrifugation. Speed, duration, and temperature of each centrifugation step are indicated. Pellets are discarded after first two centrifugations and the supernatant is kept for the next step. In the last 100,000 xg centrifugation, 100K pellet fraction is obtained. (d) Diagram for extracellular vesicle isolation protocol based on Exo-Quick kit.
Figure 2 with 1 supplement

P2X7 receptor stimulation impairs LPS-mediated signaling.
(a) Expression of Il6 and Tnfa genes analyzed by qPCR in C57BL/6 (wild-type) or P2rx7−/− BMDM treated or not for 10 min with A438079 (10 μM), then incubated for 30 min with ATP (5 mM), then washed and finally primed for 4 hr with LPS (10 ng/ml). (b) IL-6 and TNF-α concentration in cell-free supernatants from C57BL/6 (wild-type) or P2rx7−/− BMDM treated as in (a). (c,d) Expression of Il6 and Tnfa genes analyzed by qPCR (c) and ELISA for IL-6 and TNF-α in cell-free supernatants (d) from C57BL/6 (wild-type) or P2rx7−/− BMDM treated as in (a) but finally stimulated for 4 hr with MPLA (1 μg/ml) instead of LPS. (e) Expression of Il1b gene analyzed by qPCR from BMDM treated as in (a) and (c). (f) IL-1β concentration in cell-free supernatants from BMDM treated as in (e) and after LPS or MPLA stimulation, cells were incubated for 30 min with nigericin (10 μM). Each dot represents a single independent experiment; data are represented as mean ± SEM; n = 4–6 single experiments; *p<0.05; **p<0.01; ns, no significant difference (p>0.05); Mann–Whitney test.
-
Figure 2—source data 1
Source data file for Figure 2.
- https://cdn.elifesciences.org/articles/60849/elife-60849-fig2-data1-v2.xlsx
Figure 2—figure supplement 1
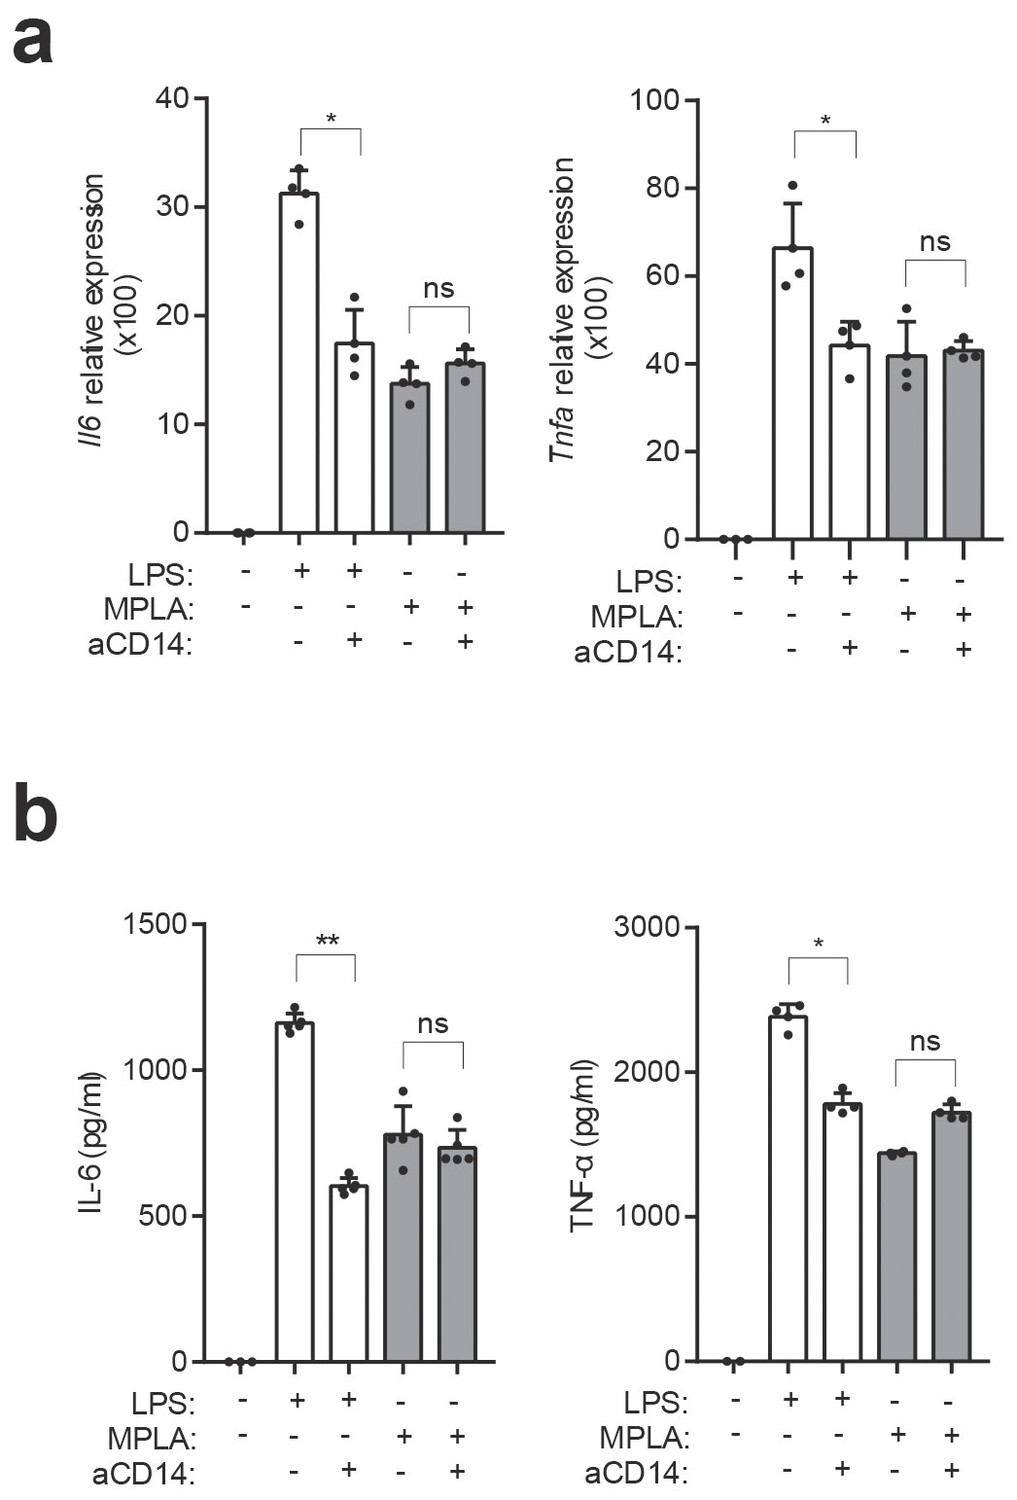
Anti-CD14 reduced LPS, but not MPLA, induced cytokine production.
(a) Expression of Il6 and Tnfa genes analyzed by qPCR from BMDM treated for 10 min with a blocking αCD14 antibody (clone M14-23, 20 μg/mL, 4°C), and then cells were incubated for 4 hr with LPS (10 ng/mL) or MPLA (1 μg/mL) at 37°C. (b) Release of IL-6 and TNF-α from BMDMs treated as in (a). Each dot represents a single independent experiment; mean ± standard error is represented in all panels; n = 4–5 independent experiments; *p<0.05; **p<0.01; ns, no significant difference (p>0.05); Mann–Whitney test.
Figure 3
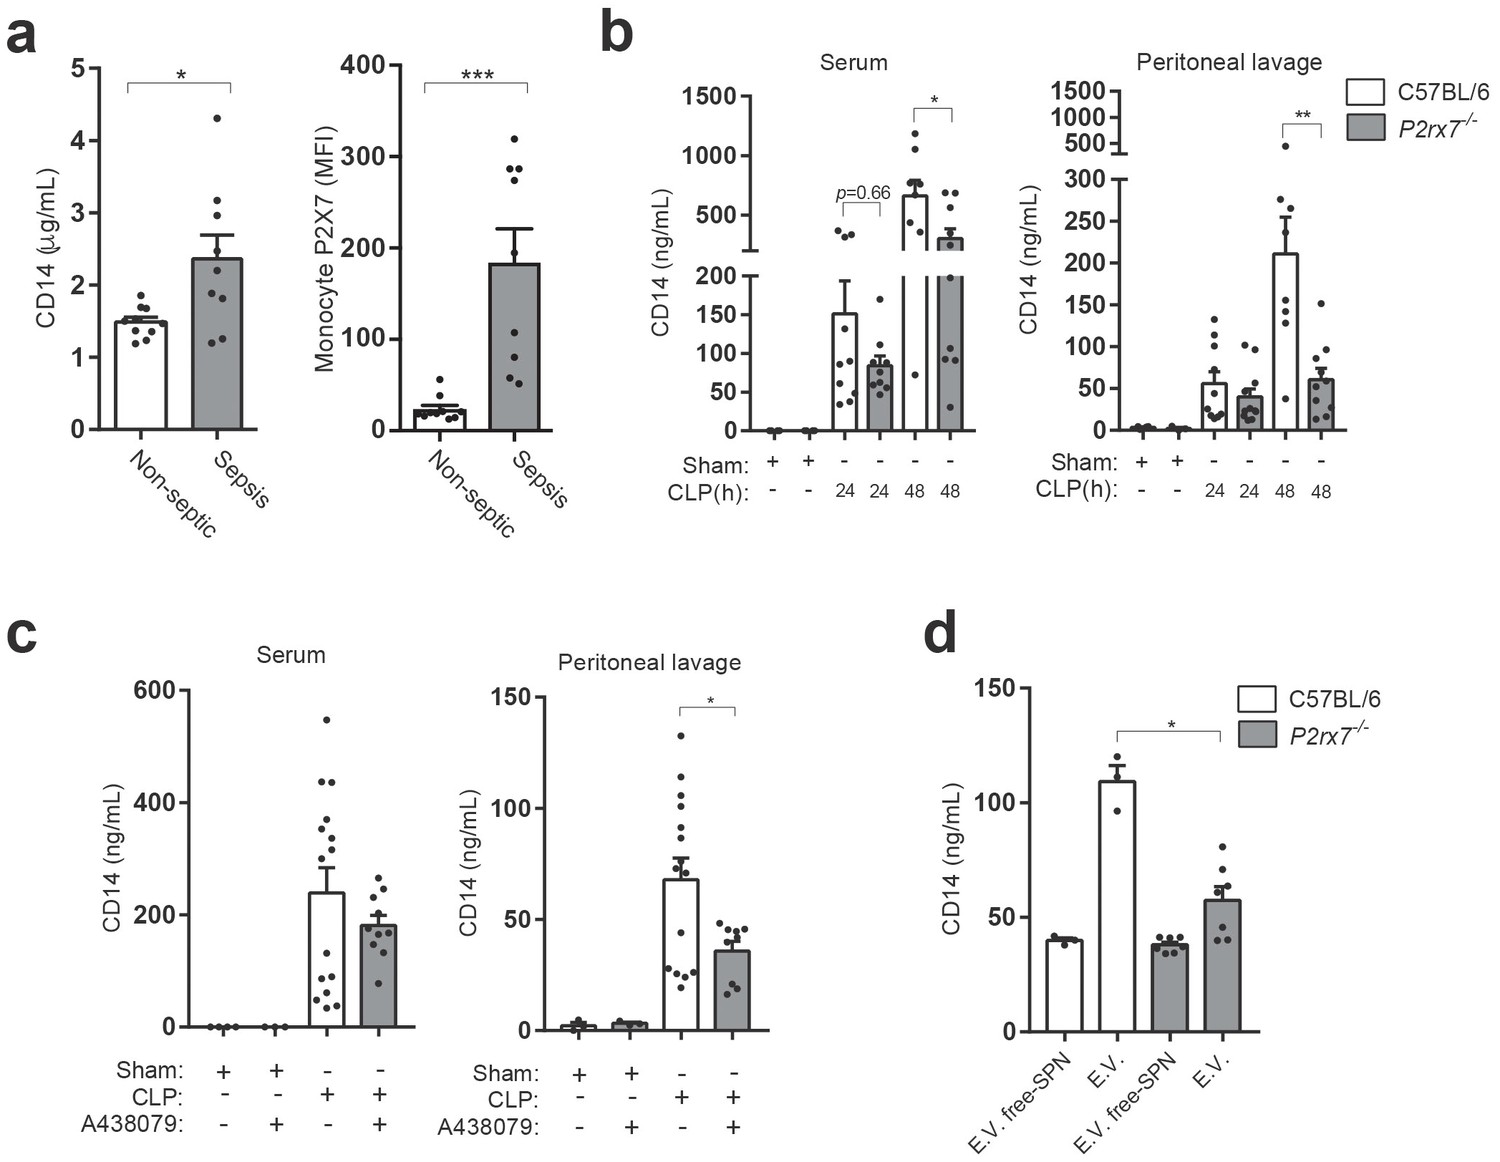
P2X7 receptor controls CD14 in extracellular vesicles during sepsis.
(a) Blood plasma concentration of CD14 (left) and quantification of P2X7 receptor mean fluorescence intensity (MFI) in monocytes (right) from non-septic donors and intra-abdominal origin septic patients within the first 24 hr of admission to the surgical unit. Each dot represents a donor or septic individual, n = 10. (b) CD14 concentration in the serum and peritoneal lavage of C57BL/6 (wild-type) and P2rx7−/− mice collected 24 and 48 hr after CLP measured by ELISA. (c) CD14 concentration in the serum and peritoneal lavage of C57BL/6 (wild-type) mice collected 24 hr after CLP, treated or not with A438079 (100 µM/kg) 1 hr before CLP. (d) CD14 concentration in extracellular vesicles (E.V.) isolated from the peritoneal lavage of C57BL/6 (wild-type) and P2rx7−/− mice collected 48 hr after CLP. For b–d, each dot represents a single mouse; data are represented as mean ± SEM; *p<0.05; **p<0.01; ***p<0.0001; Mann-Whitney test.
-
Figure 3—source data 1
Source data file for Figure 3.
- https://cdn.elifesciences.org/articles/60849/elife-60849-fig3-data1-v2.xlsx
Figure 4
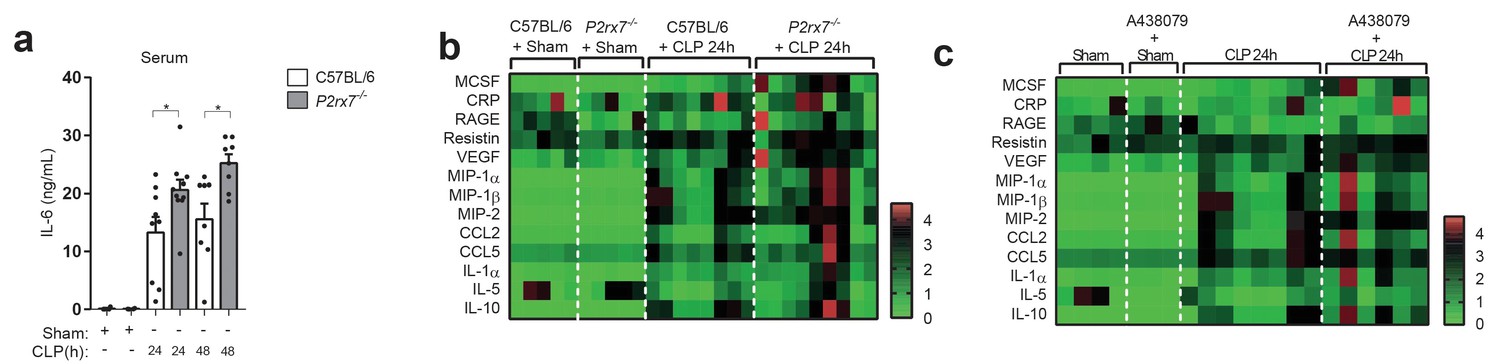
The deficiency or blocking of P2X7 receptor increases cytokine production during sepsis.
(a) ELISA of IL-6 in the serum of C57BL/6 (wild-type) and P2rx7−/− mice collected 24 and 48 hr after CLP; each dot represents a single mouse; data are represented as mean ± SEM; *p<0.05; Mann-Whitney test. (b,c) Heatmaps for the concentrations of different cytokines, chemokines and acute phase proteins as indicated in the serum of C57BL/6 (wild-type) and P2rx7−/− mice (b) or C57BL/6 treated with A438074 (100 µM/kg) (c) collected 24 hr after CLP. For (b,c) C57BL/6 sham n = 5 (b) and n = 4 (c); P2rx7−/− sham n = 5; sham+A438079 n = 3; C57BL/6 CLP n = 8 (b) and n = 8 (c); P2rx7−/− CLP n = 9; and C57BL/6 CLP+A438079 n = 6.
-
Figure 4—source data 1
Source data file for Figure 4.
- https://cdn.elifesciences.org/articles/60849/elife-60849-fig4-data1-v2.xlsx
Figure 5
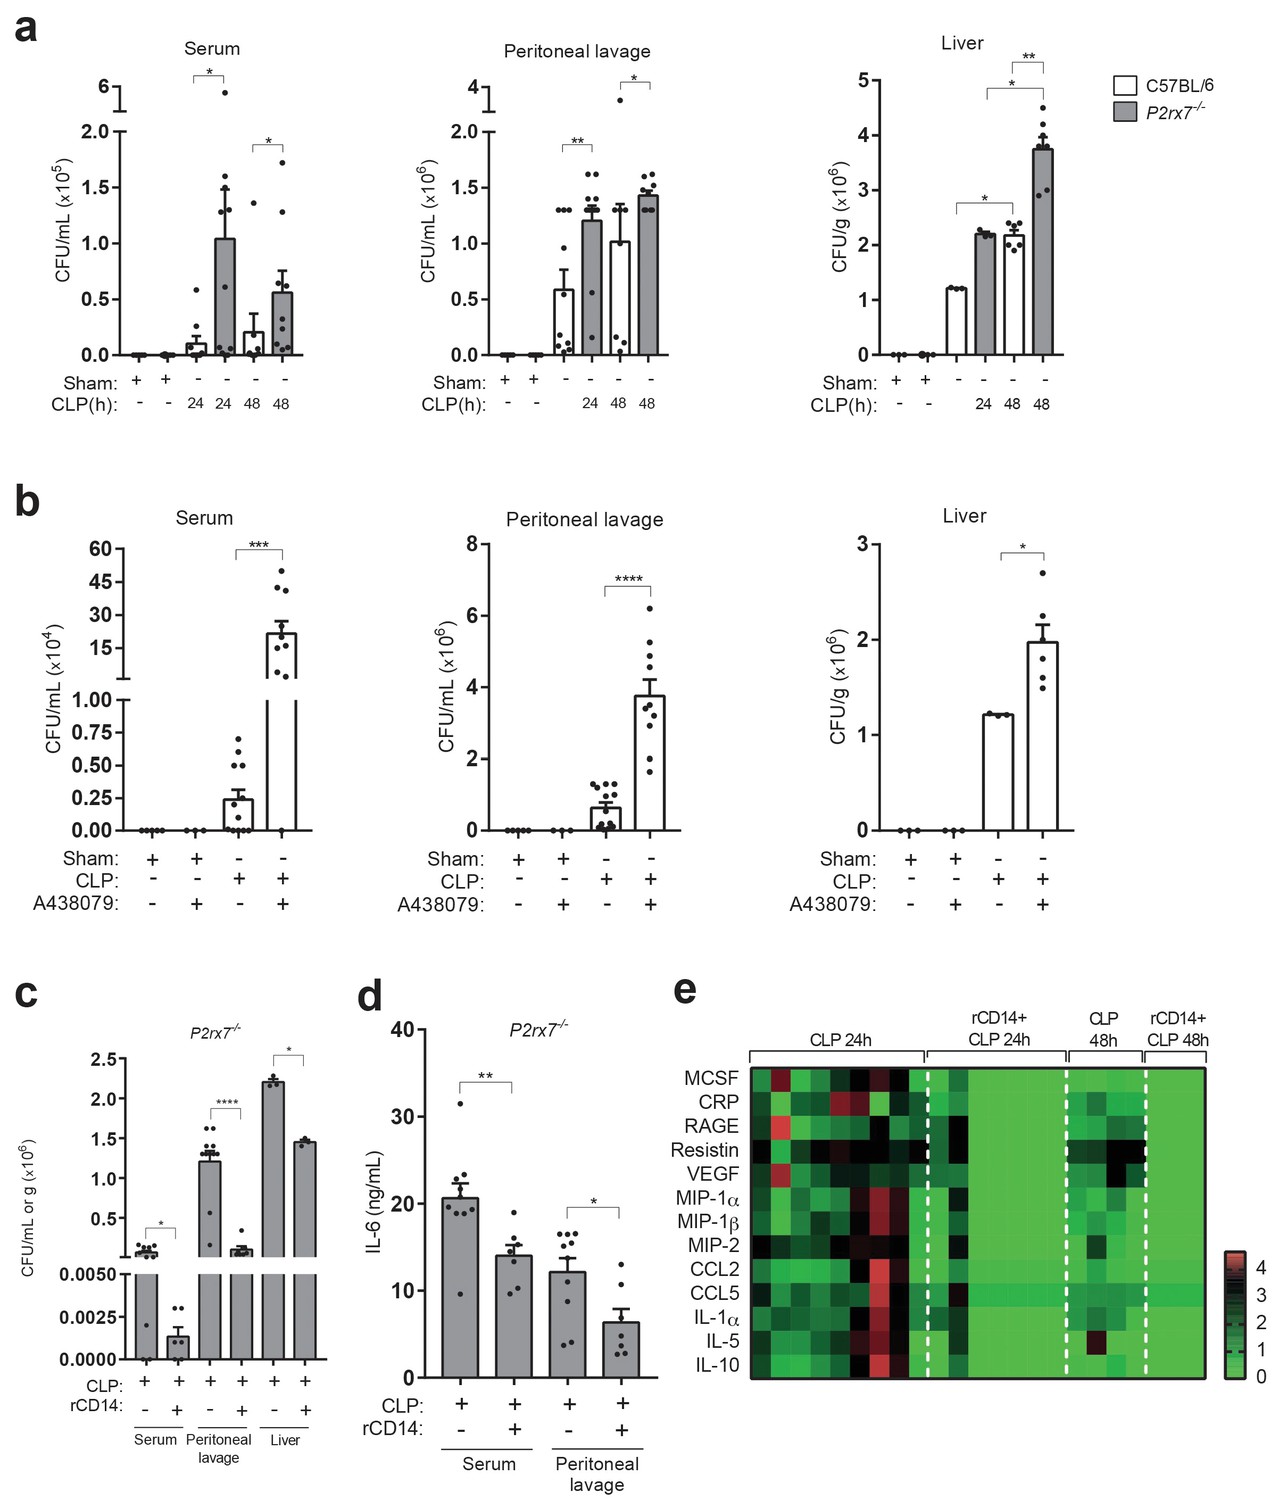
Extracellular CD14 limits bacterial dissemination and cytokine production during sepsis caused by P2X7 receptor deficiency.
(a) Bacterial load in serum, peritoneal lavage and liver homogenates from C57BL/6 (wild-type) and P2rx7−/− mice collected 24 and 48 hr after CLP. (b) Bacterial load in serum, peritoneal lavage, and liver homogenates from C57BL/6 (wild-type) mice treated with A438074 (100 µM/kg) and collected 24 hr after CLP. (c) Bacterial load in serum, peritoneal lavage and liver from P2rx7−/− mice treated with recombinant CD14 (rCD14, 10 µg/g) 30 min before CLP and collected 24 hr after CLP. (d) ELISA for IL-6 in serum and peritoneal lavage samples from P2rx7−/− mice collected 24 hr after CLP with or without treatment with recombinant CD14 (rCD14, 10 µg/g) 30 min before CLP; each dot represents a single mouse and data are represented as mean ± SEM. (e) Heatmaps for the concentrations of different cytokines, chemokines and acute phase proteins as indicated in the serum of P2rx7−/−mice treated with rCD14 as in (d) collected 24 and 48 hr after CLP. For a-d panels, each dot represents a single mouse and data are represented as mean ± SEM; *p<0.05; **p<0.01; ***p<0.001; ****p<0.0001; Mann-Whitney test.
-
Figure 5—source data 1
Source data file for Figure 5.
- https://cdn.elifesciences.org/articles/60849/elife-60849-fig5-data1-v2.xlsx
Figure 6 with 3 supplements
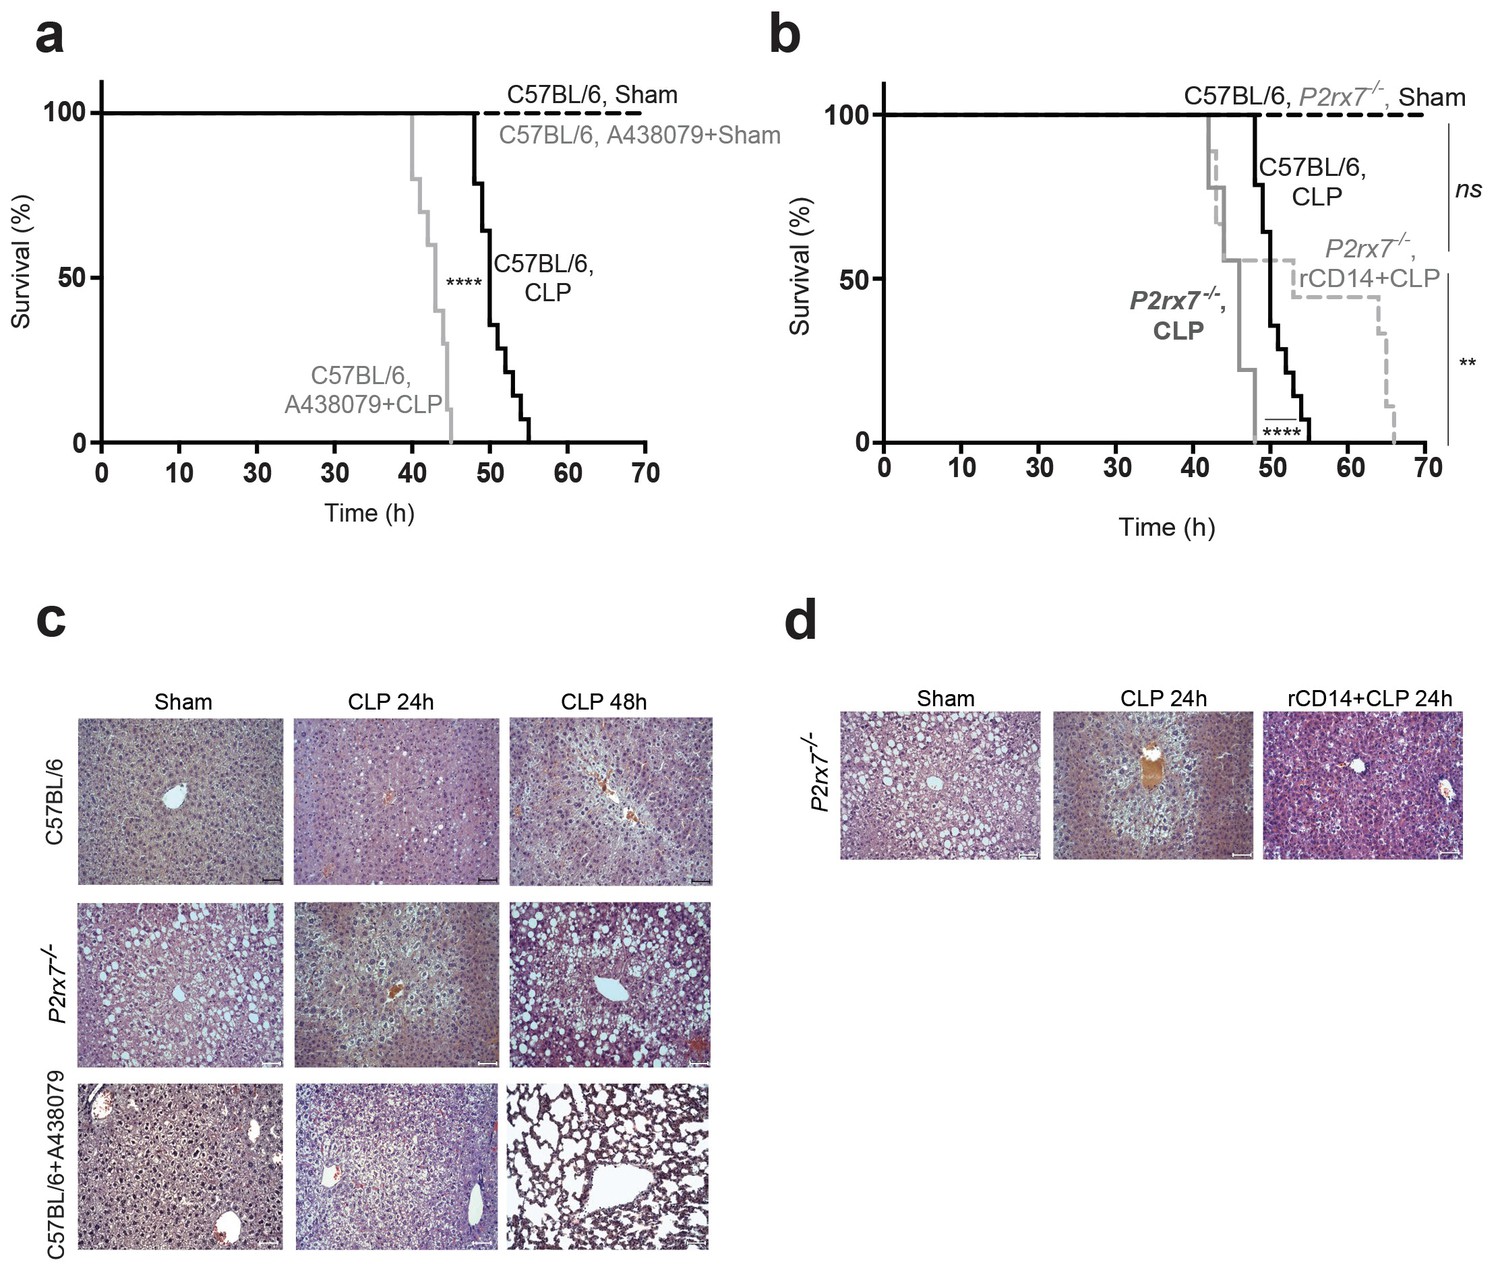
Release of P2X7 receptor-dependent CD14 during sepsis is important for survival.
(a) Kaplan-Meier analysis of C57BL/6 (wild-type) mice survival after sham operation or CLP, a group of mice were treated with A438074 (100 µM/kg) before CLP. Sham groups n = 6 each; CLP n = 14 and CLP+A438079 n = 10. (b) Kaplan-Meier analysis of C57BL/6 (wild-type) and P2rx7−/− mice survival after sham operation or CLP. A group of P2rx7−/− mice were treated with recombinant CD14 (rCD14, 10 µg/g) 30 min before CLP. Sham groups n = 4 each; CLP n = 14, CLP P2rx7−/−n = 9; and rCD14+CLP P2rx7−/−n = 9. (c,d) Representative images of hematoxylin and eosin-stained liver sections 24 and 48 hr after CLP of mouse groups described in (a,b); scale bar, 50 µm. CLP 24 hr n = 9; rCD14+CLP 24 hr n = 7; CLP 48 hr n = 4, rCD14+CLP 48 hr n = 3. *p<0.05; **p<0.01; ****p<0.0001; ns, no significant difference (p>0.05); Mann-Whitney test for (e) and Log-rank (Mantel-Cox) test for (a) and (b).
-
Figure 6—source data 1
Source data file for Figure 6.
- https://cdn.elifesciences.org/articles/60849/elife-60849-fig6-data1-v2.xlsx
Figure 6—figure supplement 1

Impact of P2X7 deficiency in sepsis.
(a) Normalized body weight (weight at different times/weight at the beginning, time 0: gt/g0) after sham operation or CLP for wild-type mice, wild-type treated with A438079, P2rx7−/− mice, P2rx7−/− mice with rCD14 treatment; data are represented as mean ± SEM of n = 6 animals per group, except n = 4 for the wild-type sham group treated with A438079. (b) Monitorization score of n = 5 mice per group. Animals were scored from the beginning of the study following individual values for: spiky hair, weight loss, ocular discharge, bending posture, ataxia, trembling, hypothermia, cyanosis, auto-mutilation, aggressive/comatose behavior, and stool type. When the score was between 4 and 10, the animal was supervised every hour. (c) Representative images of hematoxylin and eosin-stained liver, spleen, and lung sections from C57BL/6 (wild-type) and P2rx7−/− mice 24 and 48 hr after CLP. Scale bar 50 μm; images representative of n = 6 independent mice.
Figure 6—figure supplement 2
Impact of P2X7 antagonist A438079 in sepsis.
Representative images of hematoxylin and eosin-stained liver, spleen, and lung sections obtained 24 hr after CLP from C57BL/6 (wild-type) mice treated with A438079 (100 µM/kg) 1 hr before CLP. Scale bar 50 μm; images representative of n = 6 independent mice.
Figure 6—figure supplement 3
Impact of recombinant CD14 in sepsis.
Representative images of hematoxylin and eosin-stained liver, spleen, and lung sections obtained 24 hr after CLP from P2rx7−/− mice treated with recombinant CD14 (rCD14, 100 µg/g) 30 min before CLP. Scale bar 50 μm; images representative of n = 6 independent mice.
Tables
Key resources table
| Reagent type (species) or resource | Designation | Source or reference | Identifiers | Additional information |
|---|---|---|---|---|
| Strain, strain background (S. minnesota) | Monophosphoryl Lipid A (MPLA) | Invivogen | Cat#: tlrl-mpla | Cell culture: 1 µg/mL |
| Genetic reagent (Mus musculus, male) | P2RX7-deficient mice (P2rx7-/-) | Jackson laboratories | B6.129P2-P2rx7tm1Gab/J | In vivo mouse models and biological samples. RRID:IMSR_JAX:005576 |
| Antibody | Anti-MMR (rat monoclonal, clone MR5D3) | Acris antibodies | Cat#:SM1857P | WB (1:1000), RRID:AB_1611247 |
| Antibody | Anti-Cystatin B (rat monoclonal, clone 227818) | R&D Systems | Cat#: MAB1409 | WB (1:1000), RRID:AB_2086095 |
| Antibody | Anti-Cathepsin B (rat monoclonal, clone 173317) | R&D Systems | Cat#: MAB965 | WB (1:1000), RRID:AB_2086935 |
| Antibody | Anti-Peptidyl-prolyl cis-trans isomerase A (rabbit monoclonal) | Abcam | Cat#: ab41684 | WB (1:1000), RRID:AB_879768 |
| Sequence-based reagent | KiCqStart SYBR Green Primers | Sigma-Aldrich | Tnfa (NM_013693) Il-6 (NM_031168) Il1b (NM_008361) | qRT-PCR |
| Peptide, recombinant protein | Human sCD14 recombinant protein | Preprotech | Cat#: 110–01 | In vivo: 10 µg/g RRID:AB_2877062 |
| Commercial assay, kit | ExoQuick-TC ULTRA EV isolation kit | System Biosciences (SBI) | Cat#: EQULTRA-20TC-1 | Extracellular vesicle isolation |
| Commercial assay, kit | Mouse CD14 DuoSet Elisa kit | R&D Systems | Cat#:DY982 | Detection of CD14 in biological fluids and culture supernatants. RRID:AB_2877065 |
| Commercial assay, kit | Magnetic Luminex Assay | R&D Systems | Cat#: LXSAMSM-15 | Multiplex for mice serum |
| Chemical compound, drug | ATP | Sigma-Aldrich | A2383-5G | Cell culture: 3 mM For FACS: 5 mM |
| Chemical compound, drug | A438079 | Tocris | Cat#: 2972 | Cell culture: 10–20 µM In vivo: 100 µg/kg For FACS: 10 µM |
| Software, algorithm | NTA 3.1 software | Nano Sight Technology | NS300 instrument | Nanoparticle tracking analysis, RRID:SCR_014239 |
Additional files
-
Supplementary file 1
Demographics and clinical features of enrolled healthy volunteers and patients with intra-abdominal sepsis.
Table 2. Histopathology scoring (average of n = 3 animals/group).
- https://cdn.elifesciences.org/articles/60849/elife-60849-supp1-v2.docx
-
Transparent reporting form
- https://cdn.elifesciences.org/articles/60849/elife-60849-transrepform-v2.pdf
Download links
A two-part list of links to download the article, or parts of the article, in various formats.
Downloads (link to download the article as PDF)
Open citations (links to open the citations from this article in various online reference manager services)
Cite this article (links to download the citations from this article in formats compatible with various reference manager tools)
CD14 release induced by P2X7 receptor restricts inflammation and increases survival during sepsis
eLife 9:e60849.
https://doi.org/10.7554/eLife.60849


