Gradual compaction of the nascent peptide during cotranslational folding on the ribosome
- Department of Physical Biochemistry, Max Planck Institute for Biophysical Chemistry, Germany
- III. Institute of Physics - Biophysics, Georg August University, Germany
Figures
Figure 1 with 1 supplement
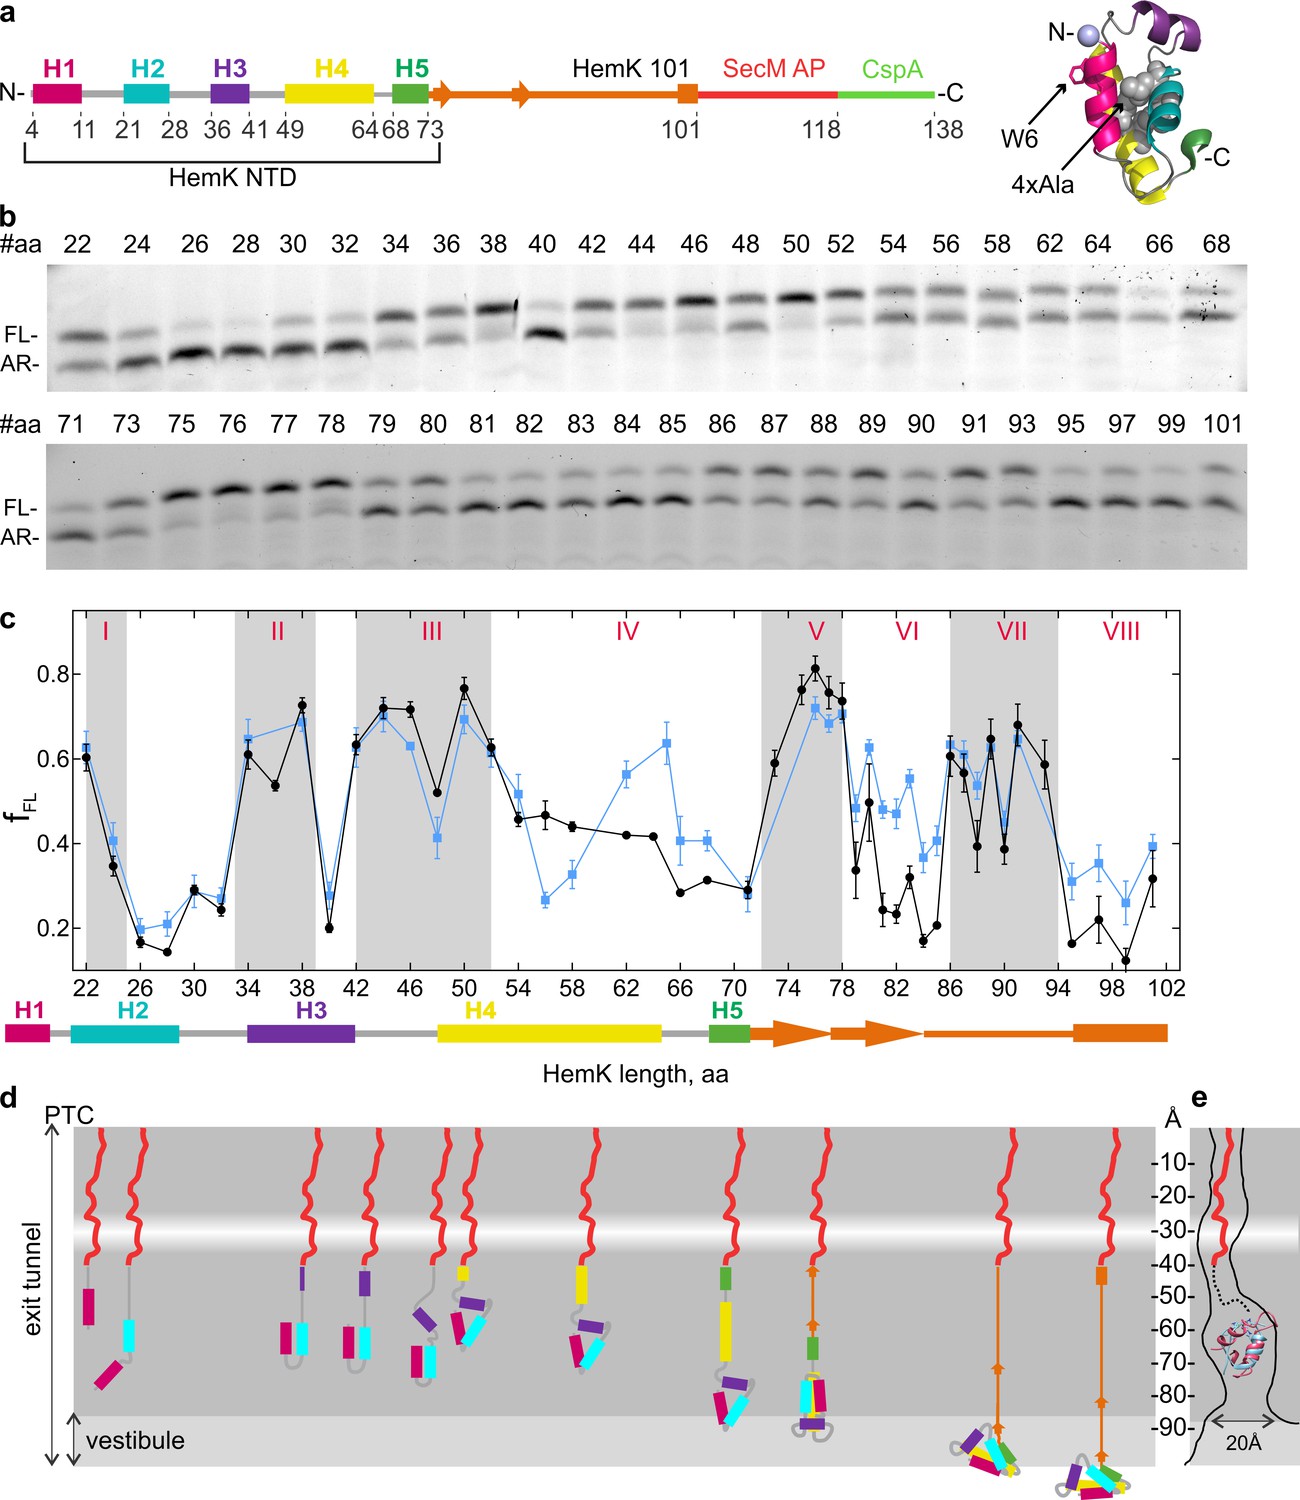
Co-translational folding of HemK NTD revealed by high-resolution FPA.
(a) Schematic representation of the FPA sensor. HemK NTD helices (H) 1–5, the C-terminal linker (orange), SecM arrest peptide (red), and CspA (green) (left) and crystal structure of HemK NTD (PDB ID: 1T43) (right). The mutations introduced in the 4xA variant (L27A, L28A, L55A, L58A) are shown in gray and the N-terminal fluorophore position is shown in lilac. (b) SDS-PAGE of in vitro translation products for the FPA construct of wt HemK. The length of the nascent chain from the N-terminus to SecM AP is indicated (#aa). FL, full-length product; AR, arrested peptide. For controls with shorter nascent chains, see Figure 1—figure supplement 1d. (c) Force profile of HemK NTD folding. fFL is the fraction of the full-length product formed during in vitro translation. Black, HemK wt; blue, HemK 4xA mutant; error bars indicate standard error of mean calculated from three independent biological replicates (N = 3).The schematic underneath shows the potential secondary structure of HemK at the indicated aa chain length. (d) Schematic diagram of HemK NTD compaction events during translation; color code as in (a). The constriction site is indicated by a white band. (e) Schematic overlay of the HemK H1-H3 crystal structure (pink) (PDB ID: 1T43) and ADR1 Zn finger domain crystal structure (blue) inside the peptide exit tunnel, 60–80 Å from the PTC (Nilsson et al., 2015) (PDB ID: 2ADR; EM map: EMD-3079).
-
Figure 1—source data 1
Numerical values of HemK wt and 4xA variant FPA f_FL.
- https://cdn.elifesciences.org/articles/60895/elife-60895-fig1-data1-v1.xlsx
Figure 1—figure supplement 1
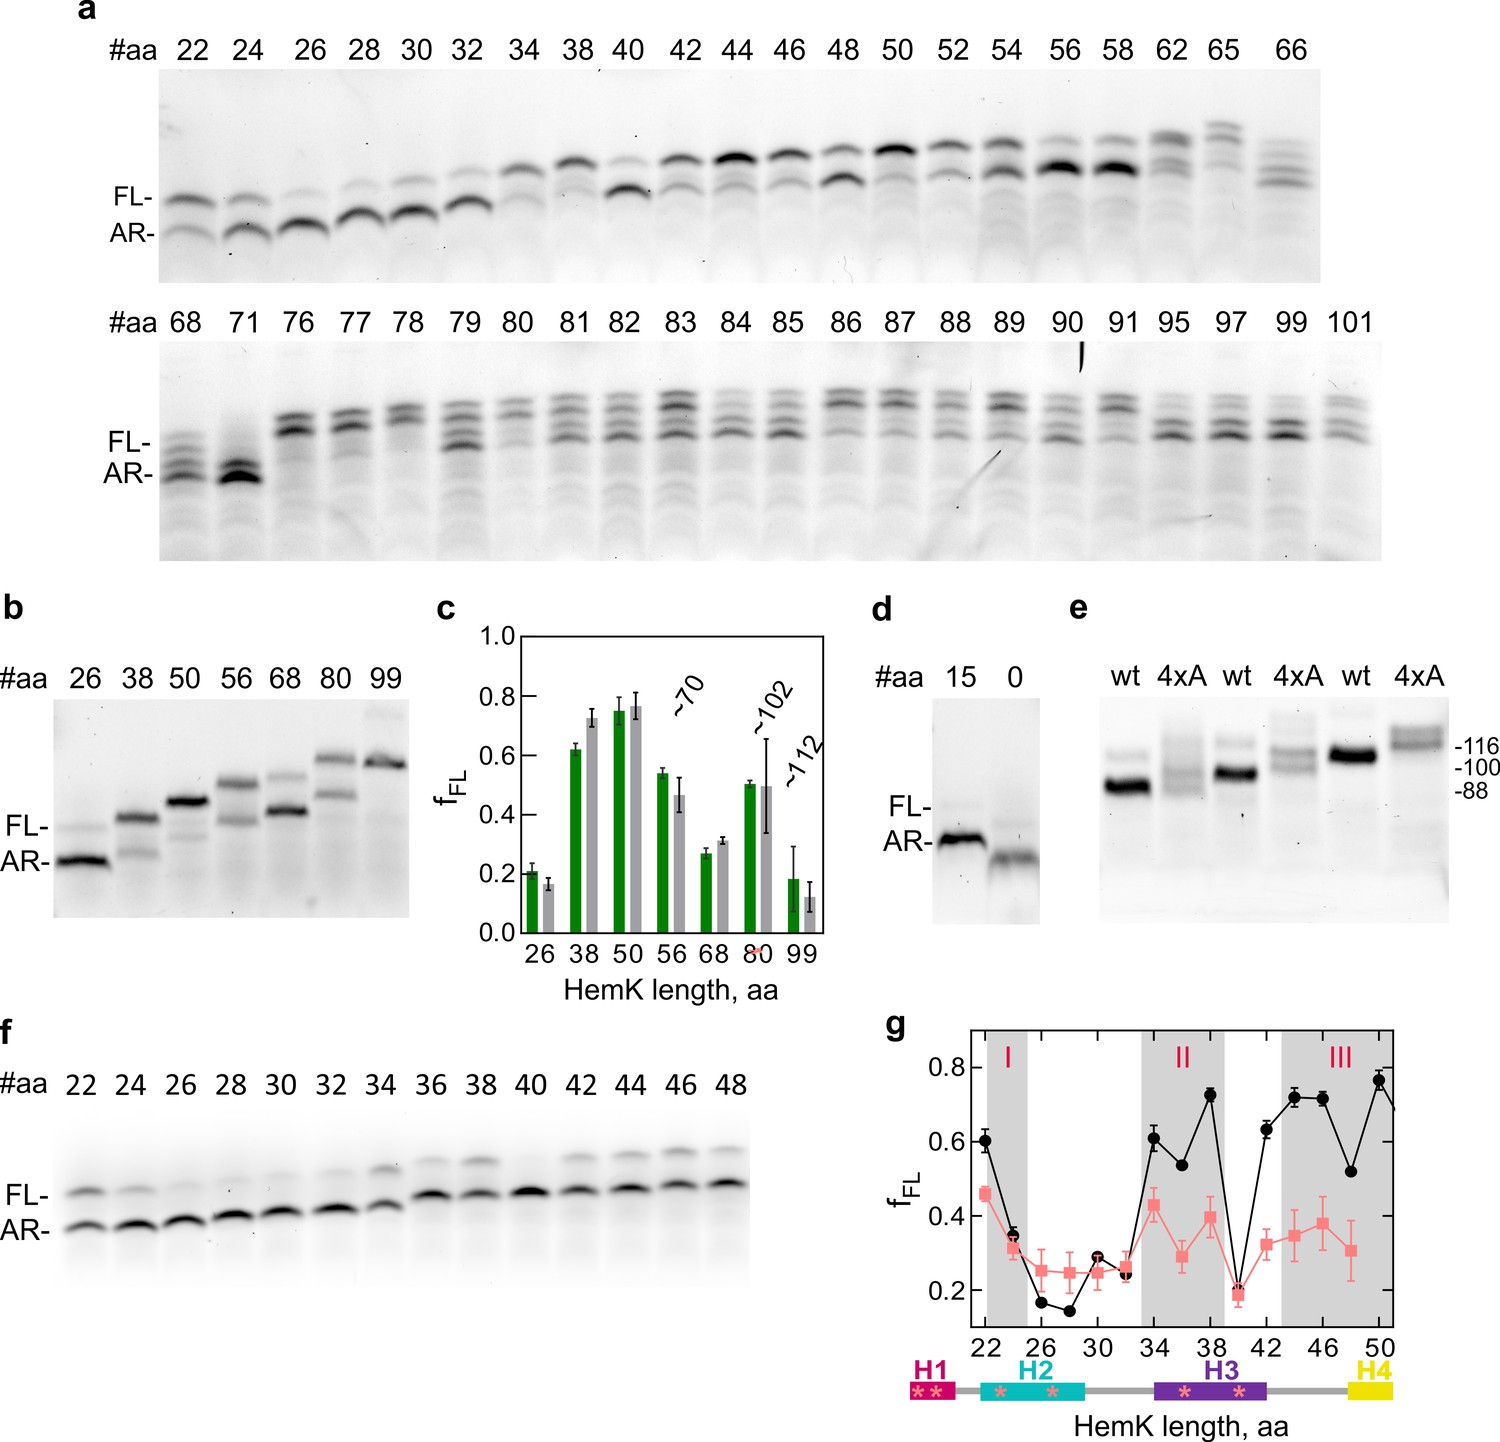
Representative SDS PAGE of FPA for HemK 4xA variant.
Abbreviations as in Figure 1. (a) Representative SDS PAGE of FPA for HemK 4xA variant (b) Representative SDS PAGE of FPA for HemK W6F variant (c) Calculation of fraction of full-length (fFL) product of HemK W6F (green) compared with wt (gray). Approximate HemK PET-FCS construct lengths indicated on graph. Error bars indicate standard error of mean calculated from three independent biological replicates (N = 3) (d) Representative SDS PAGE of the translation product of the mRNA truncated after codon 15 of HemK sequence (15 aa) and SecM arrest peptide only control (0 aa) (e) SDS PAGE of HemK wt and 4xA constructs at lengths 116, 100 and 88, HemK length indicated on the right. (f) Representative SDS PAGE of FPA for HemK Pro variants. The positions of Pro substitutions are indicated in Supplementary file 1 - table 11. (g) Calculation of fraction of full-length (fFL) product of HemK Pro (salmon) compared with wt (black). Error bars indicate standard error of mean calculated from three independent biological replicates (N = 3). The schematic below the graph shows the positions of prolines (stars) mapped on the secondary structure of the N-terminal part of HemK NTD.
-
Figure 1—figure supplement 1—source data 1
Numerical values of HemK W6F and Pro variant FPA f_FL.
- https://cdn.elifesciences.org/articles/60895/elife-60895-fig1-figsupp1-data1-v1.xlsx
Figure 2
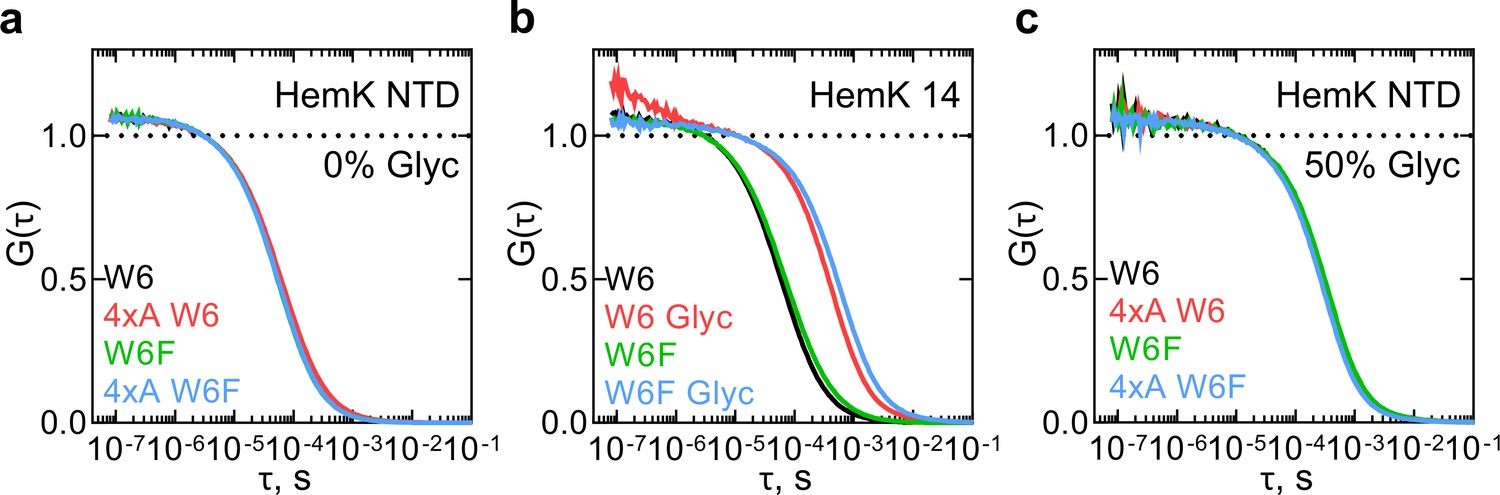
Monitoring dynamics of HemK constructs in solution by PET-FCS.
(a) ACF of the HemK NTD free in solution. Black, wt variant with Trp at position 6 (W6); red, destabilized 4xA HemK W6 variant; green, HemK wt with no Trp in the nascent chain (W6F); blue, 4xA HemK W6F variant; each curve is derived from two separate release experiments and each experiment consists of at least four technical replicates (N ≥ 8). (b) Autocorrelation curves of HemK14 peptide in solution. Black, W6 variant at low solvent viscosity; red, W6 at high viscosity in the presence of 50% glycerol (Glyc); green, W6F variant at low viscosity; blue, W6F variant at high viscosity. Shown are representative curves of at least two experimental repeats, each consisting of at least four technical replicates (N ≥ 8). (c) Autocorrelation curves of HemK NTD released from the ribosome at high viscosity conditions (50% glycerol). Black, wt W6; red, 4xA W6; green, wt W6F; blue, 4xA W6F. Each curve is derived from two separate release experiments and each experiment consists of at least four technical replicates (N ≥ 8).
-
Figure 2—source data 1
Numerical values of the calculated autocorrelation functions of HemK constructs in solution.
- https://cdn.elifesciences.org/articles/60895/elife-60895-fig2-data1-v1.xlsx
Figure 3 with 1 supplement
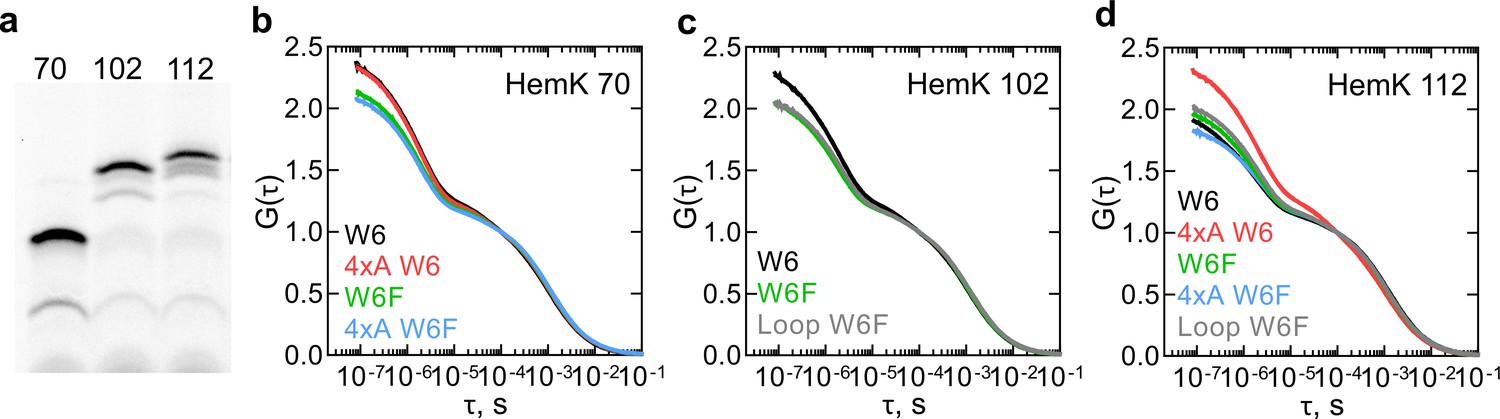
Dynamics of HemK on the ribosome monitored by PET-FCS.
(a) SDS PAGE of nascent chains produced by in vitro translation visualized after RNC purification using the fluorescence of ATTO655. The aa length of HemK wt constructs is indicated. (b) Autocorrelation curves for HemK 70-RNC. Black, wt W6; red, 4xA W6; green, wt W6F; blue, 4xA W6F. Each curve is derived from at least two separate RNC preparations and each experiment consists of at least four technical replicates (N ≥ 8). (c) Autocorrelation curves for HemK 102-RNC. Black, wt W6, green, wt W6F; gray, W6F variant with loop extension between helix 3 and helix 4. Each curve is derived from at least two separate RNC preparations and each experiment consists of at least four technical replicates (N ≥ 8). (d) Autocorrelation curves for HemK 112-RNC. Black, wt W6; red, 4xA W6; green, wt W6F; blue, 4xA W6F; gray, W6F variant with a loop extension between helix 3 and helix 4. Each curve is derived from a minimum of two separate RNC preparations and each experiment consists of at least four technical replicates (N ≥ 8).
-
Figure 3—source data 1
Numerical values of the calculated autocorrelation functions of HemK variants on the ribosome.
- https://cdn.elifesciences.org/articles/60895/elife-60895-fig3-data1-v1.xlsx
Figure 3—figure supplement 1
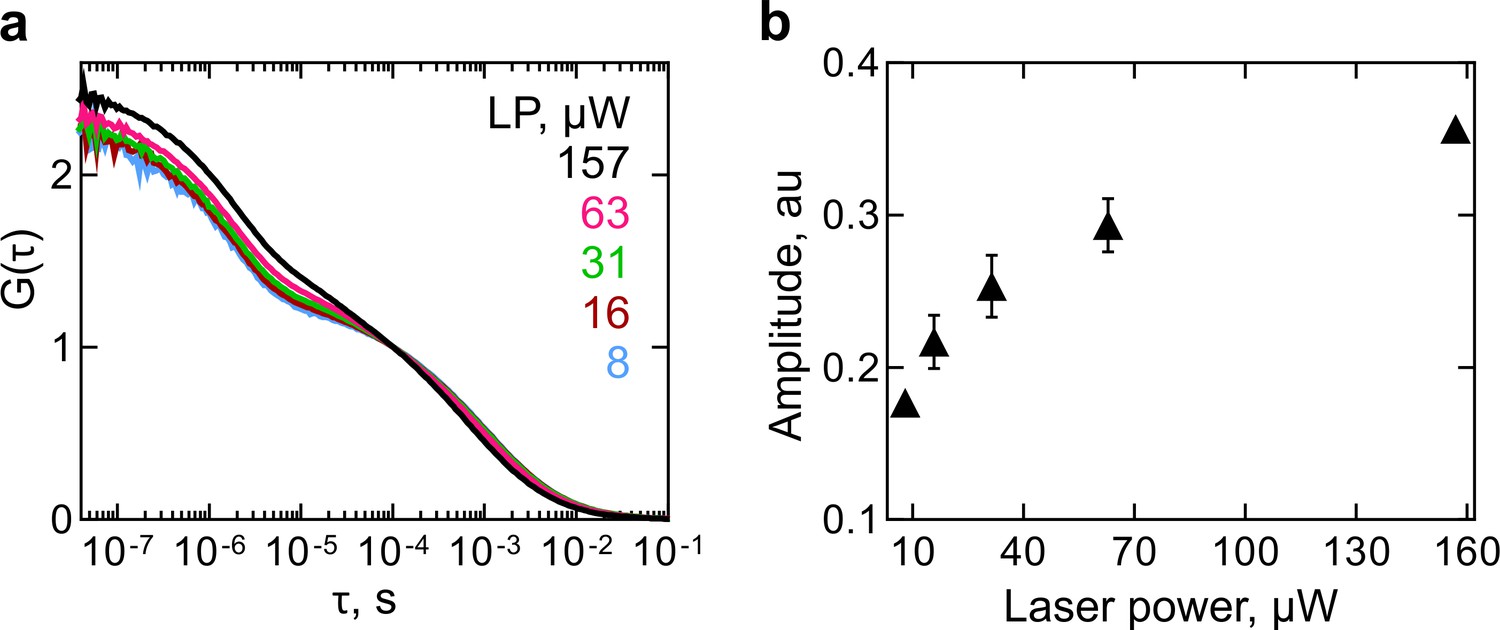
ATTO 655 triplet state in RNC.
(a) Autocorrelation curves of HemK102 wt RNC measurements at increasing laser power (LP). (b) Amplitude of the triplet state relaxation time.
Figure 4 with 4 supplements

Conformational dynamics of RNCs carrying various nascent chains.
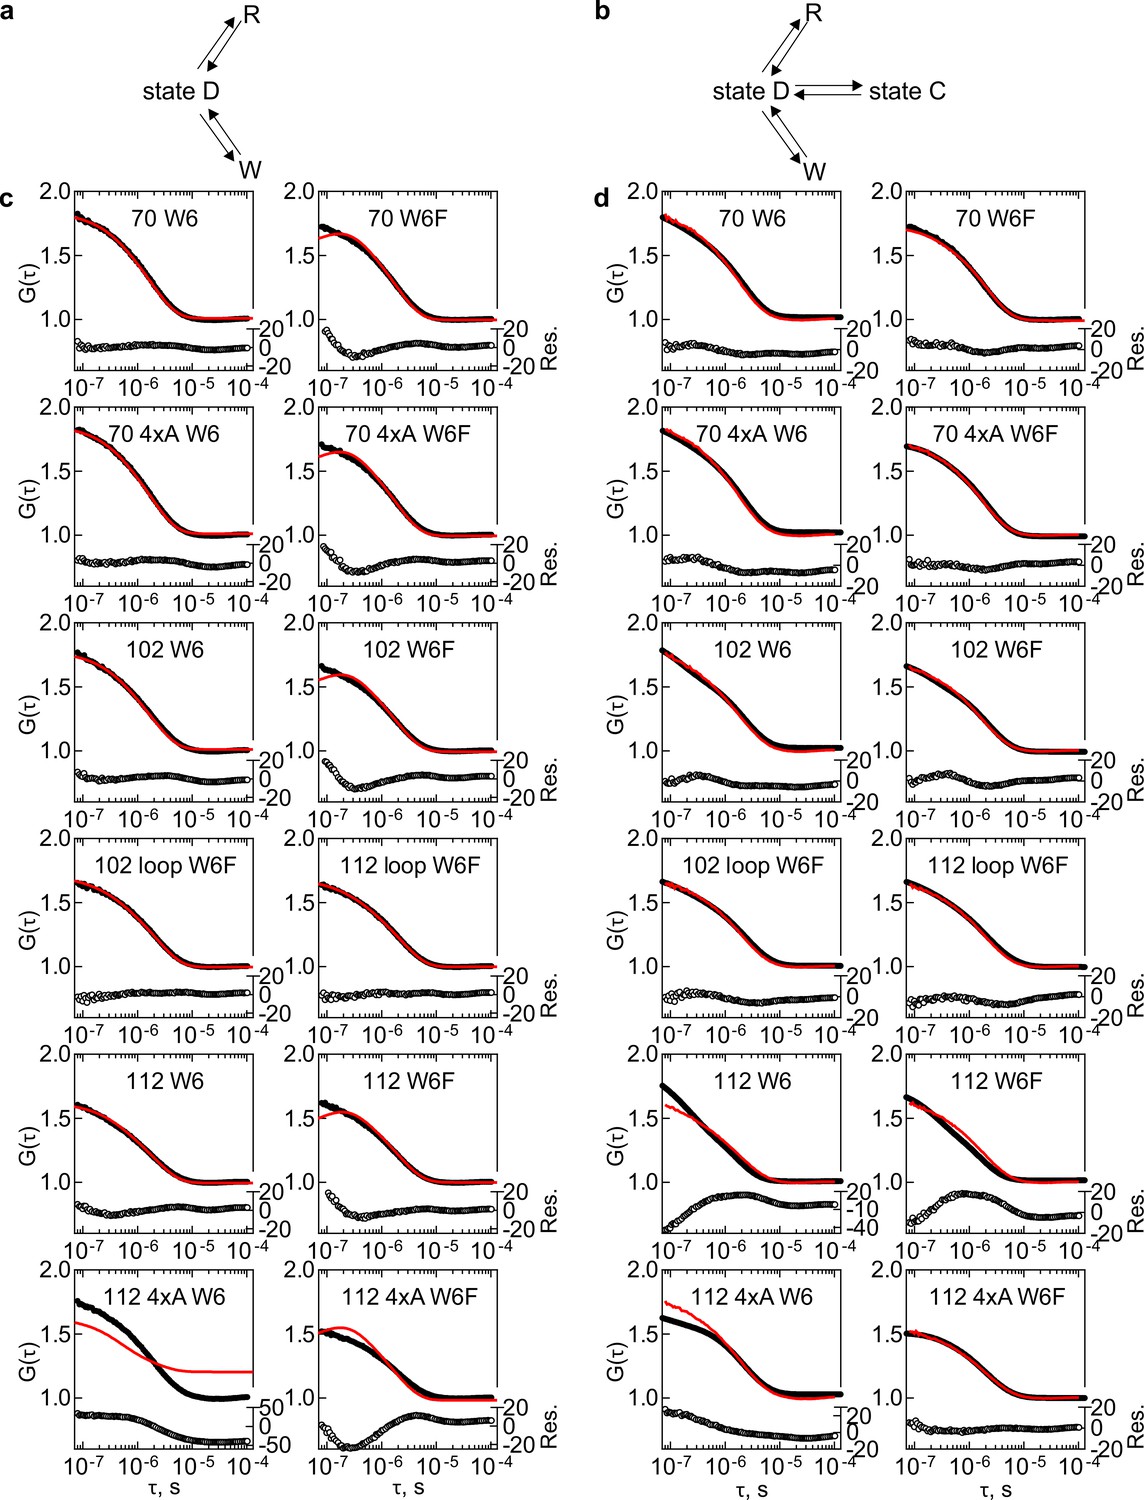
Shown are the results of global fitting of autocorrelation data to the kinetic model 5e-H (right panel). Black – measured data; red – kinetic model simulation curve. C and D are two peptide conformations; Wx –Trp-quenched states; Rx – ribosome-quenched states. Cartoons indicate the presumed position of the nascent chains on the ribosome, with the wt nascent chains shown in magenta, without and with an extra loop, and the 4xA variant shown in blue. (a) HemK 70 W6 and W6F. (b) HemK 70 4xA W6 and W6F. (c) HemK 102 W6 and W6F. (d) HemK 102 and 112, both W6F, with loop extensions. (e) HemK 112 W6 and W6F. (f) HemK 112 4xA W6 and W6F.
Figure 4—figure supplement 1
Global fitting of HemK RNC dataset B to kinetic models 2e and 3e.
(a) Kinetic Model 2e: nascent chain – state C; Trp-quenched state - W, ribosome-quenched state - R. (b) Kinetic model 3e: nascent chain – state C and state D; W and R same as in a. (c) Results of global fitting of autocorrelation data to kinetic model in 2e, shown in a. Plotted on the left-hand y axis: black – measured data, red – kinetic model simulation curve, On the right-hand y axis in open circles – residual values (Res.); Each graph shows a different RNC construct as indicated. (d) Results of global fitting to kinetic model 3e, shown in b. Graph legend as in c.
Figure 4—figure supplement 2
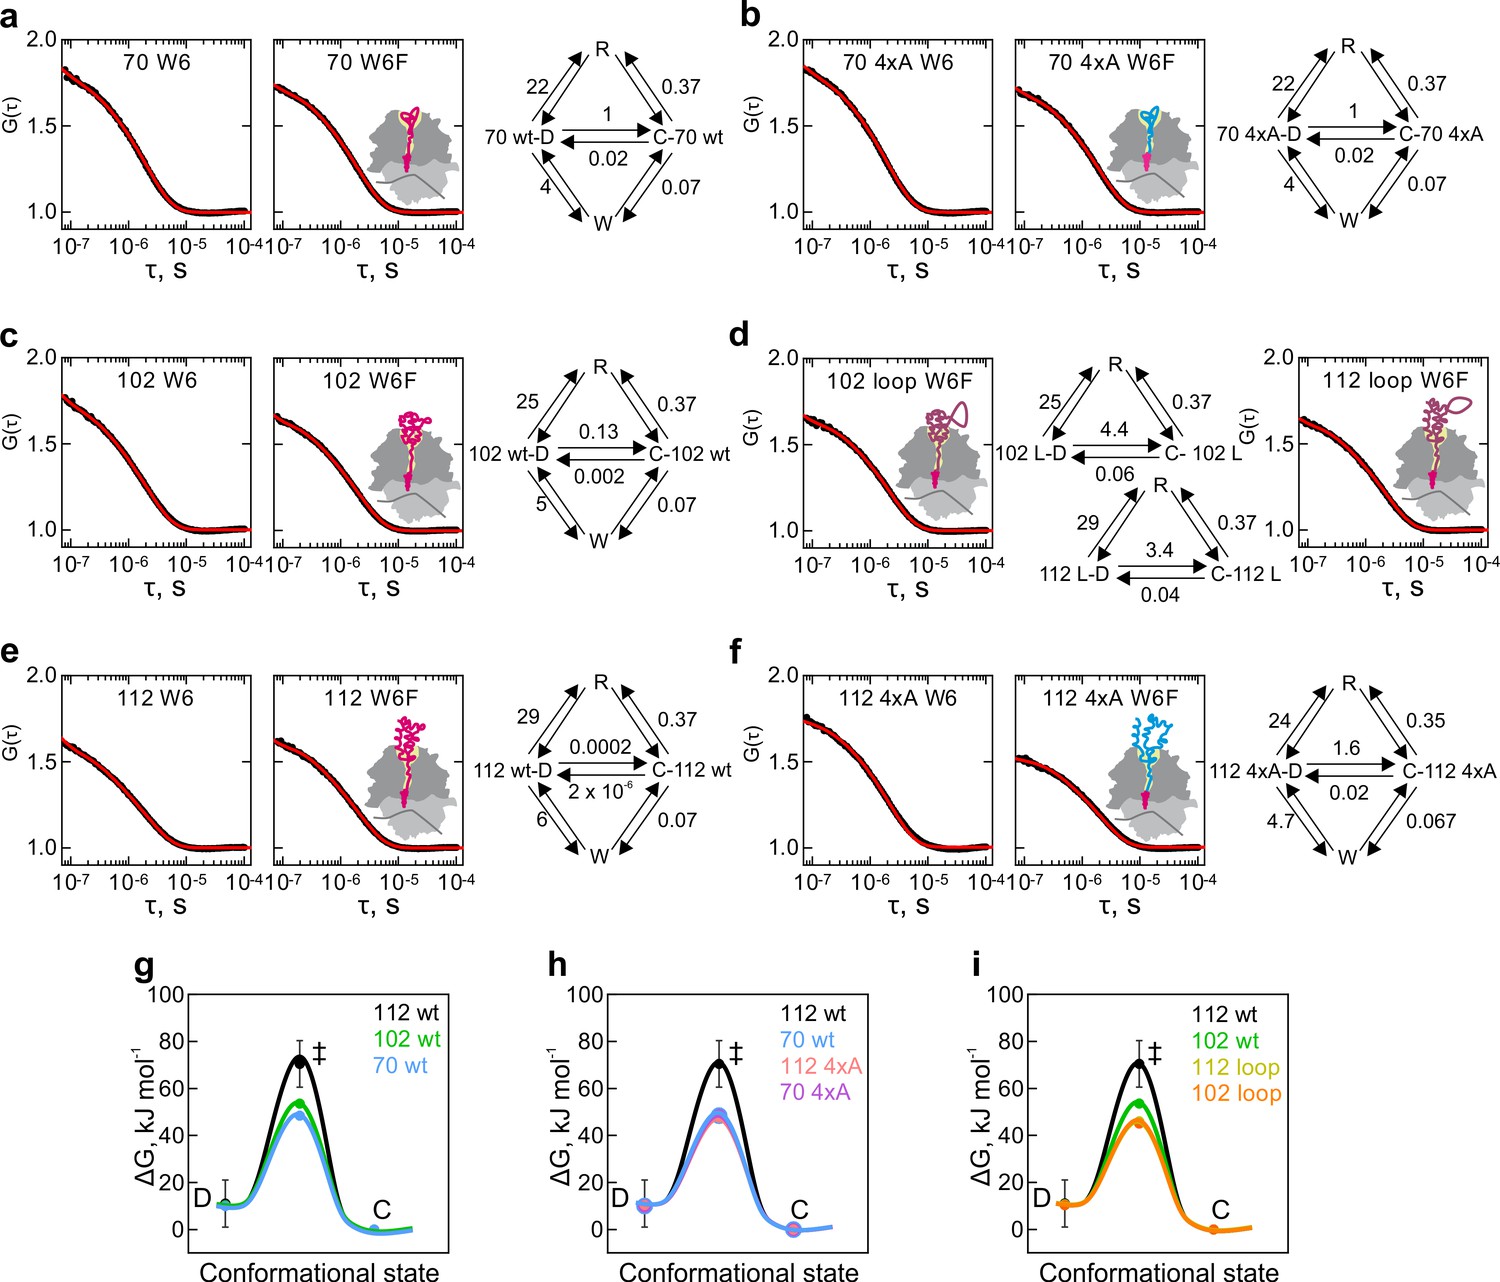
Results of global fitting of HemK dataset B to kinetic model 5e-O.
Black – measured data; red – kinetic model simulation curve. C and D are peptide conformations; W –Trp-quenched state; R – ribosome-quenched state. Cartoons illustrate the likely nascent-chain position on the ribosome, the wt nascent chains are in magenta, without and with an extra loop; the 4xA variant is shown blue. (a) HemK 70 W6 and W6F. (b) HemK 70 4xA W6 and W6F. (c) HemK 102 W6 and W6F. (d) HemK 102 and 112, both W6F, with loop extensions. (e) HemK 112 4xA W6 and W6F. (f) HemK 112 4xA 4xA W6 and W6F. Free-energy barriers between different chain conformations calculated from model 5e-O rates, values and SEM shown in Supplementary file 1 - Table 9. (g) HemK wt constructs of increasing length, 70 aa (blue), 102 (green), and 112 (black). (h) HemK wt and 4xA variants, 70 wt (blue) 70 4xA (lilac), 112 (black), and 112 4xA (red). (i) HemK wt and loop variants, 102 wt (green), 112 wt (black), 102 loop (orange), and 112 loop (yellow).
Figure 4—figure supplement 3
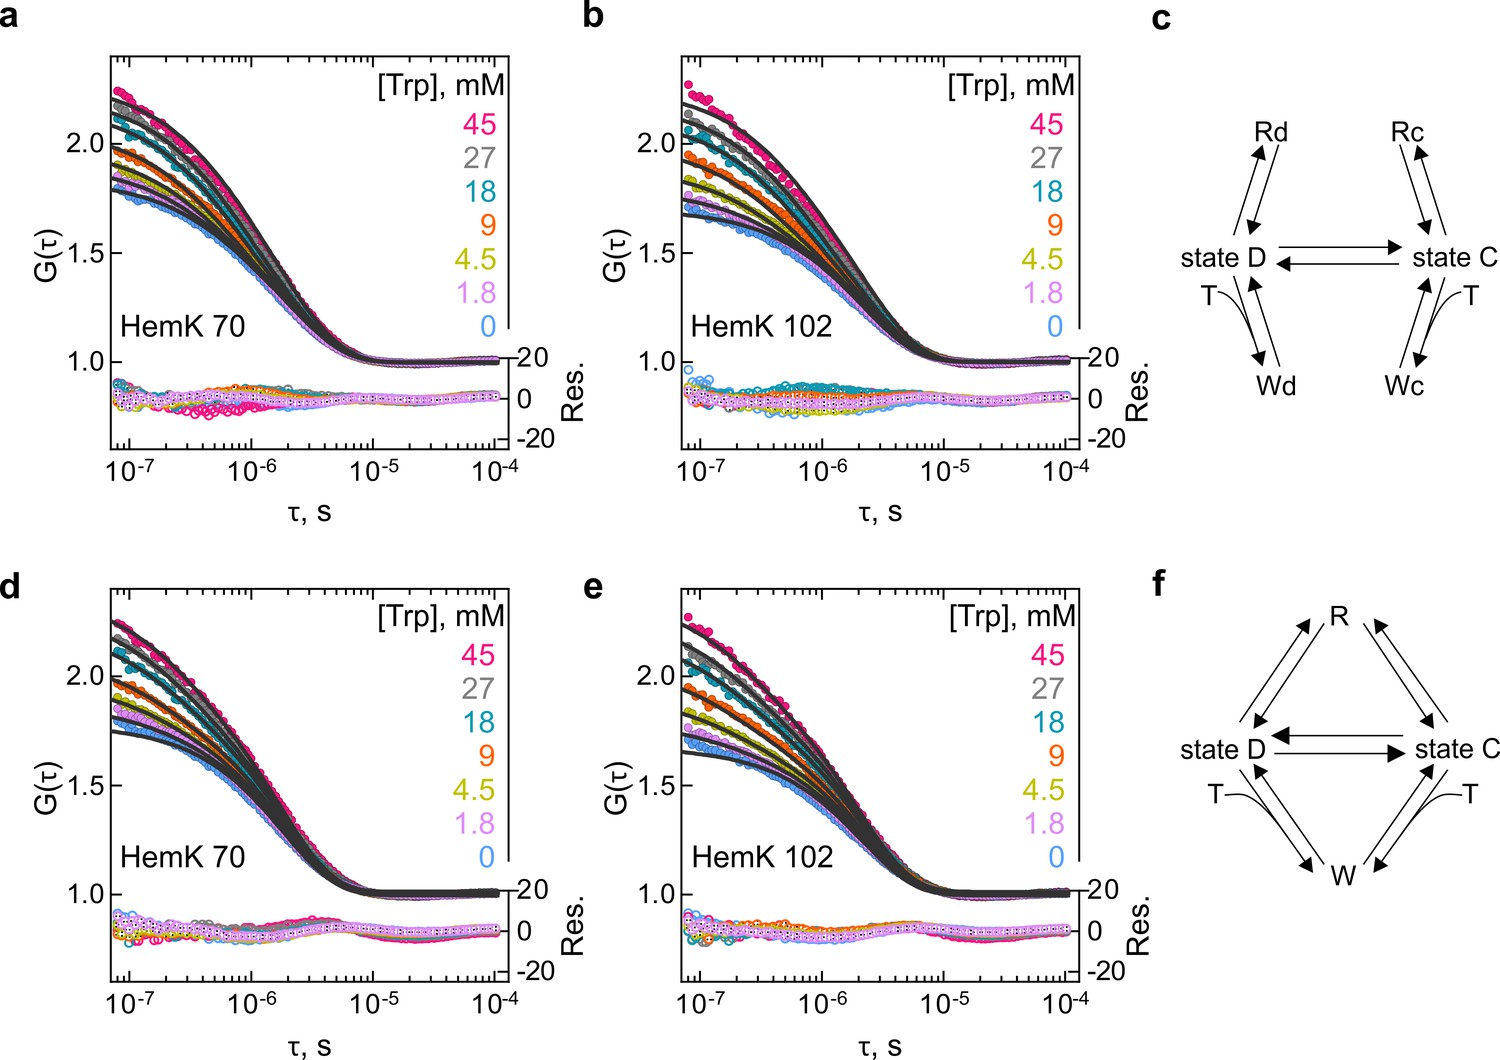
Global fitting of autocorrelation curves for HemK W6F RNCs with increasing free Trp concentration.
Free Trp concentration is indicated on the right of each graph. (a) HemK 70 W6F RNC, fitted to model 5e-H (c). (b) HemK 102 W6F RNC, fitted to model 5e-H (c). (c) Global fit kinetic model 5e-H. Nascent-chain conformational states – state D and state C; ribosome quenched states Rd and Rc, Tryptophan quenched states Wd and Wc; Tryptophan in solution T. (d) HemK 70 W6F RNC, fitted to model 5e-O (f). (e) HemK 102 W6F RNC, fitted to model 5e-O (f). (f) Global fit kinetic model 5e-O.
Figure 4—figure supplement 4

Plots of residuals from the kinetic model 5e fittings of the HemK RNC dataset B.
(a) Residuals of fits to model 5e-H. (b) Residuals of fits to model 5e-O.
Figure 5
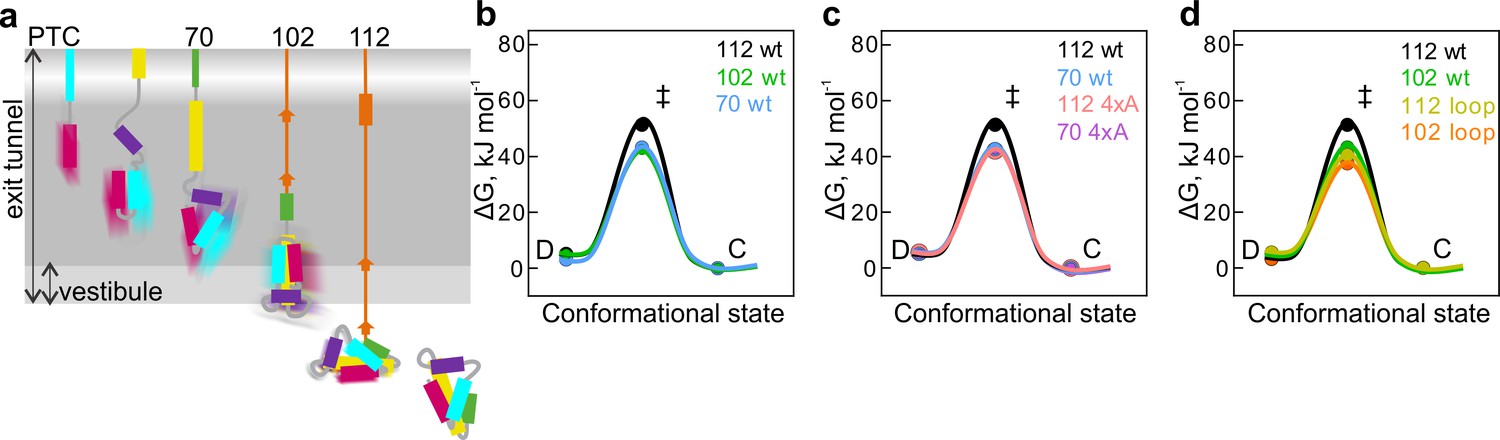
Free-energy barriers between different nascent-chain conformations D-dynamic state; C – compact state; ‡ - transition state.
Error bars are smaller than data points and represent propagated SEM from elemental rates derived from the kinetic fits to model 5e-H. (a) Schematic diagram of cotranslational folding steps of HemK NTD with a visualization of nascent-chain dynamics. (b) HemK wt constructs of increasing length, 70 aa (blue), 102 (green), and 112 (black). (c) HemK wt and 4xA variants, 70 wt (blue) 70 4xA (lilac), 112 (black), and 112 4xA (red). (d) HemK wt and loop variants, 102 wt (green), 112 wt (black), 102 loop (orange), and 112 loop (yellow).
Tables
Key resources table
| Reagent type (species) or resource | Designation | Source or reference | Identifiers | Additional information |
|---|---|---|---|---|
| Recombinant DNA reagent | HemK wt plasmid | DOI: 10.1126/science.aad0344 | ID_ECBD_2409 | |
| Recombinant DNA reagent | HemK 4xA plasmid | DOI: 10.1126/science.aad0344 | ||
| Recombinant DNA reagent | HemK looped plasmid | This paper | Methods: HemK constructs for PET and FPA; Supplementary file 1 - table 10 | |
| Recombinant DNA reagent | HemK 4xA FPA plasmid | This paper | Methods: HemK constructs for PET and FPA; Supplementary file 1 - table 11 | |
| Recombinant DNA reagent | HemK wt FPA plasmid | This paper | Methods: HemK constructs for PET and FPA; Supplementary file 1 - table 11 | |
| other | Purified E. coli in vitro translation system | DOI: 10.1073/pnas.92.6.1945; 10.1021/ja407511q; 10.1126/science.1229017; 10.1126/science.aad0344; 10.1016/S0076-6879 (07)30001–3 | ||
| Chemical compound, drug | BODIPY FL NHS-Ester | Thermo Fisher Scientific | ID_D2184 | |
| Chemical compound, drug | ATTO 655-NHS-Ester | ATTO-Tec GmbH, Siegen, Germany | ID_AD 655–31 | |
| Software, algorithm | Prism GraphPad | GraphPad Software, La Jolla California USA, www.graphpad.com | ||
| Software, algorithm | KinTek Explorer, version 6.3 | KinTek Global Kinetic Explorer V 6.3 https://kintekcorp.com/software | ||
| Software, algorithm | MicroTime 200 system | MicroTime 200 system, PicoQuant, Berlin, Germany | ||
| Software, algorithm | SymPhoTime 64 version 2.2 | PicoQuant, Berlin, Germany |
Additional files
-
Supplementary file 1
Supplementary files of fitting result numerical values and amino acid sequences of analyzed HemK constructs.
Table 1. ACF (each average of N ≥ 8) fits of HemK constructs in solution. Table 2 results of empirical fits of PET-FCS ACF (each ACF an average of N ≥ 8) for RNCs. Table 3 results of global fitting of the free Trp titration (dataset A) to model 5e-H. Table 4 results of global fitting of the free Trp titration (dataset A) to model 5e-O. Table 5. Results of global fitting of the dataset B to the model 5e-H. Table 6. Results of global fitting of the dataset B to the model 5e-O. Table 7. Upper and lower boundaries of each rate parameter of model 5e-H and 5e-O global fitting. Table 8. Free-energy calculations for all RNC constructs using rates derived from the 5e-H model. Table 9. Free-energy calculations for all RNC constructs from the 5e-O model rates. Table 10. PET-FCS constructs aa sequences N- to C-terminus. Table 11. Force-profile construct of wt HemK full-length, aa sequence N- to C-terminus.
- https://cdn.elifesciences.org/articles/60895/elife-60895-supp1-v1.docx
-
Supplementary file 2
Primer list for the force-profile constructs of HemK wt/4xA.
- https://cdn.elifesciences.org/articles/60895/elife-60895-supp2-v1.xlsx
-
Transparent reporting form
- https://cdn.elifesciences.org/articles/60895/elife-60895-transrepform-v1.pdf
Download links
A two-part list of links to download the article, or parts of the article, in various formats.
Downloads (link to download the article as PDF)
Open citations (links to open the citations from this article in various online reference manager services)
Cite this article (links to download the citations from this article in formats compatible with various reference manager tools)
Gradual compaction of the nascent peptide during cotranslational folding on the ribosome
eLife 9:e60895.
https://doi.org/10.7554/eLife.60895


