Adaptive evolution of an essential telomere protein restricts telomeric retrotransposons
- Department of Biology and Epigenetics Institute, University of Pennsylvania, United States
Figures
Figure 1 with 3 supplements

Allele swap strategy and phenotypic rescue by a diverged version of HOAP.
(A) Using CRISPR/Cas9-mediated transgenesis, we replaced the native coding sequence of cav/HOAP with either a Flag-tagged D. melanogaster coding sequence or instead a Flag-tagged D. yakuba coding sequence. Both coding sequences were intron-less and codon-optimized for D. melanogaster. (B) Mitotic chromosome squashes from larval brains homozygous for HOAP[mel]-Flag or HOAP[yak]-Flag stained with anti-Flag. (C) Mitotic chromosome squashes from larval brains homozygous for HA-HipHop, HOAP[mel]-Flag or HA-HipHop, HOAP[yak]-Flag stained with anti-HA.
Figure 1—figure supplement 1
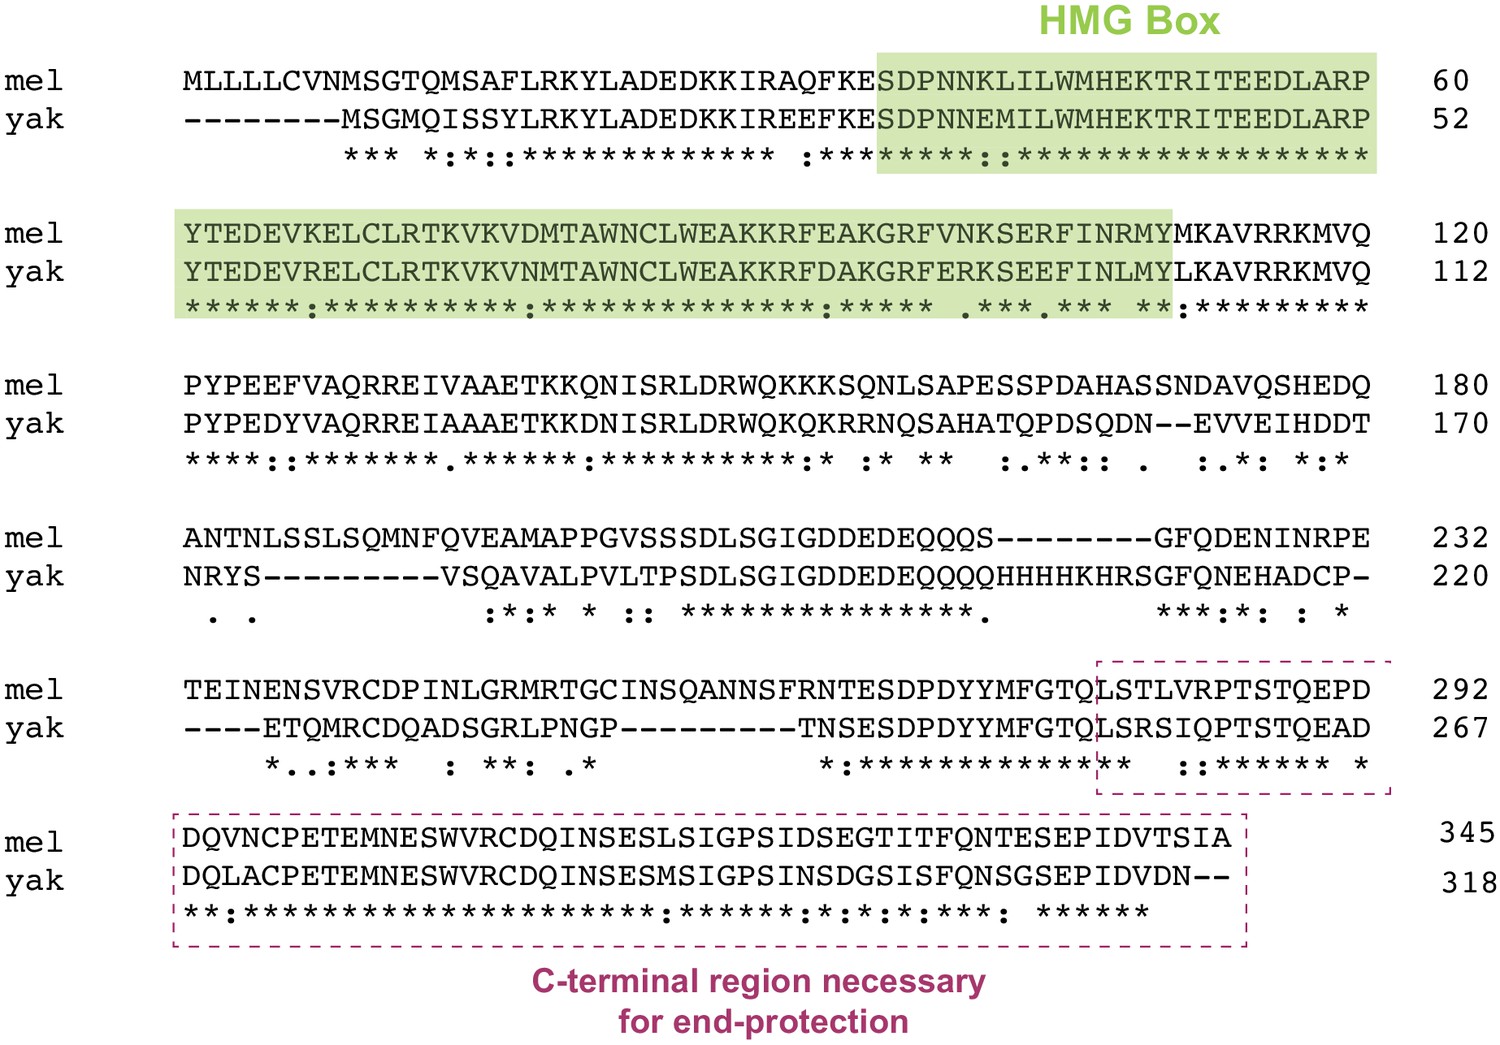
Amino acid alignment of HOAP[mel] and HOAP[yak].
The two proteins share less than 75% amino acid identity and even less when indels are taken into account. The only identifiable domain is the N-terminal HMG-box. The dashed box represents the missing sequence from the truncation mutant described in Cenci et al., 2003.
Figure 1—figure supplement 2
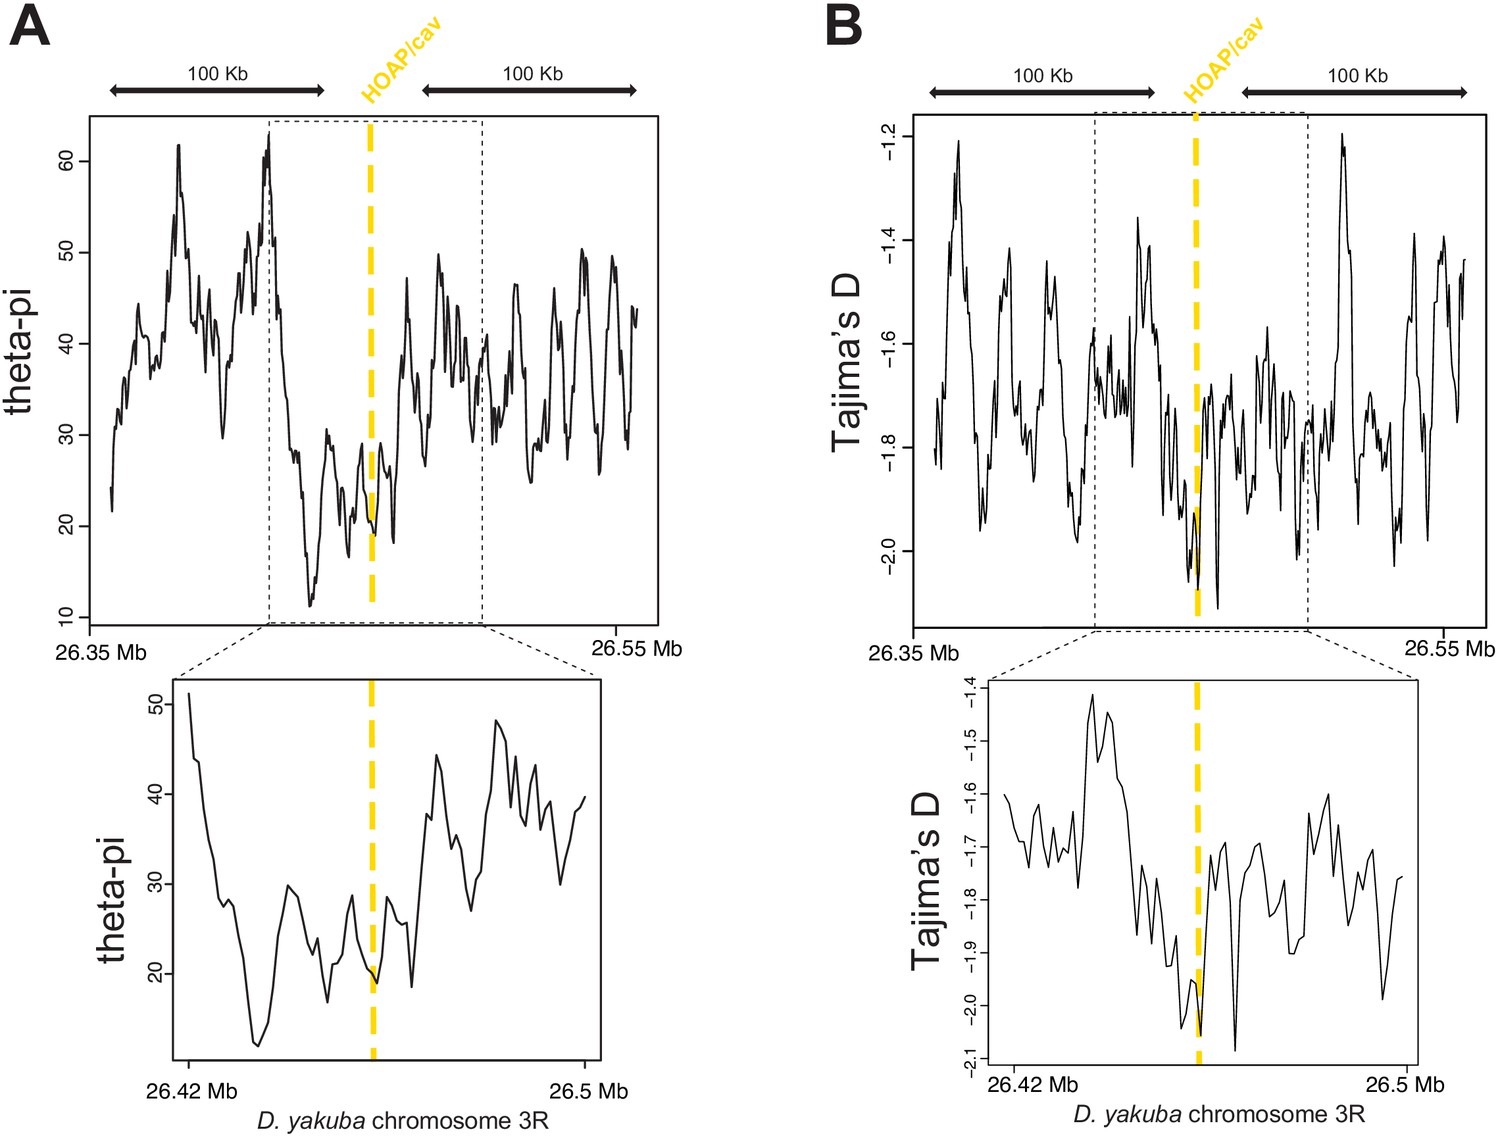
Valley of heterozygosity around the cav locus in D. yakuba.
Parameter estimates from Rogers et al., 2015 centered around the cav locus. Theta-pi (A) and Tajima’s D (B) calculated from 20 D. yakuba alleles across 5kb windows sliding 500bp along 200kb (top) and 100kb (bottom).
Figure 1—figure supplement 3
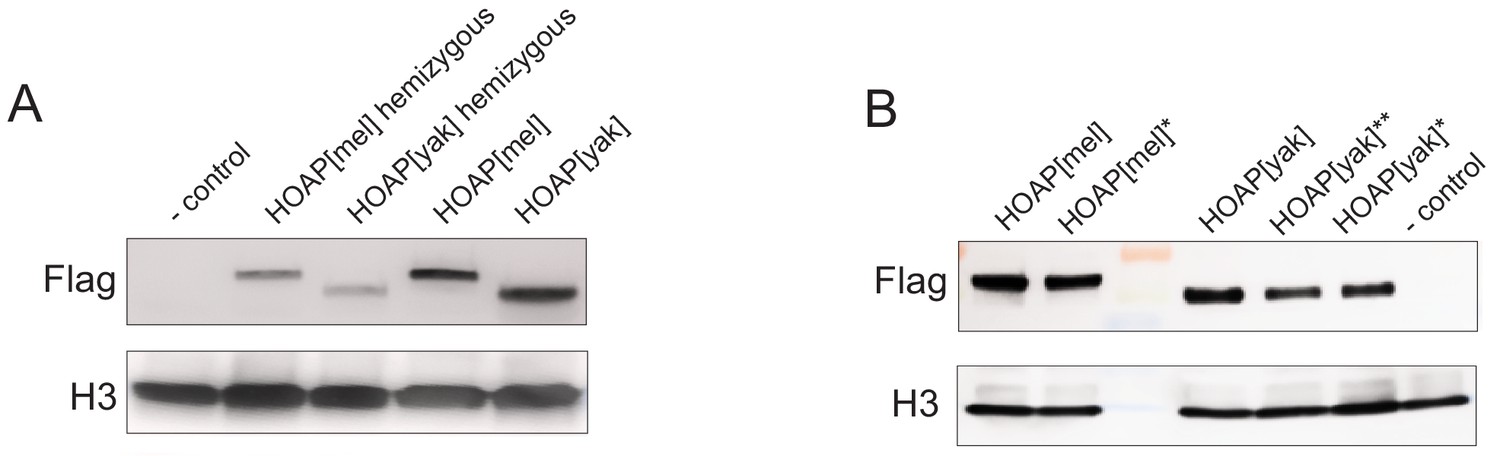
Western Blots of ovaries probed with anti-H3 (control) and anti-Flag to detect Flag-tagged HOAP.
(A) Ovaries hemizygous or homozygous for the transgenes (B) '*' Ovaries from homozygous genotypes used in replicated experimental evolution, '**' genotype not included in downstream experiments.
Figure 2 with 5 supplements

HOAP[yak] fails to rescue telomeric retrotransposon silencing and telomeric silent chromatin.
(A) Normalized read counts from RNA-seq on HOAP[mel] and HOAP[yak] ovaries (three pooled ovary replicates per genotype) mapped to D. melanogaster transposon families. Dark gray circles: adjusted p-value < 0.01, log 2 FC < 1, Black circles: adjusted p-value < 0.01, log 2 FC > 1, Salmon circles: adjusted p-value < 0.01, log 2 FC > 2. (B) Normalized read counts from small RNA-seq on HOAP[mel] and HOAP[yak] ovaries (three pooled ovary replicates per genotype) mapped to transposon families. Black circles: adjusted p-value < 0.01, log 2 FC > 1, Salmon circles: adjusted p-value < 0.01, log 2 FC > 2 (C) Length histogram of HeT-A- and TART-mapping sense (red) and antisense (blue) piRNAs recovered from HOAP[mel] and HOAP[yak] ovaries. Dotted box highlights depletion of piRNAs in HOAP[yak]. (D) Representative images of giant polytene chromosome X tips stained with anti-H3K9me3 (left) and plot of H3K9me3 signal quantification (right, '***': p-value < 0.0001). Different shades of blue (HOAP[mel]) or yellow/orange (HOAP[yak]) correspond to different individuals (three individuals per genotype).
-
Figure 2—source data 1
DESeq output from analysis of total RNA-seq.
- https://cdn.elifesciences.org/articles/60987/elife-60987-fig2-data1-v1.xlsx
-
Figure 2—source data 2
Number of normalized piRNA reads that map to transposon families of D. melanogaster.
- https://cdn.elifesciences.org/articles/60987/elife-60987-fig2-data2-v1.xlsx
-
Figure 2—source data 3
Quantification of H3K9me3 signal at the tip of chromosome X.
- https://cdn.elifesciences.org/articles/60987/elife-60987-fig2-data3-v1.xlsx
Figure 2—figure supplement 1

Number of piRNAs that map to the TAHRE consensus.
Length histogram of sense piRNAs (red) and antisense piRNAs (blue) mapped to the TAHRE telomeric retrotransposon. The y-axis shows levels of piRNAs (normalized by total miRNAs) and x-axis shows the length (nt) of piRNAs.
Figure 2—figure supplement 2

Number of uniquely mapping piRNAs (y-axis) detected across different chromosome locations (x-axis).
(A) Subtelomere clusters (defined as 1Mb proximal to the most proximal telomeric retrotransposon) along the long-read assembly described in Chang and Larracuente, 2019. We detected the same pattern when mapping piRNAs to the “A7” long-read assembly (NCBI assembly ASM340191v1, Chakraborty et al., 2019, data not shown). (B) Well-characterized piRNA clusters embedded at heterochromatin-euchromatin borders (Dmel r6.23). For all plots, HOAP[mel] is above and HOAP[yak] is below.
Figure 2—figure supplement 3

Additional representative images of H3K9me3 signal on chromosome X and strategy for normalization.
(A) Representative images of anti-H3K9me3 staining on polytene chromosome squashes from HOAP[mel] and HOAP[yak]. (B) For each chromosome tip, we measured the lengths of two fixed chromosome bands (red dotted lines). We divided the H3K9me3 signal area by the geometric mean of these two bands to calculate a normalized signal.
Figure 2—figure supplement 4
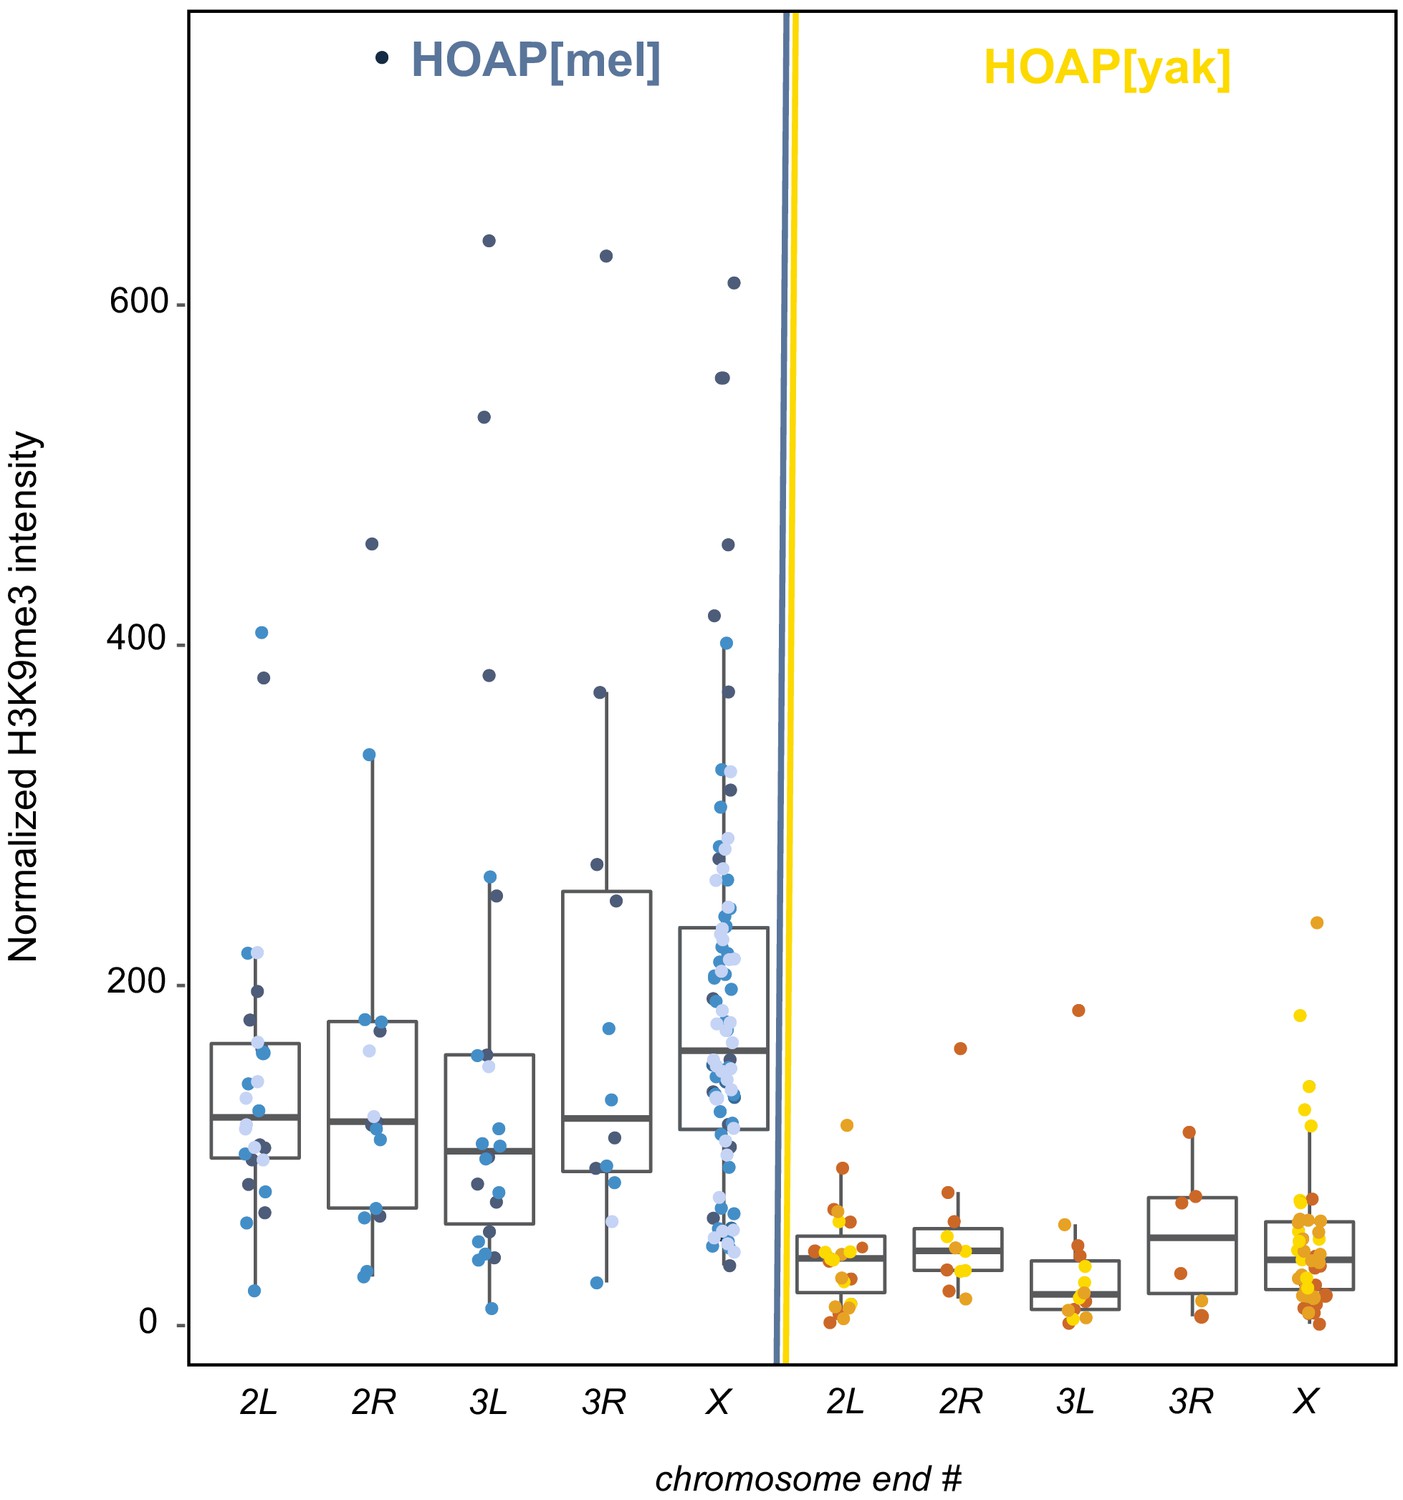
Quantification of H3K9me3 signal at five chromosome tips.
H3K9me3 signal (y-axis) from giant polytene chromosome squashes of HOAP[mel] and HOAP[yak] across chromosome ends (x-axis). Three different shades of blue correspond to three different HOAP[mel] individuals from which we dissected salivary glands. For HOAP[yak], different individuals are shown in yellow/orange shades. Mann Whitney U test: 2L p-value = 4.94x10 -9 , 2R: p-value = 0.002, 3L: p-value = 1.9x10 -5 , 3R: p-value = 0.018, X: p-value = 1.15x10 -14.
Figure 2—figure supplement 5
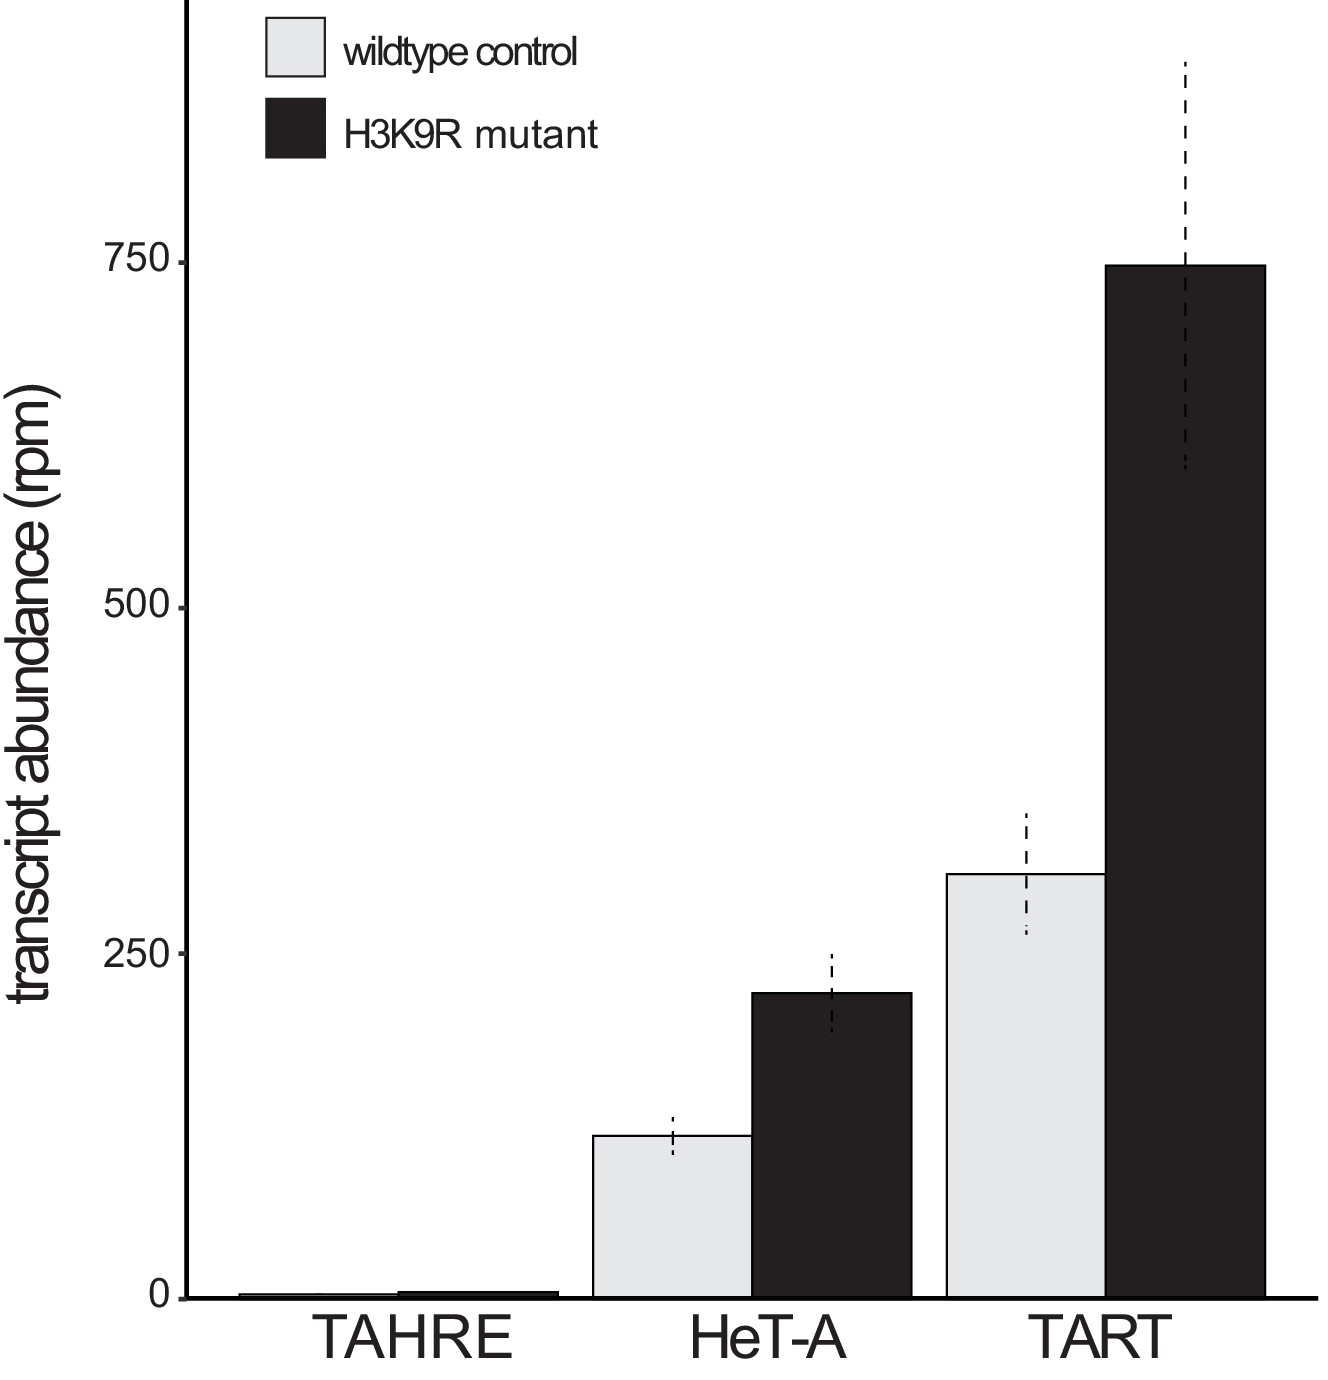
Telomeric retrotransposon transcript abundance in wildtype versus ‘H3K9R’ mutant wing discs.
Analysis of RNA-seq data reported in Penke et al., 2016 in wildtype versus H3K9R mutants that lack H3K9me3 genome-wide. The H3K9R mutant has elevated HeT-A and TART retrotransposon transcripts. Reads per million (rpm) reported with standard error across three replicates.
Figure 3 with 1 supplement
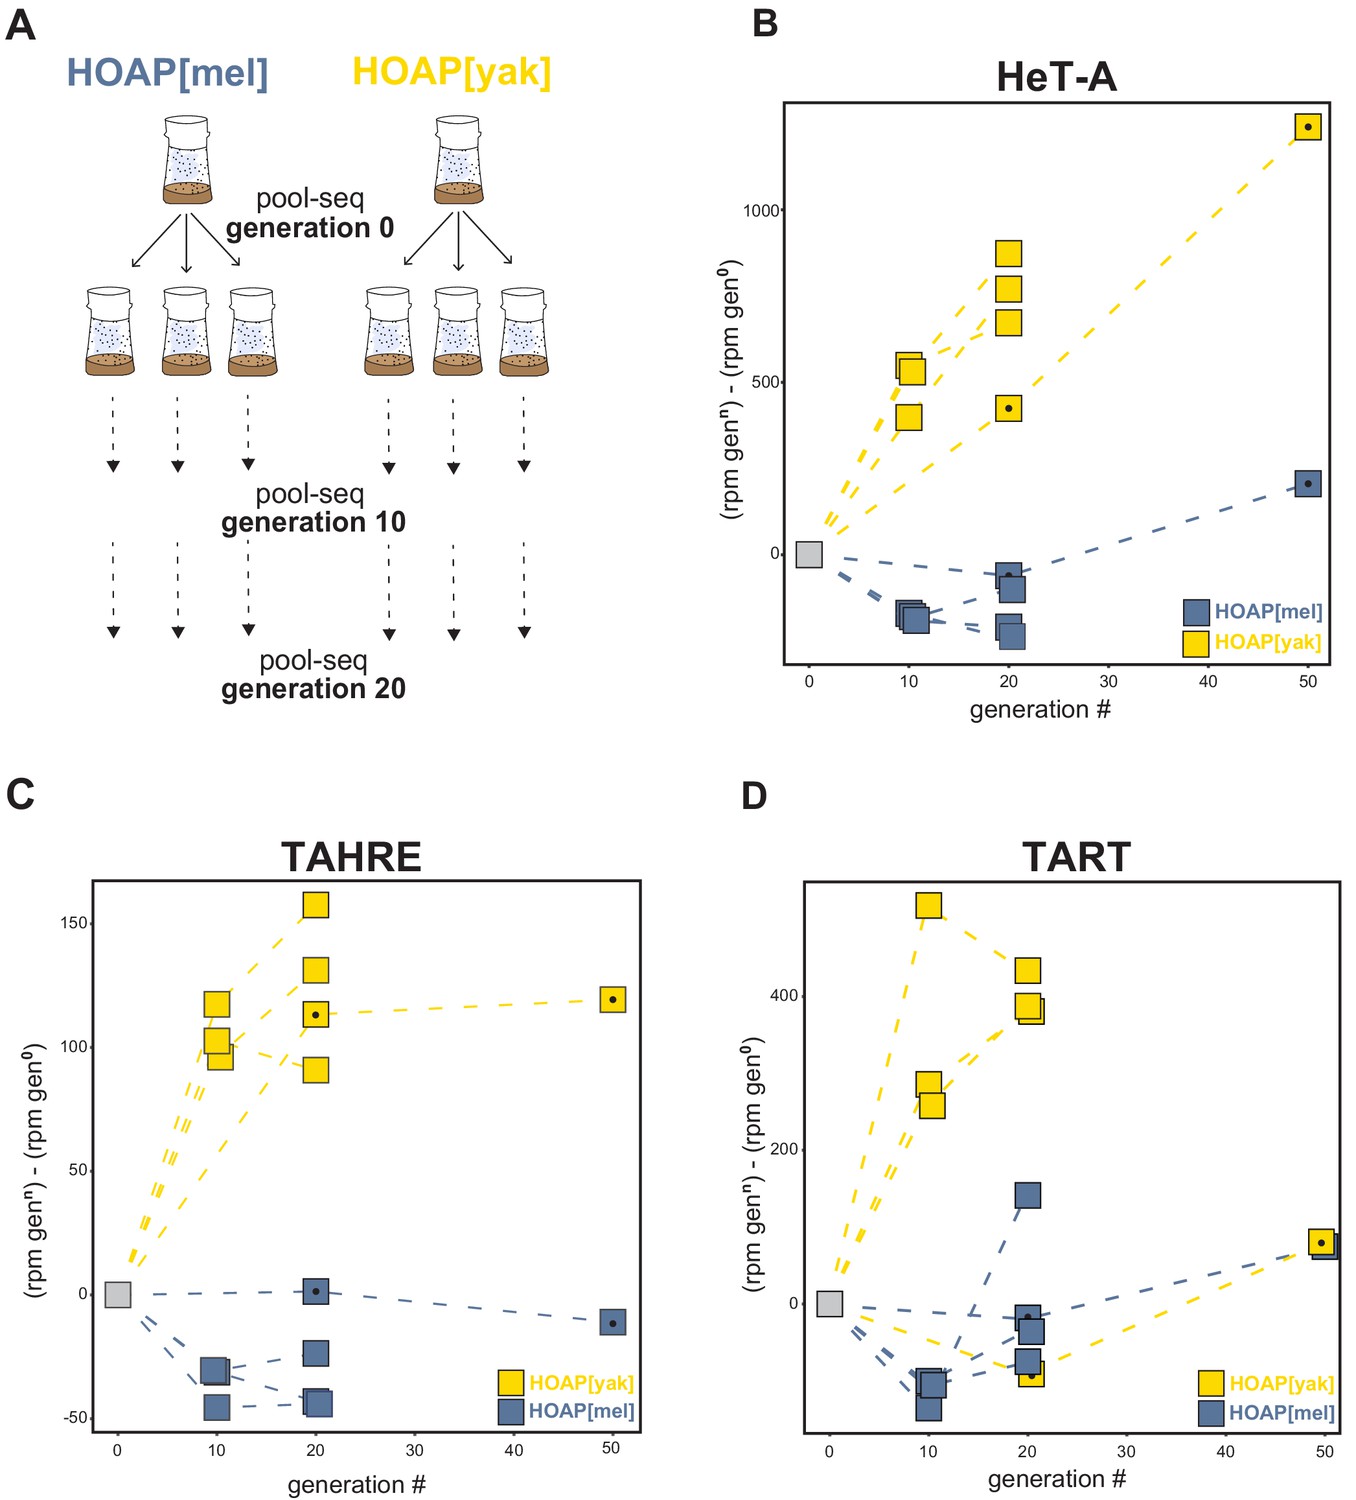
Retrotransposons proliferate in HOAP[yak] over experimental evolution.
(A) Replicated experimental evolution strategy that begins with an expanded population of HOAP[mel] and HOAP[yak]. We divided each founder population into three replicates and then froze down 100 females for pool-DNA-seq ('generation 0'). We flipped replicate populations until generation 20, sampling pools of females for DNA-seq at generations 10 and 20 per population. A parallel run of experimental evolution (not shown) was sampled at generations 0, 20, and 50. (B-D) DNA-seq reads mapped to the D. melanogaster HeT-A (B), TAHRE (C), and TART (D) consensus sequences, shown as reads per million (rpm) at a given generation minus the rpm at generation 0 for a given population. The long-term experimental evolution samples have a filled black circle in each square. Note the different y-axes of (B), (C), and (D).
-
Figure 3—source data 1
Change in read count across original ‘O’ lines and replicated lines (‘A’, ‘B’, ‘C’).
‘Gen’=generation.
- https://cdn.elifesciences.org/articles/60987/elife-60987-fig3-data1-v1.xlsx
Figure 3—figure supplement 1
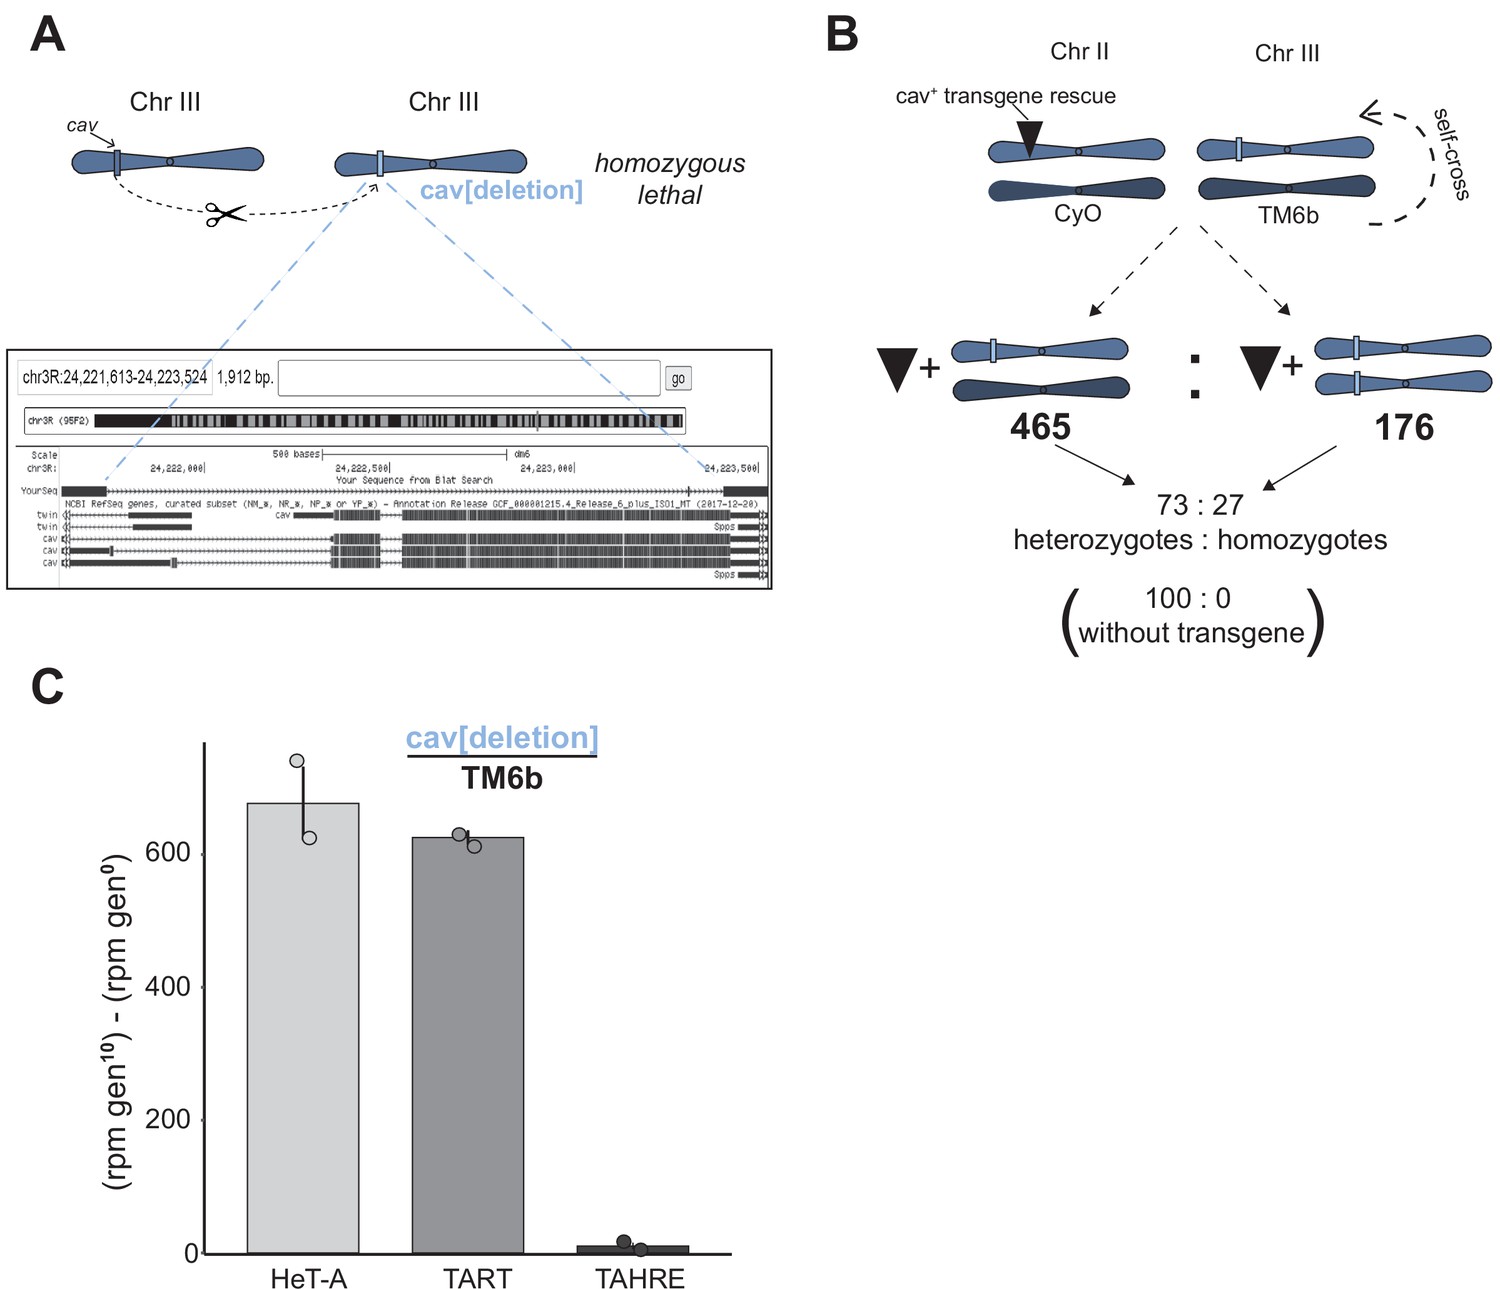
Hemizygous cav recapitulates the elevated telomeric retrotransposon copy number of HOAP[yak].
(A) By injecting gRNAs only into Cas9-expressing embryos, we generated a deletion that encompassed the enitre cav coding sequence (light blue rectangle). Below is a browser shot of the BLAT result (https://genome.ucsc.edu/) using the PCR-amplified deleted region as the query. This allele is homozygous lethal (as are cav[deletion] / cav[1] flies). (B) We generated a rescue trangene amplified from a 'wildtype' stock (w[1118]) and, using PhiC31 integrase, inserted the transgene on chromosome II. The transgene rescued viability of otherwise homozygous lethal cav[deletion] flies. (C) Experimental evolution of two replicate populations of the cav[deletion]/TM6b stock results in elevated HeT-A and TART genomic copy number, revealed by sequencing generation 0 and generation 10 populations. Y-axis is reads per million (rpm) at generation 10 minus rpm at generation 0 (with standard error). Circles represent the copy number estimates from the two replicate populations.
Figure 4 with 3 supplements
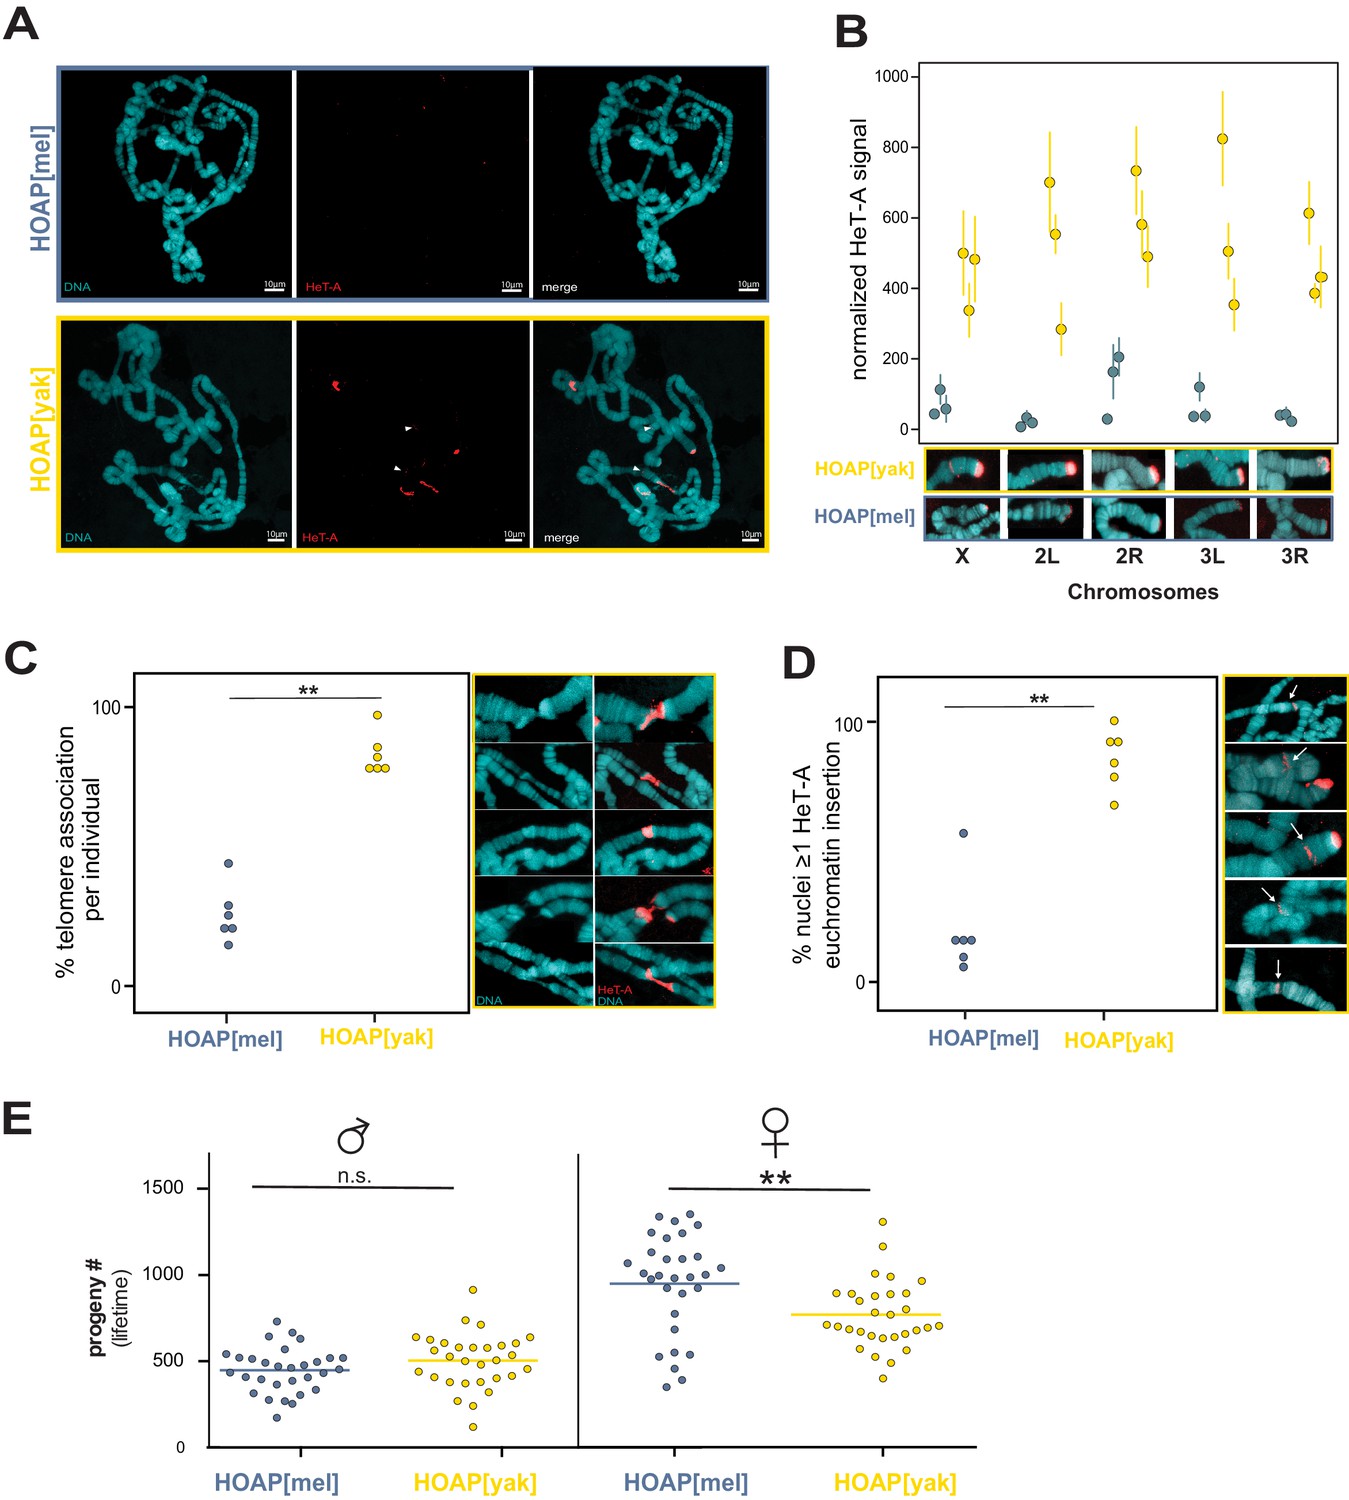
Retrotransposons proliferate in HOAP[yak] at both telomeric and non-telomeric locations and are associated with a fitness cost.
(A) HeT-A FISH probe (red) hybridized to giant polytene chromosomes that were dissected from generation 50 HOAP[mel] and HOAP[yak] salivary glands. (B) HeT-A signal at chromosome ends at generation 50 HOAP[mel] and generation 50 HOAP[yak] (at least 10 tips per chromosome tip per individual, three individuals). (C) Telomere-telomere association frequency ('**': p-value < 0.005) and (D) non-telomeric HeT-A band frequency across generation 50 HOAP[mel] and HOAP[yak] ('**': p-value < 0.005). Percent nuclei calculated from at least 10 nuclei across six replicate individuals per genotype. (E) Lifetime male fertility (left) and female fertility (right), n = 30, '**': p-value < 0.005.
-
Figure 4—source data 1
HeT-A signal normalization and quantification data.
- https://cdn.elifesciences.org/articles/60987/elife-60987-fig4-data1-v1.xlsx
-
Figure 4—source data 2
Quantification of telomere associations and non-telomeric HeT-A insertions.
- https://cdn.elifesciences.org/articles/60987/elife-60987-fig4-data2-v1.xlsx
-
Figure 4—source data 3
Lifetime male and female fertility in generation 45 HOAP[mel] and HOAP[yak] genotypes.
- https://cdn.elifesciences.org/articles/60987/elife-60987-fig4-data3-v1.xlsx
Figure 4—figure supplement 1

Strategy for HeT-A FISH probe design.
Genome coverage plotted along the HeT-A consensus sequence from the pool-seq data. The HeT-A probe corresponds to the most abundant region. Probe primers (Supplementary file 4) are depicted with red arrowheads.
Figure 4—figure supplement 2
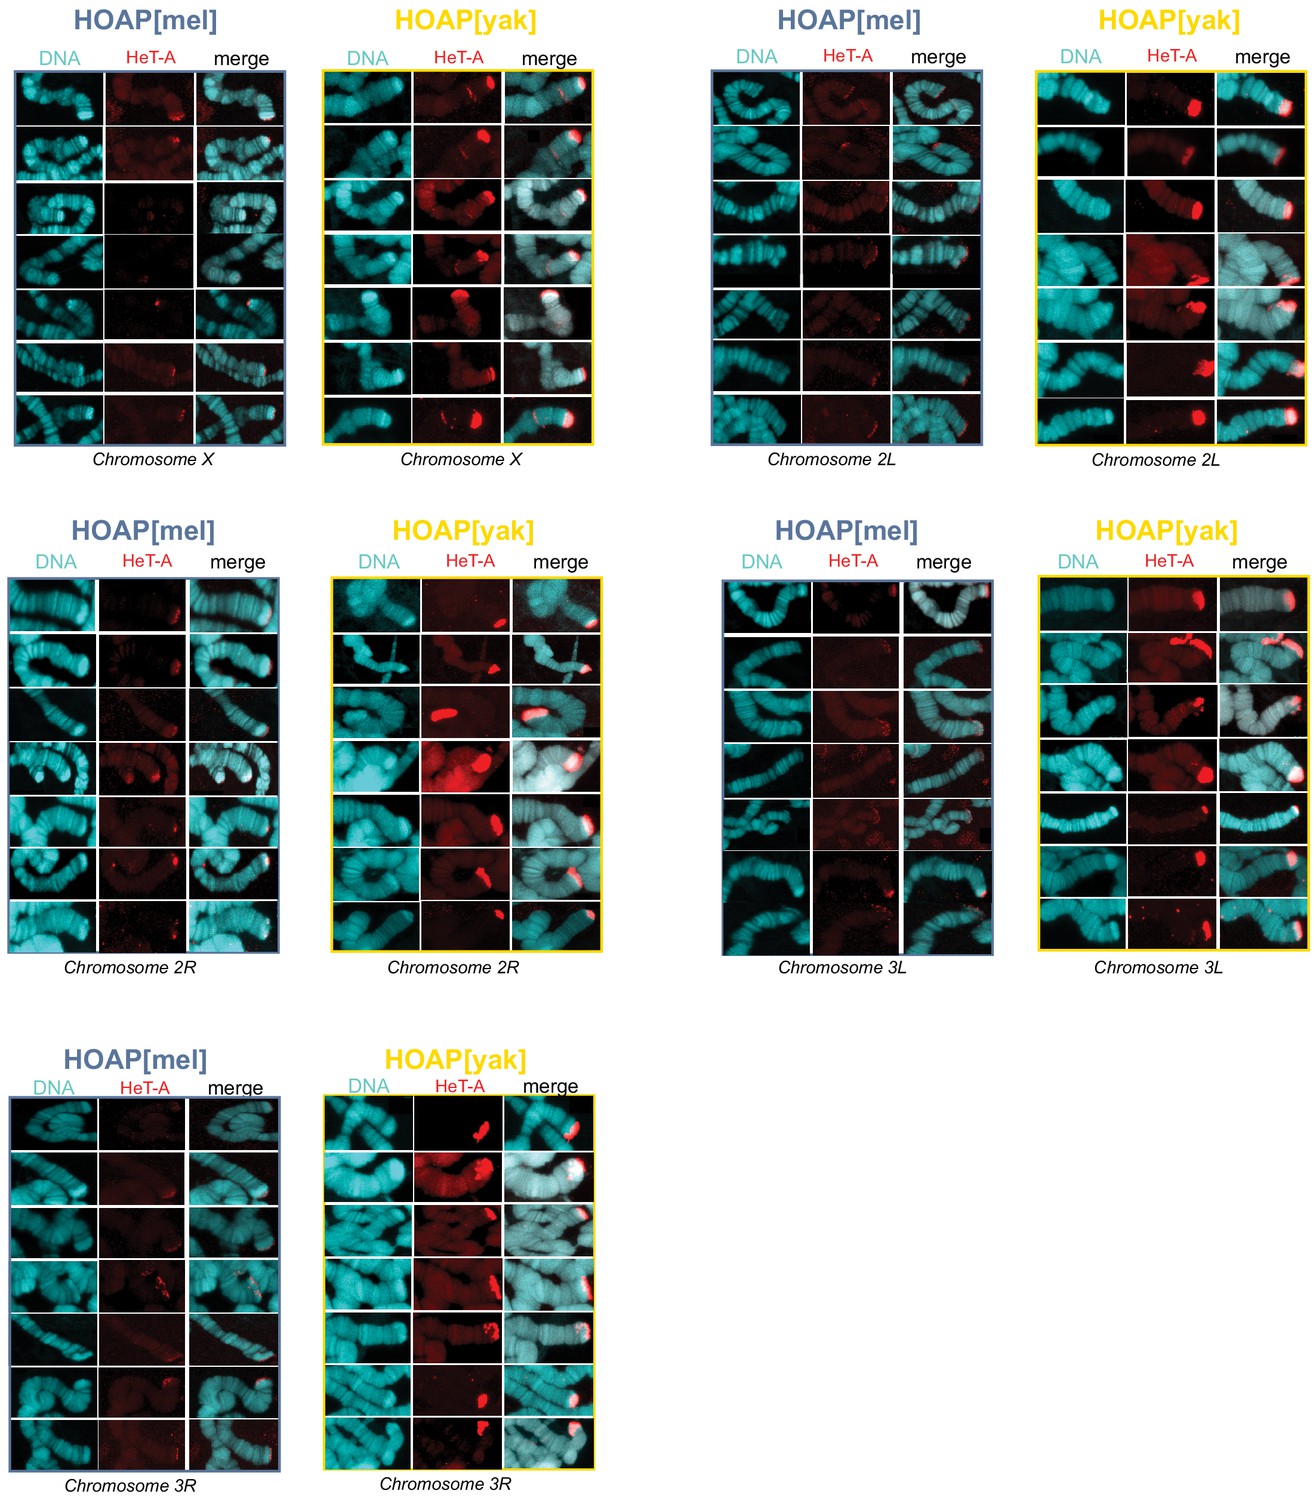
Additional representative images of HeT-A signal on polytene chromosomes.
Representative images of HeT-A FISH signal on polytene chromosome squashes from generation 50 HOAP[mel] and HOAP[yak] across defined chromosome tips.
Figure 4—figure supplement 3
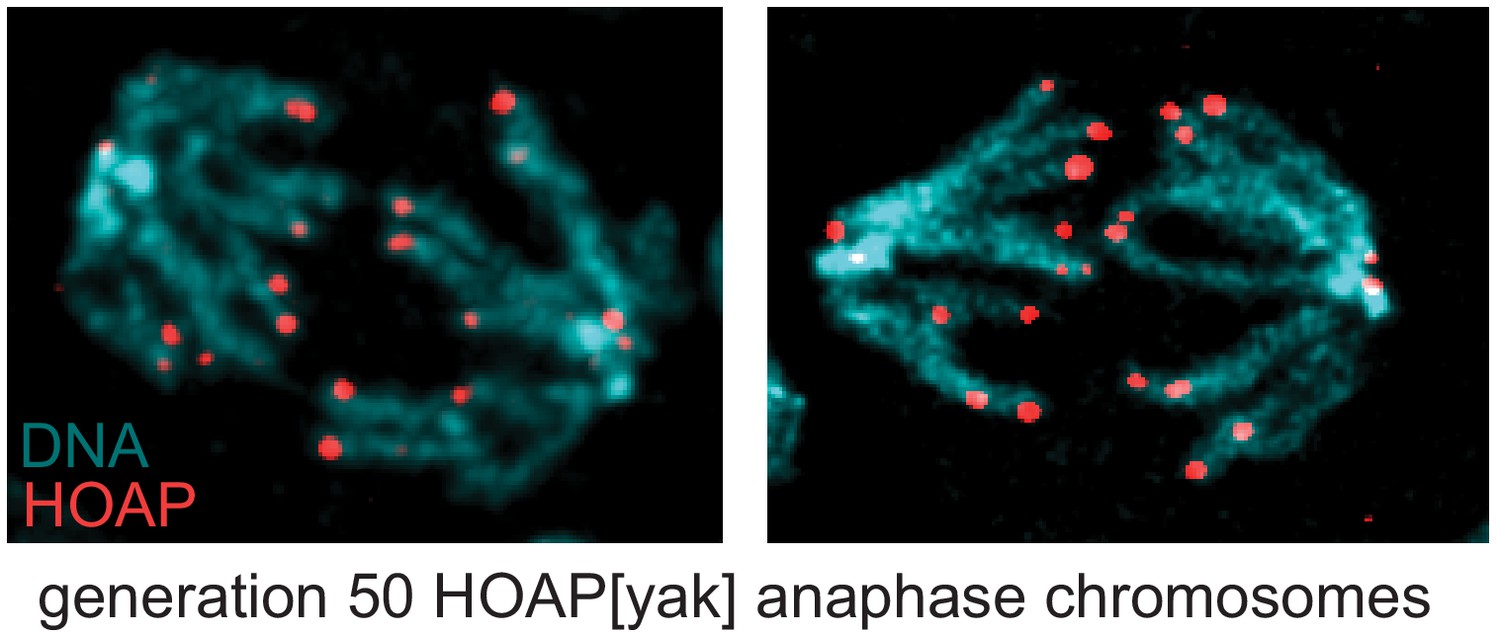
No evidence that telomere associations are telomere fusions in the evolved HOAP[yak] genotype.
Two representative images of anaphase chromosomes from larval brains of generation 50 HOAP[yak]-Flag stained with anti-Flag and DAPI. Telomere fusions would appear as chromatin bridges.
Figure 5 with 2 supplements
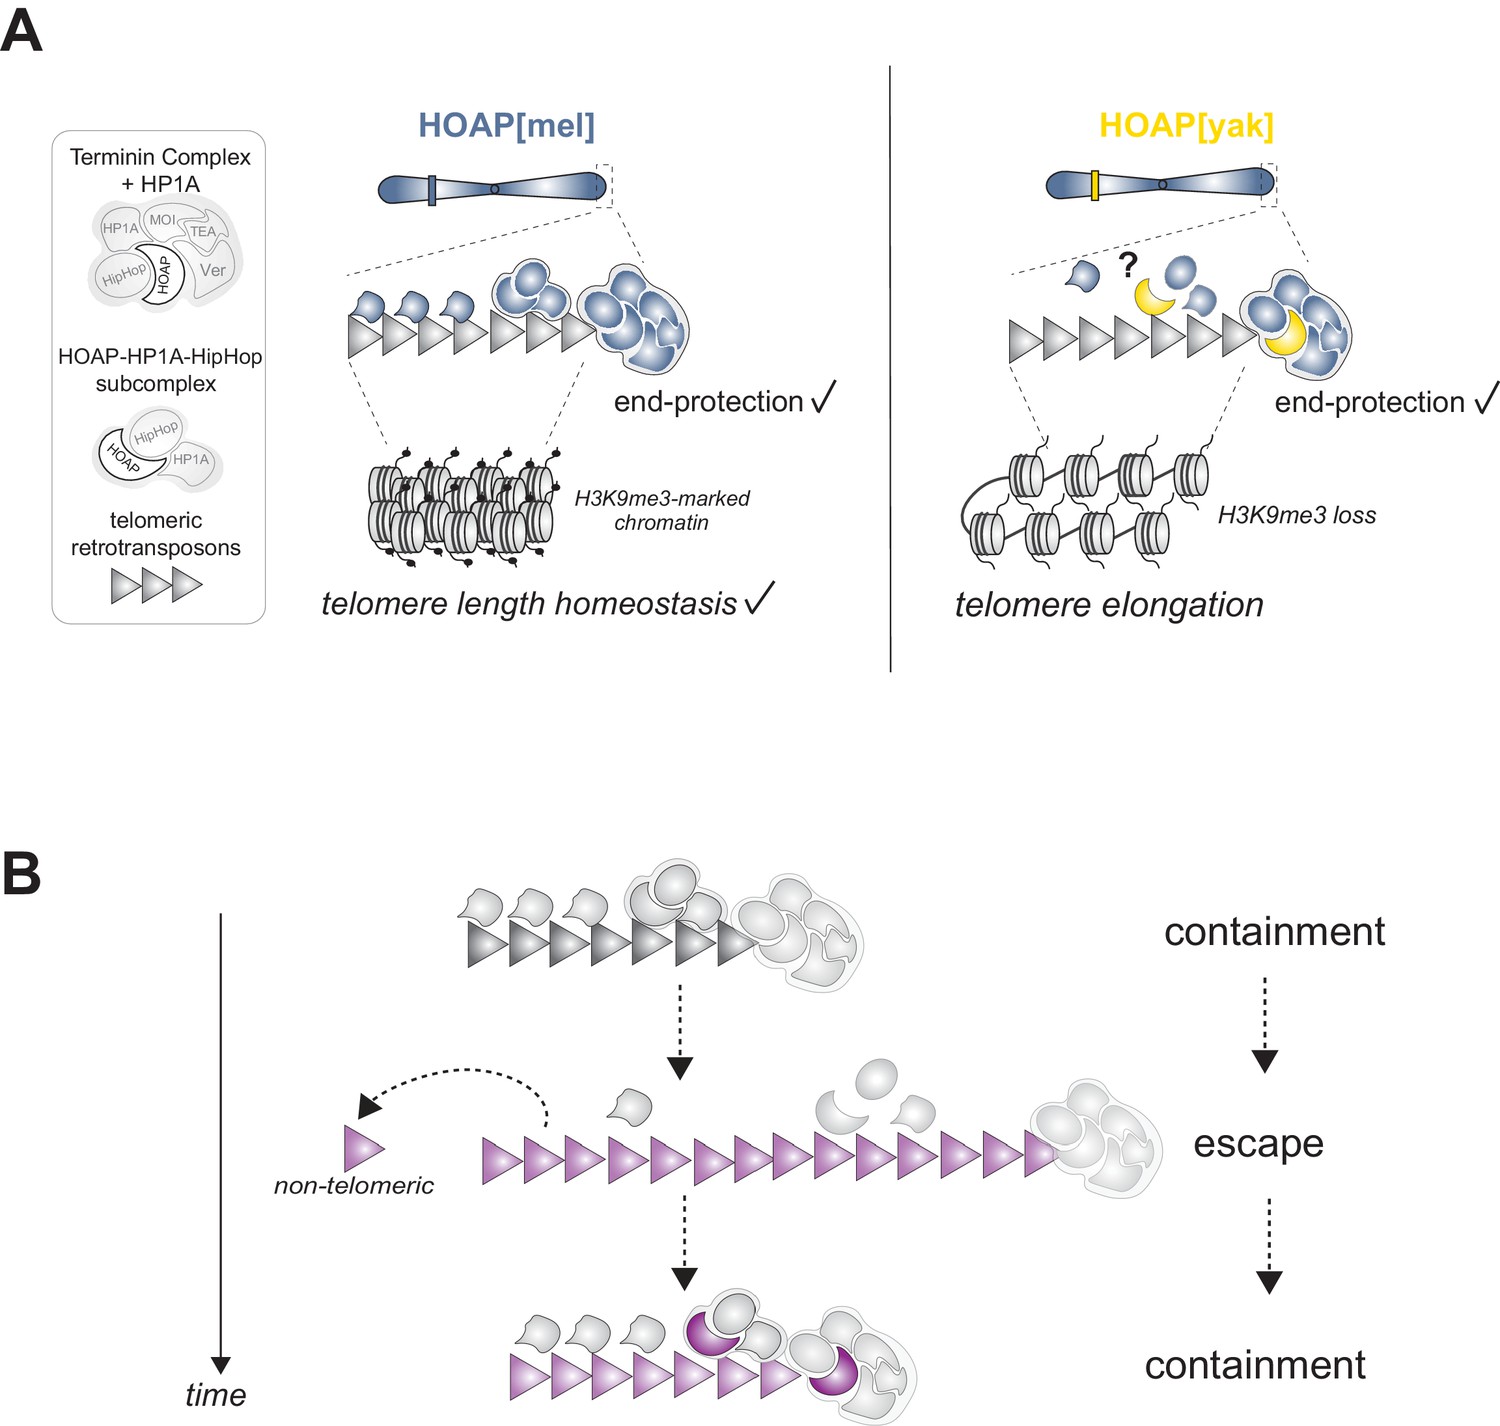
Model of HOAP[yak] separation-of-function and model of intra-genomic conflict between host telomere proteins and selfish telomeric retrotransposons.
(A) In the presence of the D. yakuba version of HOAP (yellow moon), D. melanogaster telomeres maintain telomere end-protection but lose telomeric retrotransposon silencing and length regulation. We hypothesize that the two defined HOAP functions separate across two multi-protein complexes: HOAP[yak] supports Terminin integrity but disrupts the HOAP-HP1A-HipHop subcomplex. (B) Model of intra-genomic conflict shaping HOAP evolution and telomere retrotransposon evolution. At some timepoint in the past (e.g. along the lineage leading to D. melanogaster), ancestral host telomere proteins successfully contain telomeric retrotransposons ('containment'). Over time, the retrotransposon innovates (gray triangle becomes purple), elongating chromosomes and inserting into non-telomeric locations ('escape'). Fitness costs incurred by the host spurs telomere protein evolution (gray moon becomes a purple moon), restoring control over telomeric retrotransposons ('containment').
Figure 5—figure supplement 1
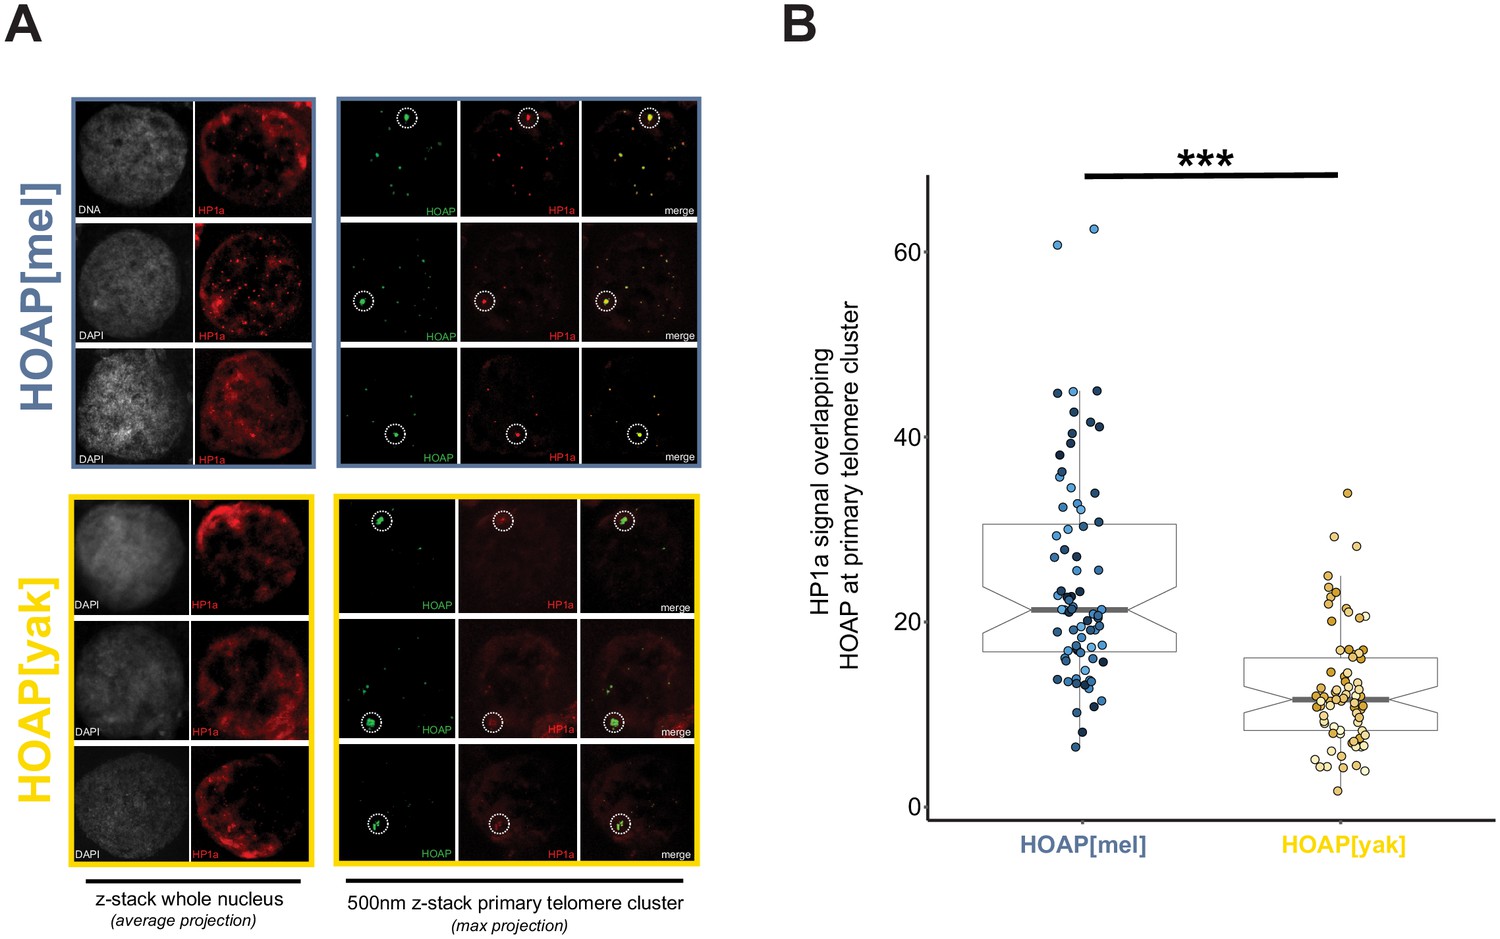
Reduced HP1a signal at the primary HOAP[yak]-marked telomere cluster in ovarian nurse cells.
(A) Representative images of DNA (white) and HP1a (red) across whole nuclei (left) and HOAP (detected by anti-Flag, green) and HP1a (red) at the primary cluster of telomeres within each nurse cell (right). Dotted circles correspond to the region of interest (ROI) for quantification. (B) Quantification of mean HP1 intensity across HOAP[mel] and HOAP[yak] of 75 nurse cells across 15 individuals ('***' = p-value < 0.0001).
Figure 5—figure supplement 2
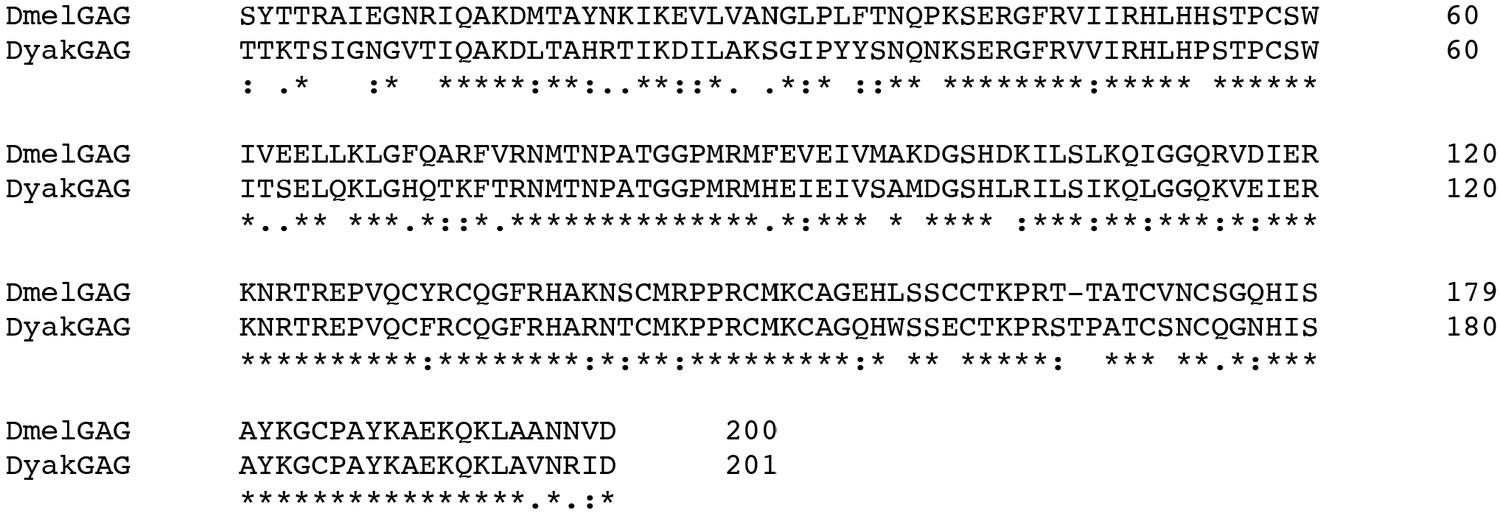
Protein alignment of HeT-A Gag consensus from D.melanogaster and D.yakuba.
The two Gag domains share 72% amino acid identity.
Author response image 1

Western Blot on HOAP[mel] ovaries treated with DMSO or methotrexate probed with anti-H3K9me3.
We detected minimal change in H3K9me3 abundance across the two treatments in HOAP[mel] (the HOAP[yak] genotype died at the pupal stage). In fact, the 10uM treated-flies may have slightly less H3K9me3. (1:1000 for both antibodies).
Tables
Key resources table
| Reagent type (species) or resource | Designation | Source or reference | Identifiers | Additional information |
|---|---|---|---|---|
| Gene (Drosophila yakuba) | cav/anon:1G5 | GenBank | NCBI:XP_002099270 | |
| Gene (Drosophila melanogaster) | caravaggio/cav | Flybase | FLYBASE:FBgn0026257 | |
| Gene (Drosophila yakuba) | D. yakuba population genomic sample | NCBI | NCBI:PRJNA215876 | Rogers et al., 2015 |
| Genetic reagent (D. melanogaster) | HOAP[mel]-Flag; HOAP[mel] | This paper | ‘5Fmel’ in our library | D. mel cav/HOAP + flag (in the native location) |
| Genetic reagent (D. melanogaster) | HOAP[yak]-Flag; HOAP[yak] | This paper | ‘25Fyak’ in our library | D. yak cav + flag (in the native location) |
| Genetic reagent (D. melanogaster) | HA-HipHop | This paper | ‘HA-HipHop[mel]−30 f’ in our library | D. mel HA-tagged hiphop (in the native location) |
| Genetic reagent (D. melanogaster) | cav[deletion]/TM6b | This paper | ‘8fdel/TM6b’ in our library | Complete deletion of cav gene region |
| Genetic reagent (D. melanogaster) | cav rescue transgene | This paper | ‘20123-attP40’ in our library | wildtype cav plus 5’ and 3’ flanking non-coding sequence (chr II) |
| Strain, strain background (D. melanogaster) | w[1118] | Bloomington Drosophila Stock Center | BDSC:5905 | |
| Strain, strain background (D. melanogaster) | w; Pin/CyO;Dr/TM6b | Edgar Lab via Malik Lab at FredHutch | w; Pin/CyO;Dr/TM6b | Source of Balancer chromosomes for crosses |
| Strain, strain background (D. melanogaster) | yw; hp1e/TM3 | Malik Lab | w; hp1e/TM3 | Source of TM3 balancer chromosome for crosses |
| Strain, strain background (D. melanogaster) | ca, cav[1]/TM6b | Bloomington Drosophila Stock Center | BDSC:64180 | Original caravaggio mutant (Cenci et al., 2003) |
| Strain, strain background (D. melanogaster) | yw;nos-Cas9(II-attP40) | Perrimon Lab via The BestGene, Inc | Injection stock for CRISPR experiments | |
| Strain, strain background (D. melanogaster) | y1w67c23;P{CaryP}attP40 | Perrimon Lab via The BestGene, Inc | Injection stock for rescue transgene | |
| Antibody | Anti-Flag (mouse monoclonal) | Sigma | Cat#: F3165 Clone M2 | IF: (1:2500) WB: (1:10,000) |
| Antibody | Anti-HA (rat monoclonal) | Sigma | Cat#: ROAHAHA Clone 3F10 | (1:2000) |
| Antibody | Anti-H3 (rabbit polyclonal) | Abcam | Cat# Ab1791 | (1:5000) |
| Antibody | Anti-H3K9me3 (rabbit polyclonal) | Abcam | Cat# ab8898 | (1:20) |
| Antibody | Anti-HP1 (rabbit polyclonal) | gift from Sally Elgin | MO552 | (1:100) |
| Antibody | Anti-Digoxigenin-AP, Fab fragments (sheep polyclonal) | Sigma | Cat# 11093274910 | (1:250) |
| Antibody | Goat anti-rabbit IgG Alexa Fluor 568 (rabbit polyclonal) | Thermo Fisher Scientific | Cat# A-11011 | (1:300) |
| Antibody | Goat anti-mouse IgG Alexa Fluor 488 (mouse polyclonal) | Thermo Fisher Scientific | Cat# A21121 | (1:300) |
| Antibody | Donkey anti-sheep IgG Alexa Fluor 555 (sheep polyclonal) | Thermo Fisher Scientific | Cat# A-21436 | (1:500) |
| Other | Gold antifade reagent with DAPI | Thermo Fisher Scientific | Cat# P36931 | |
| Sequence-based reagent | HeTAprobeF | This paper | FISH probe primer | GGAACCCATCTTCAGAATTCCCTC |
| Sequence-based reagent | HeTAprobeR | This paper | FISH probe primer | GTGGATGCGGAACAGAATTT |
| Recombinant DNA reagent | 5’ guide RNA (cav) in pBFv-U6.2 | This paper | CAGATGGTCAAAGAGGTGCA | |
| Recombinant DNA reagent | 3’ guide RNA (cav) in pBFv-U6.2 | This paper | GCTATTGAGGTGACGTCGAT | |
| Recombinant DNA reagent | 5’ guide RNA (hiphop) in pBFv-U6.2 | This paper | GGTGCATGATCTATTCCAGA | |
| Recombinant DNA reagent | 3’ guide RNA (hiphop) in pBFv-U6.2 | This paper | TACTTGATGGGAACCACAGG | |
| Commercial assay or kit | PCR DIG Probe Synthesis Kit | Sigma | Cat# 11636090910 | |
| Commercial assay or kit | Kwikquant Western Blot detection kit | Kindle Biosciences | Cat# R1004 | |
| Commercial assay or kit | Qiagen RNeasy Kit | Qiagen | Cat# 74104 | |
| Commercial assay or kit | PureLink Genomic DNA kit | Thermo-Fisher Scientific | Cat# k1820-02 | |
| Commercial assay or kit | TruSeq Stranded Total RNA Library Prep | Illumina | Cat# 20020597 | |
| Commercial assay or kit | NEBNext Ultra DNA Library Prep Kit for Illumina | New England Biolabs | Cat# E7370L | |
| Software, algorithm | McDonald-Kreitman test | http://mkt.uab.es | ||
| Software, algorithm | STAR | Dobin et al., 2013 | ||
| Other | D. mel genome assembly from long reads | PMID:31653862 | NCBI:ASM340191v1 | Chakraborty et al., 2019 |
| Other | Wildtype vs. H3K9R mutant RNA-seq | PMID:27566777 | NCBI: PRJNA338389 | Chakraborty et al., 2019 |
Additional files
-
Supplementary file 1
Alleles of cav/HOAP extracted from publicly available genome assemblies of either D. melanogaster (single allele) or D. yakuba (a population sample), aligned with gaps removed for the McDonald-Kreitman test.
- https://cdn.elifesciences.org/articles/60987/elife-60987-supp1-v1.xlsx
-
Supplementary file 2
Quantification of the homozygous:heterozygous ratio of progeny from self-crossed heterozygous HOAP[mel] or self-crossed heterozygous HOAP[yak] parents.
- https://cdn.elifesciences.org/articles/60987/elife-60987-supp2-v1.xlsx
-
Supplementary file 3
Quantification of telomere associations (but not necessarily telomere fusions) across genotypes.
- https://cdn.elifesciences.org/articles/60987/elife-60987-supp3-v1.xlsx
-
Supplementary file 4
Primer sequences referenced in the Materials and methods.
- https://cdn.elifesciences.org/articles/60987/elife-60987-supp4-v1.xlsx
-
Supplementary file 5
Output of small RNA species mapping.
- https://cdn.elifesciences.org/articles/60987/elife-60987-supp5-v1.xlsx
-
Transparent reporting form
- https://cdn.elifesciences.org/articles/60987/elife-60987-transrepform-v1.pdf
Download links
A two-part list of links to download the article, or parts of the article, in various formats.
Downloads (link to download the article as PDF)
Open citations (links to open the citations from this article in various online reference manager services)
Cite this article (links to download the citations from this article in formats compatible with various reference manager tools)
Adaptive evolution of an essential telomere protein restricts telomeric retrotransposons
eLife 9:e60987.
https://doi.org/10.7554/eLife.60987


