Signed and unsigned reward prediction errors dynamically enhance learning and memory
- Chen Neuroscience Institute, California Institute of Technology, United States
- Department of Psychology, Princeton University, United States
- Princeton Neuroscience Institute, Princeton University, United States
Figures
Figure 1
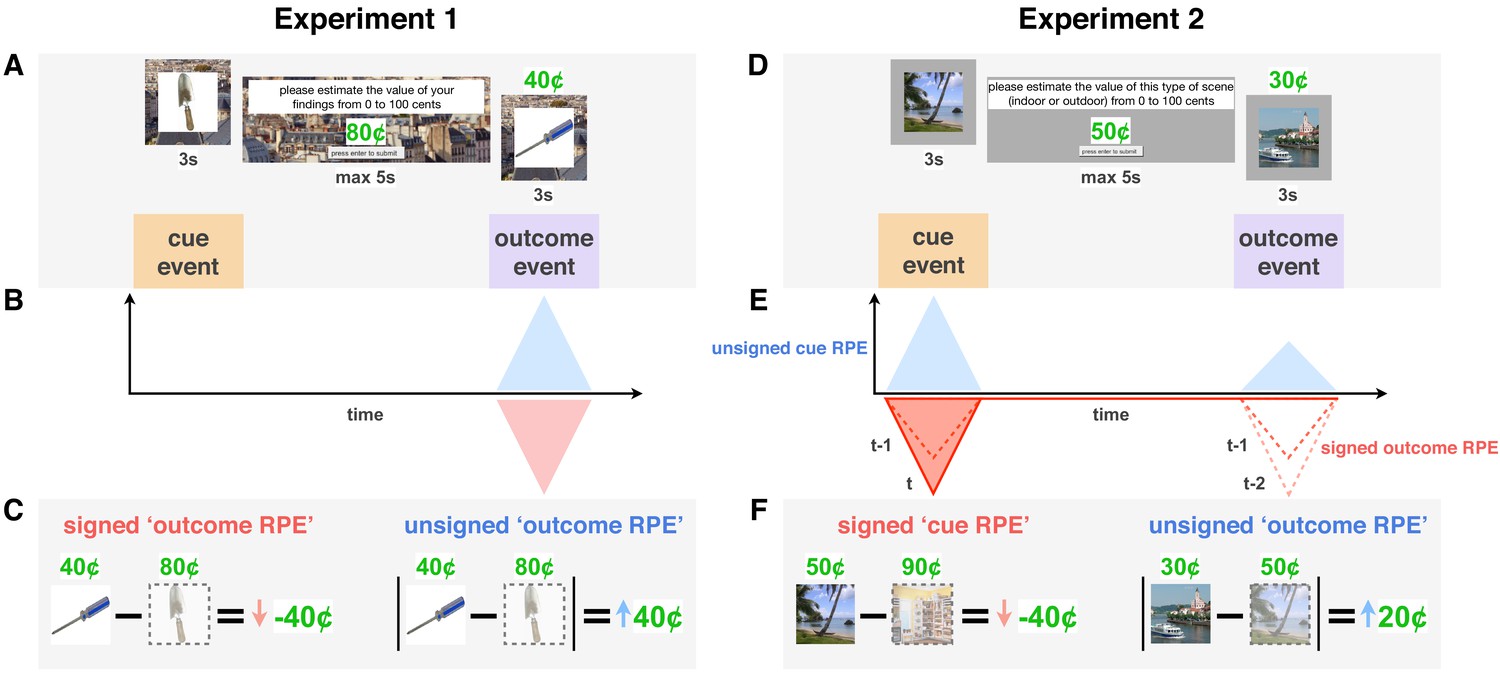
Reward prediction error (RPE) signals in a learning trial in Experiments 1 and 2.
(A,D) Each trial was initiated by a reward-predicting cue represented by a trial-unique image. Participants were then asked to indicate how much that reward category was worth ‘on average.’ They then saw the reward outcome (a proportion of which they received) along with a second trial-unique image. In Experiment 1 (A), all images were of objects (single reward category), whereas in Experiment 2 (D), each trial included either two indoor or two outdoor scenes (two cue categories). (B-F) Theoretical RPE signals (B,E) and their calculation (C,F). Unsigned RPEs at outcome (in blue) were calculated by taking the absolute difference between the participant’s value for that reward cue and the subsequent outcome. We expected this (putatively noradrenergic) unsigned signal to enhance memory for more surprising outcomes, which we tested in both Experiments 1 and 2. Signed RPEs at cue (E, in red) were calculated by taking the difference between the participant’s predicted value for the current reward category (here, outdoor scenes) and their most recently predicted value of the other category (indoor scenes). We expected this (putatively dopaminergic) signed signal to boost memory for more valued events, that is, better memory the more positive the RPE. Prediction errors at outcome gradually transfer to cue through the learning process (E, dotted lines represent signed RPE in previous two trials, darker red indicates more recent trial).
Figure 2 with 2 supplements
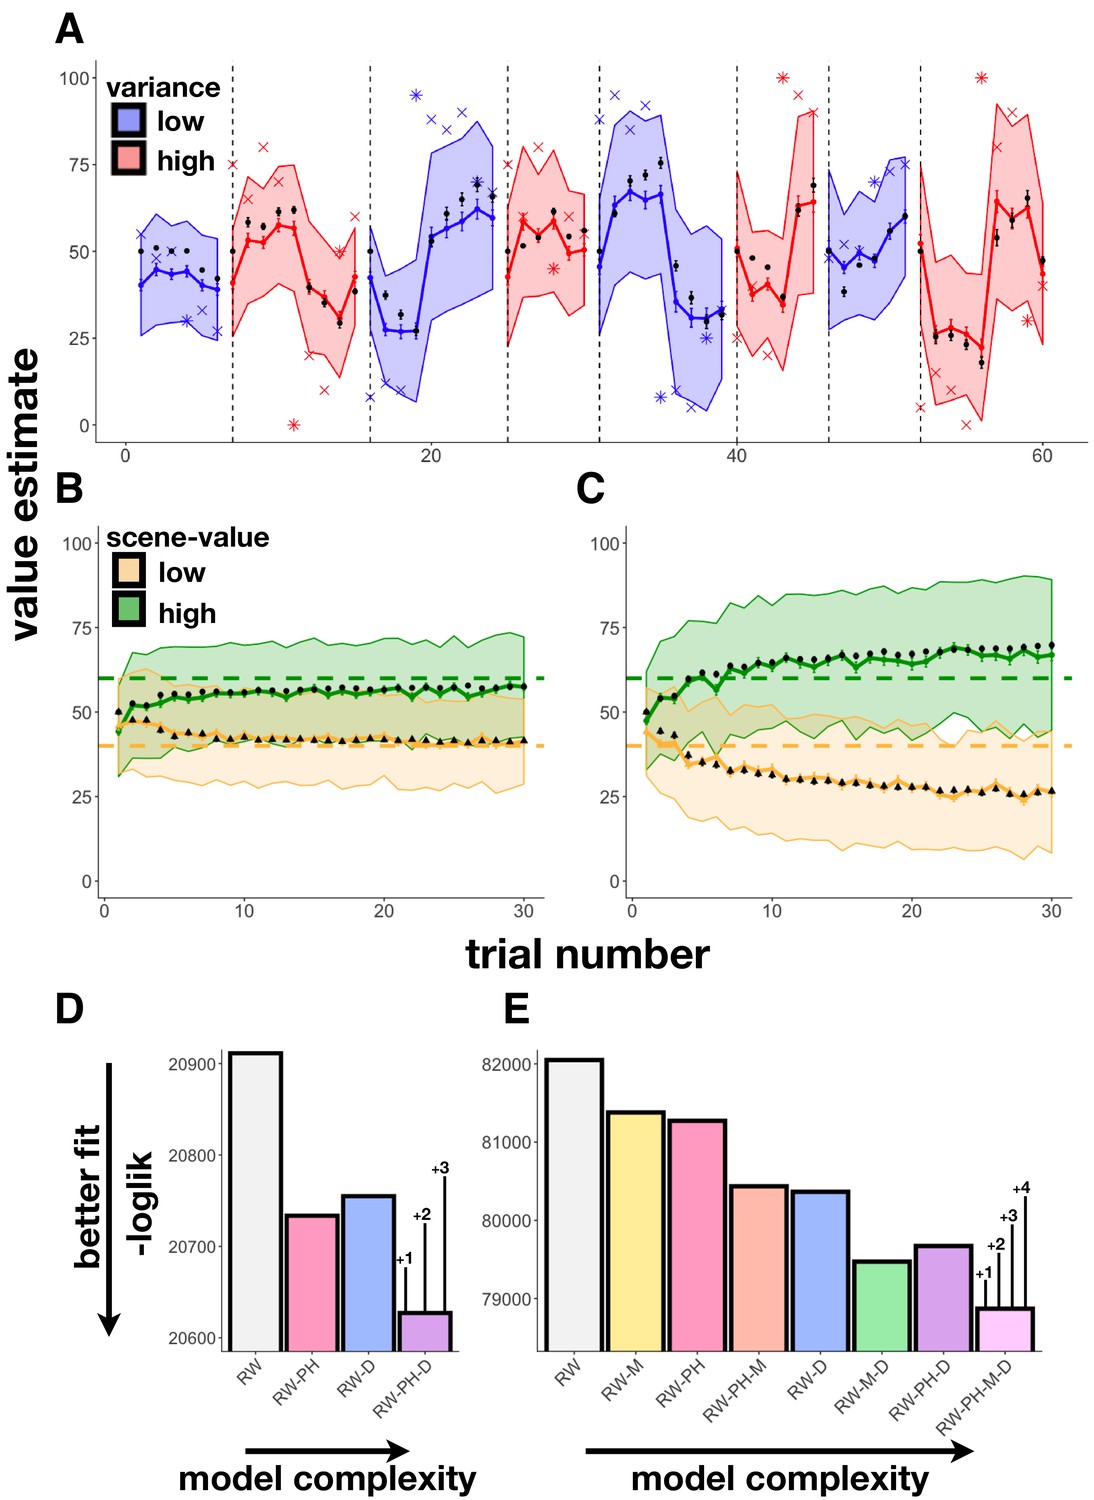
Learning behavior and modeling results.
(A) Experiment 1 average participant value estimates as a function of trial number (blue and red lines represent two different outcome-variance contexts: blue = ‘low variance’ learning context, red = ‘high variance’ learning context; shading indicates 95% confidence intervals), and average predictions of the RW-PH-D model with SEM bars in black. Actual reward outcomes on each trial are indicated by x’s, stars indicate a change-point trial. (B-C) Experiment 2 average participant value estimates for the two scene categories (green and yellow) as a function of trial number in the 40¢−60¢ condition (B; means of the two scene categories 40¢ and 60¢) and the 20¢−80¢ condition (C; average means 20¢ and 80¢), and average predictions of the RW-PH-M-D model in black. Actual rewards varied across subjects. Although each subject saw only 15 trials of each scene type (one of two scene-value categories on each trial), we pseudo-randomized the sequence of scene-value categories so that across participants, we had data for both categories on each trial. (D-E) Total negative log-likelihood scores across subjects for each of the models tested. Lower scores indicate better fit between model predictions and empirical data; bars on the winning model indicate the minimum difference needed for a significant difference between models in the likelihood-ratio test, given the number of extra parameters in the more complex model; ‘RW’: Rescorla-Wagner, ‘PH’: Pearce-Hall, ‘M’: Mackintosh, ‘D’: Decay. In Experiment 1 (D), the RW-PH-D model, which included a Pearce-Hall and a decay component, was the winning model. In Experiment 2 (E), the RW-PH-M-D, which additionally included a Mackintosh component, outperformed the other models.
Figure 2—figure supplement 1
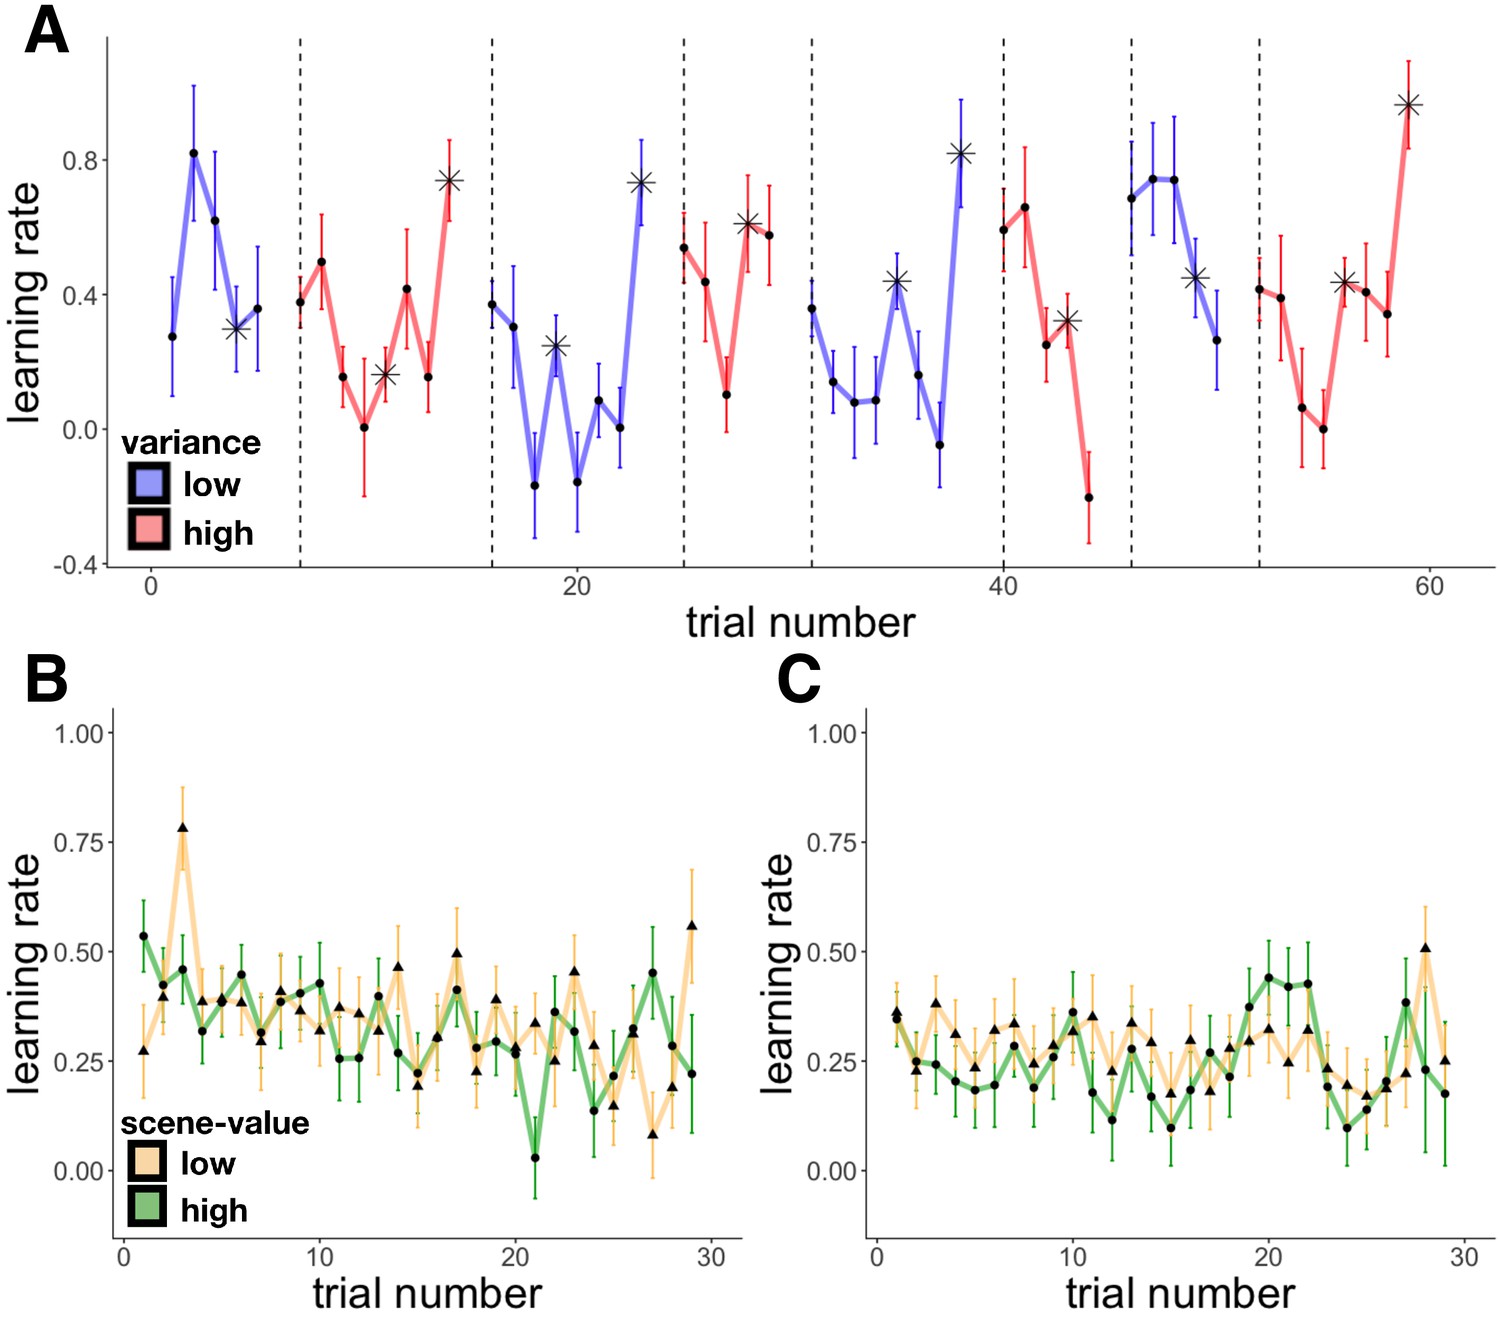
Empirical learning rates in Experiments 1 and 2.
Learning rates are plotted on the trial that generated the learning (so the learning rate on trial 1 is the proportion of the prediction error applied to the value that was then predicted on trial 2, and so forth.) (A) Experiment 1 average learning rate as a function of trial number; starred points indicate change-point trials within a context (note there were also changes between contexts). (B-C) Experiment 2 average learning rate for the two scene categories (green and yellow) as a function of trial number in the 40¢−60¢ condition (B) and the 20¢−80¢ condition (C).
Figure 2—figure supplement 2
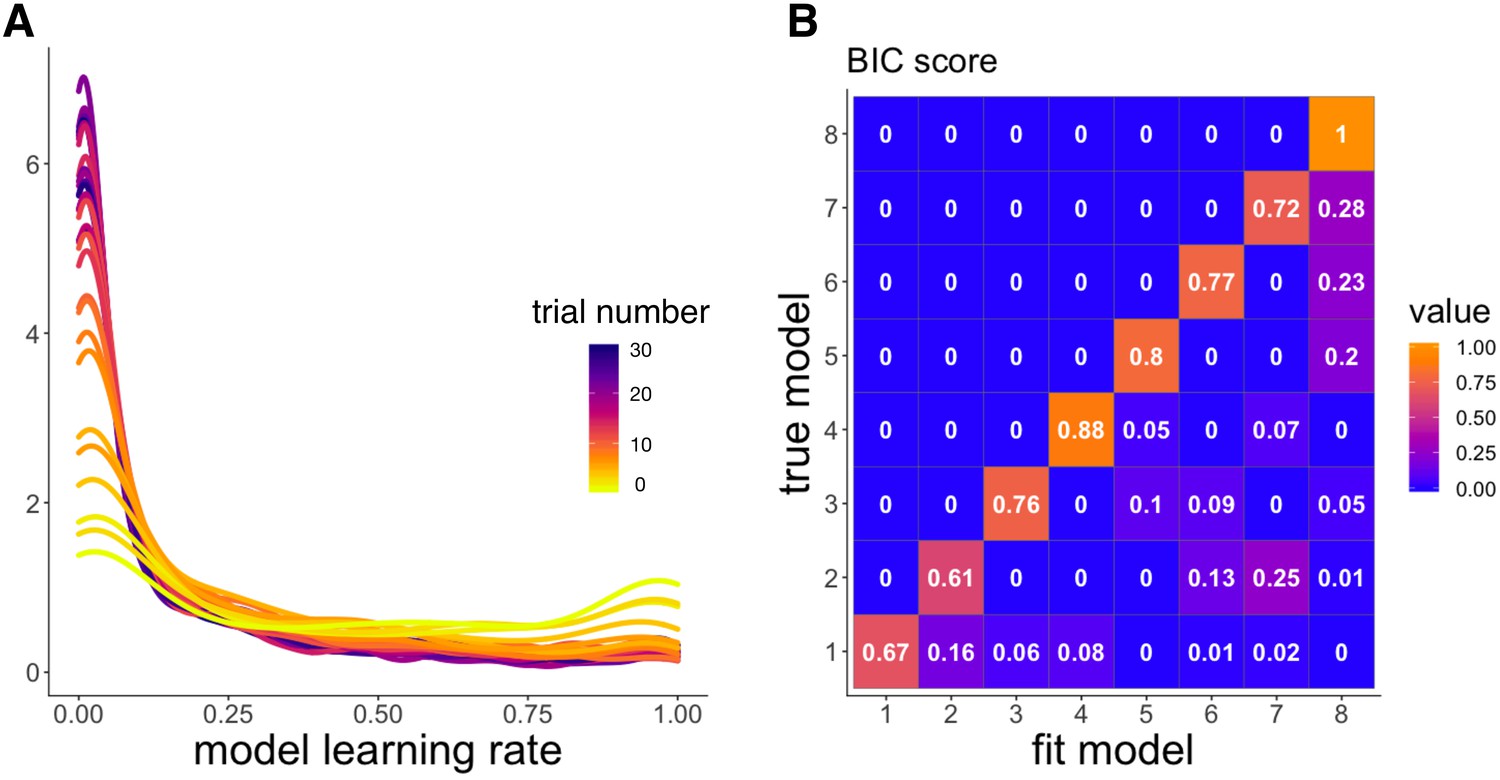
Model validation simulations from Experiment 2.
‘RW’: Rescorla-Wagner, ‘PH’: Pearce-Hall, ‘M’: Mackintosh, ‘D’: Decay. (A) Distribution of learning rates across trials (light to dark colors) from the winning model, ‘RW-PH-M-D’. Learning rates were simulated using the best fit parameters for each of the participants. Distributions were approximated from the 685 learning rates simulated per trial (one for each participant). Model learning rates decrease over time. (B) Confusion matrix showing p(fit model|true model), the probability that data generated by a model (‘true model’) were best fit by that model (‘fit model’), using Bayesian information criterion (BIC) score. Higher values on the diagonal indicate successful model recovery, and show that data simulated by a model were adequately best fit by that same model. Models: 1 = ‘RW’, 2 = ‘RW-D’, 3 = ‘RW-PH’, 4 = ‘RW-M’, 5 = ‘RW-PH-M’, 6 = ‘RW-PH-D’, 7 = ‘RW-M-D’, 8 = ‘RW-PH-M-D’.
Figure 3 with 1 supplement
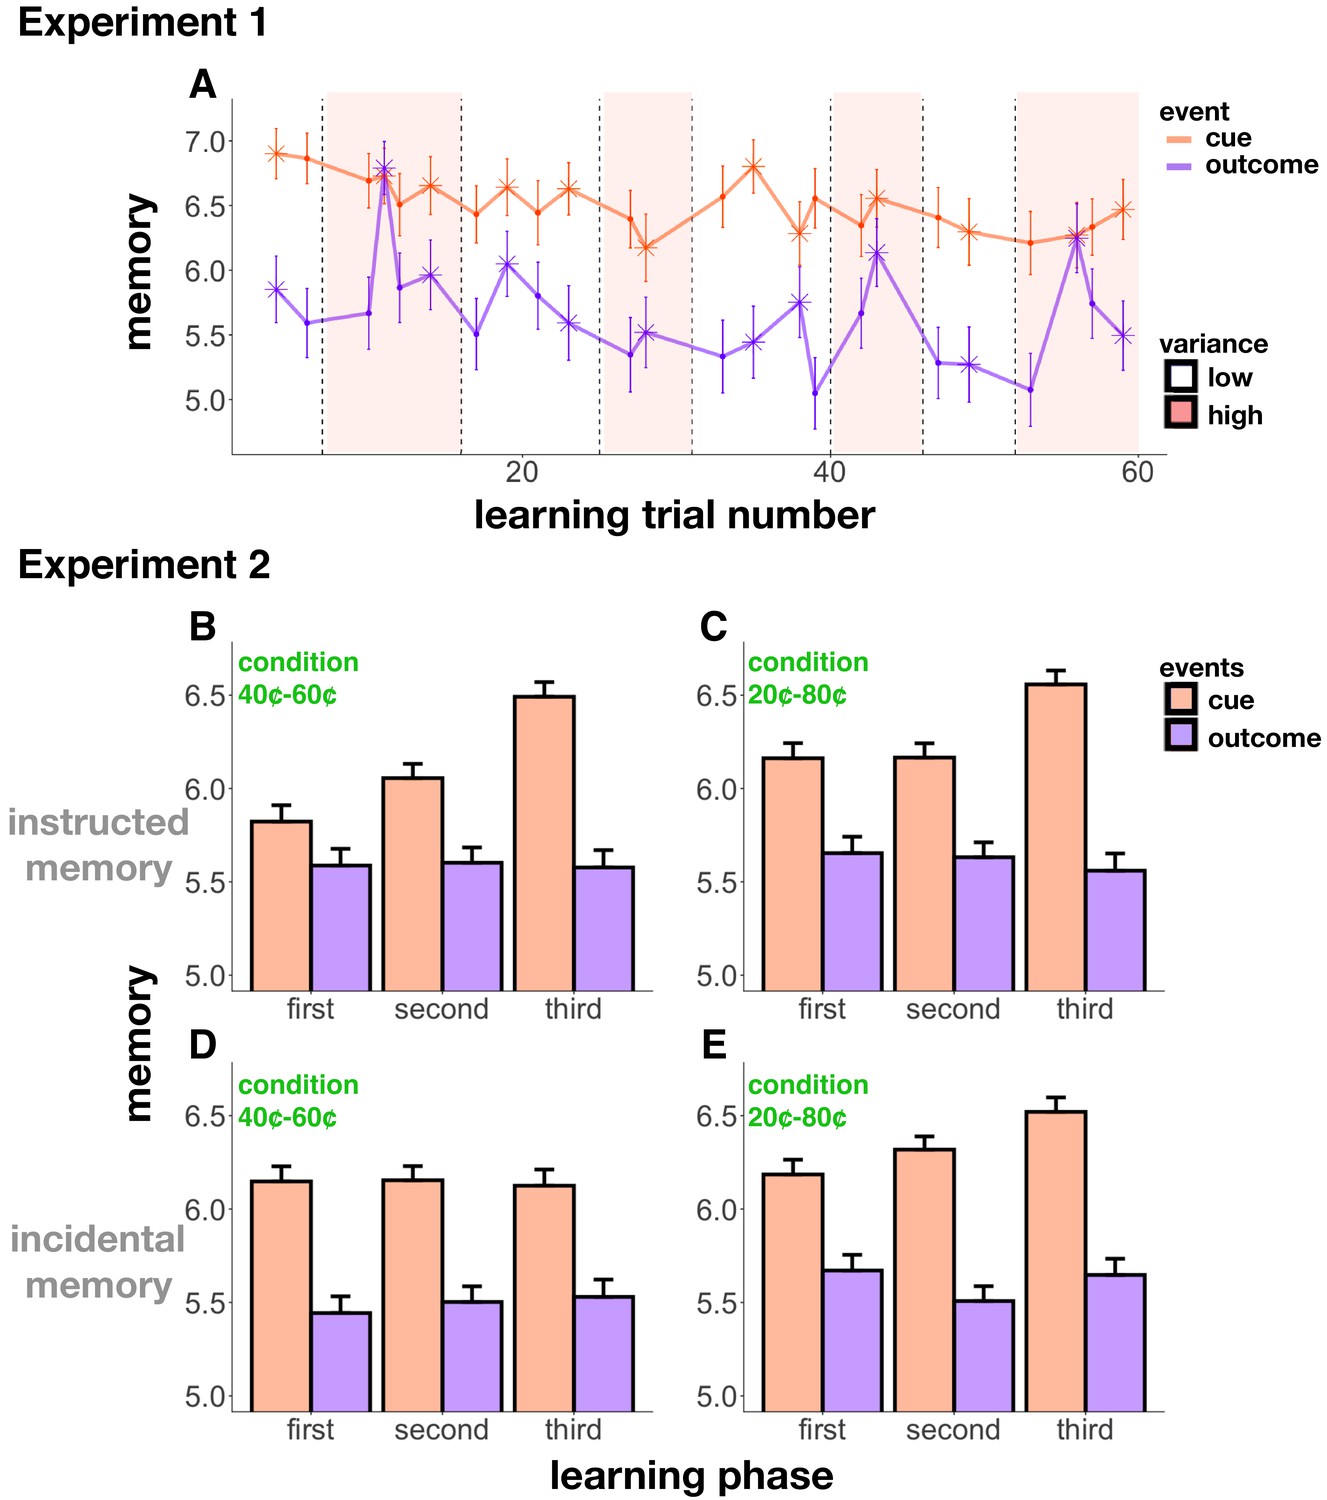
Memory accuracy across learning.
(A) Experiment 1 memory score as a function of trial number; starred points indicate change-point events. Background shading indicates condition (low- or high-reward variance). Cue memory (in orange) was in general better than outcome memory (in purple; this effect was controlled for in all of our analyses). Cue memory did not change relative to outcome memory throughout learning. Reward change-points (starred) increased memory for the outcome event. (B-E) Experiment 2 memory scores in the 40¢−60¢ condition (B,D) and the 20¢−80¢ condition (C,E), as a function of ‘learning phase’ (first, second, and third bins of learning trials). In the instructed memory version of Experiment 2 (B,C), learning enhanced cue memory in both conditions, whereas in the incidental memory version, this enhancement only occurred in the 20¢−80¢ condition, the easier learning condition (E). Differences between the instructed and incidental memory versions of the 40¢−60¢ condition were related to differences in learning performance (see main text).
Figure 3—figure supplement 1
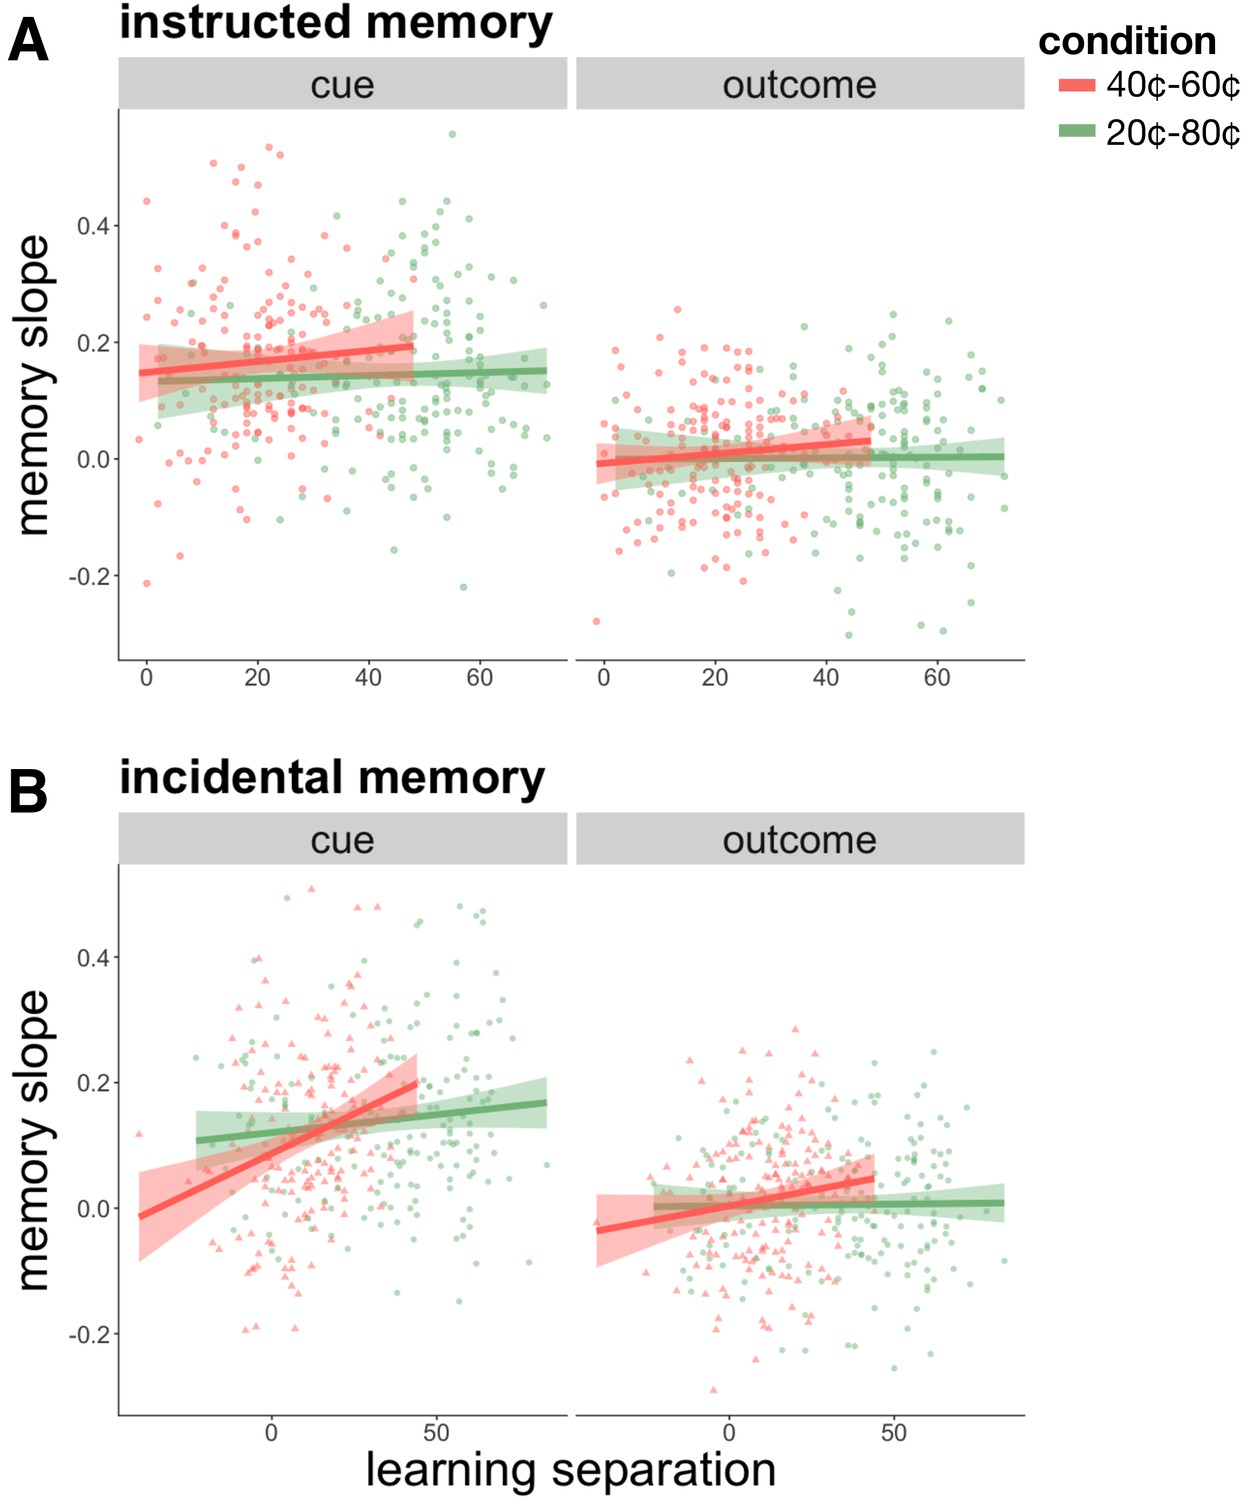
Individual differences in memory for cue and outcome events as a function of learning performance in the instructed (A) and incidental (B) memory versions of Experiment 2.
Better learners, as determined by the average difference between the high and low-value scene categories in the last five trials of learning of each category (‘learning separation’), were more likely to show better memory for cue events, but not for outcome events, as learning proceeded ('memory slope’). This relationship was strongest for the 40¢−60¢ condition, the more difficult learning condition, in the incidental memory task (B). Learning performance was worse and more variable in the incidental memory version (note location of points leftward on X axis as compared to the instructed version), which can potentially explain why there was no overall increase in cue memory over learning in the 40¢−60¢ condition of the incidental task. These results further link stronger reward expectations to increasing memory for cue events.
Figure 4
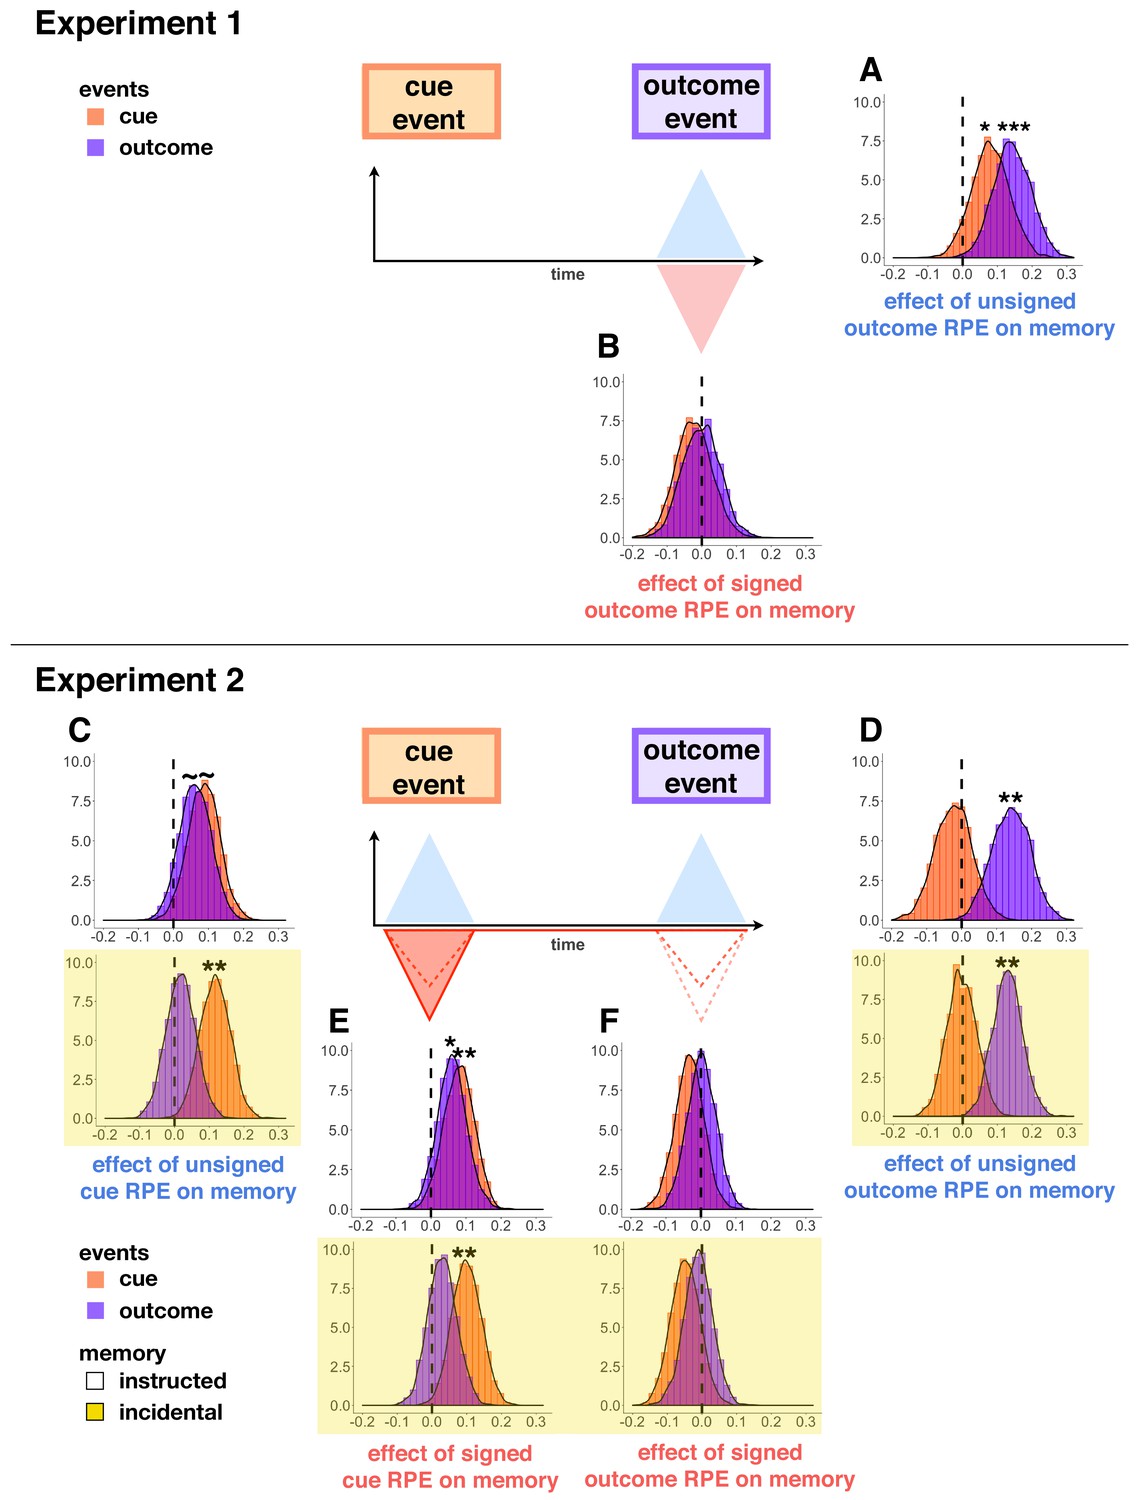
Parameter distributions from hierarchical Bayesian models of memory in Experiment 1 (A–B) and Experiment 2 (C-F, yellow background indicates incidental memory version).
Distributions significantly above or below zero indicate an effect, black stars indicate significance: p<0.1∼, p<0.05*, p<0.01**. Unsigned outcome RPEs (A,D) increased memory for outcome events, whereas signed outcome RPEs (B,F) did not. Signed cue RPEs (E) boosted memory for the cue item, and also enhanced memory for the outcome item in the instructed memory version. Unsigned cue RPEs (C) additionally, and separately, enhanced memory for cue events in the incidental memory version of the task; this effect was trending in increasing cue and outcome events in the instructed memory task.
Figure 5
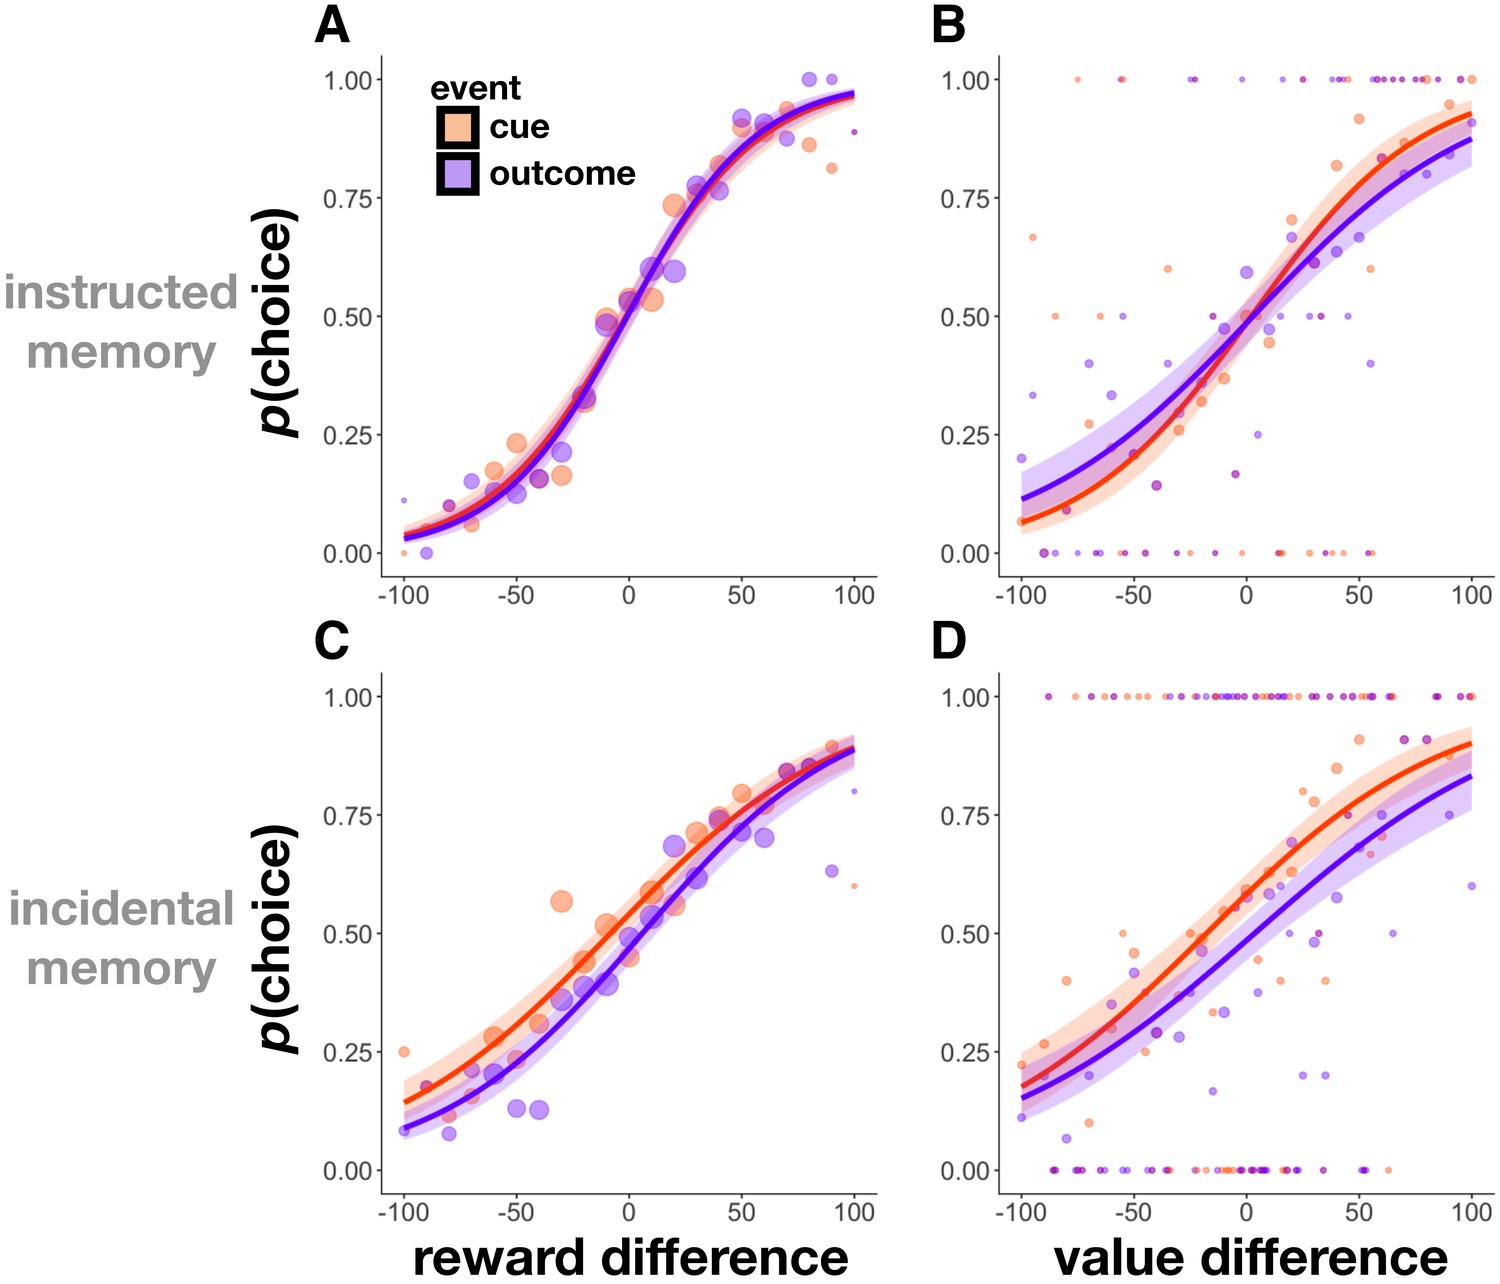
Choice probability as a function of rewards and values in Experiment 2.
(A,C) Choice probability as a function of the difference in reward outcomes between two cue or two outcome items in Experiment 2. Participants were more likely to choose cue and outcome items that had been associated with higher reward outcomes in both the instructed (A) and incidental memory (C) versions of the task. (B,D) Choice probability as a function of the difference in value between two cue or two outcome items. Participants were more likely to choose cue and outcome items that they had associated with a more valuable scene category (relative to the other scene category) at the time of encoding in both the instructed (B) and incidental memory (D) versions of the task. Size of circles reflects the size of that sample. Choice was fit using a logistic function, and shaded regions reflect 95% confidence intervals.
Figure 6

Choice between cue and outcome items from a single trial in Experiment 1 (A), the instructed memory version of Experiment 2 (B), and the incidental memory version of Experiment 2 (C).
As these items were associated with the same reward outcome and value, we would not expect preference for either item. In all cases, participants preferred the outcome item on trials with a more positive outcome RPE and the cue item on trials with a more negative outcome RPE. Size of circles reflects the size of that sample. Choice was fit using a logistic function, and shaded regions reflect 95% confidence intervals.
Author response image 1
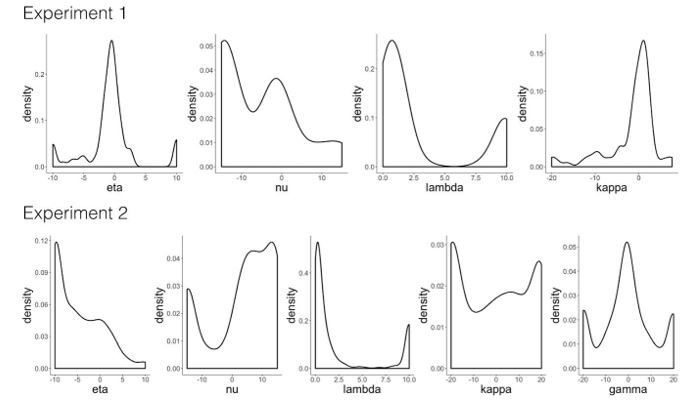
Model validation simulations.
'RW': Rescorla-Wagner, 'PH': Pearce-Hall, 'M': Mackintosh, 'D': Decay. Distribution of parameter estimates from the winning model in Experiment 1 ('RW-PH-D') and Experiment 2 ('RW-PH-M-D').
Tables
Table 1
Model parameters and fit results.
‘RW’: Rescorla-Wagner, ‘PH’: Pearce-Hall, ‘M’: Mackintosh, ‘D’: Decay. Negative log-likelihood across participants for Experiment 1 (first row within each model) and Experiment 2 (second row within each model); ‘d’ refers to the difference in score between the tested model and the baseline fixed learning rate model (‘RW’). Lower scores indicate better fit. In Experiments 1 and 2, models that included all tested components of learning rate performed best according to the likelihood-ratio test (which penalizes nested models for added parameters).
| Model | Parameters | -LL |
|---|---|---|
| RW | α | 20911.33 |
| 82049.33 | ||
| RW-PH | η, κ | 20733.54 (d = -177.79) |
| 81272.09 (d = -777.24) | ||
| RW-M | η, γ | 81378.98 (d = -670.35) |
| RW-D | η, N, λ | 20754.96 (d = -156.37) |
| 80364.74 (d = -1684.58) | ||
| RW-PH-M | η, κ, γ | 80435.42 (d = -1613.90) |
| RW-PH-D | η, κ, N, λ | 20627.11 (d = -284.22) |
| 79671.93 (d = -2377.39) | ||
| RW-M-D | η, γ, N, λ | 79472.05 (d = -2577.28) |
| RW-PH-M-D | η, κ, γ, N, λ | 78870.16 (d = -3179.17) |
Additional files
Download links
A two-part list of links to download the article, or parts of the article, in various formats.
Downloads (link to download the article as PDF)
Open citations (links to open the citations from this article in various online reference manager services)
Cite this article (links to download the citations from this article in formats compatible with various reference manager tools)
Signed and unsigned reward prediction errors dynamically enhance learning and memory
eLife 10:e61077.
https://doi.org/10.7554/eLife.61077


