Upregulation of TRPM3 in nociceptors innervating inflamed tissue
- Laboratory of Ion Channel Research (LICR), VIB-KU Leuven Centre for Brain & Disease Research, Belgium
- Department of Cellular and Molecular Medicine, KU Leuven, Belgium
- VIB Bio Imaging Core and VIB-KU Leuven Centre for Brain & Disease Research, Belgium
- Department of Neuroscience, KU Leuven, Belgium
- Laboratory for Enteric NeuroScience (LENS), TARGID, Department of Chronic Diseases Metabolism and Ageing, KU Leuven, Belgium
- Laboratory of Endometrium, Endometriosis and Reproductive Medicine, G-PURE, Department of Development and Regeneration, KU Leuven, Belgium
Figures
Figure 1 with 2 supplements
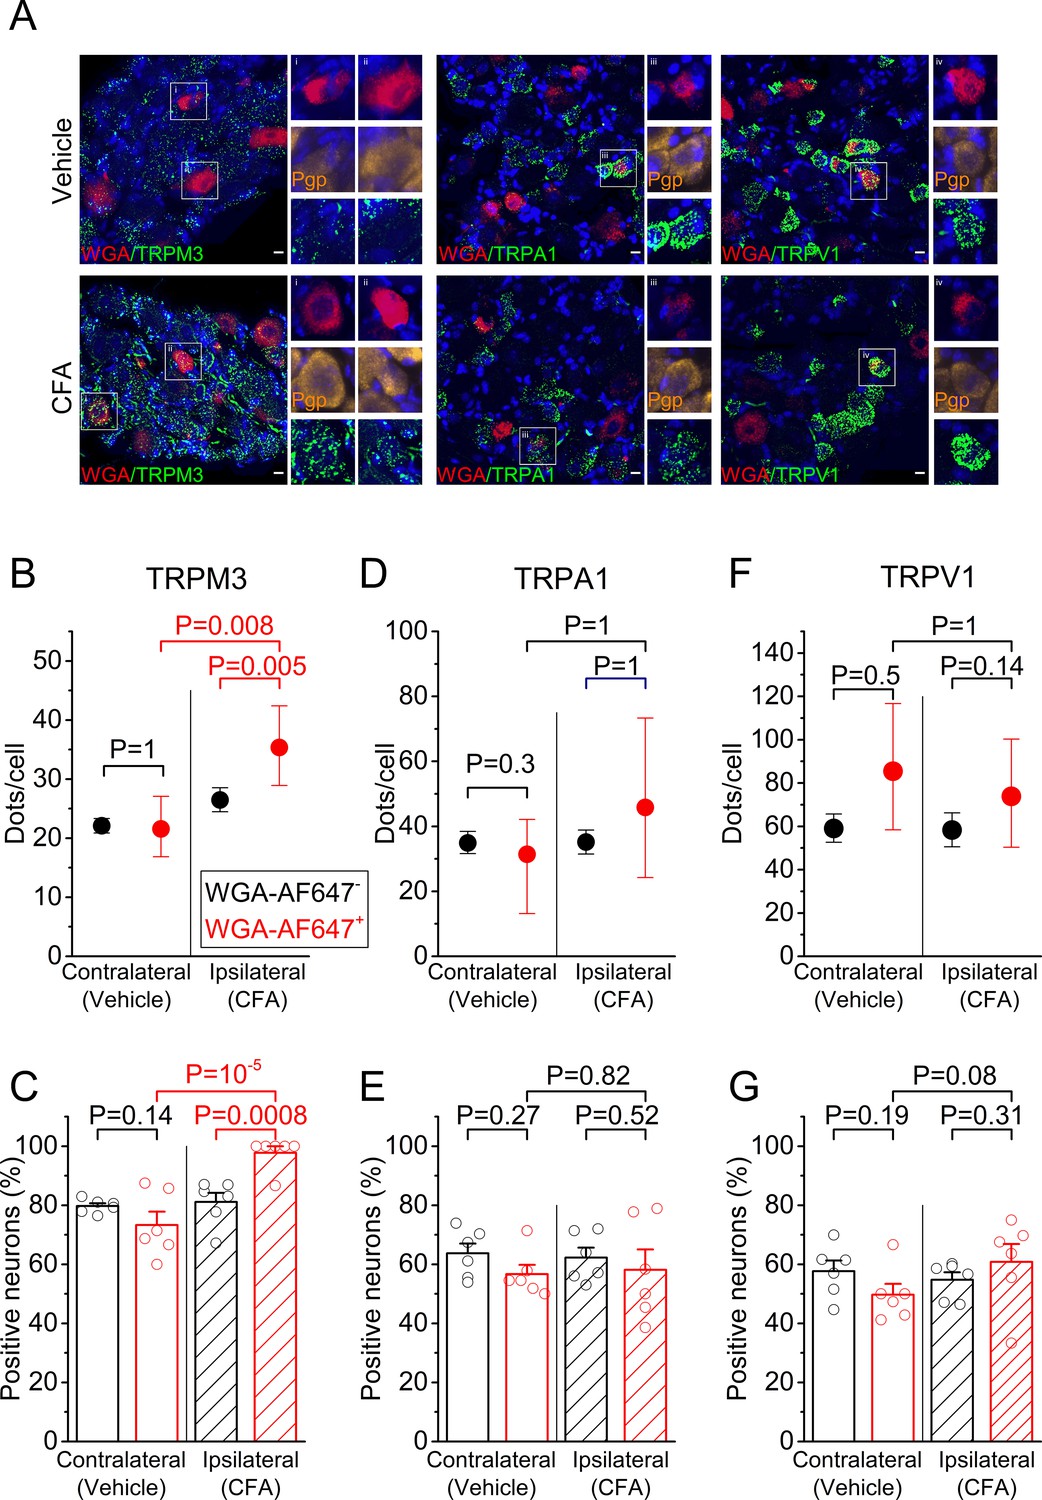
RNA expression of heat-activated TRP channels in sensory neurons innervating inflamed and control hind paws.
(A) Representative fluorescent images of processed contralateral (vehicle-treated) and ipsilateral (CFA-treated) L5 DRG. Shown are RNAscope stainings with specific probes for TRPM3 (left), TRPA1 (middle) or TRPV1 (right) (green). Retrogradely labeled neurons were identified based on the WGA-AF647 staining (magenta), and the blue color represents the nuclear marker DAPI. Retrogradely labeled neurons in the boxed areas are shown at double magnification, along with RNAscope staining for the neuronal marker Pgp9.5 (yellow), which was used to delineate neuronal cell bodies. (B,D,F) Quantification of the number of RNAscope dots per DRG neuron for TRPM3, TRPA1 and TRPV1, comparing retrogradely labeled (red) and unlabeled (black) sensory neurons, from the contralateral and ipsilateral L5 DRG. Values are presented as mean along with the 95% confidence interval. The data of the individual cells are shown in Figure 1—figure supplement 2. Statistical comparisons between groups were made using Kruskal-Wallis ANOVA with Dunn’s posthoc test. (C,E,G) Fraction of DRG neurons that showed a positive RNAscope signal (≥5 dots) for the three tested channels. Values are presented as mean ± SEM along with data points from the individual mice. Statistical comparisons between groups were made using one-way ANOVA with Holm–Šidák post-hoc test. Data are from six mice. The total numbers of analyzed neurons were for TRPM3: 752 ipsilateral and 1299 contralateral; for TRPA1: 954 ipsilateral and 947 contralateral; for TRPV1: 1054 ipsilateral and 995 contralateral.
-
Figure 1—source data 1
Raw values used for plots in Figure 1.
- https://cdn.elifesciences.org/articles/61103/elife-61103-fig1-data1-v1.xlsx
Figure 1—figure supplement 1
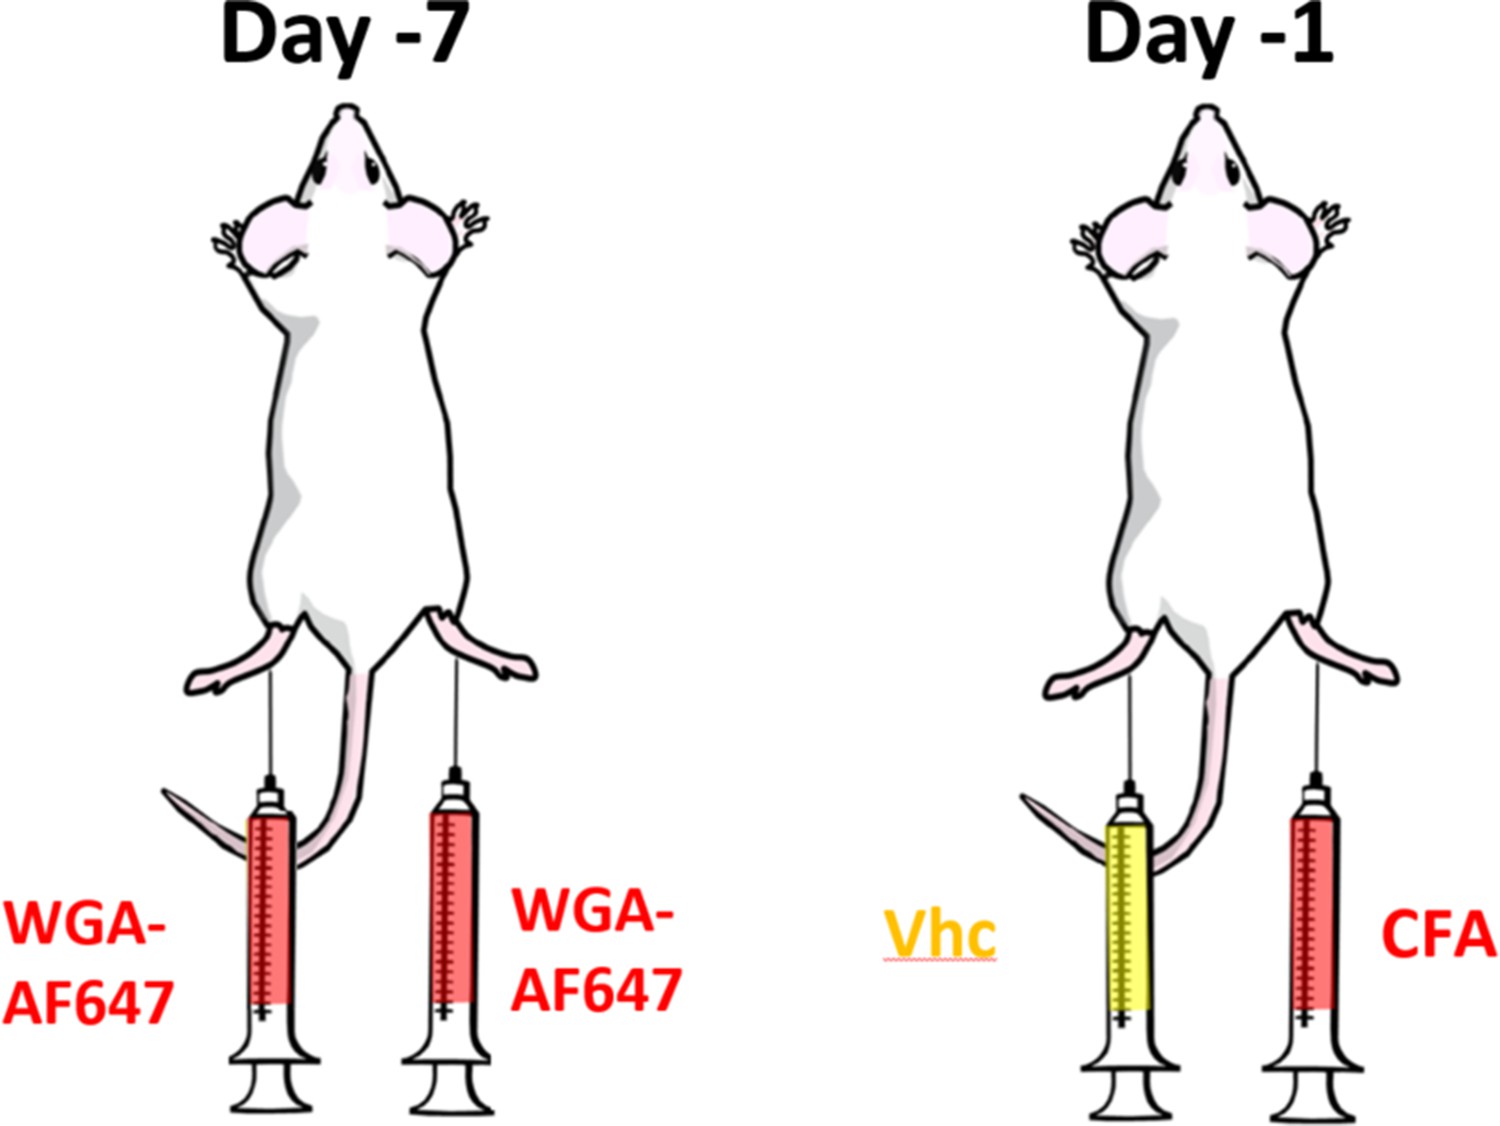
Experimental setting: seven days before analysis, mice were injected bilaterally with the retrograde label WGA-AF647.
One day before imaging, the animals received a CFA injection in one paw, and vehicle in the contralateral paw.
Figure 1—figure supplement 2
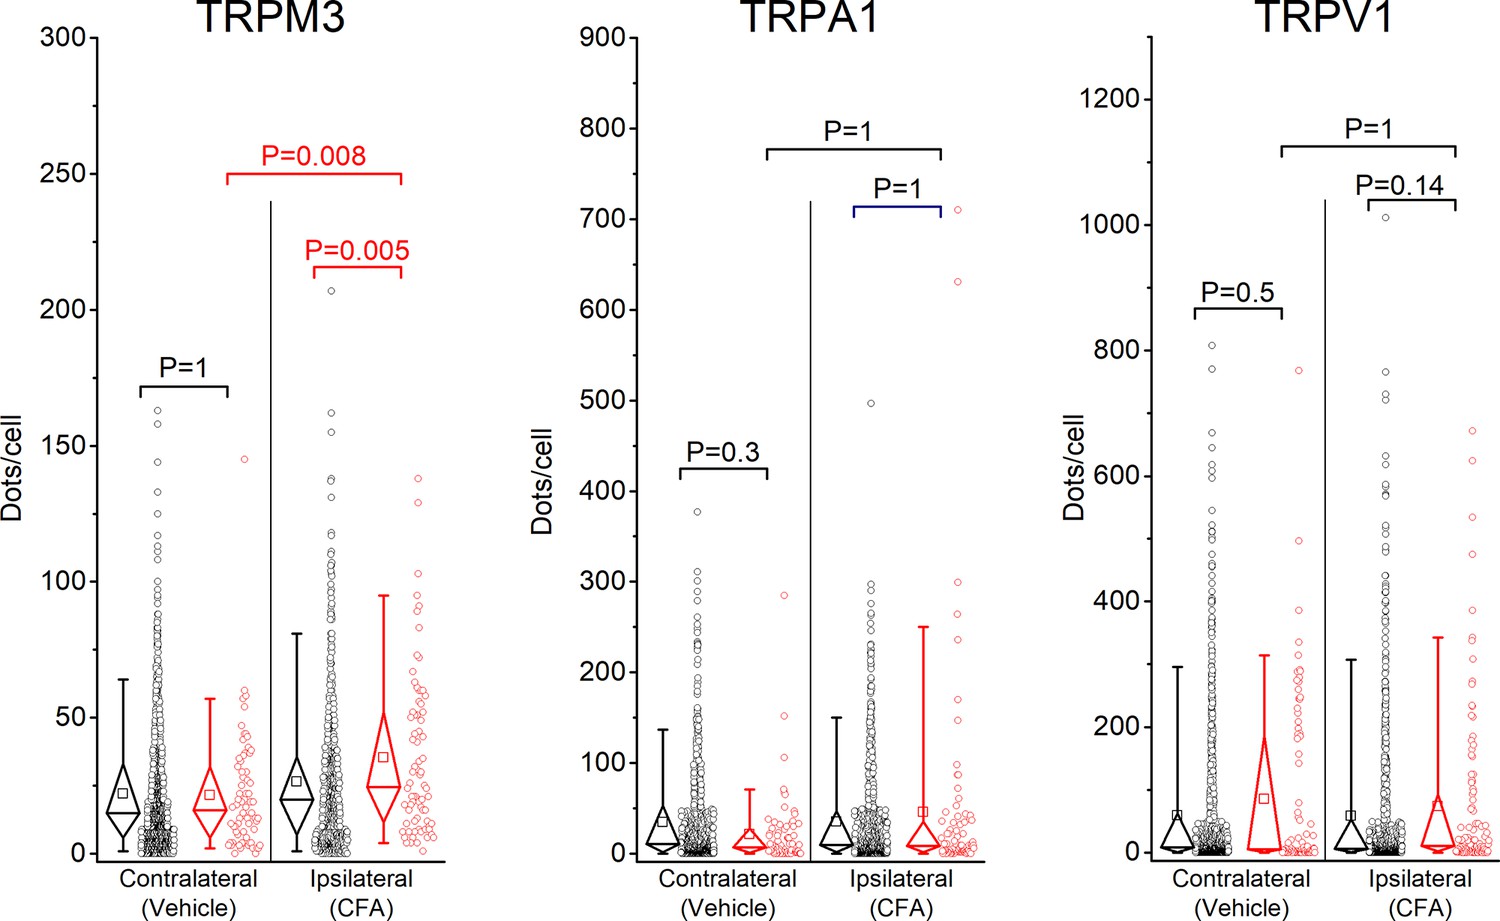
Individual data points underlying the values shown in Figure 1B,D,F are displayed, along with box plots showing the median, first and third quartiles, whiskers showing the 5th and 95th percentiles, and open squares indicating the means.
Figure 2 with 4 supplements
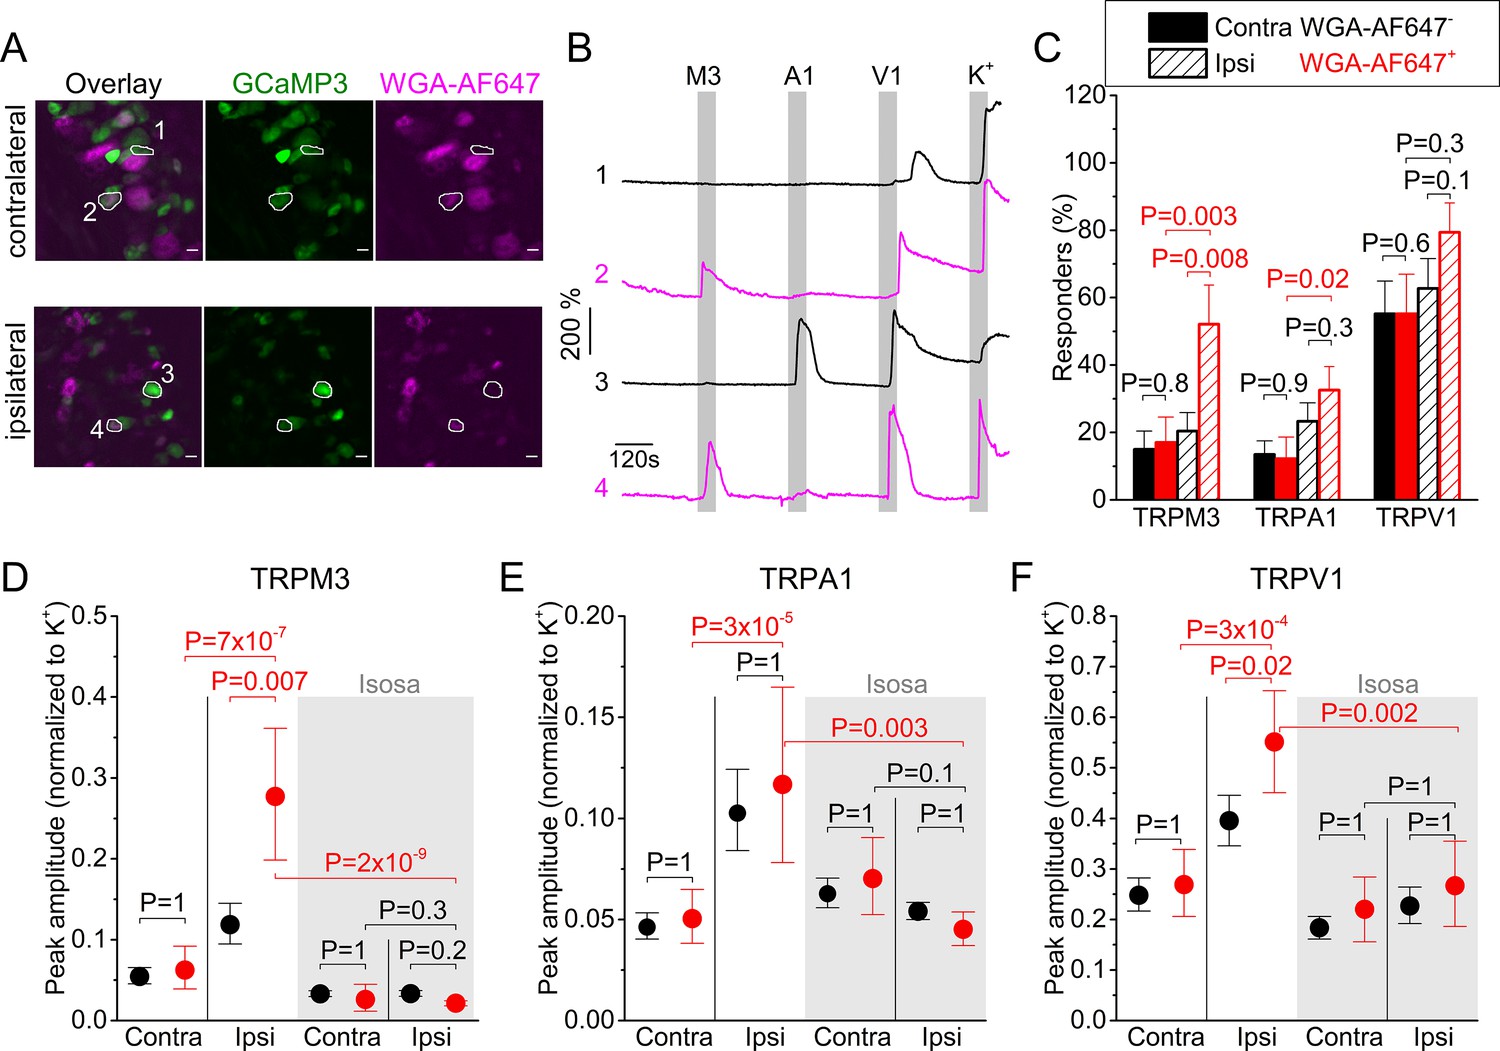
Inflammation-induced changes in TRP channel activity in DRG cell bodies.
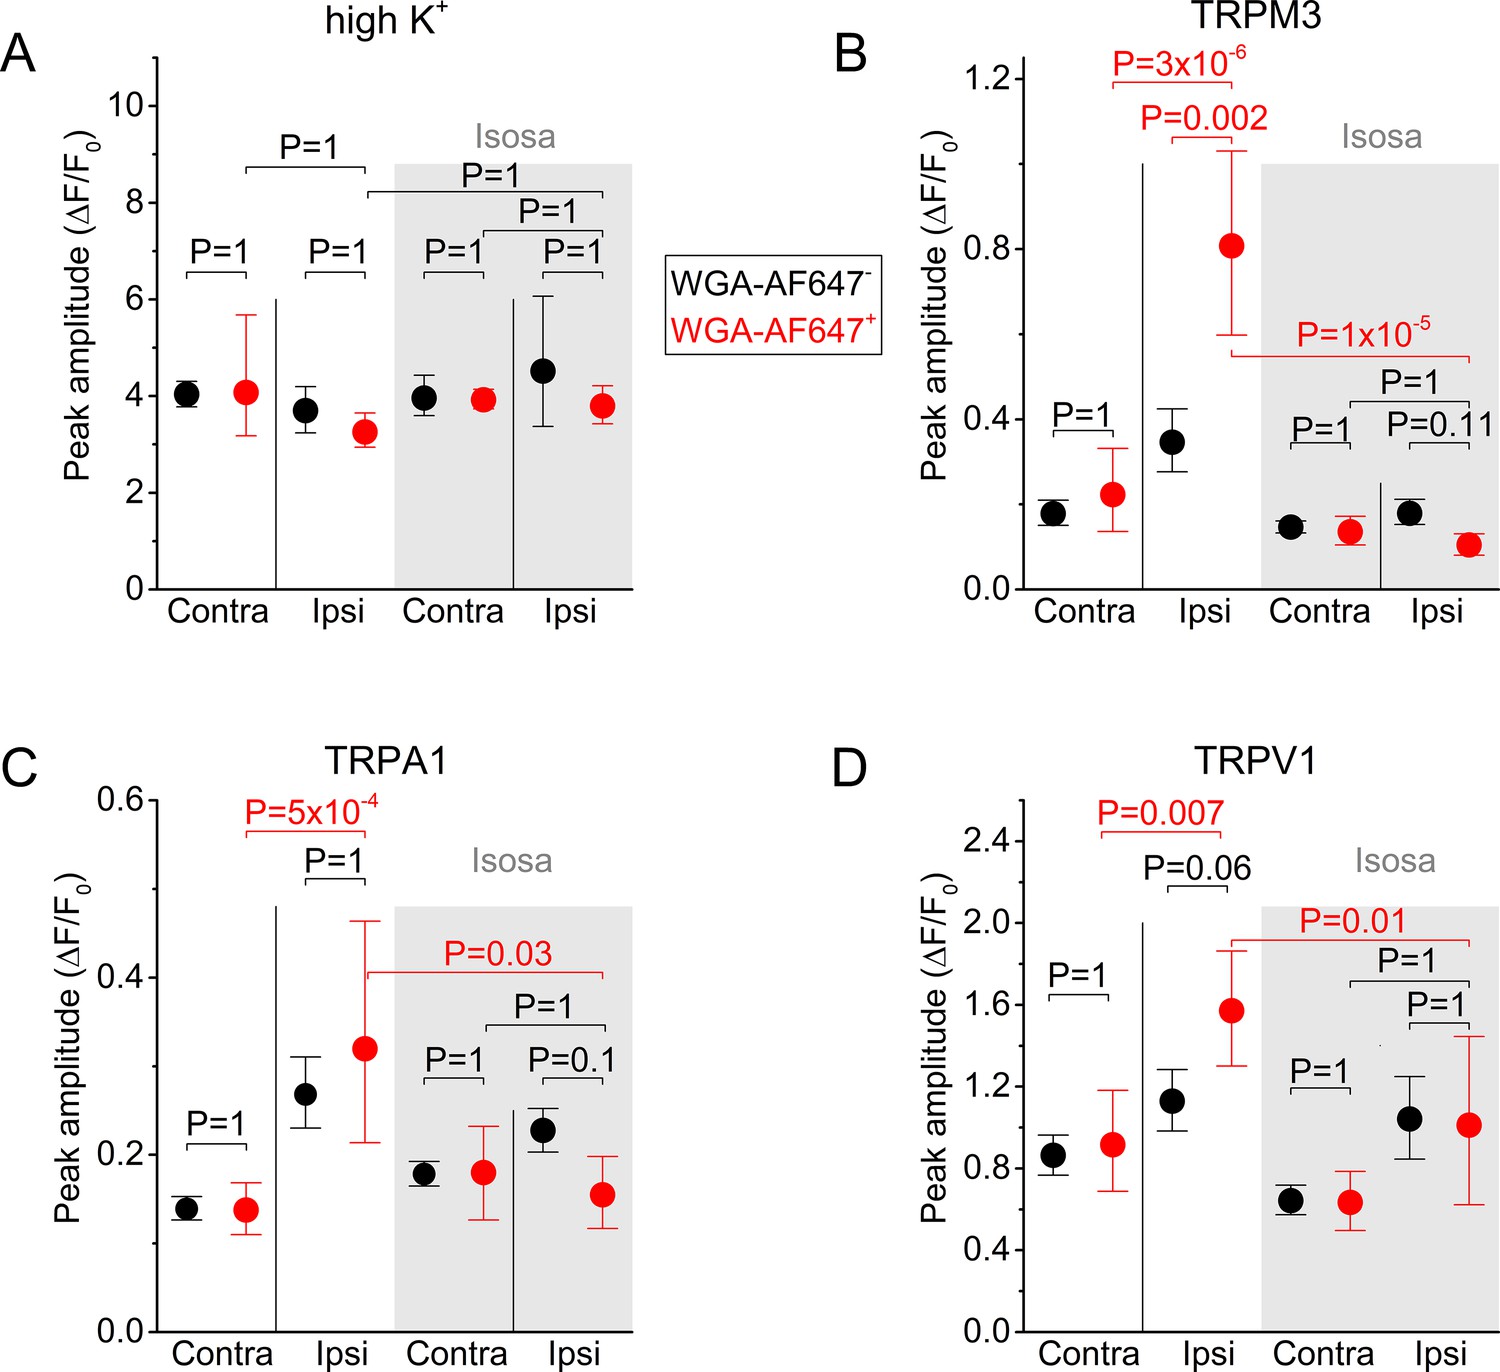
(A) Confocal images of the ipsi- and contralateral L5 DRG of a CFA-treated mouse showing GCaMP3 (green) and WGA-AF647 (magenta) fluorescence. (B) Representative examples, corresponding to cells indicated in panel (A) of changes in GCaMP3 fluorescence (ΔF/F0) in response to application of agonists of TRPM3 (PS + CIM0216; M3) TRPA1 (MO; A1) and TRPV1 (capsaicin; V1) and of a depolarizing high K+ solution (K+). (C) Percentage of neurons responding to the indicated agonists in WGA-AF647+ (red) and WGA-AF647- (black) DRG neurons from the ipsi- and contralateral sides. Data are shown as mean ± SEM from 9 mice. Statistical comparisons between groups were made using one-way ANOVA with Holm–Šidák post-hoc test. Cells that did not respond to high K+ stimulation were excluded from the analysis. (D-F) Peak amplitudes of responses to the TRPM3, TRPA1 and TRPA1 agonists, normalized to the response to the depolarizing high K+ solution, comparing retrogradely labeled (WGA-AF647+; red) and unlabeled (WGA-AF647-; black) neurons on the ipsi- and contralateral side. Where indicated (grey background), DRGs were pre-incubated with isosakuranetin (20 μM). Values are presented as mean along with the 95% confidence interval. The data of the individual cells and the number of cells in the different groups are shown in Figure 2—figure supplement 2. A comparison of the non-normalized data is provided in Figure 2—figure supplement 3. Statistical comparisons between groups were made using Kruskal-Wallis ANOVA with Dunn’s posthoc test. Data are from 9 mice in the absence of isosakuranetin and another set of 9 mice in the presence of isosakuranetin.
-
Figure 2—source data 1
Raw values used for plots in Figure 2.
- https://cdn.elifesciences.org/articles/61103/elife-61103-fig2-data1-v1.xlsx
Figure 2—figure supplement 1
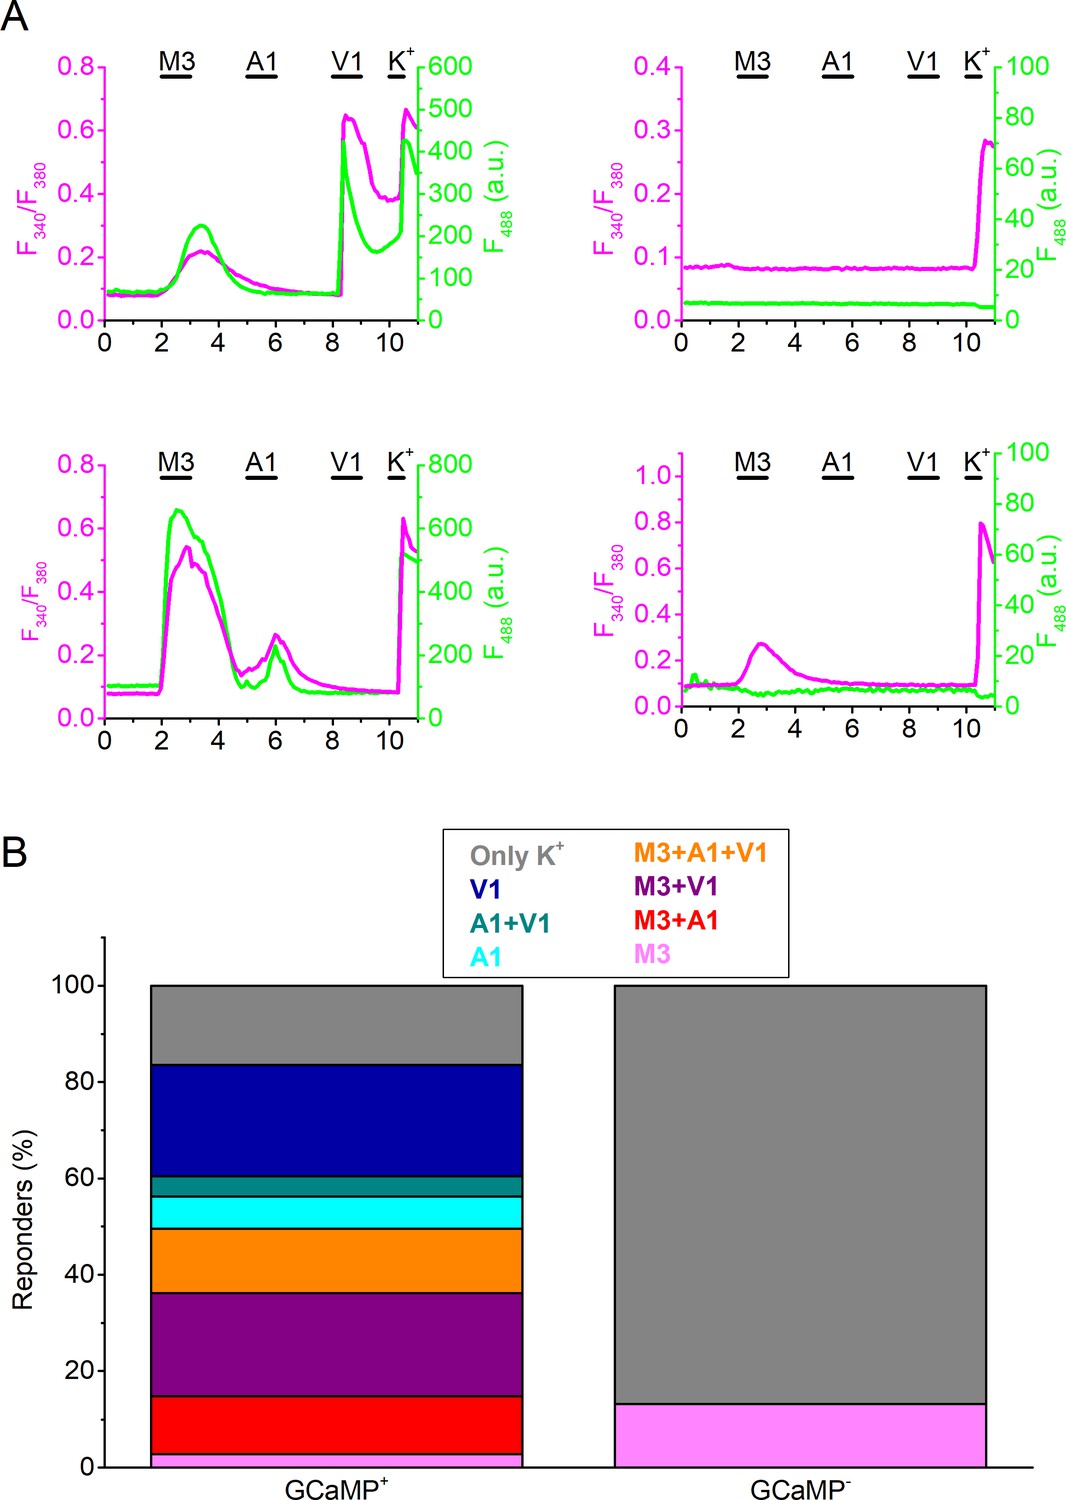
Combined GCaMP3- and Fura-2-based calcium imaging in isolated DRG neurons from TRPV1-GCaMP3 mice.
(A) Four examples of combined Fura-2-based ratiometric calcium imaging (magenta) and of the fluorescent signal upon excitation at 488 nm (green) in isolated DRG neurons from TRPV1-GCaMP3 mice stimulated with agonists of TRPM3 (PS + CIM0216; M3) TRPA1 (MO; A1) and TRPV1 (capsaicin; V1) and of a depolarizing high K+ solution (K+). The left two traces show examples of GCaMP3-positive neurons, and the right two traces of GCaMP3-negative neurons. (B) Percentage of GCaMP3-positive and GCaMP3-negative neurons responding to the different (combinations of)agonists. Cells that did not respond to high K+ stimulation were excluded from the analysis. Note that a significant fraction of the GCaMP3-positive neurons did not respond to TRPV1 agonism, indicative of neurons that lost TRPV1 expression during development. Data are from 359 cells from 4 different mice.
Figure 2—figure supplement 2
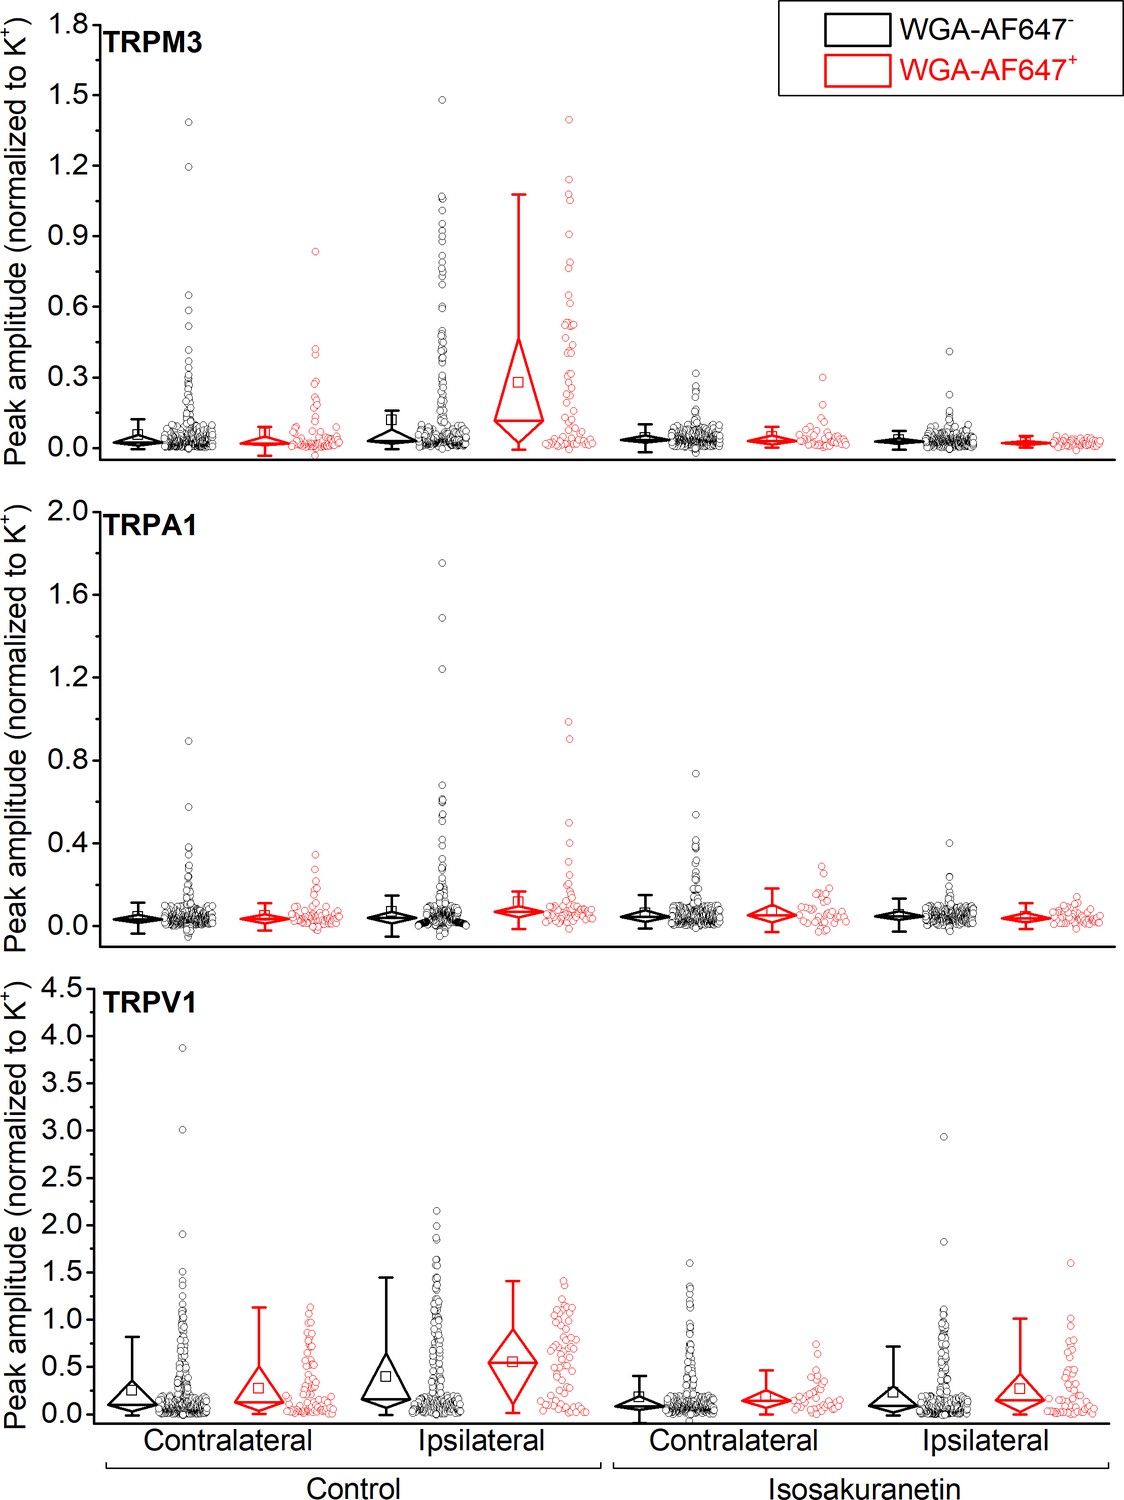
Individual data points underlying the values shown in Figure 2D–F are displayed, along with box plots showing the median, first and third quartiles, whiskers showing the 5th and 95th percentiles, and open squares indicating the means.
Figure 2—figure supplement 3
Non-normalized GCaMP3 responses.
(A) Peak amplitudes of the response to the depolarizing high K+ solution for the different groups shown in Figure 2. (B-D) Same data as shown in Figure 2D–F, but without normalization to the response to the depolarizing high K+ solution. Values are presented as mean along with the 95% confidence interval. Statistical comparisons between groups were made using Kruskal-Wallis ANOVA with Dunn’s posthoc test.
Figure 2—figure supplement 4
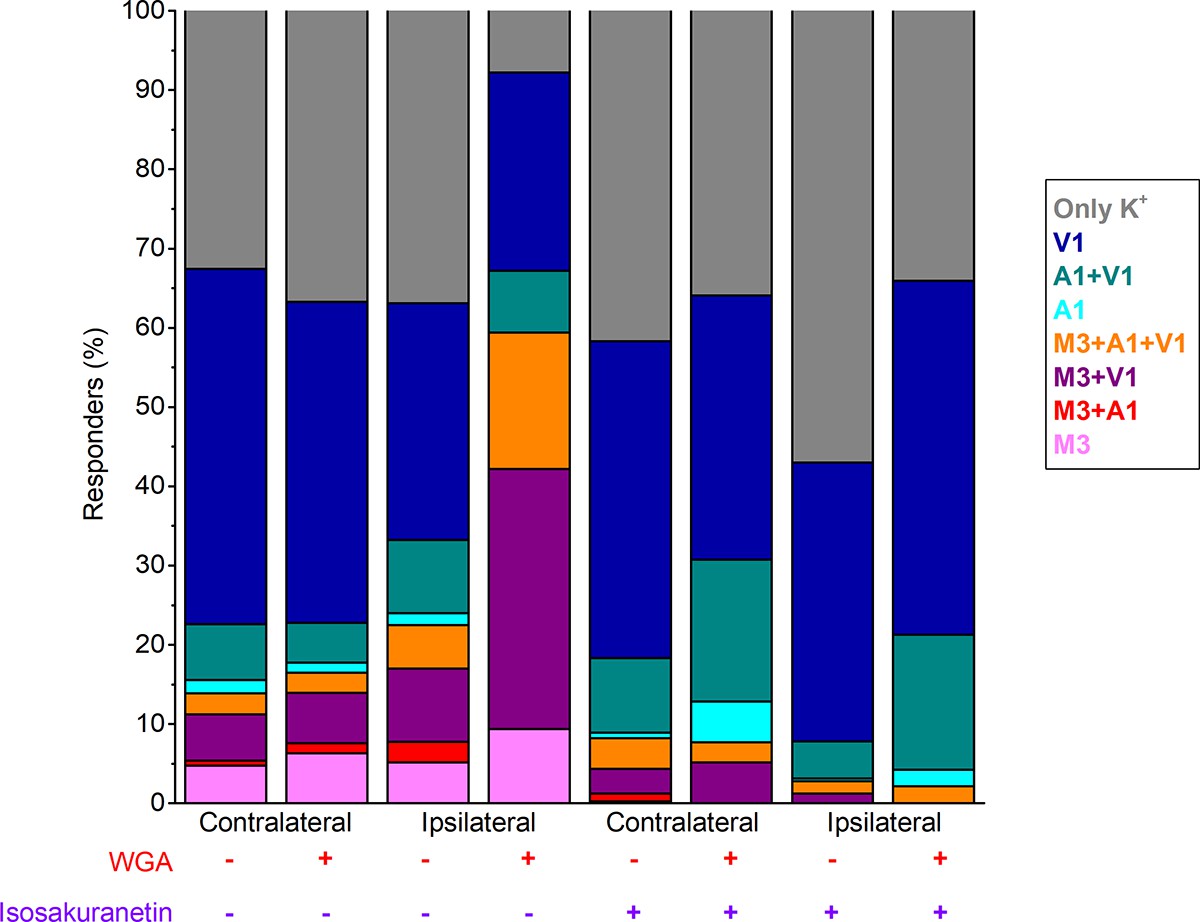
Percentage of the total imaged neurons responding to the indicated (combinations of) agonists in the contra- and ipsilateral DRG, both in control and following incubation with isosakuranetin (20 µM).
Figure 3 with 1 supplement
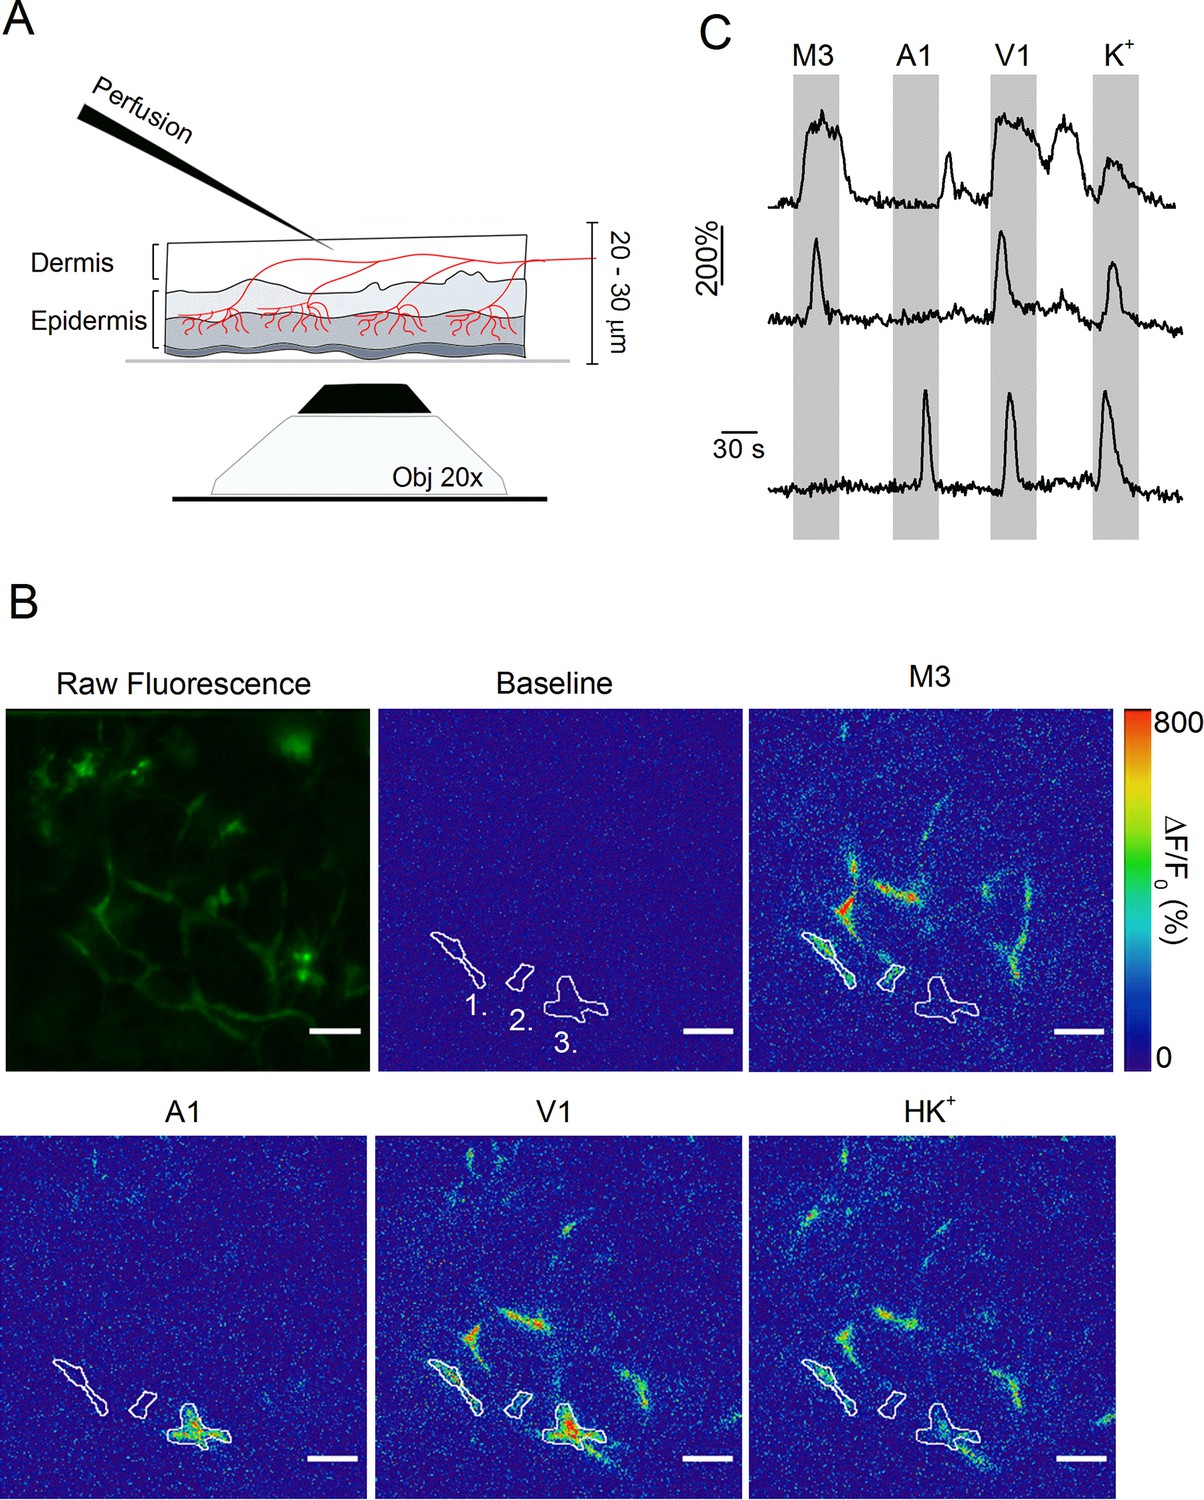
Optical measurement of TRP channel activity in peripheral sensory nerve endings.
(A) Schematic illustration of the optical imaging setup. Sensory nerve fibers (red) innervating the dermal and epidermal skin layers are visualized using 488 nm laser light and an inverted spinning disk confocal microscope (20x objective). To avoid the barrier effect of the epidermis, solutions (at 37°C) were applied to the internal side of the sample from above. A total thickness of 20–30 μm was captured. (B) The first image depicts the summed raw fluorescence of the entire imaging experiment. The next five images represent normalized fluorescence (ΔF/F0) at baseline (before the first stimulus), upon stimulation with TRPM3, TRPA1 and TRPV1 agonists, and with the depolarizing high K+ solutions. Three automatically detected ROIs, corresponding to the traces in panel C, are indicated. Scale bar is 50 μm. See Figure 3—Video 1. (C) Time course of normalized GCaMP3 fluorescence (F/F0) from three different ROIs (top: ROI 1; middle: ROI 2; bottom: ROI 3) depicted in panel B, with indication of the application periods of TRP channel agonists.
Figure 3—video 1
Video showing calcium-induced changes in GCaMP3 fluorescence in sensory nerve endings in mouse skin upon stimulation with TRP channel agonists.
Pseudocolors and timing are as in Figure 3B,C.
Figure 4 with 1 supplement
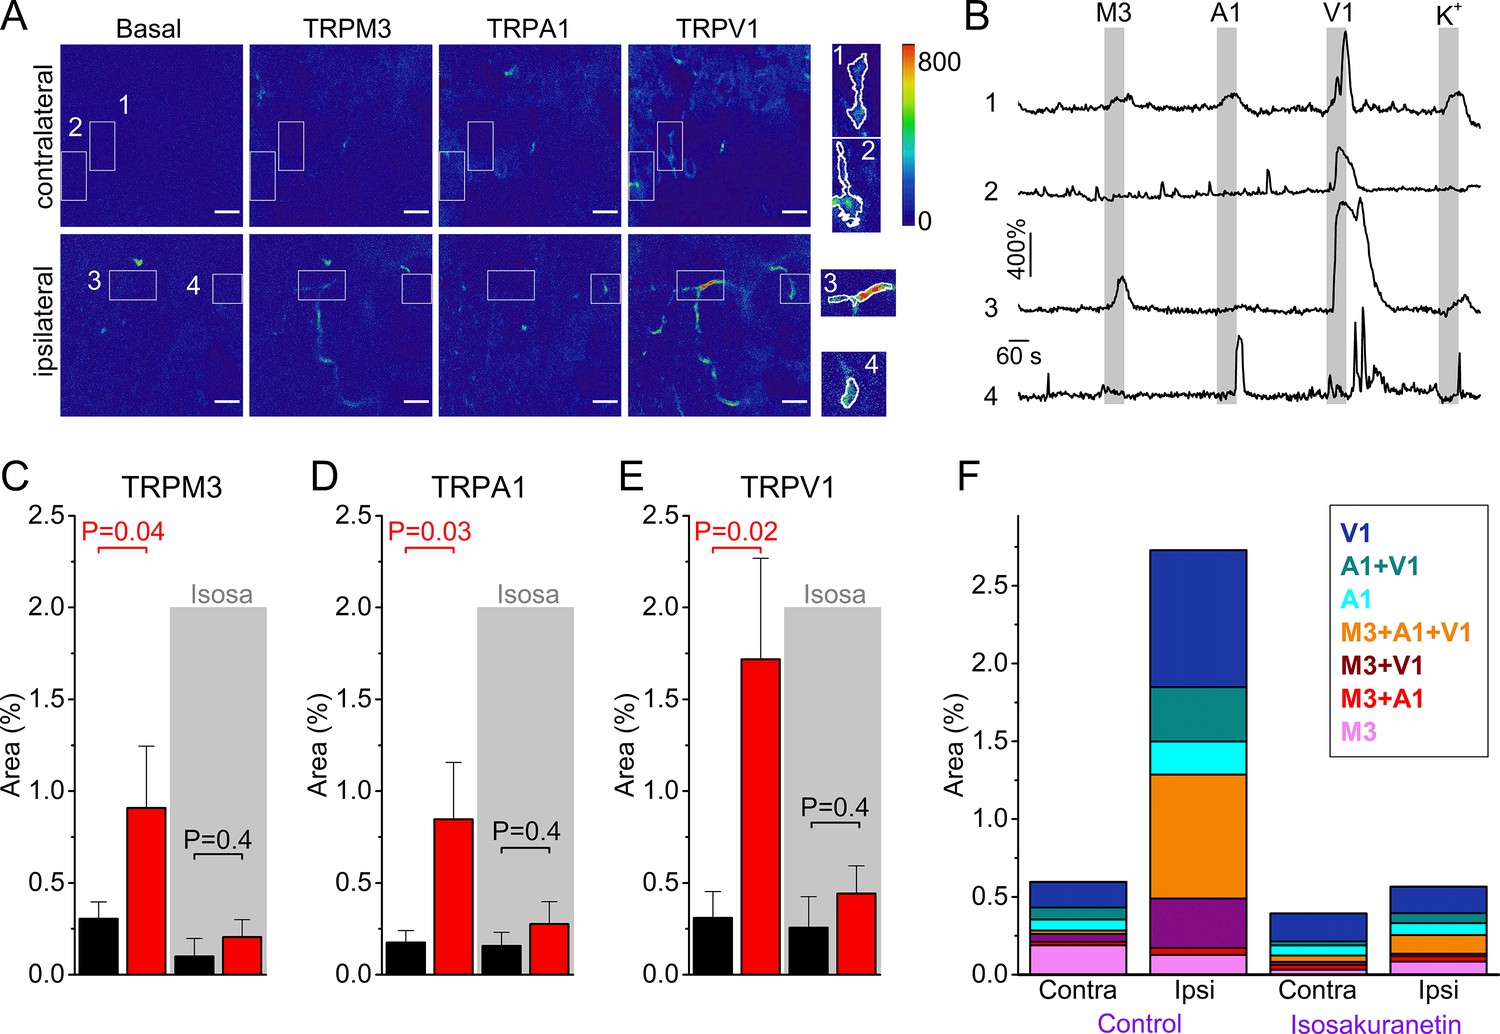
Increased TRPM3 activity in peripheral sensory nerve endings during inflammation.
(A) Normalized fluorescence at baseline (before the first stimulus), and upon stimulation with TRPM3, TRPA1 and TRPV1 agonists of the ipsi- and contralateral skin of a CFA-treated mouse. Scale bar is 50 μm. Boxed areas, magnified on the right, illustrate automatically detected ROIs. (B) GCaMP3 fluorescence, expressed as ΔF/F0, for the ROIs indicated in panel (A). (C-E) Responsive areas to the indicated agonists in the contralateral (black) and ipsilateral (red) skin. The paired Wilcoxon Signed Rank Test was used for a paired comparison of the responsive area in the ipsi- and contralateral paw skin of 11 mice, measured in the absence of isosakuranetin. The ipsi- and contralateral skin of another set of 6 mice was compared following pre-incubation with isosakuranetin (20 μM; grey background). Since the control and isosakuranetin-treated skin preparations originate from different mice, and considering the substantial inter-animal variability in skin thickness and innervation, a full statistical comparison between these data sets was not performed. (F) Percentage of the total imaged area responding to the indicated (combinations of) agonists in the contra- and ipsilateral paws, and following isosakuranetin pre-incubation. Further statistical comparison is provided in Figure 4—figure supplement 1.
-
Figure 4—source data 1
Raw values used for plots in Figure 4.
- https://cdn.elifesciences.org/articles/61103/elife-61103-fig4-data1-v1.xlsx
Figure 4—figure supplement 1
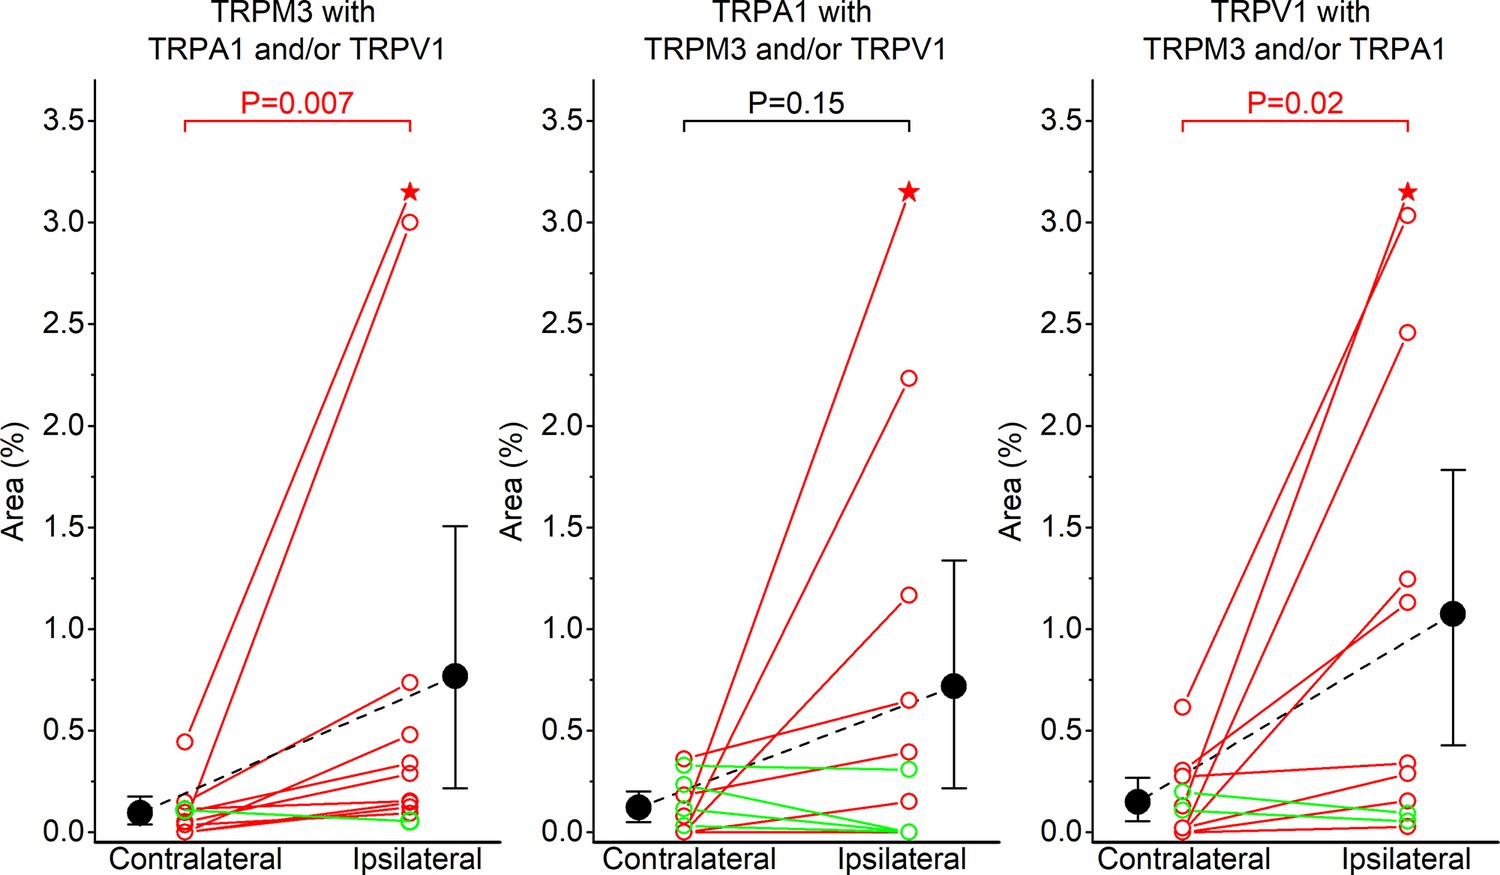
Inflammation-induced increases in sensory nerve endings that respond to multiple TRP agonists.
(A-C) Responsive areas that were identified based on their response to TRPM3 (A), TRPA1 (B) or TRPV1 (C) Agonism, and that also responded to at least one other TRP channel agonist. Individual dots and interconnecting full lines represent values of the contralateral and ipsilateral paw of individual mice (N = 11). Mice where the responsive area was increased in the inflamed paw compared to the control paw are indicated in red, those where there was a decrease in green. Solid black circles represent the mean and error bars the 95% confidence interval. Statistical comparisons were made using the paired Wilcoxon Signed Rank Test. The upper symbol (star) represents a highly responsive inflamed skin with actual responsive areas of 7.69% (TRPM3 with TRPA1 and/or TRPV1), 8.23% (TRPA1 with TRPM3 and/or TRPV1) and 8.62% (TRPV1 with TRPM3 and/or TRPA1).
Tables
Key resources table
| Reagent type (species) or resource | Designation | Source or reference | Identifiers | Additional information |
|---|---|---|---|---|
| Genetic reagent (M. musculus) | C57BL/6JRj | Janvier Labs | https://www.janvier-labs.com/en/fiche_produit/c57bl-6jrj_mouse/ | |
| Genetic reagent (M. musculus) | TRPV1-GCaMP3 | This paper | Obtained by crossing Gt(ROSA)26Sortm38(CAG-GCaMP3)Hze/J mice (Stock#: 029043) with Trpv1tm1(cre)Bbmmice (Stock#: 017769). Both strains were acquired from Jackson Laboratory. Crossings were made in house. | |
| Peptide, recombinant protein | WGA-AF647 (wheat germ agglutinin- Alexa Fluor 647) | Thermo Fisher Scientific | Cat#: W32466 | 0.8% in PBS; 10 µl per injection |
| Commercial assay or kit | RNAscope 2.0 Fluorescent Multiplex Reagent Kit | Advanced Cell Diagnostics | Cat#: 320850; RRID:SCR_012481 | |
| Commercial assay or kit | TRPV1 Probe | Advanced Cell Diagnostics | Cat#: 313331 | |
| Commercial assay or kit | TRPM3 Probe | Advanced Cell Diagnostics | Cat#: 459911 | |
| Commercial assay or kit | TRPA1 Probe | Advanced Cell Diagnostics | Cat#: 400211 | |
| Commercial assay or kit | PgP9.5 Probe | Advanced Cell Diagnostics | Cat#: 561861-C2 | |
| Chemical compound, drug | isosakuranetin | Extrasynthese | Cat#: 1374 | 20 µM |
| Chemical compound, drug | CIM0216 | Sigma-Aldrich | Cat#: 534359 | 1 µM |
| Chemical compound, drug | Pregnenolone sulfate | Sigma-Aldrich | Cat#: P162 | 100 µM |
| Chemical compound, drug | Mustard oil | Sigma-Aldrich | Cat#: W203408 | 100 µM |
| Chemical compound, drug | capsaicin | Sigma-Aldrich | Cat#: M2028 | 1 µM |
| Chemical compound, drug | DAPI | Thermo Fisher Scientific | Cat#: P36931 | |
| Software, algorithm | Turboreg algorithm | https://imagej.net/TurboReg | RRID:SCR_003070 | |
| Software, algorithm | CNMF-E algorithm | https://github.com/zhoupc/CNMF_E | RRID:SCR_001622 | |
| Software, algorithm | NIS software | Nikon Instruments | RRID:SCR_014329 | |
| Software, algorithm | OriginPro 2019b | Originlabs | RRID:SCR_014212 | |
| Software, algorithm | Igor Pro 8 | Wavemetrics | ||
| Other | CFA (complete freund’s adjuvant) | Sigma-Aldrich | Cat#: F5581 | (1 mg/ml) 10 µl per injection |
| Other | Glass-bottom microwell dish | MatTek | Cat#: P35G-1.5–14 C | |
| Other | Glass-bottom chamber | Fluorodish, WPI | Cat#: FD35-100 | |
| Other | DAPI | Thermo Fisher Scientific | Cat#: P36931 |
Additional files
Download links
A two-part list of links to download the article, or parts of the article, in various formats.
Downloads (link to download the article as PDF)
Open citations (links to open the citations from this article in various online reference manager services)
Cite this article (links to download the citations from this article in formats compatible with various reference manager tools)
Upregulation of TRPM3 in nociceptors innervating inflamed tissue
eLife 9:e61103.
https://doi.org/10.7554/eLife.61103


