The malaria parasite sheddase SUB2 governs host red blood cell membrane sealing at invasion
- Malaria Biochemistry Laboratory, The Francis Crick Institute, United Kingdom
- Protein Analysis and Proteomics Platform, The Francis Crick Institute, United Kingdom
- Electron Microscopy Science Technology Platform, The Francis Crick Institute, United Kingdom
- Faculty of Infectious Diseases, London School of Hygiene & Tropical Medicine, United Kingdom
Figures
Figure 1 with 1 supplement
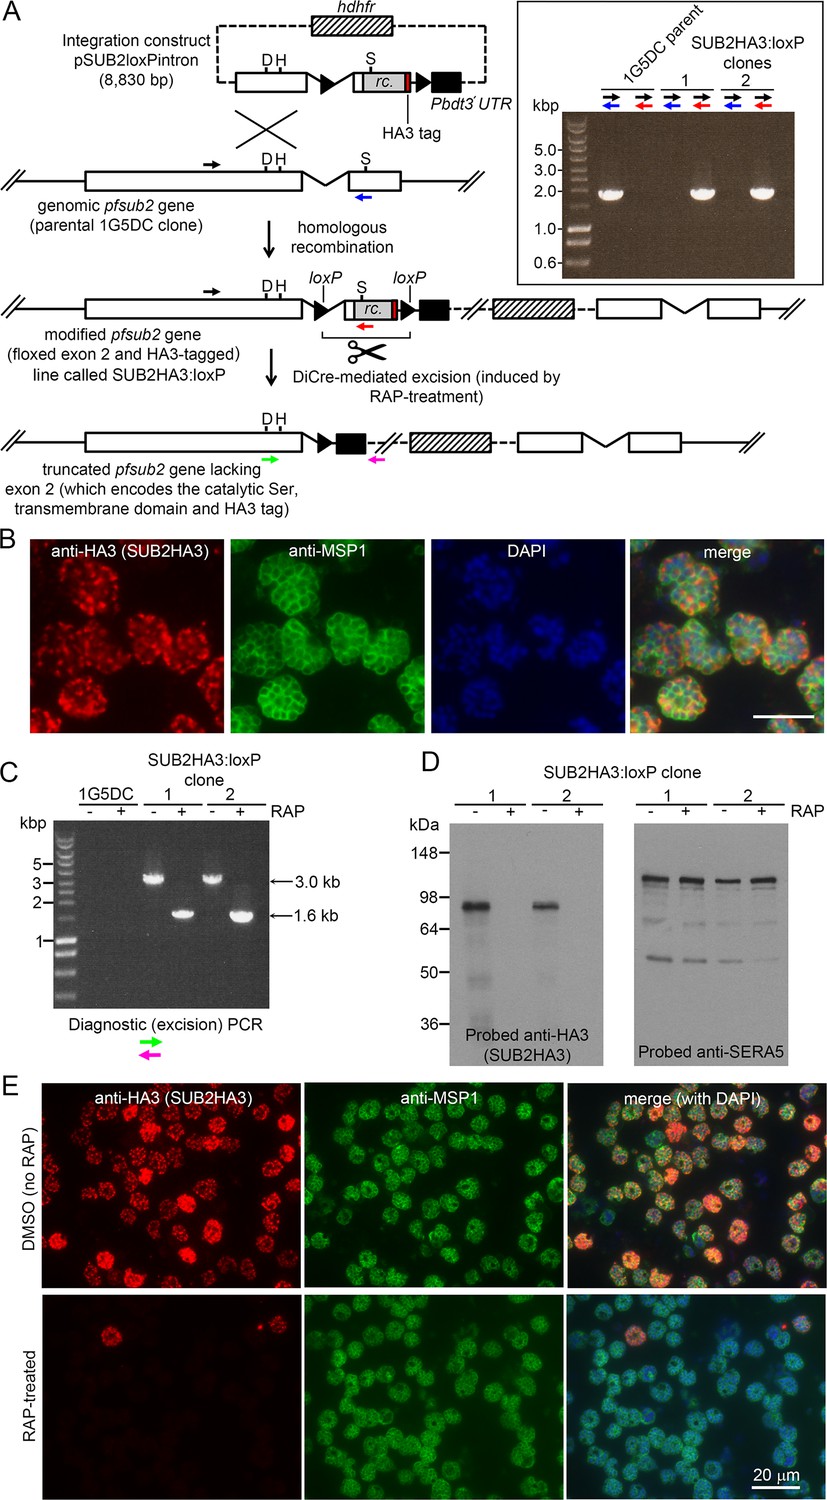
Conditional disruption of the sub2 gene within a single erythrocytic cycle.
(A) Floxing and epitope tagging. The P. falciparum sub2 gene (PlasmoDB PF3D7_1136900) comprises two exons and a 143 bp intron. Targeting construct pSUB2loxPintron contains an internal ~1,750 bp gene segment with the intron modified by insertion of a loxP site (arrow-head). This was fused to synthetic sub2synth sequence (Harris et al., 2005) (rc.) encoding the TMD and cytoplasmic domain, plus an HA3 tag and stop codon, followed by a second loxP site then the 3' UTR of the P. berghei dihydrofolate reductase (dhfr) gene (Pbdt3' UTR, black box) to ensure correct gene transcription and polyadenylation. The human dhfr cassette confers resistance to the antifolate WR99210. Plasmid backbone, dotted line. Single-crossover recombination introduces the entire construct into the genome, floxing exon two and producing a promoterless downstream partial gene duplication. Catalytic triad residues; D, H, S. Coloured arrows; primers for diagnostic PCR (see Materials and methods for sequences and colour codes). Inset, diagnostic PCR confirming pSUB2loxPintron integration. Predicted sizes of PCR amplicons: 1,943 bp (black/blue primers); and 1,954 bp (black/red). (B) IFA localising SUB2HA3 in SUB2HA3:loxP schizonts. Parasite nuclei were stained with 4,6-diamidino-2-phenylindole (DAPI, blue). Scale bar, 10 μm. (C) PCR confirming RAP-induced excision of the floxed exon 2. (D) Western blot of schizont extracts showing loss of SUB2HA3 following RAP treatment. The PV protein SERA5 acted as loading control. (E) IFA showing loss of SUB2HA3 in cycle 0 SUB2HA3:loxP schizonts following RAP treatment of rings. Expression was detectable in just 2 ± 0.1% of RAP-treated schizonts (the microscopic field was deliberately chosen to include 2 of the rare HA3-positive schizonts). See also Figure 1—figure supplement 1.
Figure 1—figure supplement 1

Loss of SUB2 expression in cycle 0 has no impact on schizont development or morphology.
(A) Light micrographs of Giemsa-stained DMSO- and rapamycin (RAP)-treated SUB2HA3:loxP schizonts (cycle 0) showing normal morphology in both cases. (B) IFA of DMSO- (control) and RAP-treated mature cycle 0 SUB2HA3:loxP schizonts, showing the expected punctate localisation of the microneme proteins apical membrane antigen 1 (AMA1) and EBA175, and the rhoptry neck protein RON4. SUB2 was detected with antibodies to the HA3 epitope tag. Parasite nuclei were stained with the DNA dye 4,6-diamidino-2-phenylindole (DAPI, blue). Scale bars, 5 μm.
Figure 2
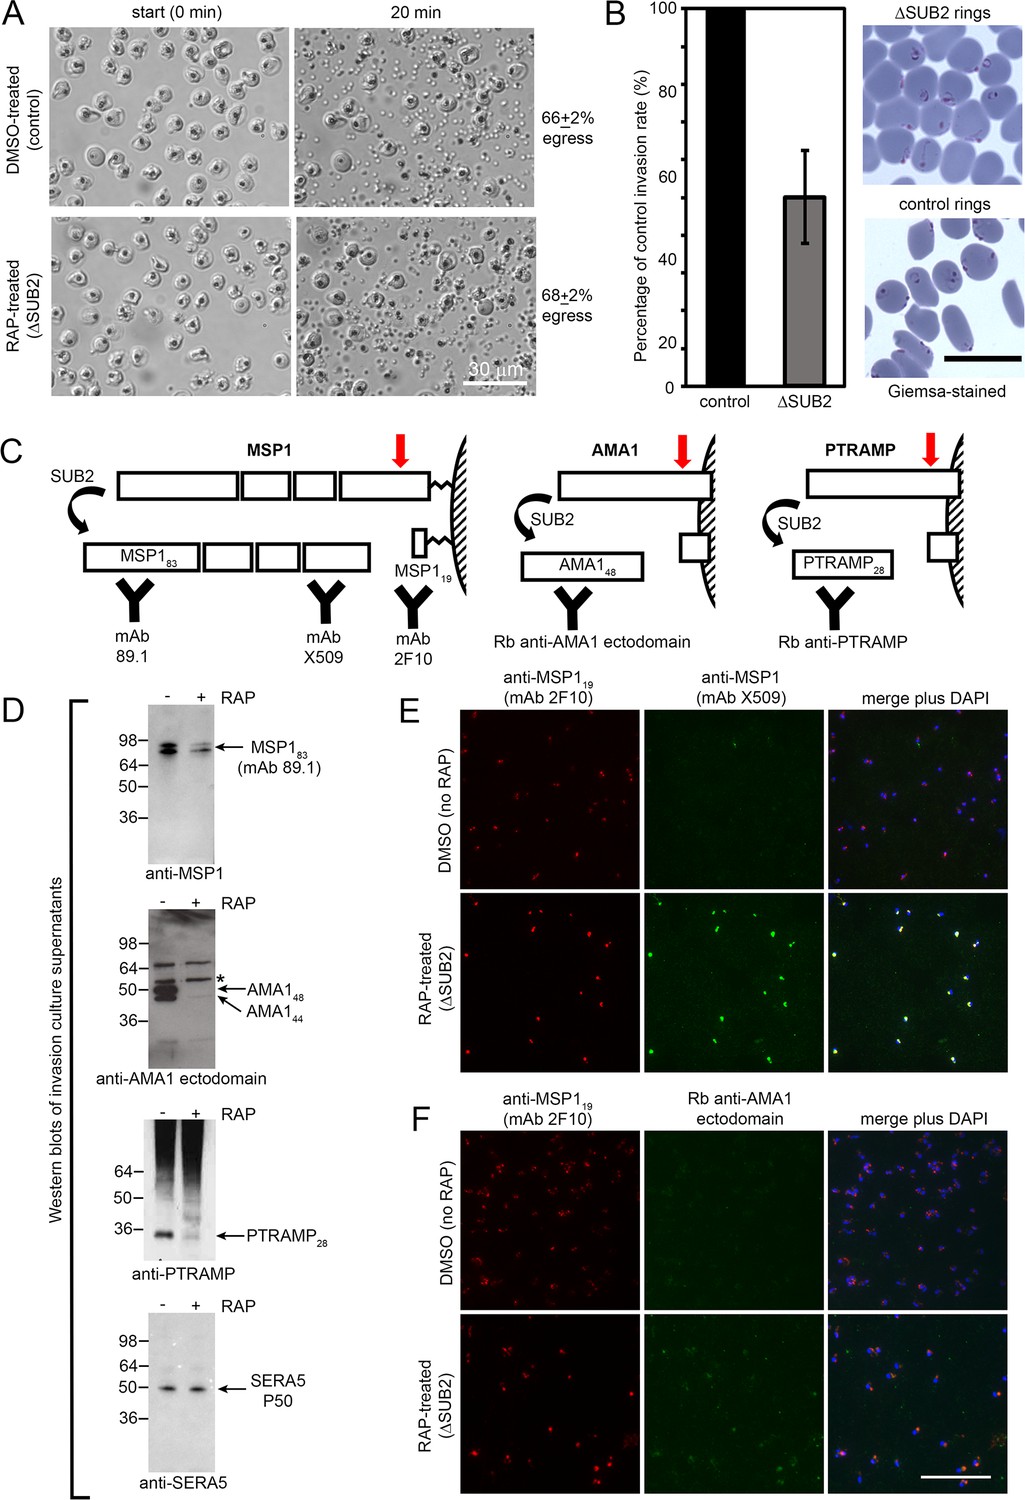
SUB2 is not required for egress, but is implicated in invasion and is required for shedding of MSP1, AMA1 and PTRAMP.
(A) DIC microscopic images showing rupture of control and ΔSUB2 SUB2HA3:loxP schizonts. (B) Invasion assay showing ~50% reduction of invasion in ΔSUB2 parasites. Data are presented as percentage of ring formation by control parasites (mean ± SD of 3 biological replicate experiments). Ring parasitaemia in control cultures ranged from 12 to 46%. Right, Giemsa-stained cycle one rings, 4 hr following invasion. (C) Schematic showing SUB2-mediated processing of the merozoite surface-bound MSP1 complex (previously cleaved into four associated fragments by SUB1), AMA1 and PTRAMP. Red arrow, SUB2 cleavage site. Binding specificity of antibodies used for western blot and IFA are indicated. (D) Western blot of culture supernatants following incubation of control and ΔSUB2 SUB2HA3:loxP schizonts with fresh RBCs for 4 hr. Shed proteolytic fragments are indicated. The minor 52 kDa AMA1 species arising from shedding by a merozoite rhomboid-like activity (Howell et al., 2005) is asterisked; levels of this cleavage product are not reduced upon SUB2 disruption, as expected. Release of SERA5, which is not processed by SUB2, acts as a loading control. (E and F) IFA of cycle one rings produced following invasion by control and ΔSUB2 parasites. The MSP1 (E) and AMA1 (F) ectodomain were detectable only in the ΔSUB2 rings, whilst all rings were reactive with the anti-MSP119 mAb 2F10. Scale bars, 20 μm.
Figure 3
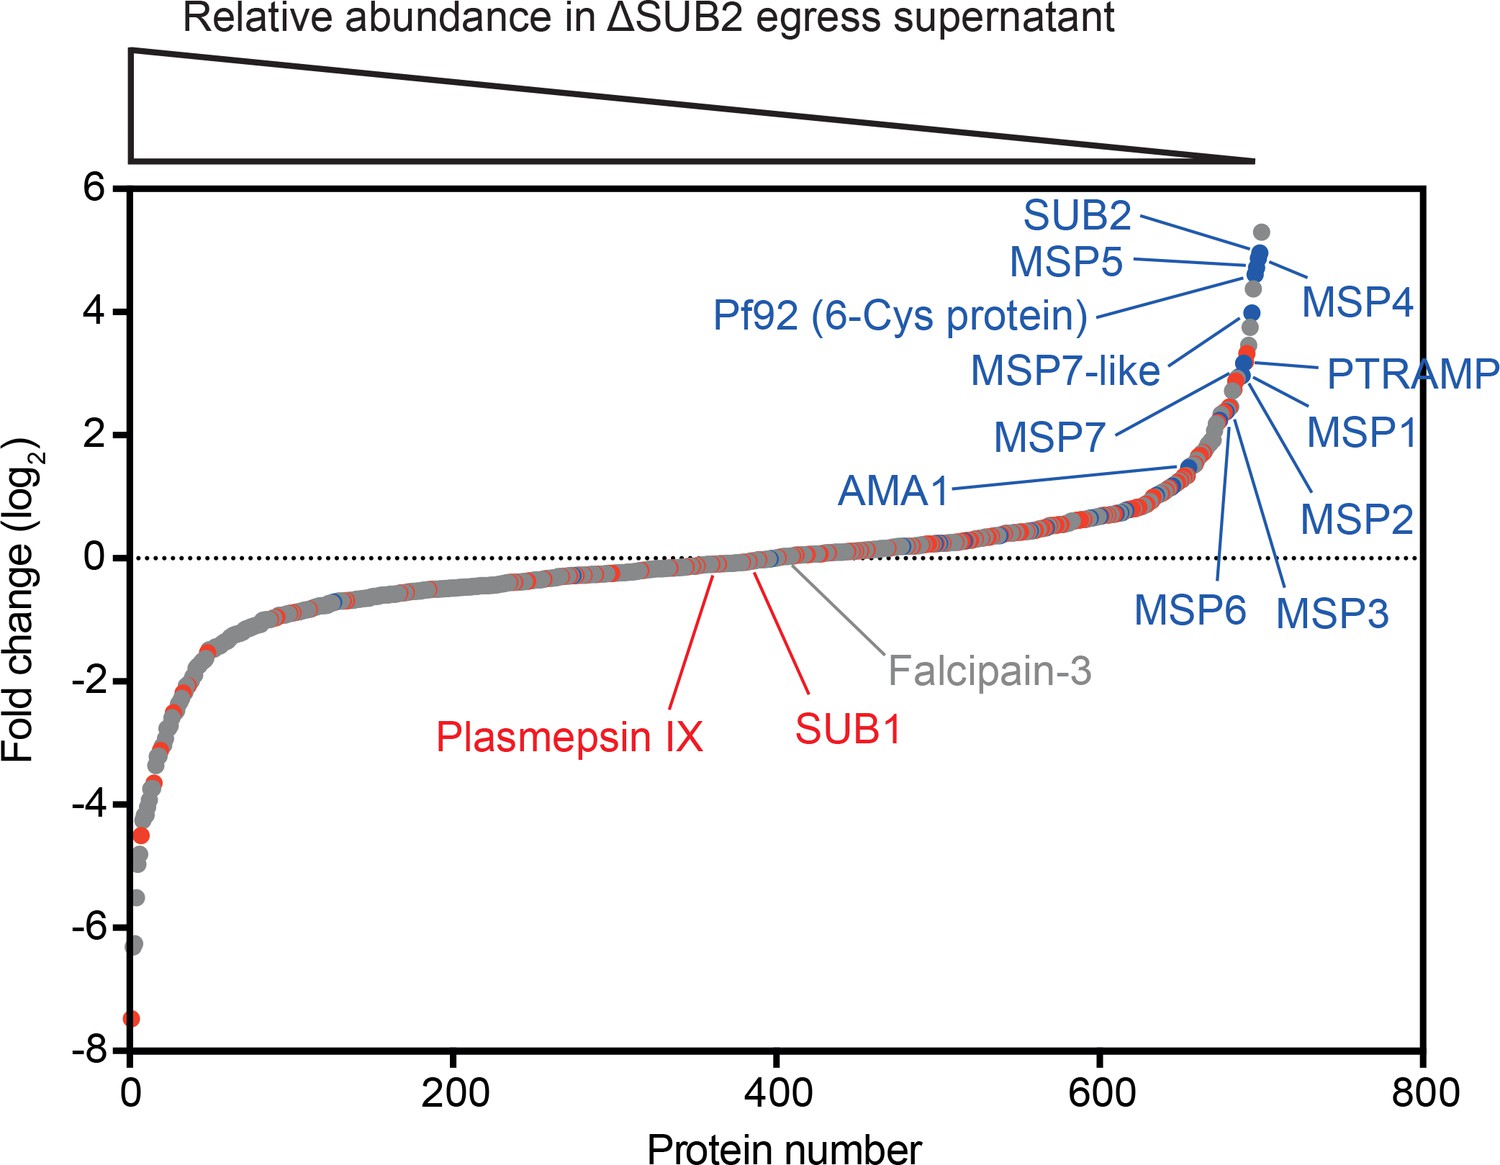
Quantitative proteomics shows that SUB2 sheds multiple merozoite surface proteins.
S-curve showing comparative mass spectrometric quantitation of P. falciparum proteins in egress and invasion supernatants of ΔSUB2 and control SUB2HA3:loxP schizonts. A total of 700 parasite proteins were detected with high confidence. Proteins with predicted secretory signal peptides are indicated in red, established merozoite surface proteins are indicated in blue (these also have signal peptides), whilst other proteins are in grey. Of the top 24 proteins that differed most in abundance between the samples, 12 are known merozoite surface proteins (indicated). SUB1, the intracellular cysteine protease falcipain-3 and the rhoptry-localised aspartic protease plasmepsin IX are highlighted as examples of proteins that did not differ in abundance between samples, as expected. See Figure 3—source data 1 for mass spectrometric data.
-
Figure 3—source data 1
Quantitative mass spectrometric analysis of P. falciparum proteins in egress supernatants of ΔSUB2 SUBHA3:loxP schizonts compared with control schizonts.
Established merozoite surface proteins are shown in blue, whilst other proteins possessing predicted secretory signal peptides are in red. Data shown are from three technical replicates. Proteomics data are also available via ProteomeXchange (Deutsch et al., 2020) with dataset identifier PXD021843.
- https://cdn.elifesciences.org/articles/61121/elife-61121-fig3-data1-v1.xlsx
Figure 4 with 3 supplements
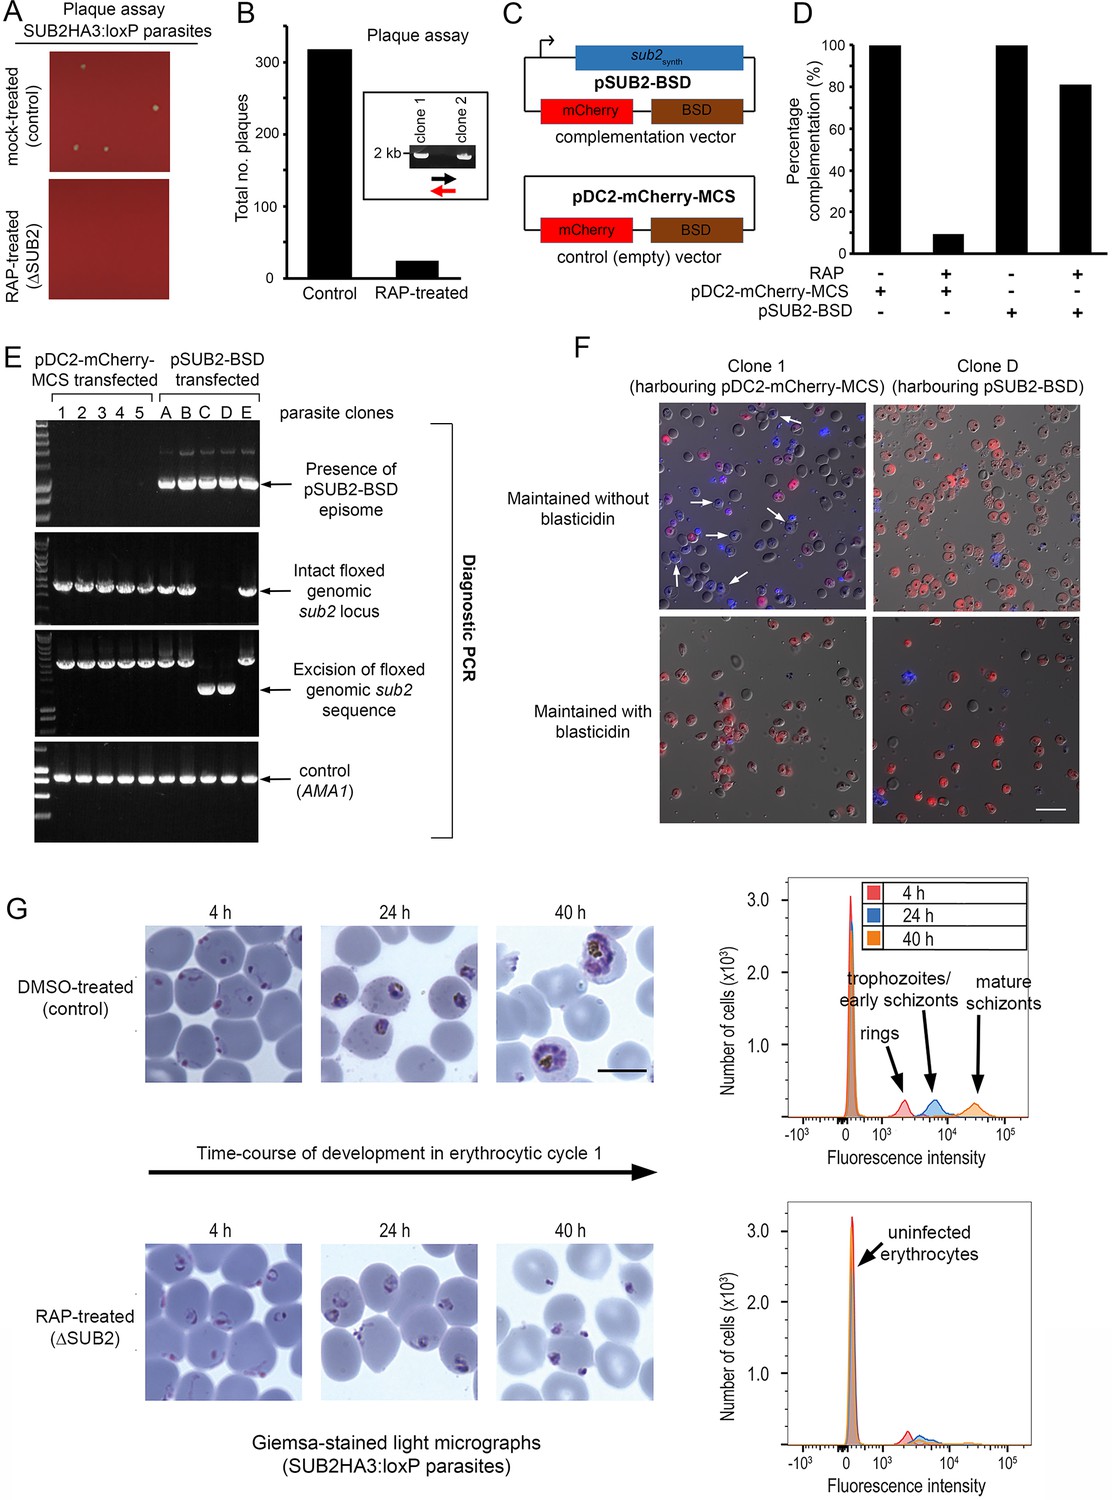
ΔSUB2 parasites display a developmental defect in the erythrocytic cycle following gene disruption that can be rescued by genetic complementation.
(A) Magnified views of plaque assay wells imaged 14 days after plating equal parasite densities (~10 parasites per well). (B) Plaque numbers in a total of 60 wells per treatment, showing effects of SUB2 disruption. Two plaques from RAP-treated wells were expanded and the parasites confirmed by PCR to be non-excised. See Materials and methods for primer colour codes. (C) Complementation plasmids. Expression of the sub2synth gene in pSUB2-BSD was driven by a 5’ flanking region that correctly regulates SUB2 expression (Child et al., 2013). (D) Genetic complementation of the ΔSUB2 growth defect. Complementation was calculated as the number of plaques obtained in the RAP-treated cultures expressed as a percentage of those in control cultures (100%). (E) Genotyping of parasite clones expanded from the plaque assay in (D). Amplicons diagnostic of indicated genotypes, arrowed. Clones 1–5 (transfected with control plasmid pDC2-mCherry-MCS) and clones A, B and E all possessed an intact genomic sub2 locus. Clones C and D lacked an intact chromosomal sub2 gene due to excision, but harboured pSUB2-BSD. (F) Dual DIC/fluorescence images of live Hoechst 33342-stained (blue) parasites of clones one and D (from panel E) following 4 weeks of maintenance. Without BSD, clone one began to lose pDC2-mCherry-MCS as indicated by loss of mCherry (red: examples arrowed), whilst pSUB2-BSD was maintained in all clone D parasites. Scale bar, 20 μm. (G) Parasite development in cycle one following mock or RAP treatment. Arrest of ΔSUB2 parasites was evident within 24 hr. Scale bar, 10 μm. Right: flow cytometry confirms a developmental defect in ΔSUB2 parasites. Parasites were stained with SYBR Green I at indicated times post-invasion and 105 cells analysed. See also Figure 4—figure supplement 1, Figure 4—video 1 and Figure 4—video 2.
Figure 4—figure supplement 1

Light and transmission electron microscopic (TEM) analysis of newly-invaded intraerythrocytic ΔSUB2 cycle one parasites shows no discernible structural defect.
Light micrographs of Giemsa-stained cycle one rings and trophozoites sampled 4 hr and 24 hr following invasion by control or RAP-treated (ΔSUB2) SUB2HA3:loxP parasites. The 4 hr rings are morphologically indistinguishable, but retarded development of the ΔSUB2 parasites is evident by 24 hr. Scale bar, 20 μm. Electron micrographs of parasite-infected cells taken at similar time points. Note that whilst the 4 hr ΔSUB2 ring appears to display a potential sealing defect, similar structures were observed with similar frequency in control ring preparations, and so could not be confidently ascribed as being responsible for the developmental defects in the mutants.
Figure 4—video 1
Serial block-face scanning electron microscopy (SBF-SEM) of newly-invaded rings (control).
Composite video showing SBF-SEM analysis of newly-invaded (4 h-old) rings formed following invasion by merozoites released from DMSO-treated (control) cycle 0 SUB2HA3:loxP schizonts.
Figure 4—video 2
Serial block-face scanning electron microscopy (SBF-SEM) of newly-invaded rings (ΔSUB2).
Composite video showing SBF-SEM analysis of newly-invaded (4 h-old) rings formed following invasion by merozoites released from RAP-treated (ΔSUB2) cycle 0 SUB2HA3:loxP schizonts.
Figure 5 with 2 supplements
Interaction of ΔSUB2 merozoites with target RBCs induces rapid RBC lysis.
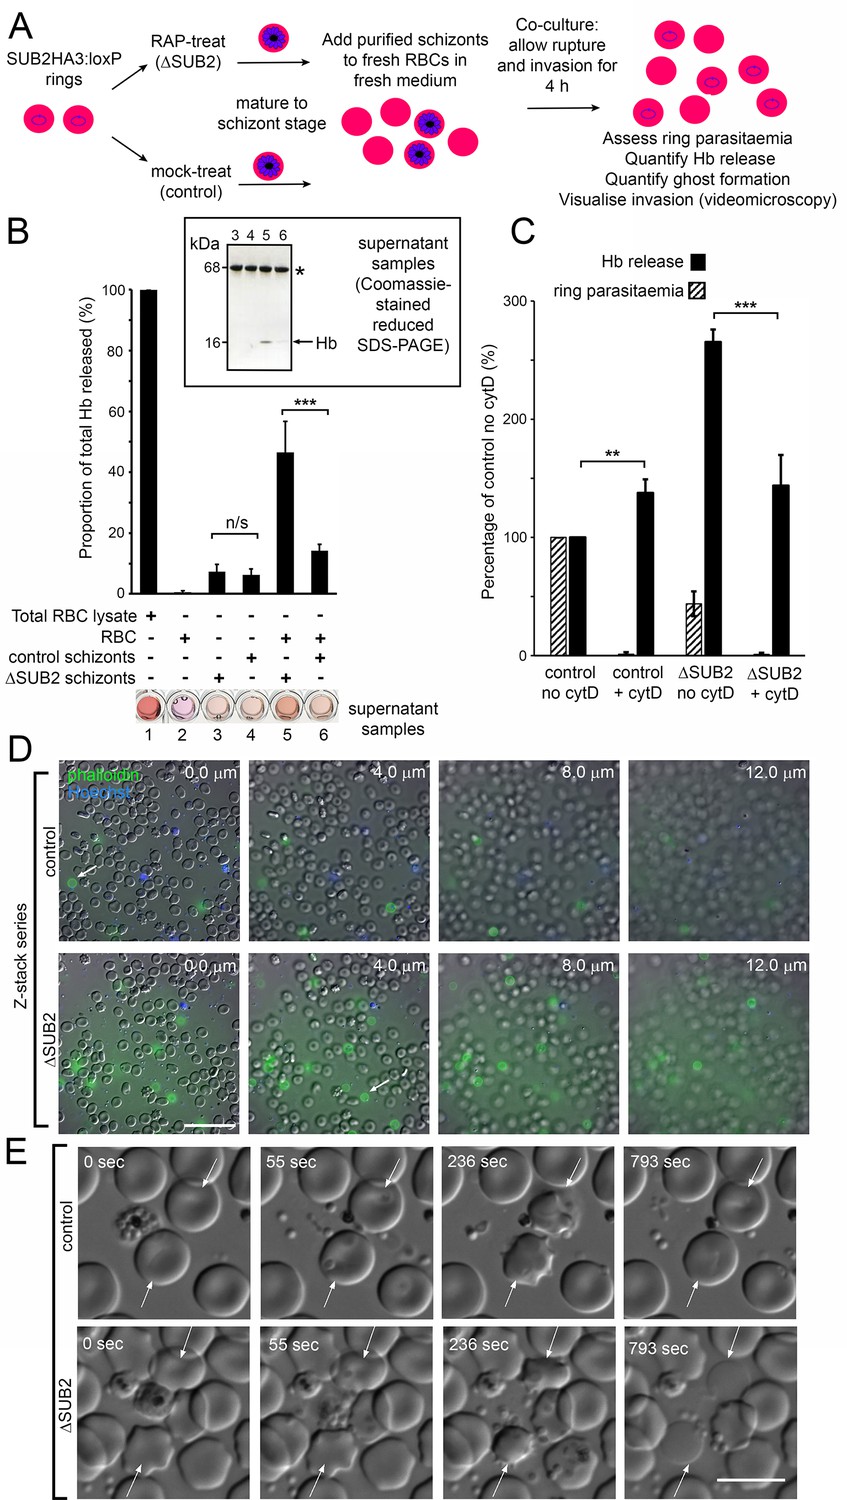
(A) Experimental strategy to quantify the relationship between invasion and Hb release. (B) Quantitation of Hb in culture supernatants following egress and invasion. Values shown (averages from three independent experiments) were determined by absorbance at 405 nm, normalised to hypotonic lysates of an equivalent number of uninfected RBCs (100%; see Materials and methods). These experiments used high starting schizont parasitaemia (10–15%) to enhance detection of released Hb. Mean ring parasitaemia values following 4 hr of ΔSUB2 schizont/RBC co-culture were only 65.0 ± 4.8% of those in the control schizont/RBC co-cultures, whereas released Hb levels in the ΔSUB2/RBC co-cultures were 3.3 ± 0.7 fold higher than in the control schizont/RBC co-cultures (***). Error bars,± SD. Significance determined by two-tailed unpaired t-test: p=0.006, ***; n/s, p=0.560. Below, microplate wells containing culture supernatants (200 μl) compared to the RBC lysate, showing the high free Hb levels in the ΔSUB2 schizont/RBC co-cultures. Inset: SDS-PAGE analysis of supernatants 3–6. (C) Hb release is prevented by cytD. Ring parasitaemia and released Hb levels relative to those obtained in co-cultures of control schizonts in the absence of cytD (defined as 100%). Whilst Hb release is enhanced throughout by cytD (see also Figure 5—figure supplement 1), the drug blocks the high levels of Hb release observed in the ΔSUB2 co-cultures. Shown are averages from two independent experiments. Error bars,± SD. Significance levels determined by two-tailed unpaired t-test: p=0.03, ***; p=0.04, **. (D) Interaction of ΔSUB2 merozoites with RBCs leads to abundant ghost formation. Cultures as in (A) were supplemented with Hoechst 33342 (blue) and Alexa Fluor 488 phalloidin (green) then imaged by dual DIC/fluorescence microscopy. Images are selected from a Z-stack series of single fields, taken at 2.0 μm intervals to detect phalloidin-labelled RBC ghosts, most of which ‘float above’ the focal plane of the majority of intact RBCs. Ghosts were ~6 fold more numerous in the ΔSUB2 cultures (15.7% of the total RBC count in ΔSUB2 cultures; 2.6% in control cultures). Scale bar, 50 μm. (E) Abortive invasion by ΔSUB2 merozoites leads to RBC lysis. Images from live time-lapse DIC microscopy of egress and subsequent events. Time following start of imaging is indicated. Interaction with target RBCs (arrowed) results in transient echinocytosis, followed by lysis in the case of the ΔSUB2 parasites. Scale bar, 10 μm. See also Figure 5—video 1.
Figure 5—figure supplement 1
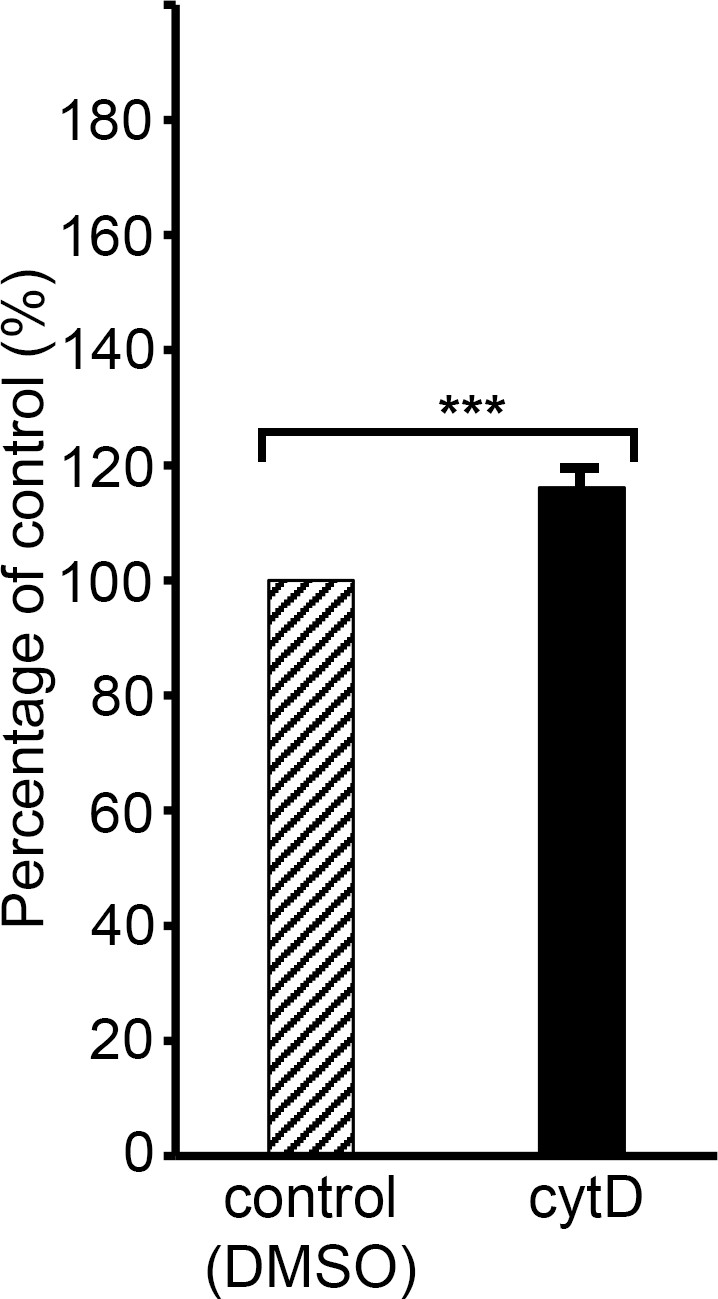
Cytochalasin D induces low-level haemoglobin release from uninfected human RBCs.
Plot showing levels of haemoglobin (Hb) released into supernatants of RBCs (1% haematocrit) incubated for 4 hr in RPMI 1640-Albumax medium at 37°C supplemented with cytD (10 μM), compared to those released from RBCs under control conditions (medium containing 0.5% DMSO), defined as 100%. Results shown are means from three independent experiments, each using blood from different donors. Error bar,± SD. Significance levels determined by two-tailed unpaired t-test: p<0.0001, ***. Treatment with cytD induced a ~ 16% increase in Hb release from the cells.
Figure 5—video 1
Abortive invasion by ΔSUB2 merozoites leads to rapid target RBC lysis.
Time-lapse video microscopy showing interactions between naturally-released merozoites and target human RBCs. For both control and ΔSUB2 merozoites, characteristic RBC deformation during the initial interaction and transient echinocytosis immediately following merozoite entry is observed. In the case of the ΔSUB2 merozoites, lysis of two targeted RBCs (arrowed) occurs at ~740 s, as indicated by sudden loss of differential interference contrast (DIC).
Figure 6 with 1 supplement
Inhibition of MSP1 shedding by conditional mutagenesis of the SUB2 cleavage site inhibits cycle one intracellular parasite development.
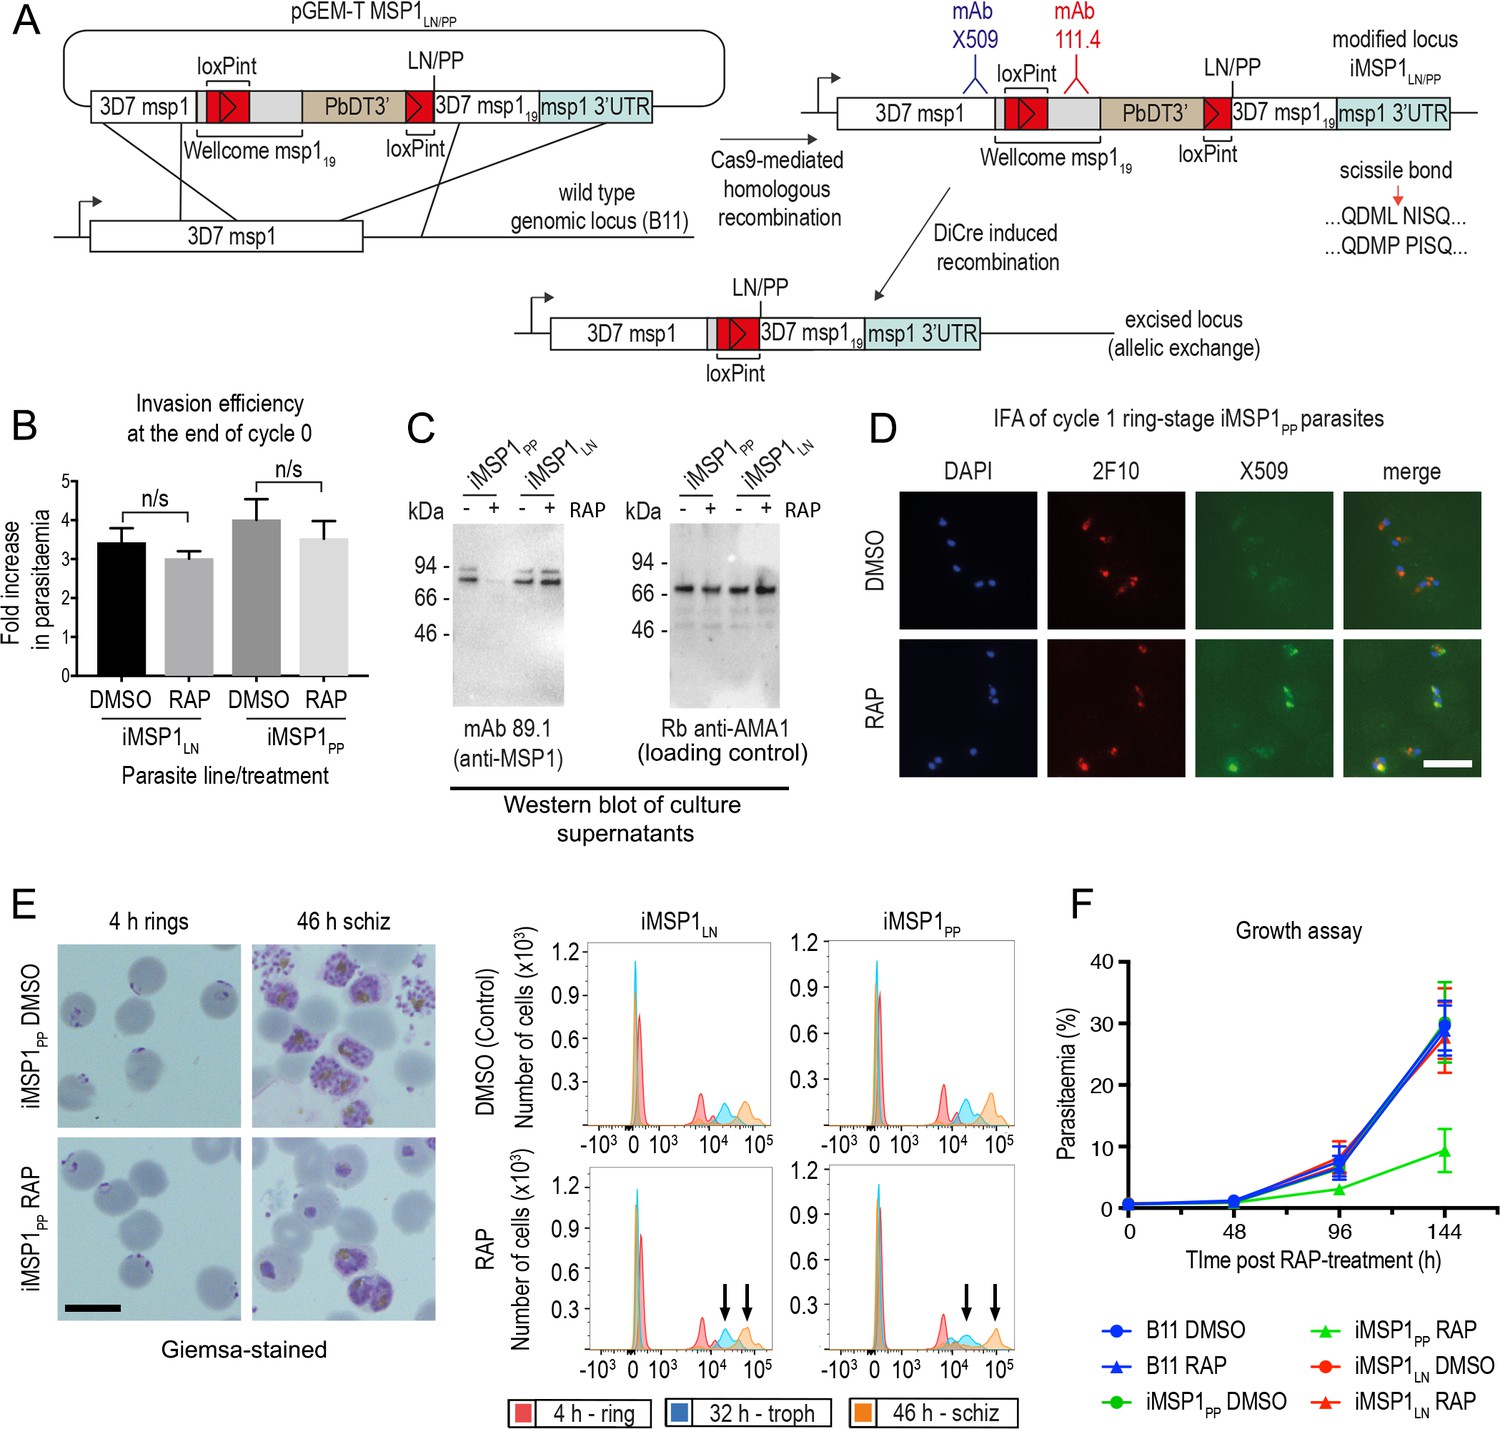
(A) Strategy used for conditional mutagenesis of the SUB2 processing site in MSP1 (see also Figure 6—figure supplement 1). (B) Ring formation is unaffected by conditional mutagenesis of the MSP1 SUB2 processing site. Values averaged from three independent experiments. Error bars,± SD. Significance determined by two-tailed t-test: p values for the comparison of DMSO and RAP-treated MSP1LN and MSP1PP lines were 0.17 and 0.30, respectively (n/s). (C) Reduced MSP1 shedding during invasion by RAP-treated iMSP1PP parasites. (D) IFA showing that cycle one rings formed by RAP-treated iMSP1PP parasites were recognized by mAb X509, consistent with reduced MSP1 shedding. All rings are detected by the MSP119-specific mAb 2F10. (E) Reduced MSP1 shedding affects intracellular development. Control or RAP-treated iMSP1LN and iMSP1PP schizonts were incubated with RBCs and the cycle one rings monitored. Microscopy shows retarded ring development in RAP-treated iMSP1PP parasites, corroborated by flow cytometry (measuring parasite DNA content) showing 23.6 ± 5.0% reduced replication by 46 hr compared to similarly treated iMSP1LN controls (compare arrowed peaks). Scale bars, 10 µm. (F) Reduced replication of RAP-treated iMSP1PP parasites.
Figure 6—figure supplement 1
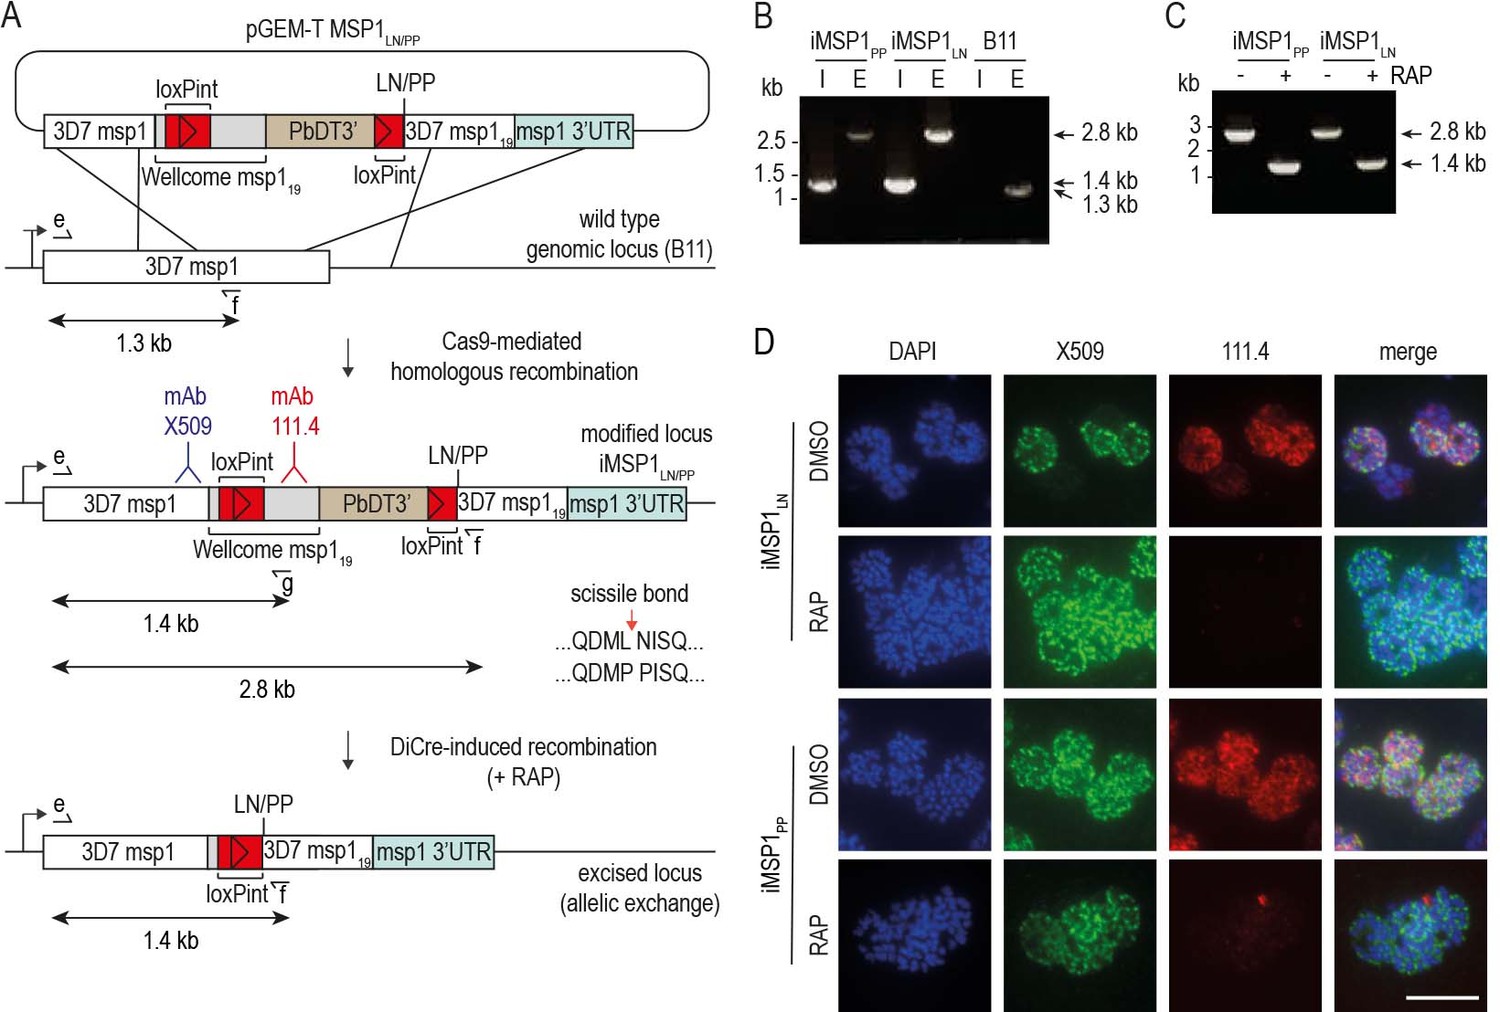
Conditional mutagenesis of the P. falciparum msp1 gene to selectively block SUB2-mediated shedding of MSP1.
(A) Strategy for modifying the msp1 locus by Cas9-enhanced homologous recombination in the DiCre-expressing B11 P. falciparum clone (Perrin et al., 2018) to generate conditional allelic replacement lines. The targeting construct is depicted above the msp1 locus both before and following modification, as well as following DiCre-mediated excision of the floxed sequences. Introduced loxPint sites, red. Sequence encoding the Wellcome-type MSP119 (grey) and 3D7 MSP119 (white) are indicated (see Materials and methods). Epitopes recognized by monoclonal antibodies (mAbs) X509 (blue) and 111.4 (red) are indicated. Following excision, parasites express modified forms of MSP1 expressing either Leu-Asn or Pro-Pro flanking the SUB2 cleavage site. Primers for diagnostic PCR (see panels B and C) are indicated (half arrows; see Materials and methods for all primer codes and sequences). Predicted sizes of amplicons are shown. (B) Diagnostic PCR confirmation of gene modification in clonal lines. PCR with primers e plus f, designed to detect the unmodified endogenous locus, produced a 1.3 kb amplicon in the B11 parental line E but a 2.8 kb amplicon in the iMSP1LN and iMSP1PP lines. Integration-specific diagnostic PCR (I; primers e plus g) only recognized the modified locus in the iMSP1LN and iMSP1PP lines, generating a 1.4 kb amplicon. (C) Validation by diagnostic PCR of efficient RAP-induced excision in clonal lines, using primers e plus f, producing an amplicon of 1.4 kb only following excision. (D) IFA of mature schizonts confirming allelic exchange following RAP-induced recombination in the iMSP1LN and iMSP1PP lines. This results in loss of reactivity with mAb 111.4 which recognises a polymorphic epitope only in the Wellcome-type MSP119 sequence (Child et al., 2010). Scale bar, 10 μm.
Figure 7 with 3 supplements
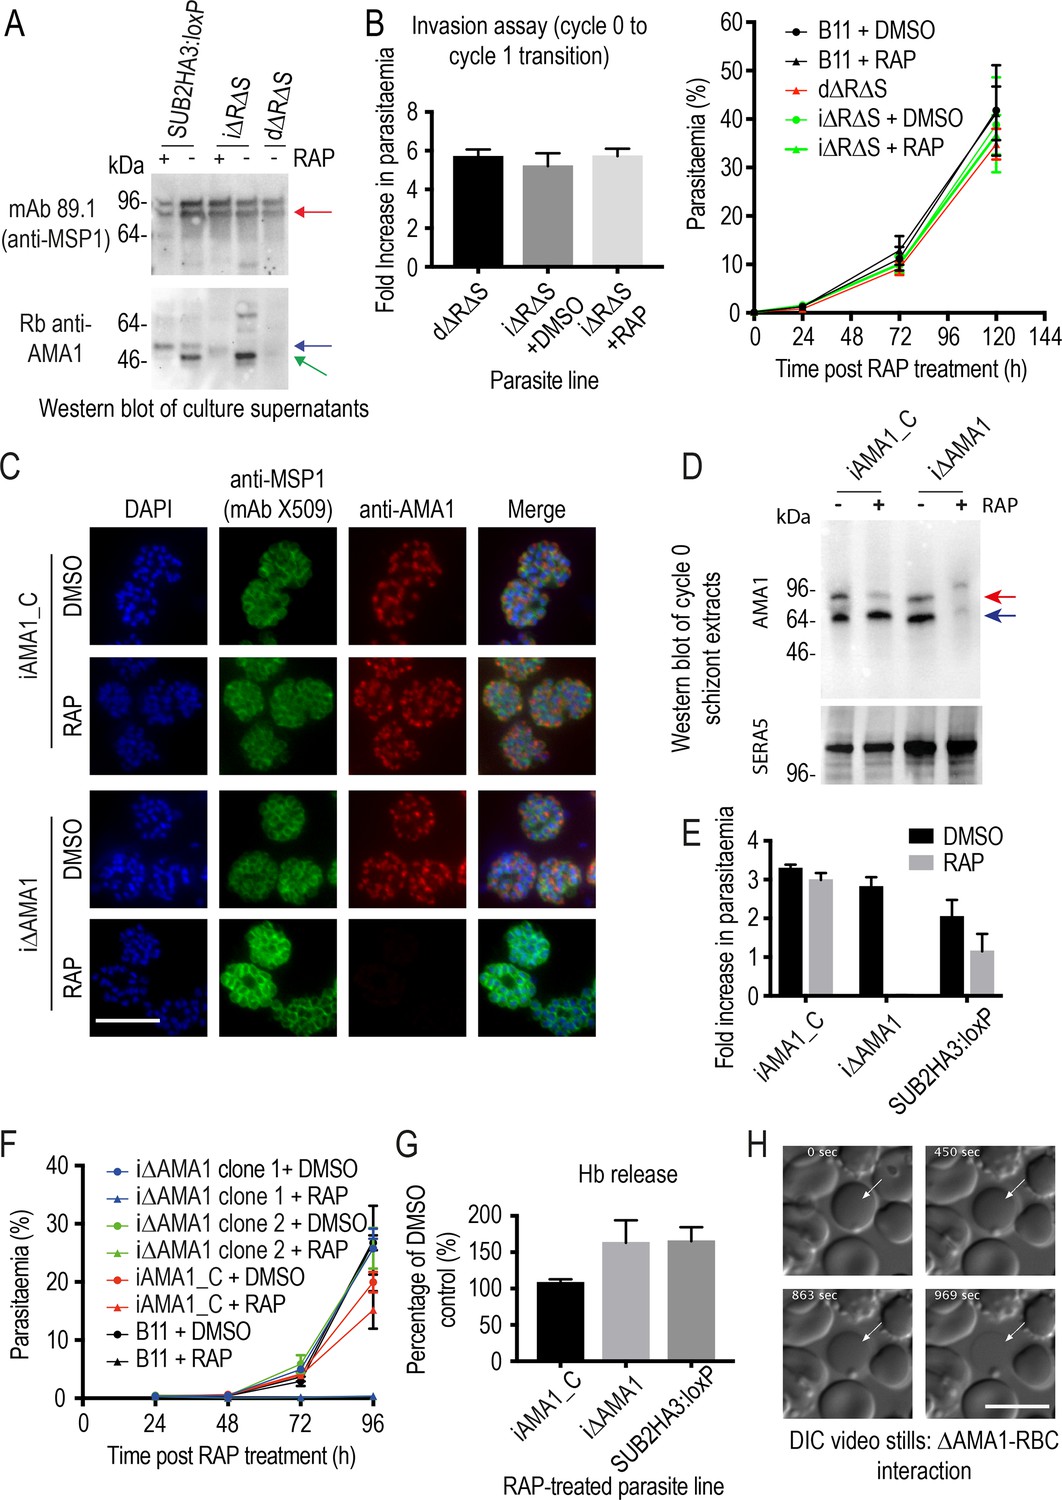
Inhibition of AMA1 shedding by cleavage site mutagenesis has no effect on invasion, but AMA1 disruption prevents invasion and leads to RBC lysis.
(A) Selective reduction in AMA1 shedding in dΔRΔS and RAP-treated iΔRΔS parasites. Shed fragments are arrowed (MSP183, red; AMA152, blue; AMA148, green). (B) Cleavage site mutagenesis has no impact on invasion or parasite replication. Data in both cases are averages of 3 independent experiments. Error bars,± SD. (C) IFA showing loss of AMA1 expression in RAP-treated iΔAMA1 cycle 0 schizonts. (D) Disruption of AMA1 expression (arrowed) in RAP-treated iΔAMA1 parasites. Antibodies to SERA5 were used as a loading control. (E) Invasion assay showing complete loss of invasion following rupture of RAP-treated cycle 0 iΔAMA1 schizonts in the presence of RBCs. (F) Loss of replication of RAP-treated iΔAMA1 parasite clones. (G) Increased Hb release upon interaction of ΔAMA1 parasites with RBCs is similar to that in RAP-treated SUB2HA3:loxP (ΔSUB2) parasites. (H) Time-lapse DIC microscopy images of interactions between a ΔAMA1 merozoite and an RBC (arrowed), showing eventual lysis of the RBC. Time following start of imaging is indicated. Scale bars, 10 μm. See also Figure 7—figure supplement 1, Figure 7—figure supplement 2 and Figure 7—video 1.
Figure 7—figure supplement 1
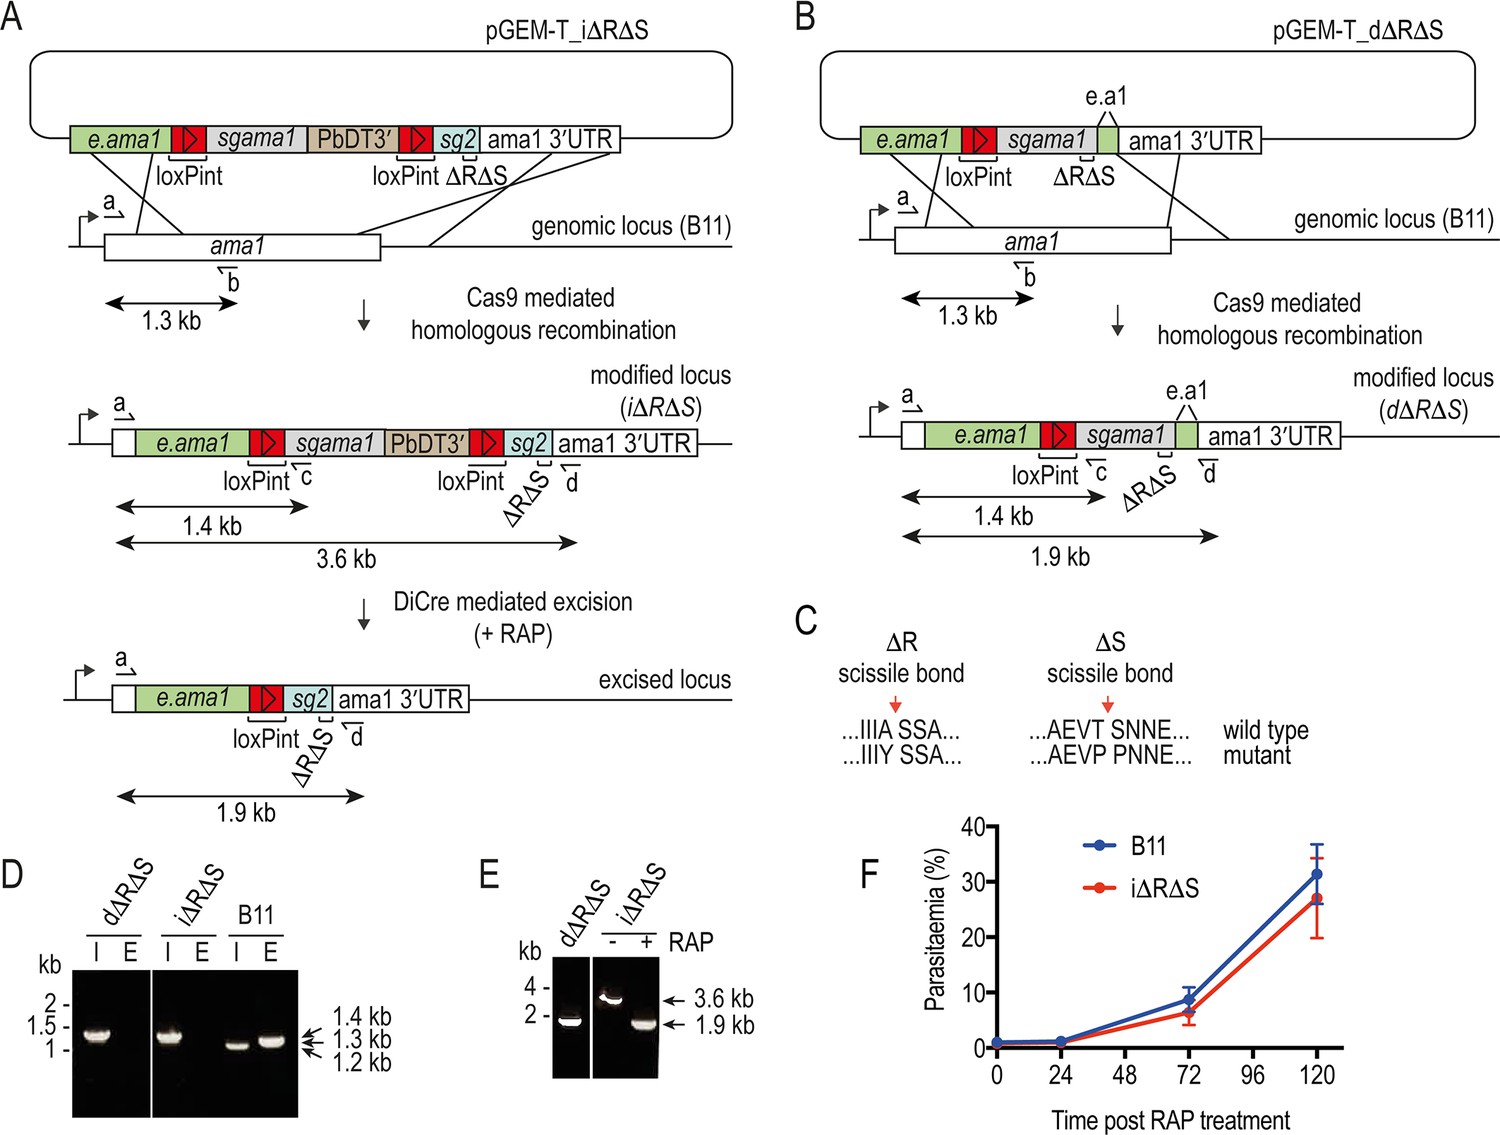
Conditional or direct mutagenesis of the P. falciparum ama1 gene to selectively block proteolytic shedding of AMA1.
(A and B) Schematic of Cas9-enhanced generation of i∆R∆S and d∆R∆S parasite lines in the DiCre-expressing B11 P. falciparum line. Recodonised ama1 gene sequences, grey and blue; endogenous sequence, green; loxPint sequences, red. Primers used for diagnostic PCR, half arrows. see Materials and methods for all primer codes and sequences. (C) Modifications made to the SUB2 and ROM4 cleavage sites to render them refractory to cleavage by the respective proteases. (D) Diagnostic PCR confirming successful modification of the ama1 locus in the i∆R∆S and d∆R∆S parasite clones. I, integration-specific PCR (primers a plus c, amplicon size 1.4 kb). E, endogenous (unmodified) locus-specific signal (primers a plus b, amplicon size 1.3 kb). Note that mis-priming in the parental B11 line generates a smaller 1.2 kb product in the integration-specific PCR. (E) Confirmation of RAP-mediated excision (in the i∆R∆S line) or integration (in the d∆R∆S line) by diagnostic PCR, using primers a plus d. Excision results in reduction of the amplicon from 3.6 kb to 1.9 kb. (F) Replication rates of the (untreated) i∆R∆S line and B11 parental line are similar.
Figure 7—figure supplement 2
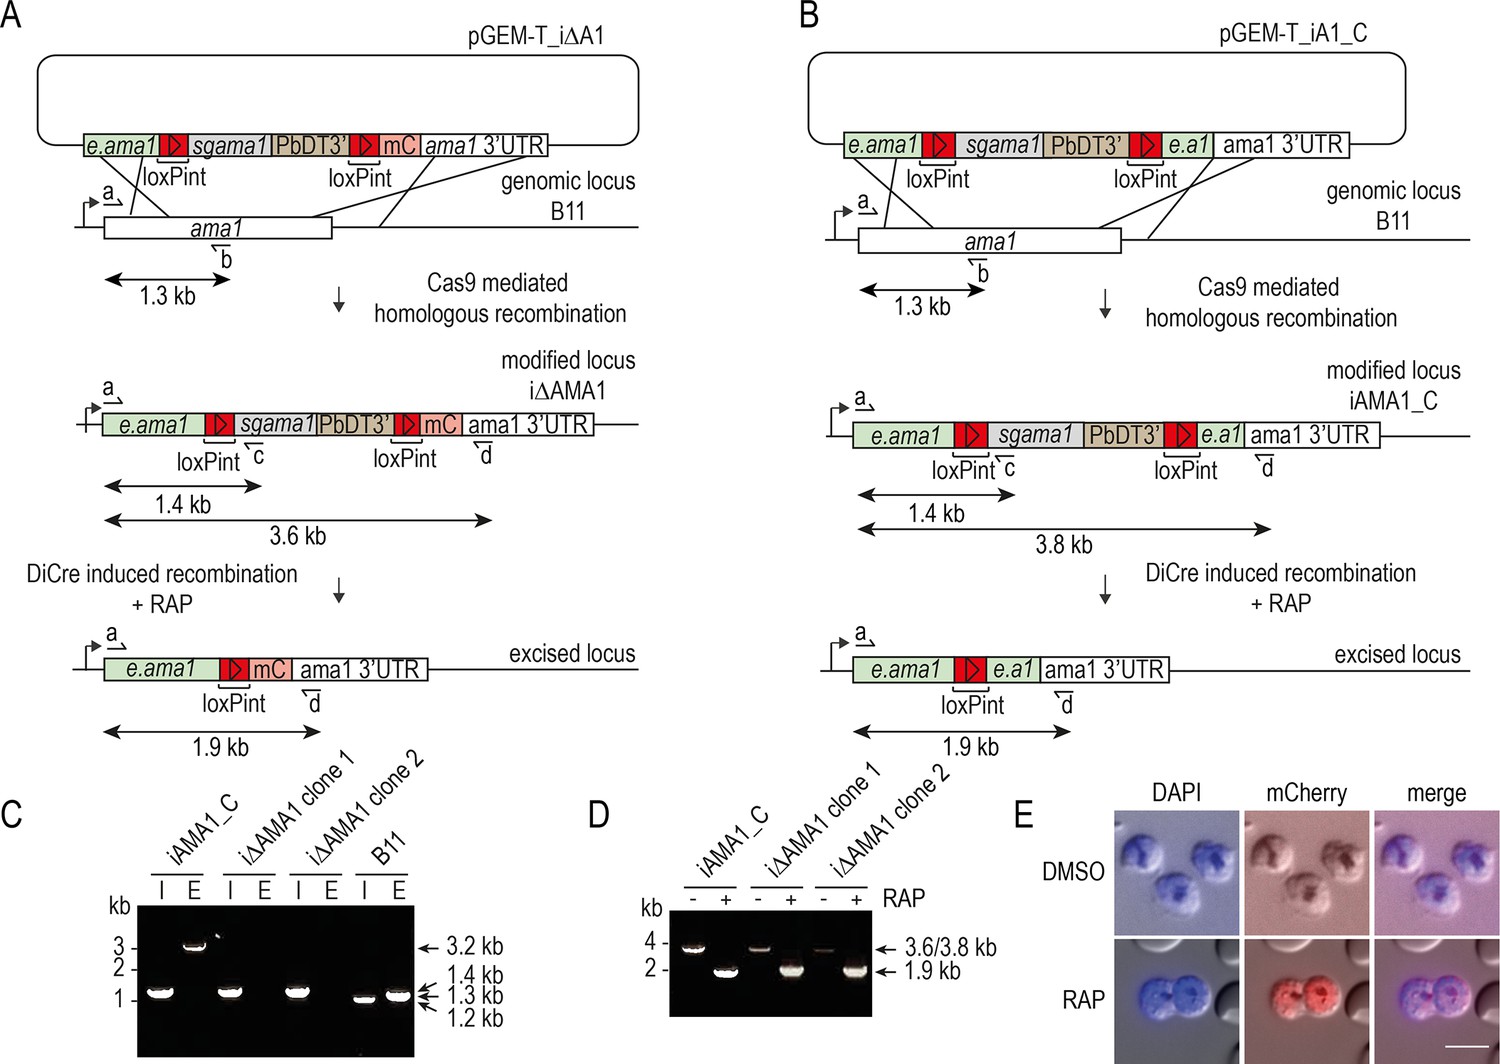
Conditional disruption of the P. falciparum ama1 gene.
(A and B) Schematic representation of Cas9-enhanced generation of inducible disruption i∆AMA1 and control iAMA1_C parasite lines in the DiCre-expressing B11 P. falciparum line, and the expected consequences of DiCre-mediated excision. Recodonised ama1 sequences, grey; endogenous ama1 sequences, green; loxPint sequences, red; mC, mCherry sequence, pink. In (A), DiCre-mediated excision leads to fusion of a truncated AMA1 gene product to mCherry via a reconstituted loxPint intron. Primers used for diagnostic PCR, half arrows, with predicted amplicon sizes indicated. see Materials and methods for primer codes and sequences. (C) Diagnostic PCR confirming successful modification of the ama1 locus in the control iAMA1_C line and two different clones of the inducible disruption i∆AMA1 parasite line. E, endogenous (unmodified) locus-specific signal (primers a plus b, amplicon size 1.3 kb). I, integration-specific PCR (primers a plus c, amplicon size 1.4 kb). Mis-priming in the integration-specific PCR from the parental B11 line generates a smaller 1.2 kb product. The 3.2 kb band in the iAMA1_C endogenous track is due to primer b also hybridising to e.ama1, the part of the endogenous ama1 sequence used as the 3’ target in pGEM-T_iA1_C. (D) Diagnostic PCR confirming efficient RAP-mediated excision in all clonal lines. Primers a plus d were used to screen for excision, producing a 3.8 kb or 3.6 kb amplicon from the non-excised loci which reduced to 1.9 kb in both cases upon excision. (E) Expression of mCherry in schizonts upon RAP treatment of i∆AMA1 parasites. Scale bar, 10 μm.
Figure 7—video 1
Interactions between ΔAMA1 merozoites and target RBCs lead to RBC lysis.
Time-lapse video microscopy showing interactions between target RBCs (arrowed) and merozoites released from RAP-treated iΔAMA1 schizonts. Characteristic RBC deformation during the initial interaction and RBC echinocytosis is observed. The target RBCs remained rounded and eventually lysed (see main manuscript Figure 7H) as indicated by loss of DIC.
Figure 8
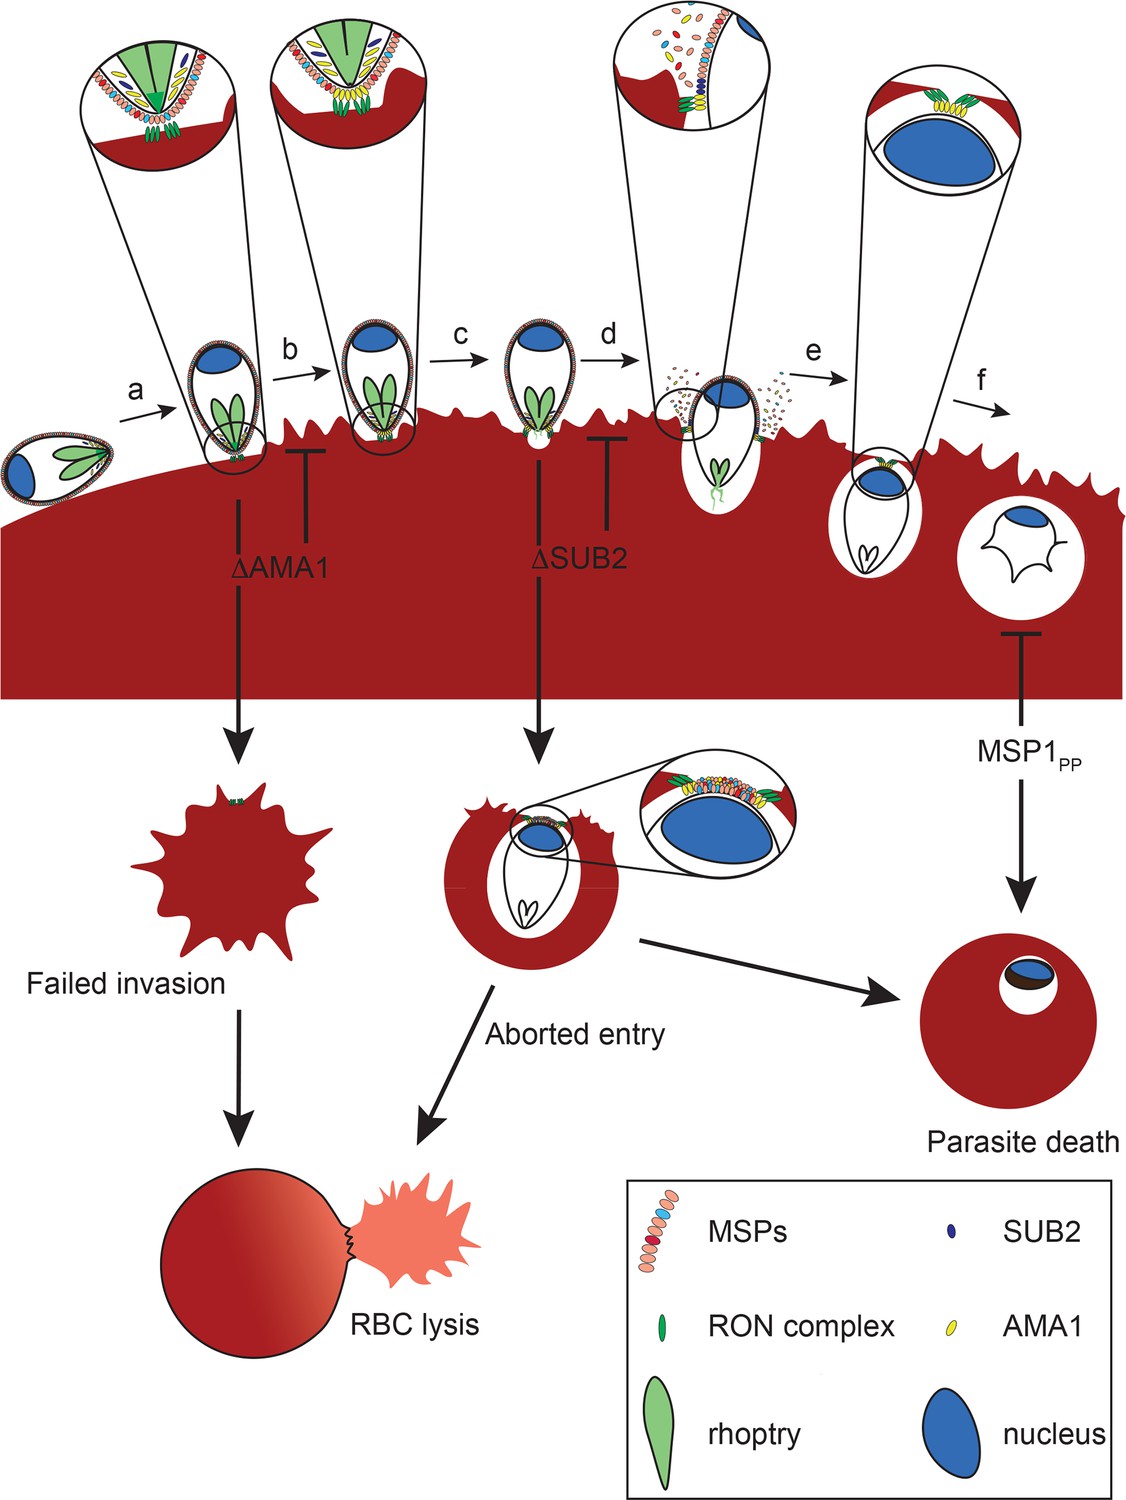
Model of merozoite-RBC interactions following disruption of SUB2 or AMA1, or selective ablation of MSP1 shedding (MSP1PP).
Following the initial merozoite-RBC interaction, reorientation (a) brings the merozoite apical prominence into contact with the RBC surface. Rhoptry neck proteins are discharged into the RBC membrane (b), inducing echinocytosis. AMA1 is released from micronemes to interact with the RON complex, forming the TJ through which the merozoite begins to enter the nascent PV (c). During entry, several protein components of the merozoite surface coat are shed by SUB2 (d). As the merozoite is internalised the RBC membranes are drawn together at the posterior end by the TJ (e). The opposed membranes finally seal and undergo scission, fully encapsulating the parasite within the cell (f). In the absence of AMA1 (ΔAMA1), insertion of the RON complex results in echinocytosis but without formation of the TJ. The RBC membrane remains destabilised, leading to RBC lysis. Loss of SUB2 expression (ΔSUB2) leads to a plug of unshed surface proteins that prevent RBC membrane sealing, leading to abortive entry and RBC lysis. Some ΔSUB2 parasites manage to enter fully but subsequently fail to develop beyond ring stage, perhaps due to a defect in DV biogenesis because of an accumulation of multiple unshed proteins (or one or more critical proteins) on the plasma membrane of the internalised parasite. A similar but less severe intracellular growth phenotype results from selective loss of MSP1 shedding in the MSP1PP mutant.
Tables
Appendix 1—key resources table
| Reagent type (species) or resource | Designation | Source or reference | Identifiers | Additional information |
|---|---|---|---|---|
| gene (Plasmodium falciparum) | pfsub2 | PlasmoDB (https://plasmodb.org) | PF3D7_1136900 | P. falciparum SUB2 gene |
| genetic reagent (P. falciparum) | SUB2HA3:loxP | This paper | For inducible disruption of PfSUB2. Line maintained in and available from Blackman lab, Francis Crick Institute. | |
| genetic reagent (P. falciparum) | iMSP1PP | This paper | For inducible mutagenesis of MSP1. Line maintained in and available from Blackman lab, Francis Crick Institute. | |
| genetic reagent (P. falciparum) | iMSP1LN | This paper | Control for inducible allelic replacement of MSP1. Line maintained in and available from Blackman lab, Francis Crick Institute. | |
| genetic reagent (P. falciparum) | dΔRΔS | This paper | For constitutive expression of cleavage-resistant AMA1. Line maintained in and available from Blackman lab, Francis Crick Institute. | |
| genetic reagent (P. falciparum) | iΔRΔS | This paper | For inducible mutagenesis of AMA1. Line maintained in and available from Blackman lab, Francis Crick Institute. | |
| genetic reagent (P. falciparum) | iAMA1_C | This paper | Control for inducible allelic replacement of AMA1. Line maintained in and available from Blackman lab, Francis Crick Institute. | |
| cell line (P. falciparum) | B11 | Perrin et al., 2018 (PMID:29970464) | DiCre-expressing parasite line. Maintained in and available from Blackman lab, Francis Crick Institute | |
| cell line (P. falciparum) | 1G5DC | Collins et al., 2013a (PMID:23489321) | DiCre-expressing parasite line. Maintained in Blackman lab, Francis Crick Institute | |
| transfected construct (P. falciparum) | pSUB2-BSD | This paper | For ectopic expression of SUB2. Available from Blackman lab. | |
| transfected construct (P. falciparum) | pGEM-MSP1PP | This paper | For inducible disruption of SUB2-mediated MSP1 shedding. Available from Blackman lab. | |
| transfected construct (P. falciparum) | pGEM-MSP1LN | This paper | For generation of inducible control parasite line. Available from Blackman lab. | |
| transfected construct (P. falciparum) | pGEM-T-iΔRΔS_A1 | This paper | For inducible disruption of SUB2-mediated AMA1 shedding. Available from Blackman lab. | |
| transfected construct (P. falciparum) | pGEM-T- iA1_C | This paper | For generation of inducible control parasite line. Available from Blackman lab. | |
| transfected construct (P. falciparum) | pGEM-T_dA1_ΔRΔS | This paper | For direct disruption of SUB2-mediated AMA1 shedding. Available from Blackman lab. | |
| transfected construct (P. falciparum) | pGEM-T_dA1_C | This paper | To generate control parasite line. Available from Blackman lab. | |
| transfected construct (P. falciparum) | pDC2-mCherry-MCS | This paper | Mapping the mouse Allelome reveals tissue-specific regulation of allelic expression | Control vector for pSUB2-BSD. Available from Blackman lab. |
| biological sample (Homo sapiens) | Human red blood cells | UK NHS Blood and Transplant | Provided anonymised. | |
| antibody | X509 anti-MSP1 (human monoclonal) | Blackman et al., 1991 (PMID:1723148) | (1 µg/mL) | |
| antibody | Anti-AMA1 (rabbit polyclonal) | Collins et al., 2009 (PMID:19165323) | Immunofluorescence (IFA) (1:500), western blot (1:1000) | |
| antibody | Anti-SERA5 (rabbit polyclonal) | Stallmach et al., 2015 (PMID:25599609) | IFA (1:500), western blot (1:1000) | |
| antibody | 3F10 High affinity anti-HA (rat monoclonal) | Roche | Cat# 11867423001, RRID:AB_390918 | IFA (1:500), western blot (1:1000) |
| antibody | Anti-EBA175 (rabbit polyclonal) | Withers-Martinez et al., 2008 (PMID:18036613) | IFA (1:500) | |
| antibody | 24C6 anti-RON4 (mouse monoclonal) | Roger et al., 1988 (PMID:3278223) | IFA (1 µg/mL) | |
| antibody | 89.1 anti-MSP183(mouse monoclonal) | Holder and Freeman, 1982 (PMID:6752328) | IFA, western blot (1 µg/mL) | |
| antibody | 2F10 anti-MSP119 (mouse monoclonal) | Burghaus and Holder, 1994 (PMID:8078519) | IFA (1 µg/mL) | |
| antibody | 111.4 anti-MSP119 Wellcome-type specific (mouse monoclonal) | Holder et al., 1985 (PMID:2995820) | IFA (1 µg/mL) | |
| antibody | Anti-PTRAMP (rabbit polyclonal) | Green et al., 2006 (PMID:16879884) | Western blot (1:1000) | |
| antibody | AlexaFluor 594 conjugated anti-rabbit; (goat polyclonal) | ThermoFisher | Cat# A32740, RRID:AB_2762824 | IFA (1:10,000) |
| antibody | AlexaFluor 488 conjugated anti-rabbit; (goat polyclonal) | ThermoFisher | Cat# A-11008, RRID:AB_143165 | IFA (1:10,000) |
| antibody | AlexaFluor 594 conjugated anti-mouse; (goat polyclonal) | ThermoFisher | Cat# A-11032, RRID:AB_2534091 | IFA (1:10,000) |
| antibody | AlexaFluor 488 conjugated anti-mouse; (goat polyclonal) | ThermoFisher | Cat# A-11029, RRID:AB_138404 | IFA (1:10,000) |
| antibody | AlexaFluor 594 conjugated anti-human; (goat polyclonal) | ThermoFisher | Cat# A-11014, RRID:AB_2534081 | IFA (1:10,000) |
| antibody | AlexaFluor 488 conjugated anti-human (goat polyclonal) | ThermoFisher | Cat# A-11013, RRID:AB_2534080 | IFA (1:10,000) |
| antibody | Biotinylated anti-rat (goat polyclonal) | Sigma-Aldrich | Cat# AP183B, RRID:AB_92595 | IFA (1:1000) |
| sequence-based reagent | All primers and guides: see primer table | This paper | Used for diagnostic PCR. Available from Blackman lab. | |
| peptide, recombinant protein | AlexaFluor 488 Phalloidin | ThermoFisher | Cat# A12379 | |
| commercial assay or kit | Gibson Assembly master mix | NEB | Cat# E2611L | |
| commercial assay or kit | pCR-Blunt II-TOPO vector | ThermoFisher | Cat# 280002 | |
| commercial assay or kit | pGEM-T Easy vector system | Promega | Cat# A1360 | |
| chemical compound, drug | SYBR Green I | ThermoFisher | Cat# S7563 | |
| chemical compound, drug | Streptavidin peroxidase | Sigma-Aldrich | Cat# S2438 | |
| chemical compound, drug | AlexaFluor 594 conjugated Streptavidin | ThermoFisher | Cat# S32356 | |
| chemical compound, drug | AlexaFluor 488 conjugated Streptavidin | ThermoFisher | Cat# S32354 | |
| chemical compound, drug | WR99210 | Sigma-Aldrich | Cat# W1770 | Antifolate drug. The hdhfr gene confers resistance. |
| chemical compound, drug | Rapamycin | Sigma-Aldrich | Cat# R0395-1MG | |
| chemical compound, drug | Cytochalasin D | Sigma-Aldrich | Cat# C8273 | |
| chemical compound, drug | Compound 2 (4-[7-dimethylamino)methyl]−2-(4-fluorphenyl)imidazo[1,2-α]pyridine-[3-yl]pyrimidin-2-amine | LifeArc (https://www.lifearc.org/) | Kindly provided by Dr Simon A Osborne (LifeArc) | |
| software, algorithm | Protospacer | Cameron MacPherson, BIHP, Institut Pasteur, Paris, France | https://sourceforge.net/projects/protospacerwb/ | |
| software, algorithm | FlowJo for Mac (version 10.3.0) | Becton Dickinson Life Sciences | RRID:SCR_008520 | |
| software, algorithm | GraphPad Prism 8.0 | https://www.graphpad.com/ | RRID:SCR_002798 | |
| software, algorithm | Fiji (Image J version 2.0) | Imagej.net | RRID:SCR_003070 | |
| software, algorithm | BD FACSDiva software | BD Bioscience | RRID:SCR_001456 | |
| software, algorithm | Axiovision 3.1 | Zeiss | RRID:SCR_002677 | |
| software, algorithm | MaxQuant 1.3.0.5 | Max Planck Institute of Biochemistry | RRID:SCR_014485; https://www.maxquant.org/ | |
| software, algorithm | Perseus 1.4.0.11 | Max Planck Institute of Biochemistry | RRID:SCR_015753; http://www.perseus-framework.org |
Additional files
Download links
A two-part list of links to download the article, or parts of the article, in various formats.
Downloads (link to download the article as PDF)
Open citations (links to open the citations from this article in various online reference manager services)
Cite this article (links to download the citations from this article in formats compatible with various reference manager tools)
The malaria parasite sheddase SUB2 governs host red blood cell membrane sealing at invasion
eLife 9:e61121.
https://doi.org/10.7554/eLife.61121


