The role of P2Y12 in the kinetics of microglial self-renewal and maturation in the adult visual cortex in vivo
- Department of Neuroscience, University of Rochester Medical Center, United States
- Department of Biostatistics, University of Rochester Medical Center, United States
- Department of Biomedical Engineering, University of Rochester, United States
- Center for Visual Science, University of Rochester, United States
Figures
Figure 1 with 2 supplements
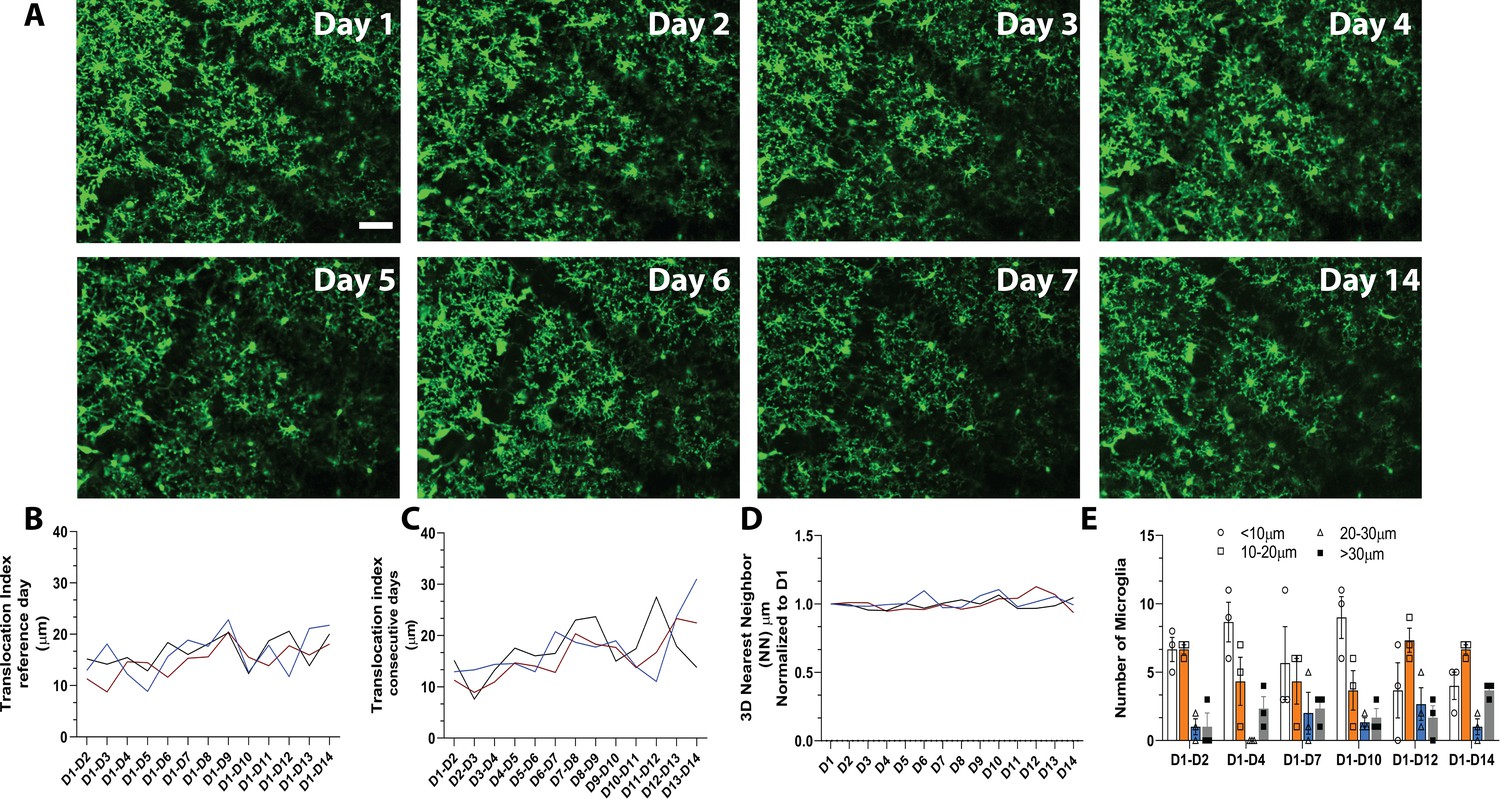
In vivo imaging of microglia shows limited migration and turnover in the physiological brain.
(A) A field of microglia in an awake mouse imaged over 14 consecutive days. The dark diagonal lines in the center and top right of the image are blood vessels that remain structurally stable and can be used as landmarks to identify the same location for chronic imaging. Several microglia are identified with the same-colored circles at different time points to show the stability of their somas. (B) Nearest neighbor quantification in 3D demonstrates the distribution of neighboring microglial cells over consecutive days. (C) The translocation index, which captured the average displacement of microglia over time, was ~15 µm when consecutive imaging sessions were compared. (D) The translocation index increased when D1 is compared to imaging carried out later (D2–D14). (E) Microglia translocation between D1-D2, D1-D4, D1-D7, D1-D10, D1-D12, and D1-D14. On average, the majority of microglia remained within ~10 µm away (white bars, circles) from their original location. The number of microglia that moved within their domain (10–30 µm; orange bars, squares), (20–30 µm; blue bars, triangles) or translocated a further distance (>30 µm; gray bars, filled circles) stayed relatively constant with increasing interval between imaging sessions (n=3, 30–40 µm stacks, 13–17 microglia per mouse). Scale bar, 50 μm. Figure 1—source data 1: Source data for microglia turnover and migration in the physiological brain.
-
Figure 1—source data 1
Source data for microglia turnover and migration in the physiological brain.
- https://cdn.elifesciences.org/articles/61173/elife-61173-fig1-data1-v2.xlsx
-
Figure 1—source data 2
Source data for CSF1R inhibition in the adult brain.
- https://cdn.elifesciences.org/articles/61173/elife-61173-fig1-data2-v2.xlsx
-
Figure 1—source data 3
Source data for the Cytokine panel conducted.
- https://cdn.elifesciences.org/articles/61173/elife-61173-fig1-data3-v2.xlsx
Figure 1—figure supplement 1
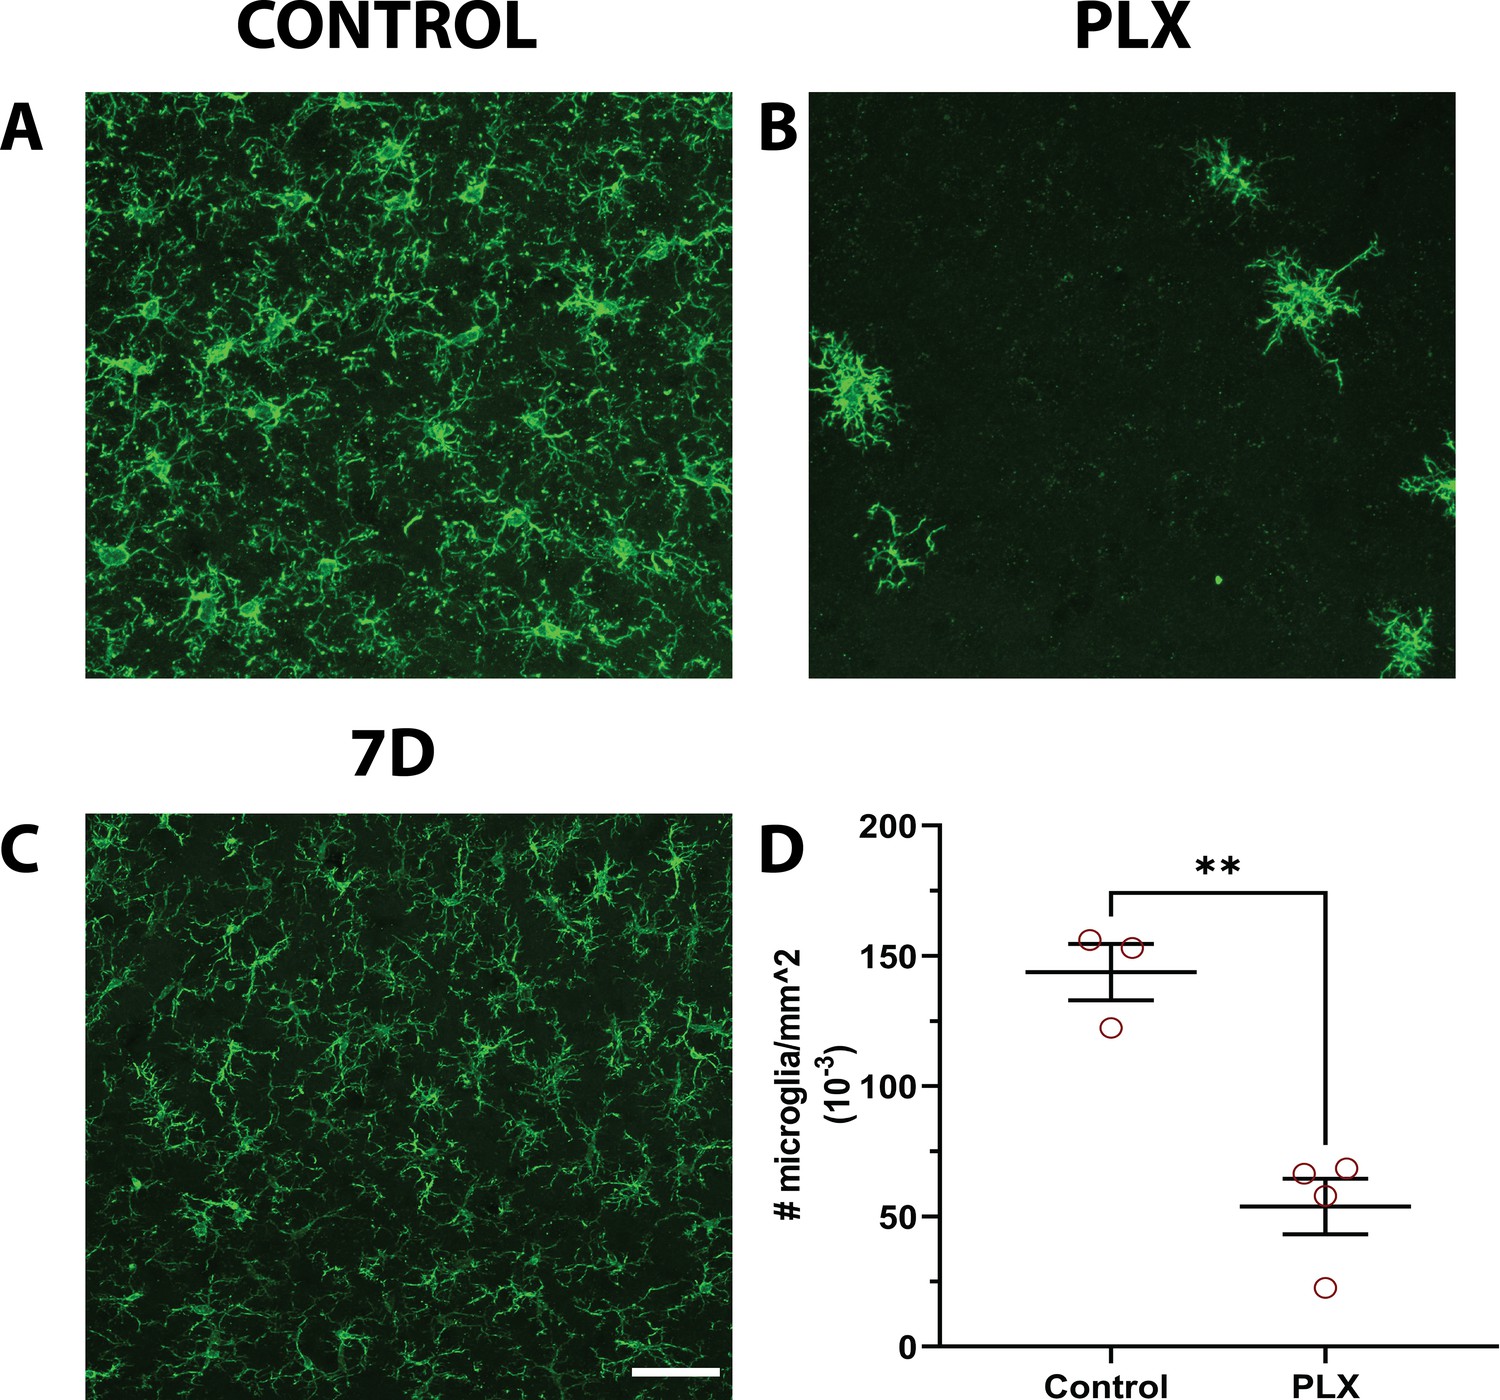
CSF1R inhibitor consistently eliminates microglia from the adult brain.
(A–C) Representative maximum intensity projections of confocal images of microglia from the primary visual cortex (V1) in fixed sections of control (A), 7 days PLX (B), and 7 days repopulated (C) mice. (D) Microglial numbers significantly decreased with PLX. n=3–4 animals, average of 3–4 slices per animal. T-test, **p<0.01. Graphs show mean ± s.e.m. Points represent individual animals. Scale bar, 50 µm. Figure 1—source data 2: Source data for CSF1R inhibition in the adult brain.
Figure 1—figure supplement 2
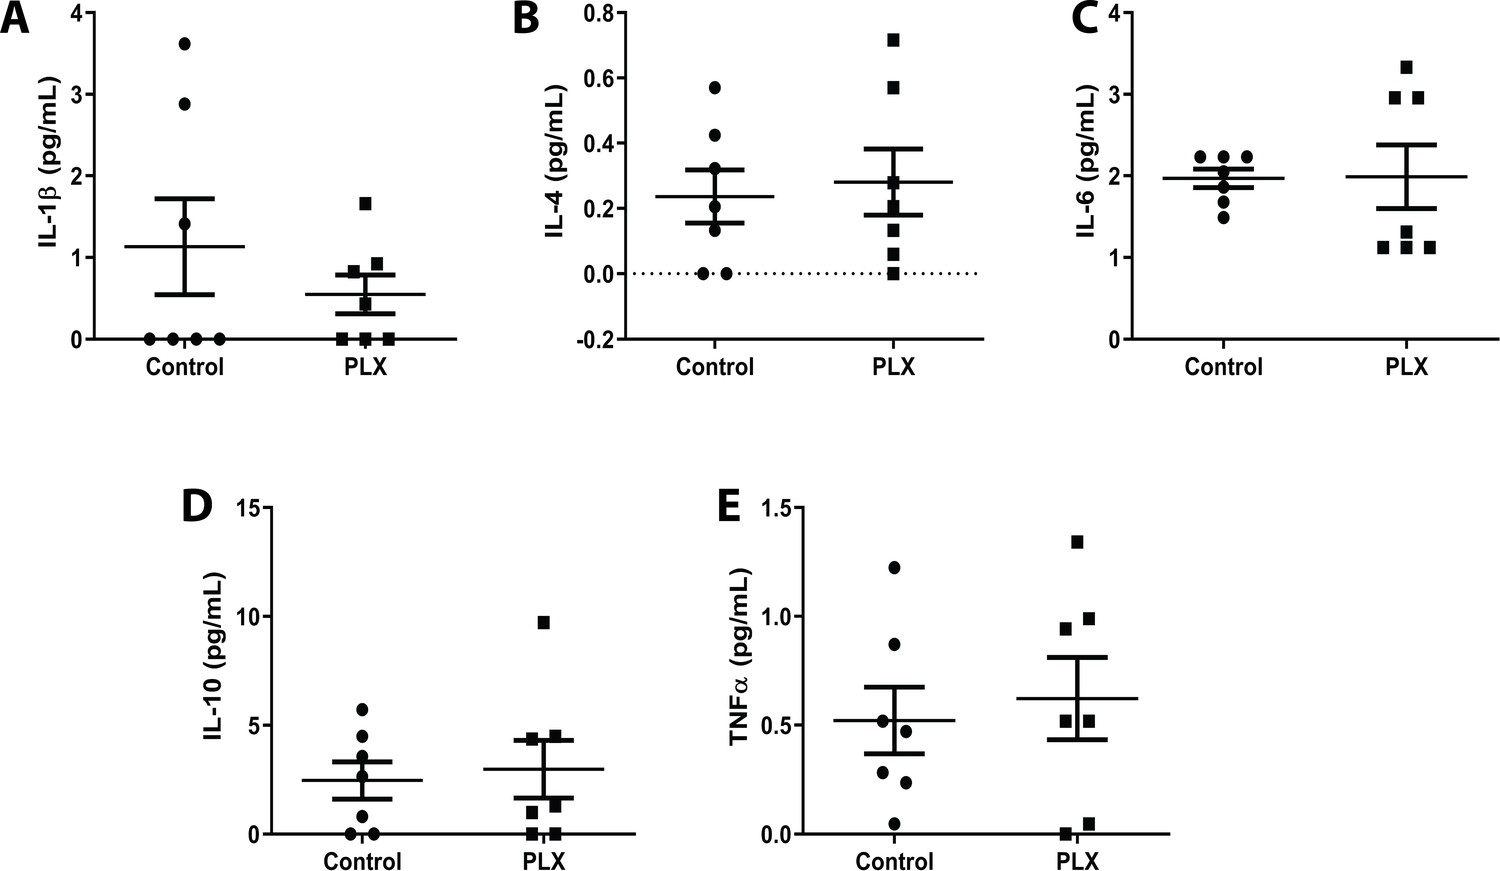
No change in inflammatory milieu following microglial depletion.
(A–L) A combination of anti-inflammatory and pro-inflammatory cytokines including IL-1b, IL-4, IL-6, IL-10, and TFNα were tested using a Multiplex Assay. Each experiment was assayed in triplicate. n=seven animals. T-test, ns. Graphs show means ± s.e.m. Points represent individual animals. Figure 1—source data 3: Source data for the Cytokine panel conducted.
Figure 2 with 3 supplements
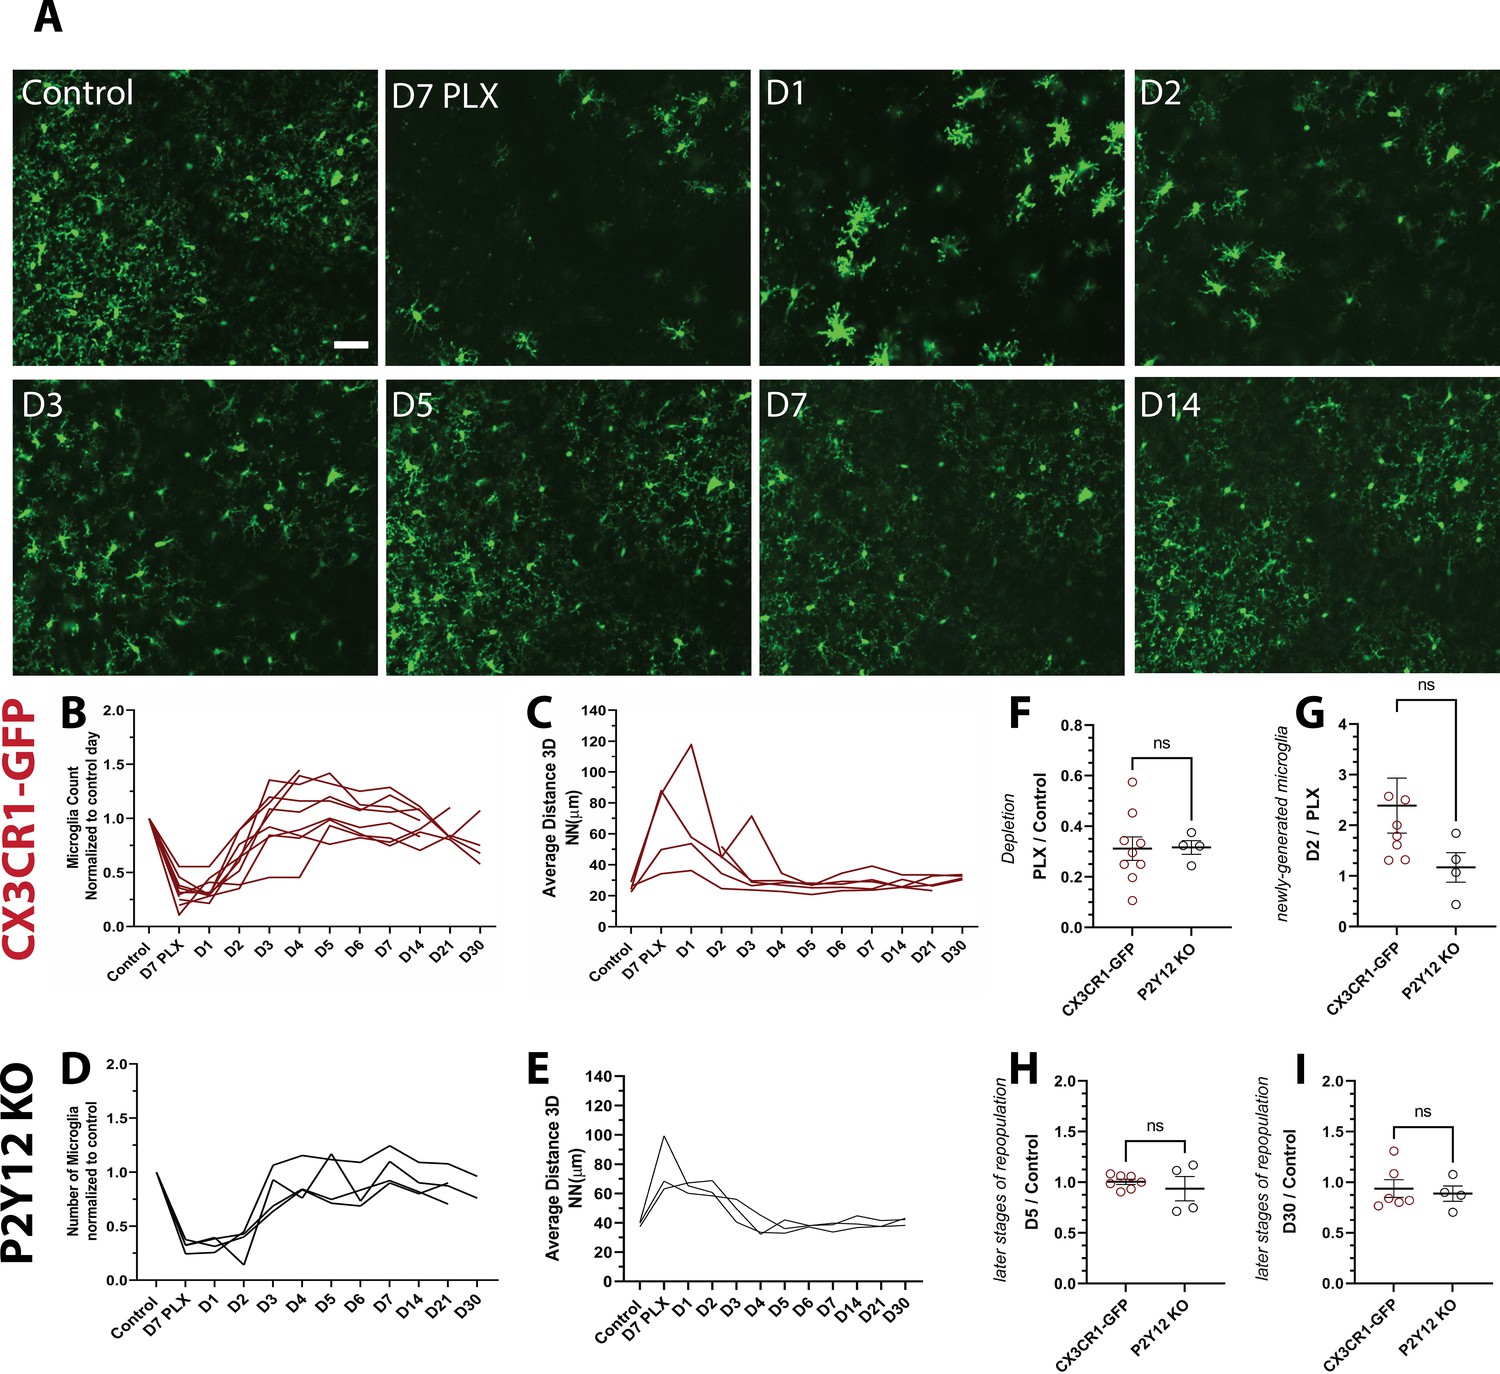
Microglia rapidly repopulate the visual cortex after partial depletion.
(A) A field of microglia during depletion and repopulation imaged in vivo in the same awake mouse. (B) The number of microglia (normalized to control day for each animal) during depletion (PLX) and with repopulation (day 1 day 30). Each line represents an individual animal (n=10, 70–80 microglia per mouse). (C) 3D nearest-neighbor quantification showed a large increase during depletion and the early stages of repopulation before returning to control numbers (n=4, 5–80 microglia per mouse; a subset of mice from (C) that could be imaged throughout the control, depletion, and repopulation time points were used for this analysis). (D) Depletion and repopulation dynamics were similar in the absence of P2Y12 (n=four animals, 5–80 microglia per mouse). (E) 3D nearest neighbor analysis shows similar changes in microglial distribution during repopulation in the absence of P2Y12 (n=3 animals 5-80 microglia per mouse). (F) The ratio of microglia numbers observed on D7 PLX to control. (G) Repopulation was slightly delayed in P2Y12-KO mice as compared to WT, as the change in microglial numbers from depletion (PLX) to day 2 of repopulation was significantly smaller in the absence of P2Y12. (H) By day 5 of repopulation, the change in microglial numbers had normalized between WT and P2Y12-KO mice. (I) Microglial numbers never fully recovered to control conditions in either WT or P2Y12-KO mice (F-I, T-test ns, n=4, 5–80 microglia per mouse). Scale bar, 50 μm. Figure 2—source data 1: Source data of microglial repopulation after partial depletion.
-
Figure 2—source data 1
Source data of microglial repopulation after partial depletion.
- https://cdn.elifesciences.org/articles/61173/elife-61173-fig2-data1-v2.xlsx
-
Figure 2—source data 2
Source data for the GFAP expression following microglial depletion.
- https://cdn.elifesciences.org/articles/61173/elife-61173-fig2-data2-v2.xlsx
Figure 2—figure supplement 1
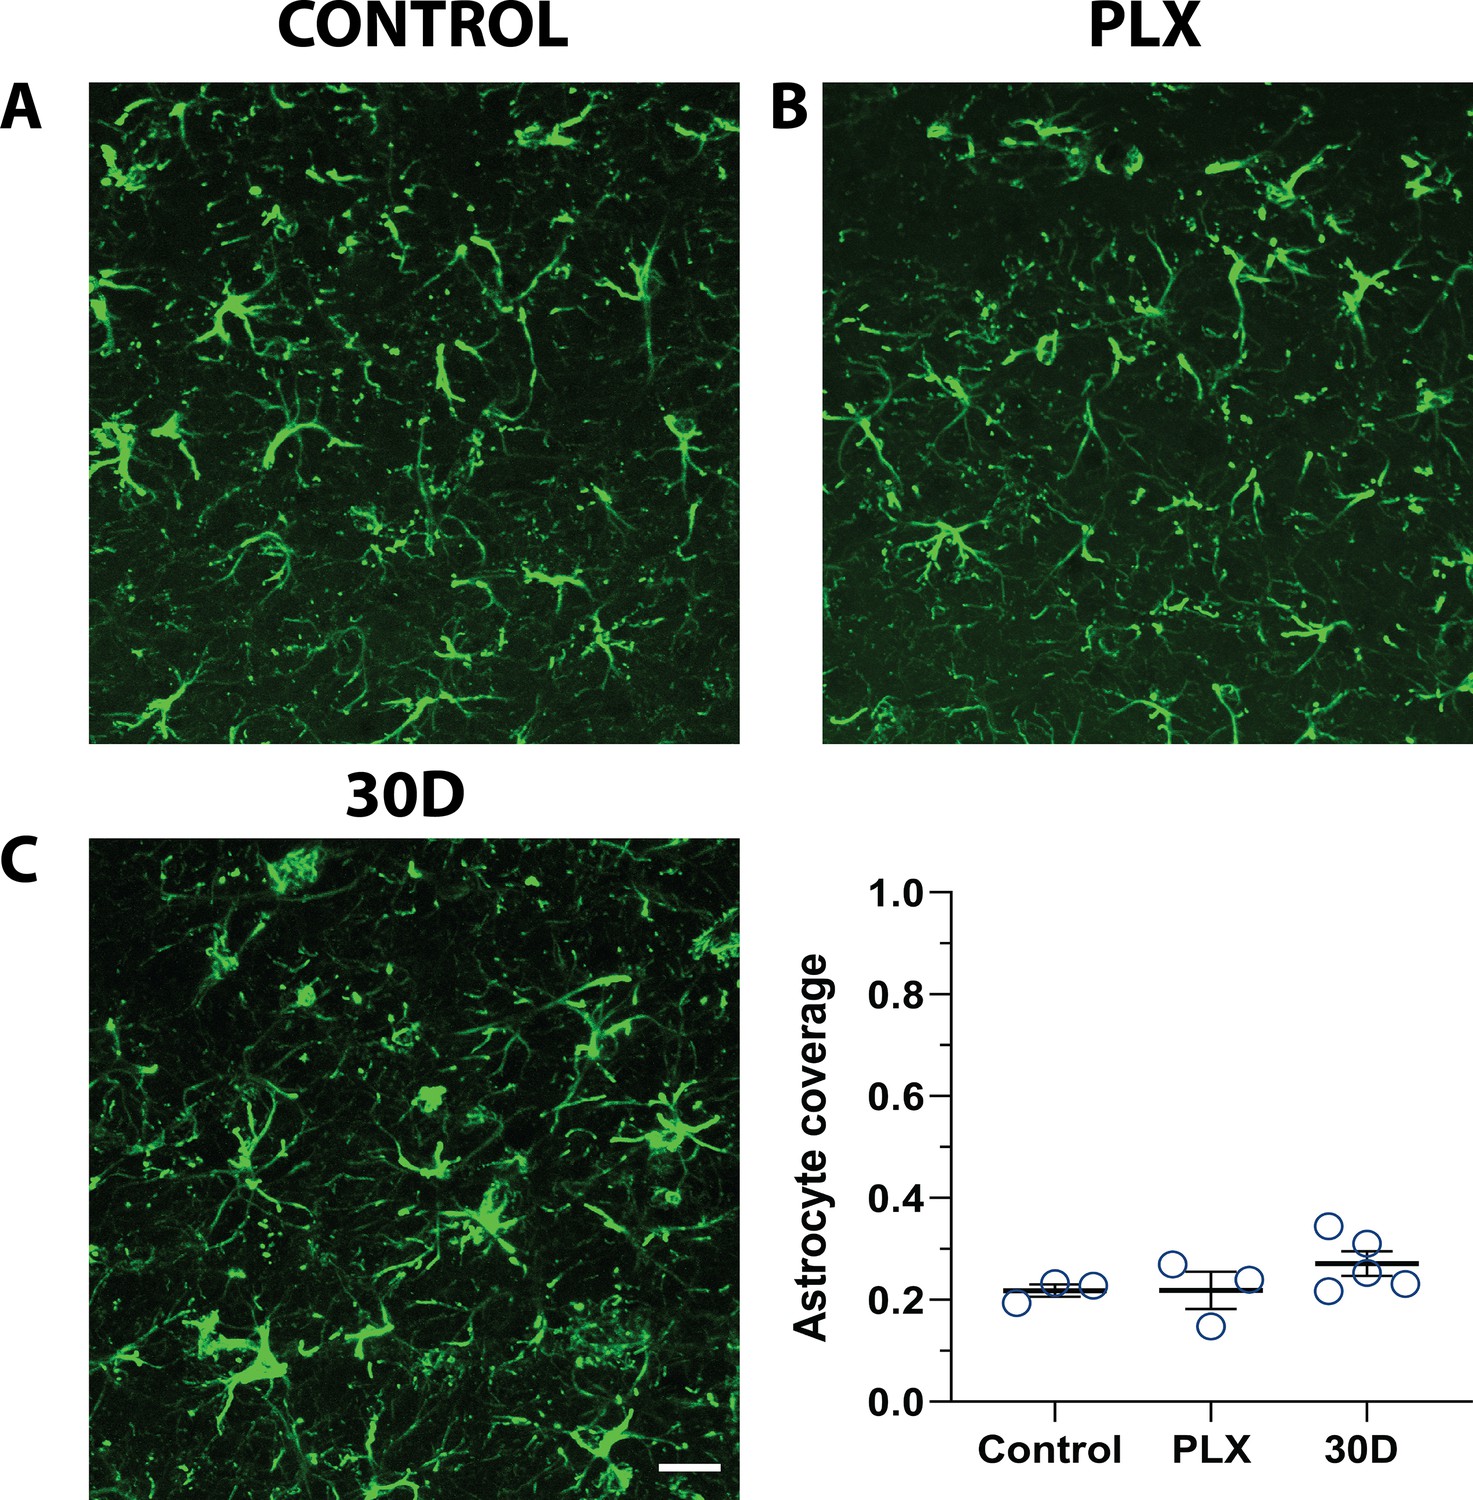
GFAP expression is unchanged following microglial depletion.
Representative confocal images of astrocytes immunoreacted for GFAP in fixed brain sections from mice in control conditions (A) after PLX treatment (B) and after 30 days of repopulation (C). Qualitatively astrocyte morphology and expression of GFAP did not change following microglial depletion. (D) The proportion of V1 area covered by GFAP-positive astrocytes was unchanged with PLX treatment. n=3–5 animals, one-way ANOVA, Dunnett post-hoc test, ns. Graphs show means ± s.e.m. Points represent individual animals. Scale bar, 20 µm. Figure 2—source data 2: Source data for the GFAP expression following microglial depletion.
Figure 2—figure supplement 2
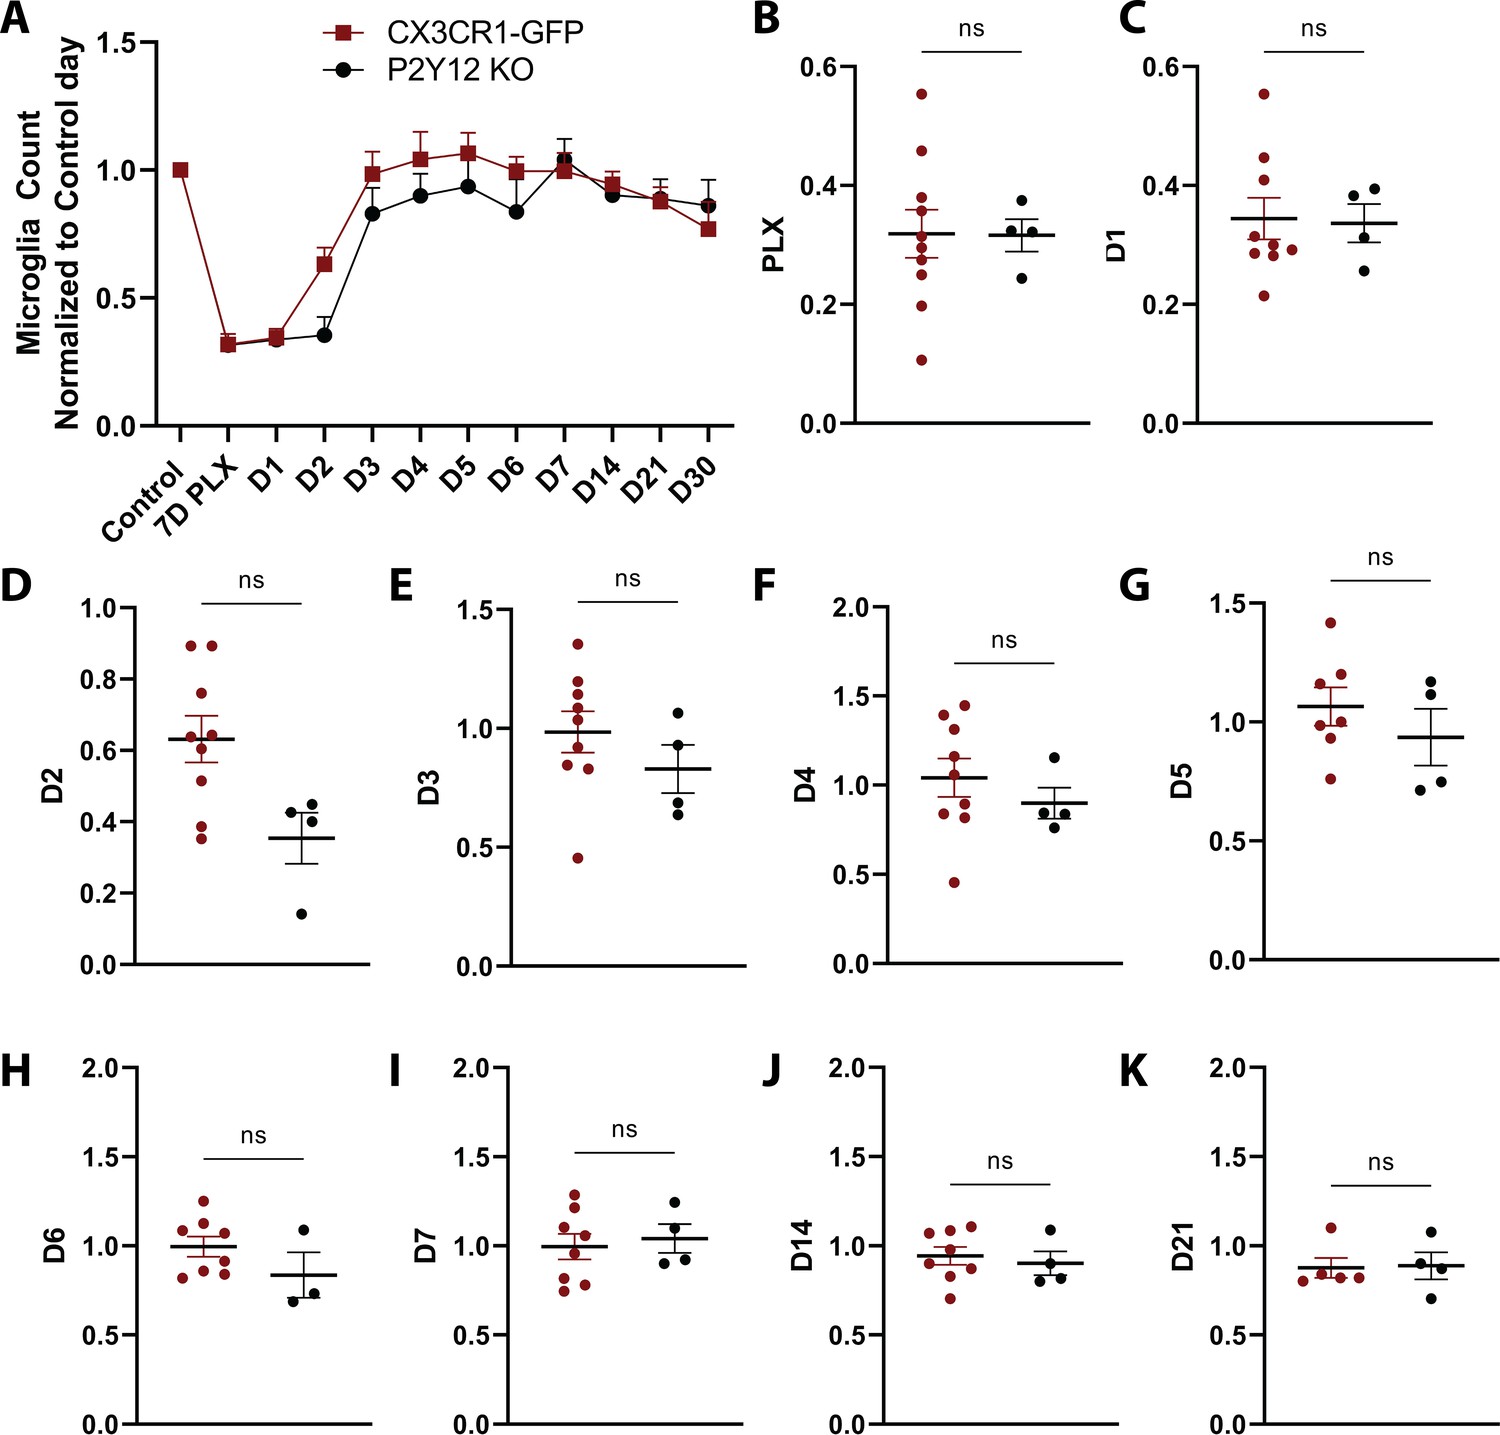
Comparison of microglial number over the course of repopulation in the presence and absence of P2Y12.
(A) Number of microglia for CX3CR1-GFP (red) and P2Y12-KO (black) animals for each imaging normalized to first control time point. (B–J) There was no significant difference over the course of repopulation. n=4–13 mice per group. T-test, ns. Graphs show mean ± s.e.m. Points represent individual animals. Please note that these comparisons include all animals imaged even if the imaging series was not complete. For the comparisons in Figure 2F–I only animals which had complete imaging were used so that changes between time points in individual animals could be compared directly.
Figure 2—figure supplement 3
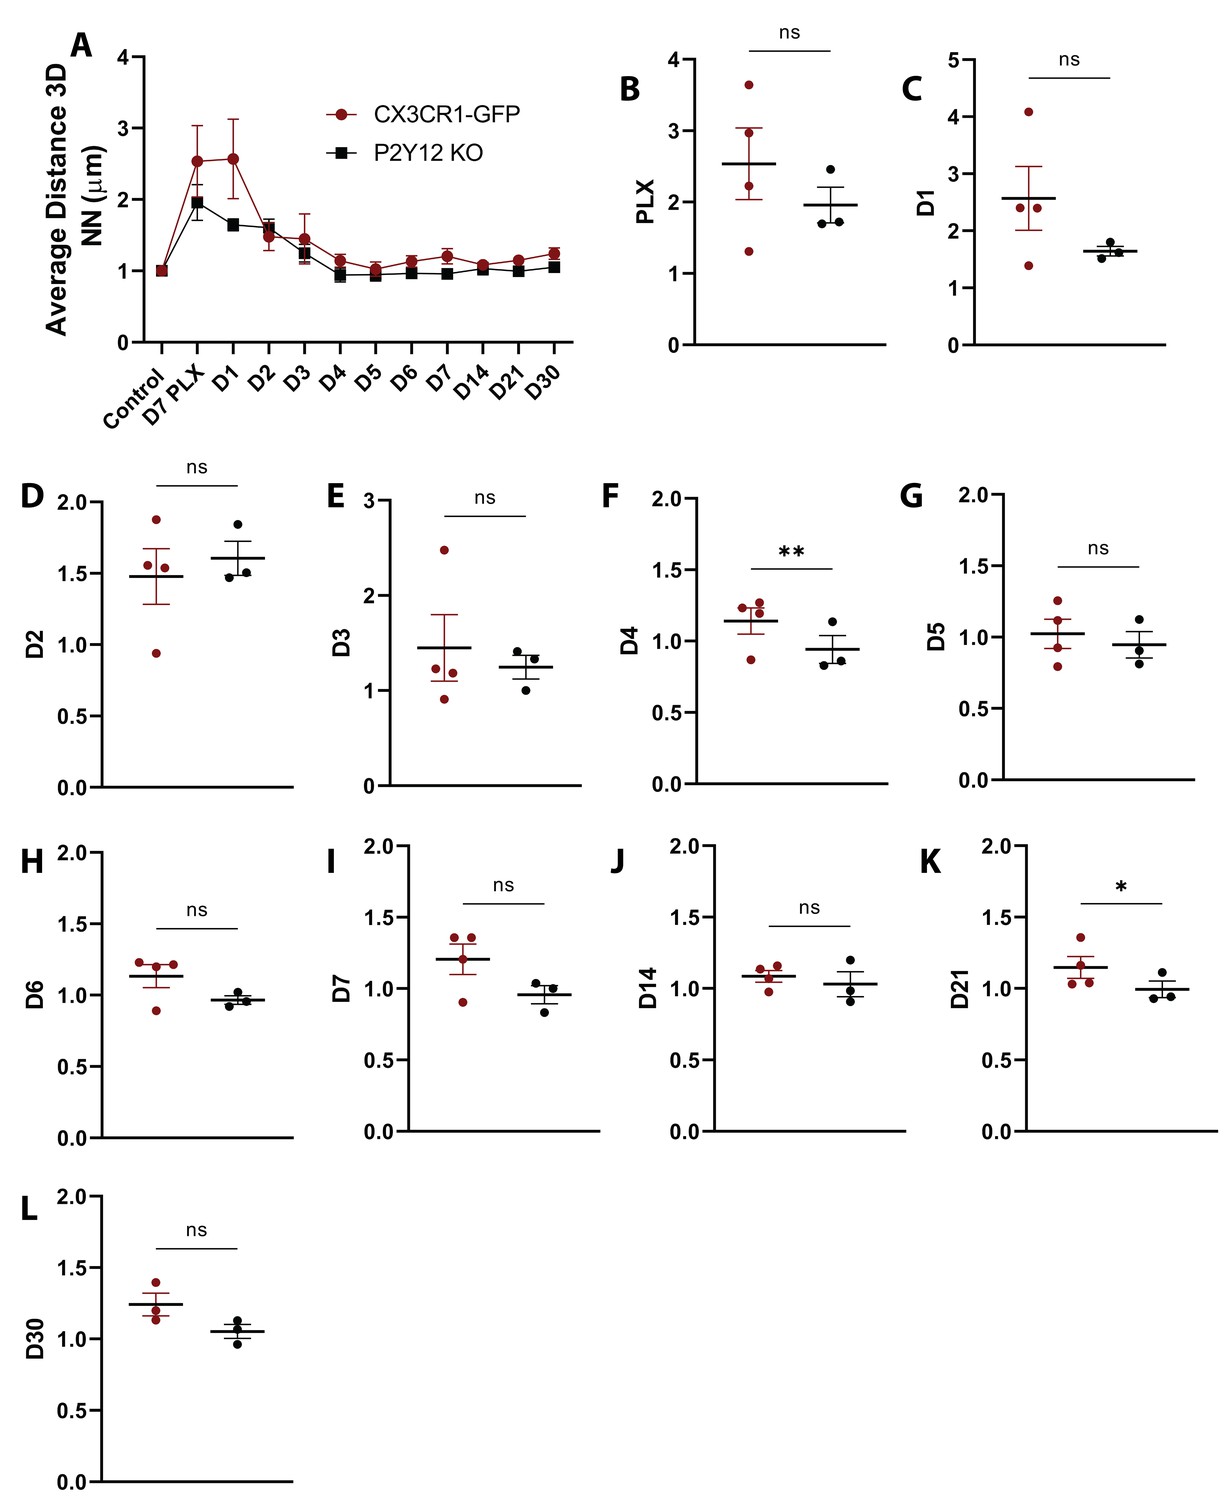
Comparison of nearest neighbor distance over the course of repopulation in the presence and absence of P2Y12.
(A) The nearest neighbor quantification for CX3CR1-GFP (red) and P2Y12-KO (black) animals for each imaging time point normalized to the first control time point. (B–J) Differences between genotypes were small but significant at D4 and D21 of repopulation. n=4–13 mice per group, T-test, *p<0.05, **p<0.01. Graphs show mean ± s.e.m. Points represent individual animals.
Figure 3 with 1 supplement
Microglia self-renewal via residual cells in the visual cortex.
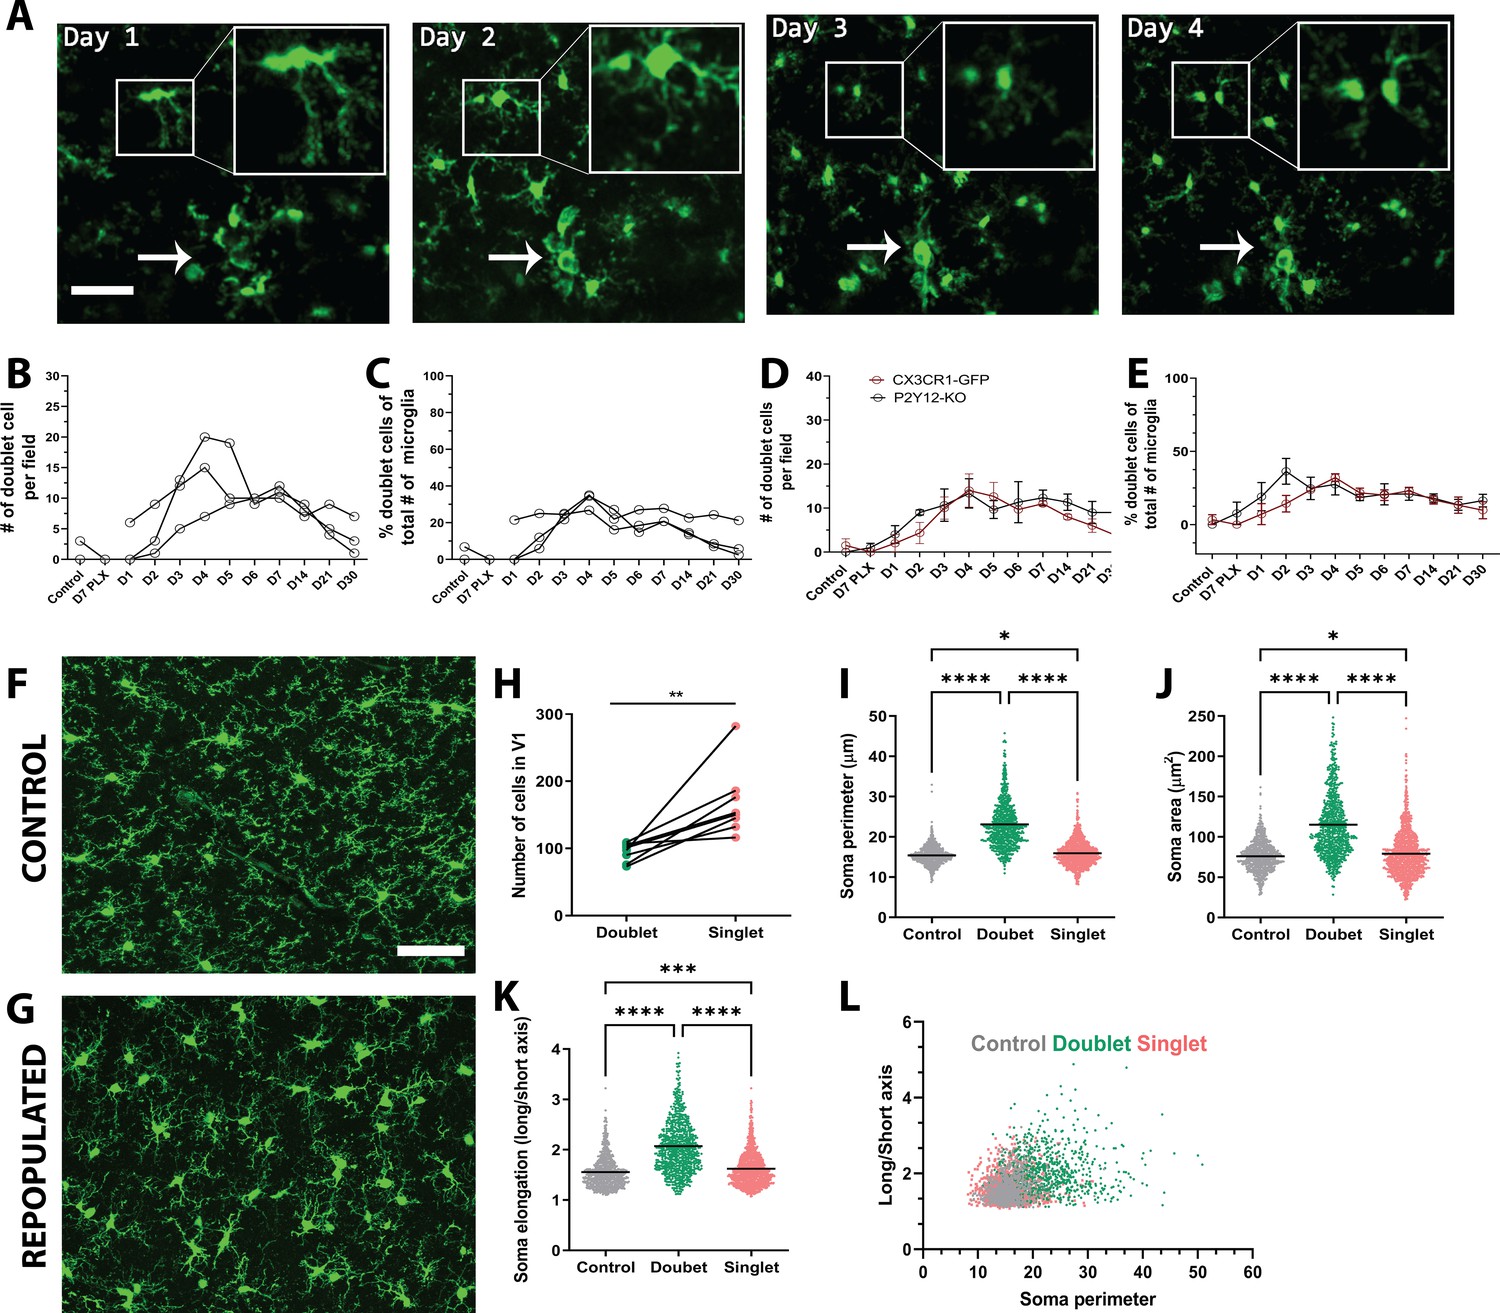
(A) Representative in vivo two-photon imaging of microglial division in CX3CR1-GFP awake mice. Inset is a magnified image of the dividing doublet microglia, which appears as an elongated cell body on day 1 and divides into two cells on day 2. The two microglia then migrated away from one another over the subsequent 2 days. The arrow indicates a cluster of microglia that may represent a multinucleate body but did not generate new microglia during the imaging period. (B) The number of doublet cells per field increased at day 3 day 5 of repopulation (n=3–4, 50–150 microglia per mouse). (C) Doublets made up close to 40% of the total number of microglia at day 4 of repopulation (n=3–4, 50–150 microglia per mouse). The number (D) and percentage (E) of microglial doublets over time were similar in P2Y12-KO mice as compared to WT (n=three animals per group). (F–G) Representative confocal images of microglia from control CX3CR1-GFP mice (F) or mice 2 days after cessation of PLX (peak repopulation) (G) (n=four animals per group). Examples of singlets and doublets are shown with blue and red arrows, respectively. (H) Doublet cells made up ~40% of the total number of microglia quantified during the peak of repopulation. Doublets present after 2 days of repopulation showed an increase in both soma perimeter (I), area (J) and elongation (as defined by the ratio of the lengths of the long to the short axis; K), as compared with singlets and control microglia. (L) Soma elongation plotted against soma perimeter shows separation of the defined morphological states. While, control and singlet microglia overlap, doublet microglia are relatively distinct. (*p<0.05, **p<0.01, ***p<0.001, ****p<0.0001, T-test, paired (H); One-way ANOVA, Dunnett post-hoc test (I–K)). Graphs show mean ± s.e.m. Each line represents an animal (B–E), points represent individual animals (H), and each dot represents a cell (I–L). Scale bar, 50 μm. Figure 3—source data 1: Source data for microglial repopulation.
-
Figure 3—source data 1
Source data for microglial repopulation.
- https://cdn.elifesciences.org/articles/61173/elife-61173-fig3-data1-v2.xlsx
-
Figure 3—source data 2
Galectin three expression in microglia after repopulation.
- https://cdn.elifesciences.org/articles/61173/elife-61173-fig3-data2-v2.xlsx
Figure 3—figure supplement 1
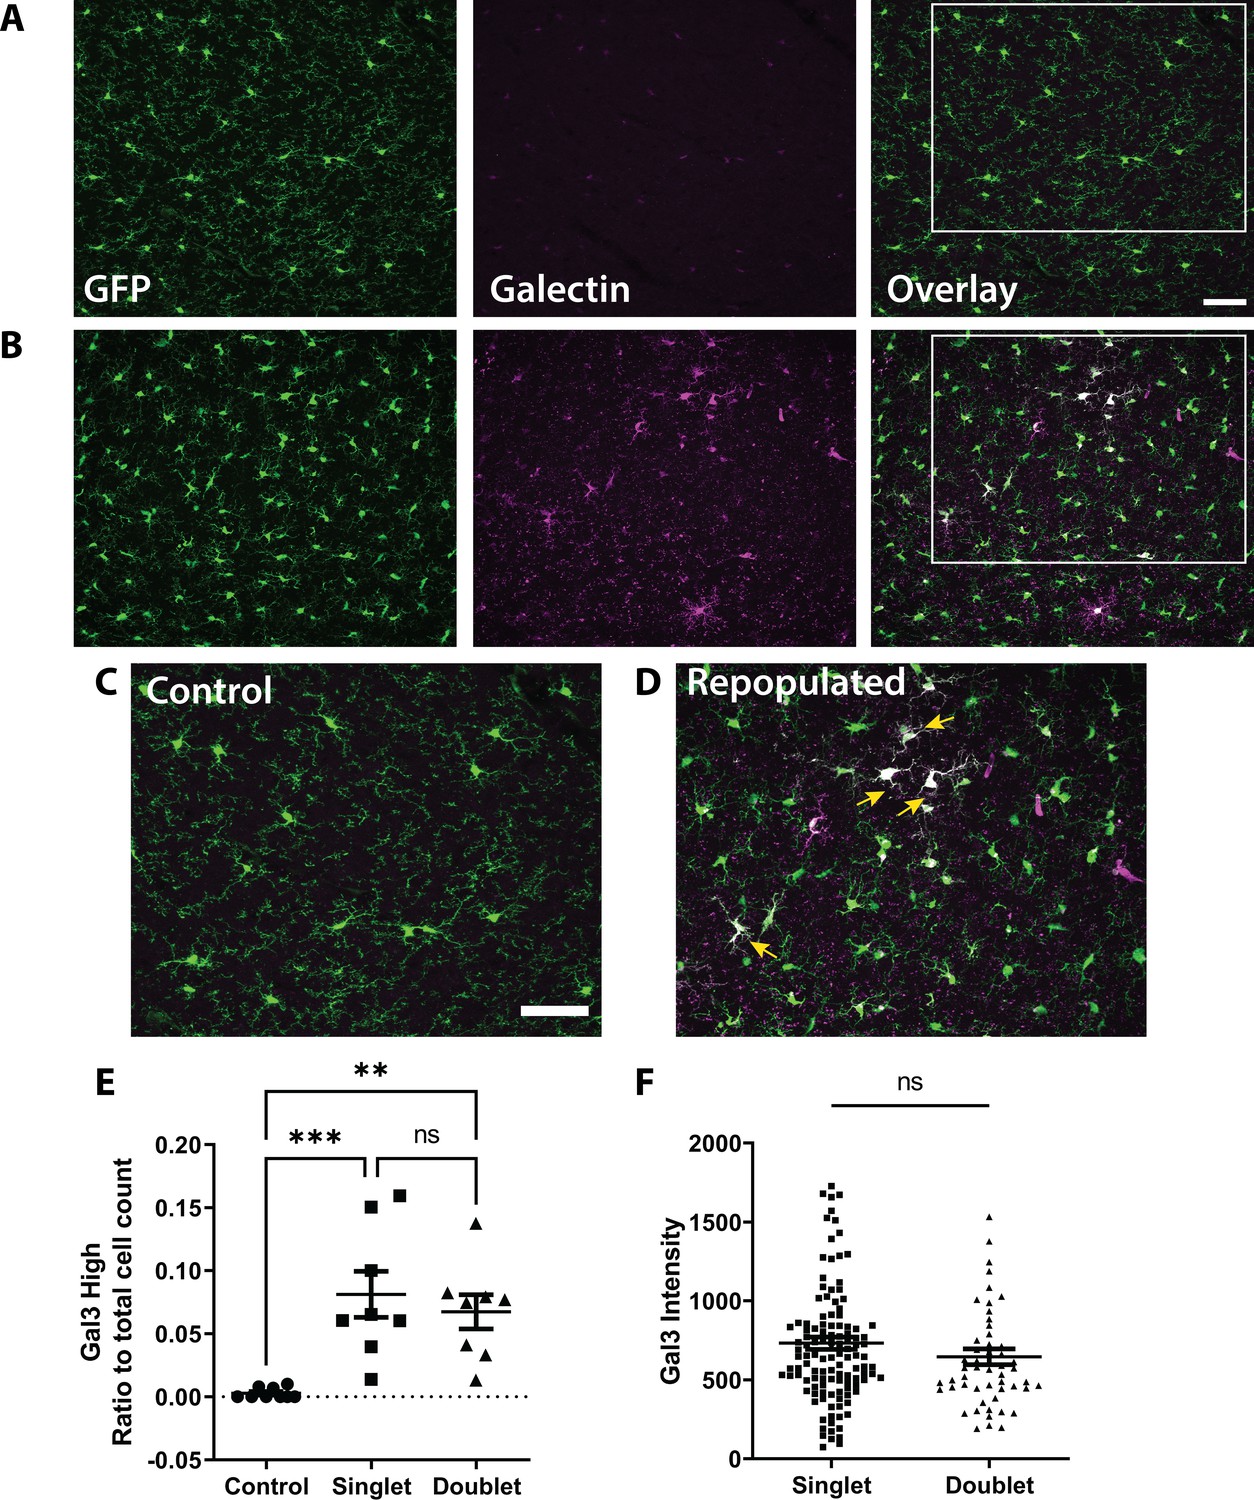
Galectin three expression in doublet and singlet microglia.
Representative confocal images of microglia in CX3CR1-GFP mice immunoreacted for Galectin 3 (Gal3) in fixed brain sections from mice in control conditions (A) at the peak of repopulation (Day 2) (B). (C-D) Insets of the boxed region in A-B, showing Galectin three positive microglia during repopulation (yellow arrows). Weak Galectin three staining was also observed in microglia in control conditions. (E) While few microglia were Galectin three positive in control conditions, the percentage of Galectin3 positive microglia increased during repopulation, although to a similar degree in singlet and doublet populations. (F) The Galectin three intensity was similar in the doublet and singlet population of microglia during repopulation. n=eight animals per group, One-way ANOVA, Dunnett post-hoc test; (E); T-test (F), **p<0.01, ***p<0.001, ****p<0.0001, ns. Graphs show mean ± s.e.m. Points represent individual animals. Scale bar, 50 µm. Figure 3—source data 2: Galectin three expression in microglia after repopulation.
Figure 4

Microglia repopulation in the visual cortex demonstrates that cell division can account for the fast repopulation observed in vivo.
We imaged CX3CR1-GFP mice every 4 hr for 24 hr during the peak of repopulation (day 2 day 3). We observed a range of behaviors of existing microglia: (A) no division, (B) rapid division on the time scale of 4–8 hr once the doublet appeared, and (C) secondary division, where newly divided microglia underwent another division. (D) Microglial divisions are not spatially regulated. Three microglia in the field of view are divided at different times over the course of 24 hr. (E) The number of microglia during the 24-hr period in the four mice that were imaged. (F) Microglial 3D nearest neighbor distance decreased with time as more microglia were added to the population (n=3). (G) The number of doublets increased during the 24-hr period (n=4). (H) Rapid divisions made up the larger proportion of divisions at each imaging time point compared to secondary divisions (n=4). (I) We tracked identified microglia over time in a small field of view in a subset of animals. The translocation index, which captured the average displacement of microglia over time, was ~8 µm when consecutive imaging sessions were compared (n=3). (J) Microglia translocation between consecutive time points (n=3). On average, the majority of microglia remained within ~10 µm of their original location (white bars). The proportion of microglia that moved within their domain (10–20 µm; orange bars, circles), (20–30 µm; blue bars, squares), or translocated a further distance (>30 µm; gray bars, filled black circles) stayed relatively constant with increasing 4 hr intervals (n=3). (K) In one animal, we categorized microglia over time and determined that when normalized by the total number of microglia at the end of the imaging session, the majority of microglia exhibited a doublet morphology at some point during imaging, and very few microglia exhibited either a persistent normal or doublet morphology (did not divide). Scale bar, 50 μm. Figure 4—source data 1: Source data for microglia repopulation in mice imaged every 4 hr for 24 hr.
-
Figure 4—source data 1
Source data for microglia repopulation in mice imaged every 4 hr for 24 hr.
- https://cdn.elifesciences.org/articles/61173/elife-61173-fig4-data1-v2.xlsx
Figure 5 with 1 supplement
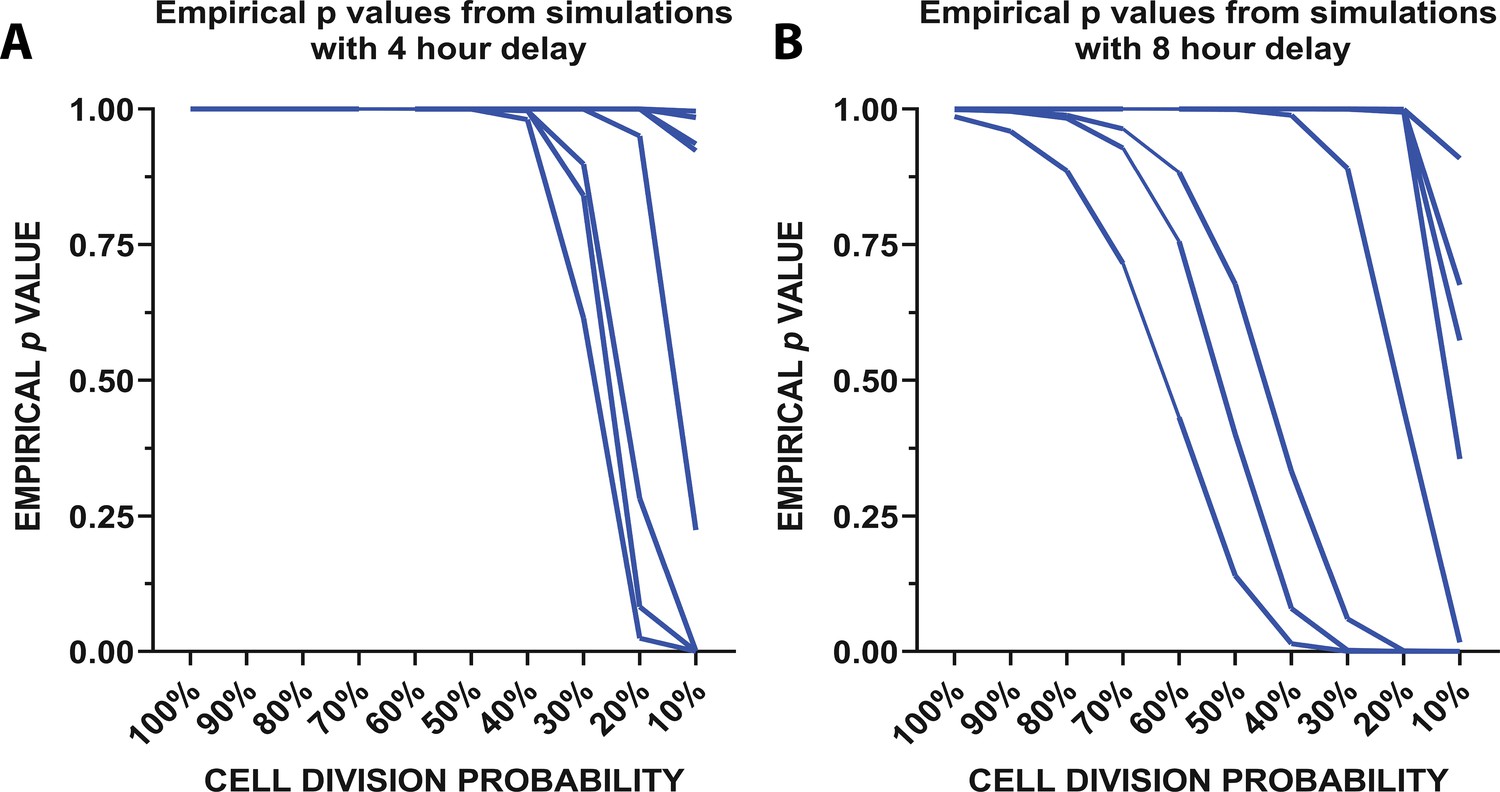
Mathematical modeling of microglial repopulation.
(A–C) Mathematical modeling of microglial repopulation using measured kinetic parameters. Empirical ρvalues from the simulation are plotted for a minimum 4 hr delay (A) and 8 hr delay (B) between subsequent divisions; each animal is represented by a line (n=10). Figure 5—source data 1: Source data for the mathematical modeling of microglial repopulation.
-
Figure 5—source code 1
Code to generate the mathematical model simulation.
- https://cdn.elifesciences.org/articles/61173/elife-61173-fig5-code1-v2.zip
-
Figure 5—source data 1
Source data for the mathematical modeling of microglial repopulation.
- https://cdn.elifesciences.org/articles/61173/elife-61173-fig5-data1-v2.xlsx
Figure 5—figure supplement 1
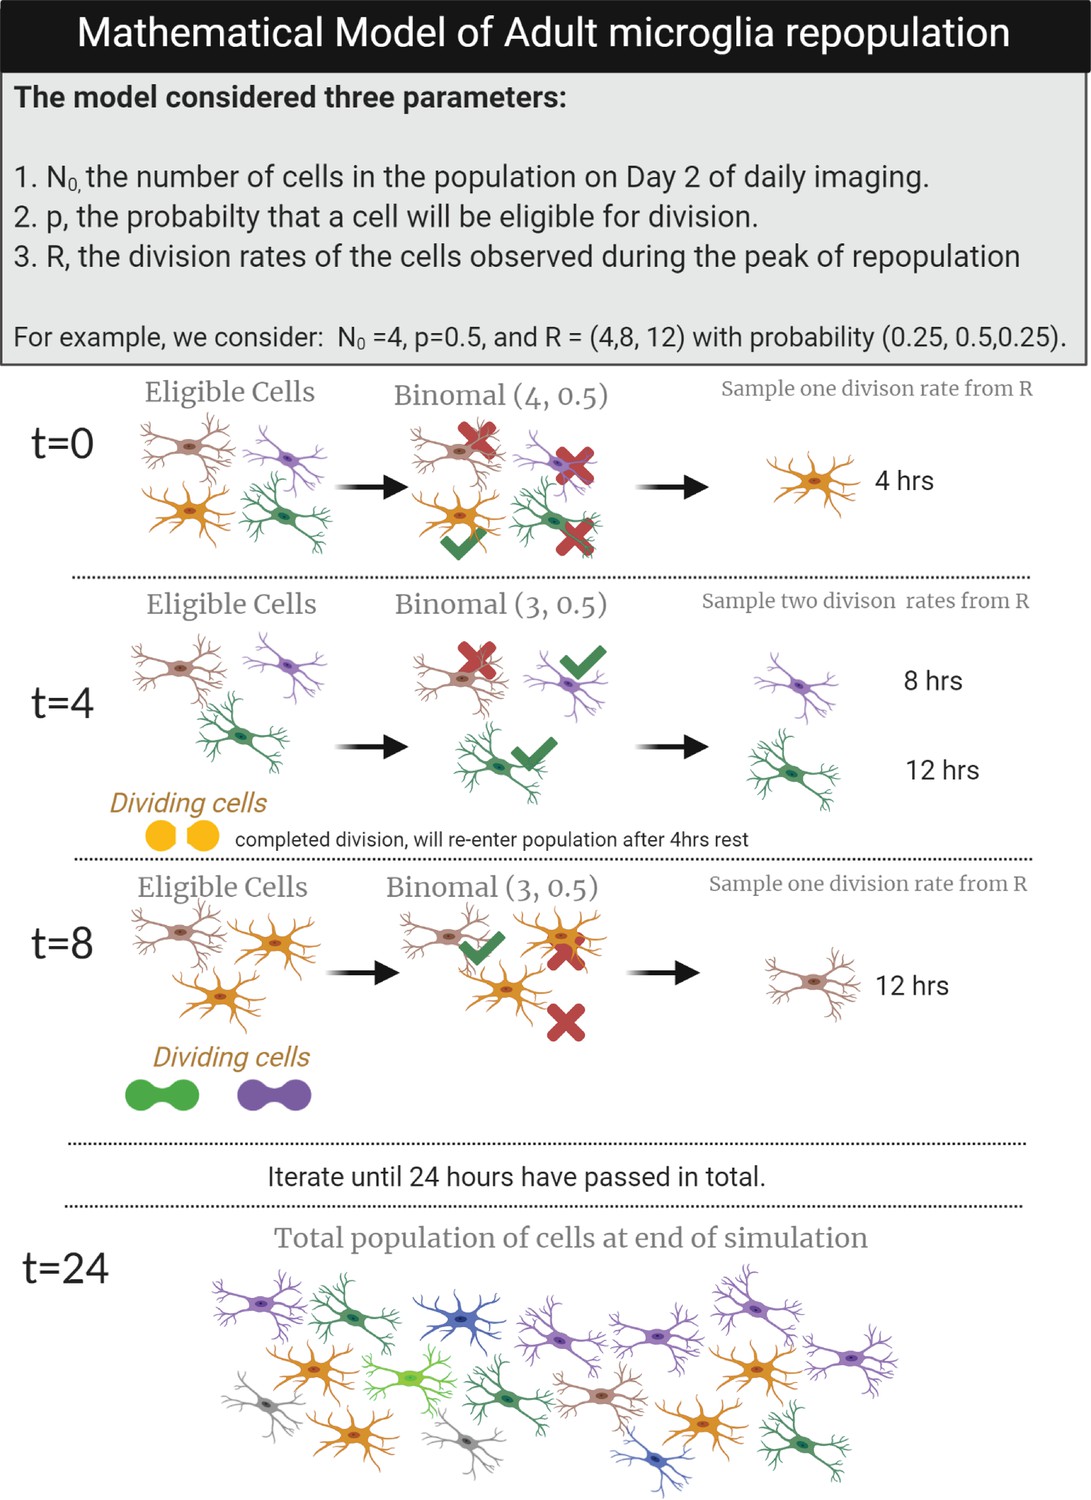
Mathematical model of adult microglia repopulation.
A schematic to demonstrate the steps of the mathematical model and the cells that were used to estimate the total population of cells at the end of 24 hr. In this example, we start N0=4 (there are four microglia at t=0), p=0.5 (the probability of each of these cells undergoing a division is 0.5), and R=(4,8,12), which represents the observed division rates in vivo which were 4, 8, and 12 hr with a probability of (0.25,0.5,0.25), reflecting the fact that half the cells took 8 hr to divide, while a quarter tool 4 hr and another quarter took 12 hr. T=0: Given p=0.5, one cell (yellow) will undergo division and will take 4 hr to divide (as sampled from R). T=4: The dividing cell is removed from the dividing population and assumed to be refractory for 4 hr once division is complete. This is indicated by the two yellow 'dividing cells at the bottom of the panel'. The remaining three cells from t=0 are now eligible for division. Given p=0.5, two cells will divide at this time point with rates of 4 and 8 hr as sampled from R. T=8: The two dividing cells from t=four have reentered the dividing population, and now three microglia are eligible for division while two microglia are actively dividing after t=4. One microglia (brown) will divide at this time point with a 12 hr division rate (as sampled from R). T=24: This process is repeated iteratively, until the last time point when 18 microglia are present in the population. This procedure was used to model data from daily imaging experiments (Figure 2) using N0 as the number of microglia present in each animal on day 2. Figure 5—source data 1: Source data for the mathematical modeling of microglial repopulation. Source code-Figure 5—source data 1: Code to generate the mathematical model simulation.
Figure 6 with 1 supplement
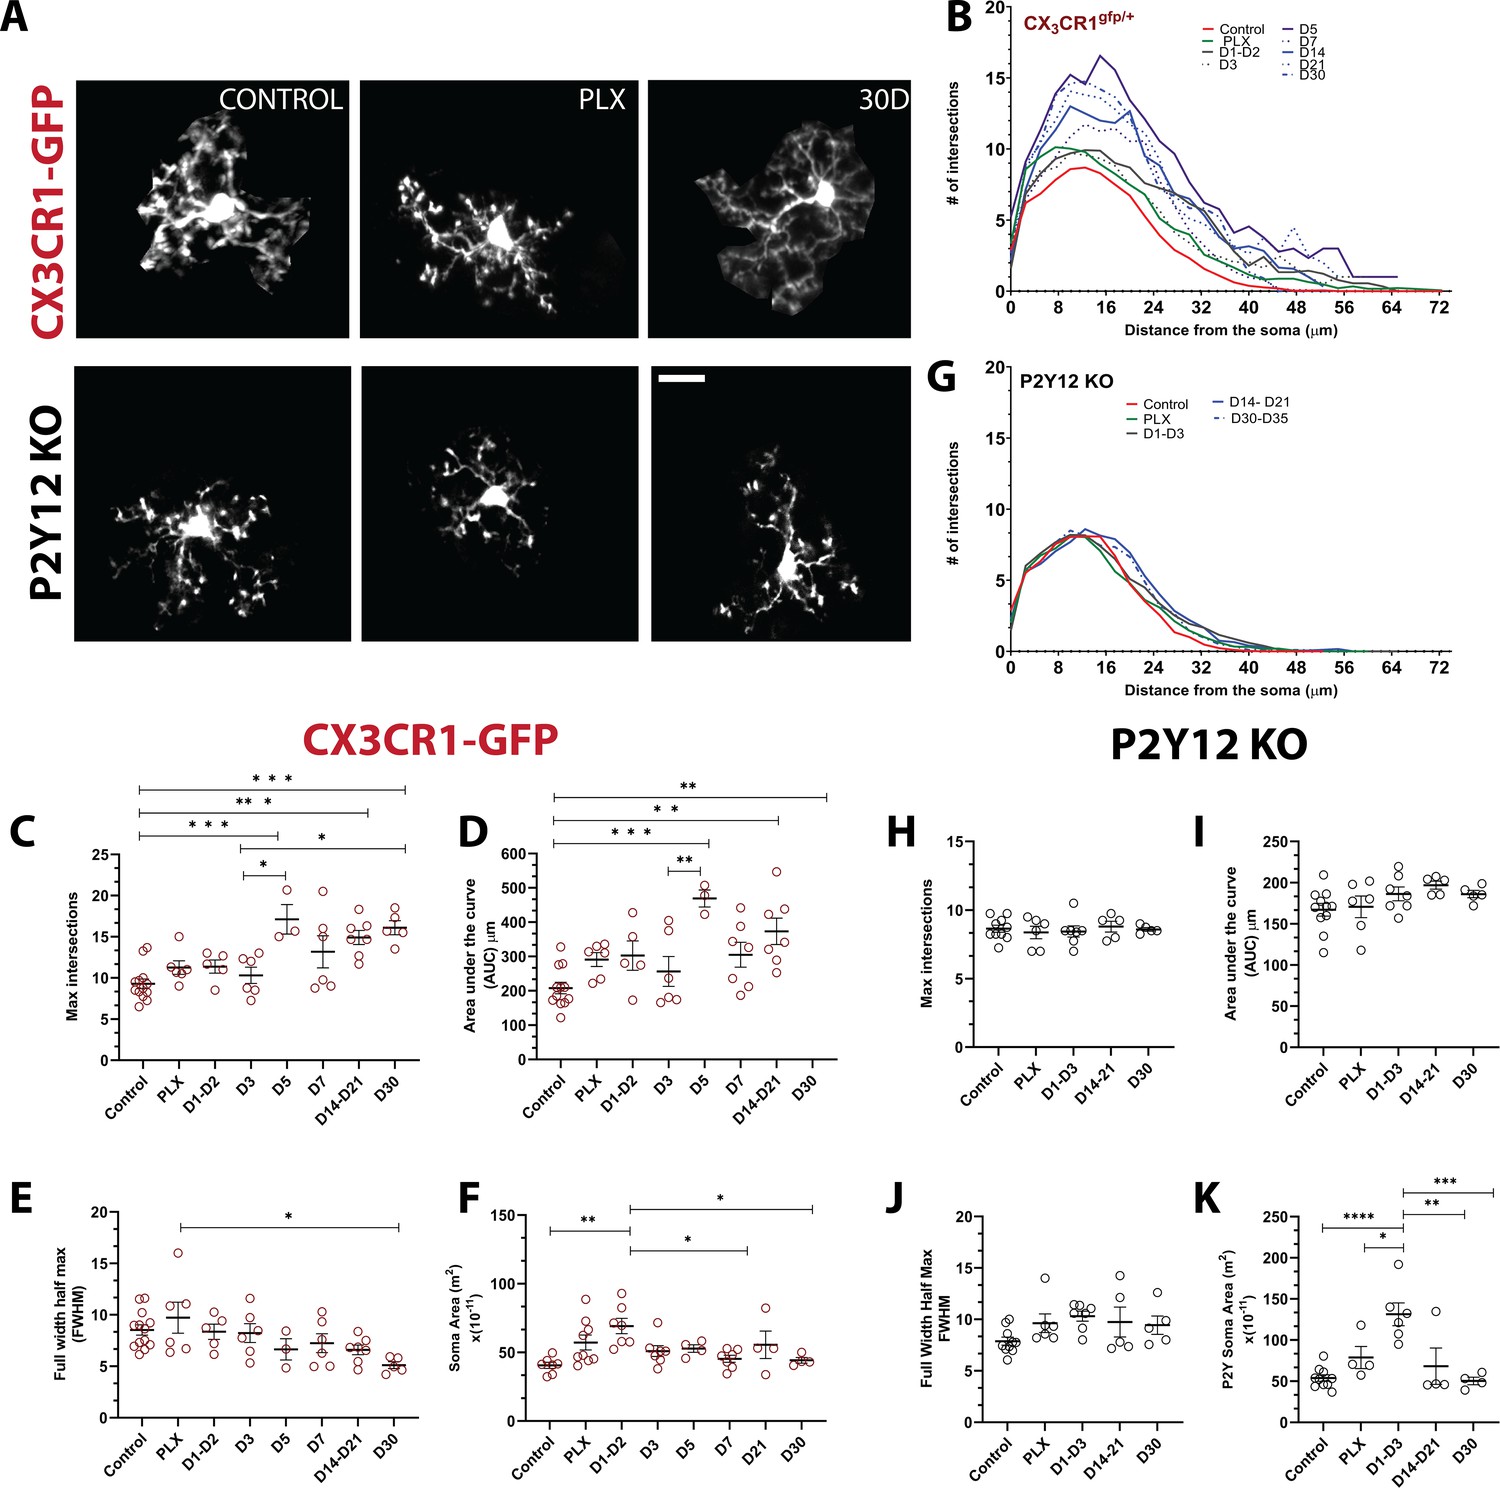
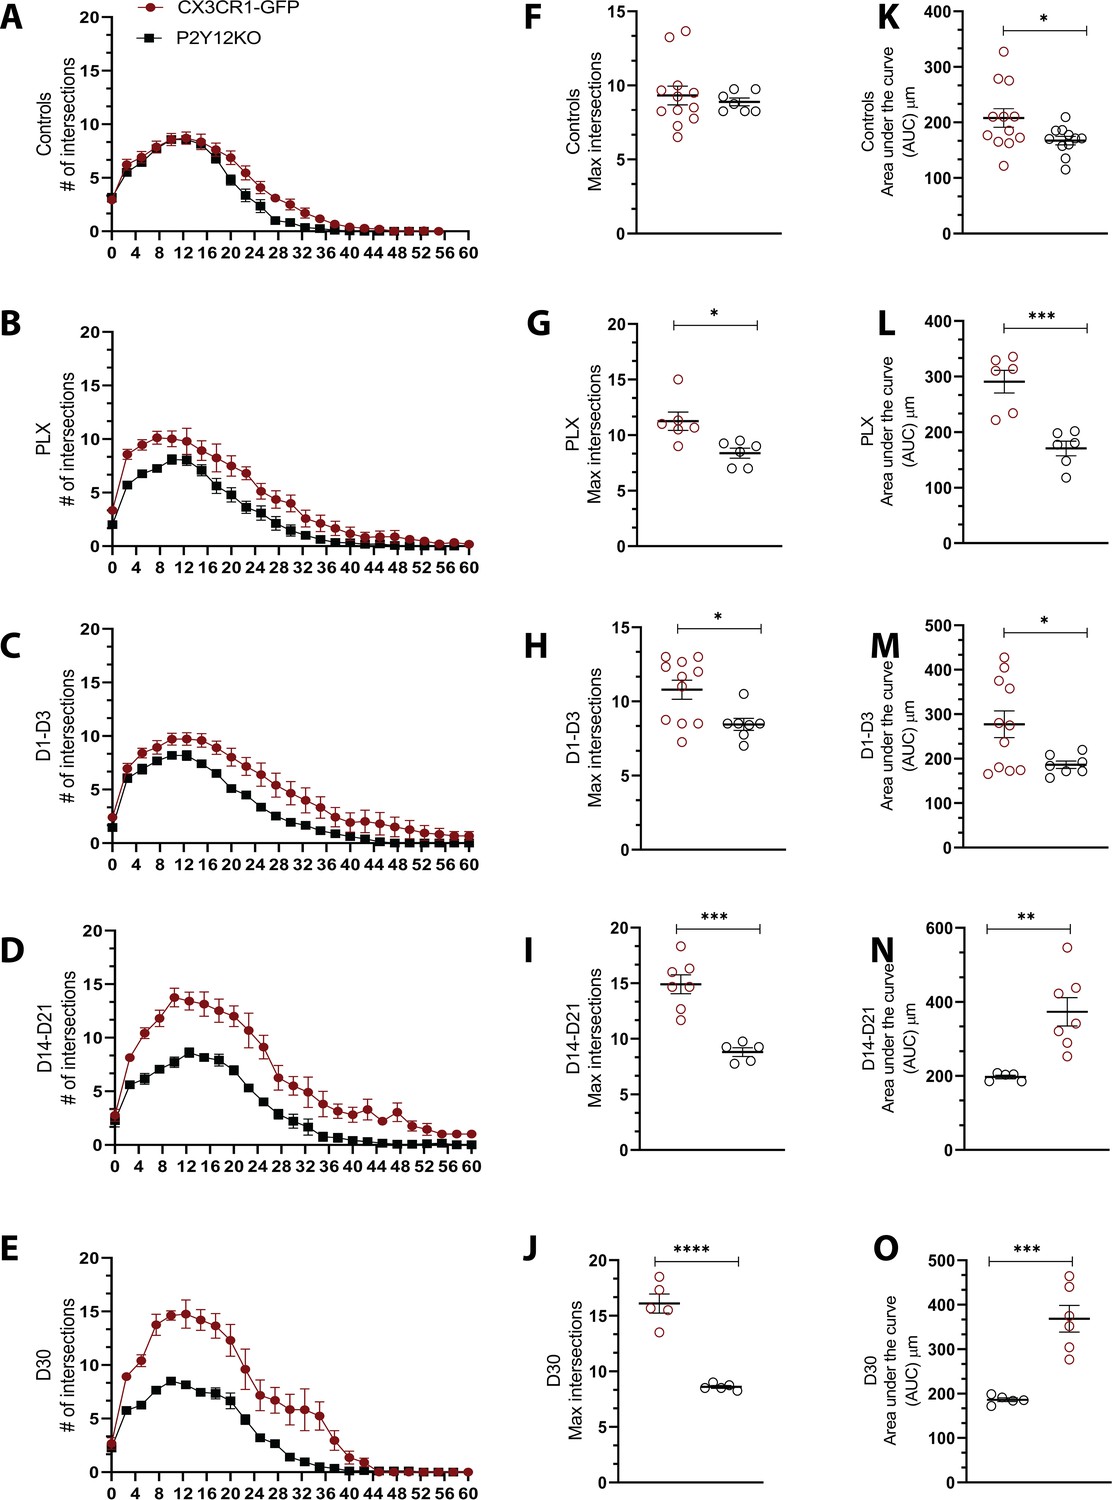
Newly born microglia remain in a hyperramified state after repopulation.
(A) Individual microglia imaged in CX3CR1-GFP and P2Y12-KO mice during control, depletion (7 days of PLX), and repopulation (7 and 30 days). (B) Sholl profiles summarizing the morphology of microglia during depletion and repopulation. (C) Microglia have an increased number of maximum intersections in the later time points of repopulation; note the increased arborization after day 5 (d) Microglia have a greater AUC (Area under the curve) in the later stages of repopulation. (E) The full width half max measurement showed a change between the PLX and the later stages of repopulation (D30) n=3–13 animals per group, 2–4 microglia per mouse, (*p<0.05, **p<0.01, ***p<0.001, One-way ANOVA, Dunnett post-hoc test). (F) Microglia demonstrated a greater soma area during the early stages for repopulation n=4–9 animals per group, n=3–6 microglia per mouse, (*p<0.05, **p<0.01, One-way ANOVA, Dunnett post-hoc test). (G) Sholl profiles for P2Y12-KO mice during depletion and repopulation. There was no significant difference in the maximum intersections (H), area under the curve (I) and Full width half max (J) of the Sholl curves in the absence of P2Y12 (n=4–11 microglia per mouse, ns, One-way ANOVA, Dunnett post-hoc test). (K) Microglia demonstrated a greater soma area during the early stages for repopulation n=4–9 animals per group, n=3–6 microglia per mouse, (*p<0.05, **p<0.01, ***p<0.001, ****p<0.0001, One-way ANOVA, Dunnett post-hoc test). Graphs show mean ± s.e.m. Points represent individual animals. Red circles (C–F) represent CX3CR1-GFP animals while black circles (H–K) represent P2Y12-KO animals. Scale bar, 20 μm. Figure 6—source data 1: Source data for the morphology and soma area of Newly-born microglia.
-
Figure 6—source data 1
Source data for the morphology and soma area of newly born microglia.
- https://cdn.elifesciences.org/articles/61173/elife-61173-fig6-data1-v2.xlsx
Figure 6—figure supplement 1
Comparison of microglial morphology over the course of repopulation in the presence and absence of P2Y12.
(A–E) Average Sholl profiles of CX3CR1-GFP (red) and P2Y12-KO (black) animals for each imaging time point. (F–J) Quantification of the maximum intersections of the Sholl profiles showing that microglia in the absence of P2Y12 are less complex at baseline and take on a more hyperramified phenotype as compared to CX3CR1-GFP during repopulation. (K–O) The area under the curve also decreased as compared to CX3CR1-GFP mice during repopulation (control day, PLX, 1–2 days, 14–21 days, and 30 days repopulation). n=4–13 mice per group, 2–5 microglia per mouse, One-way ANOVA, Dunnett post-hoc test, *p<0.05, **p<0.01, ***p<0.001, ***p<0.0001. Graphs show mean ± s.e.m. Points represent individual animals.
Figure 7 with 5 supplements
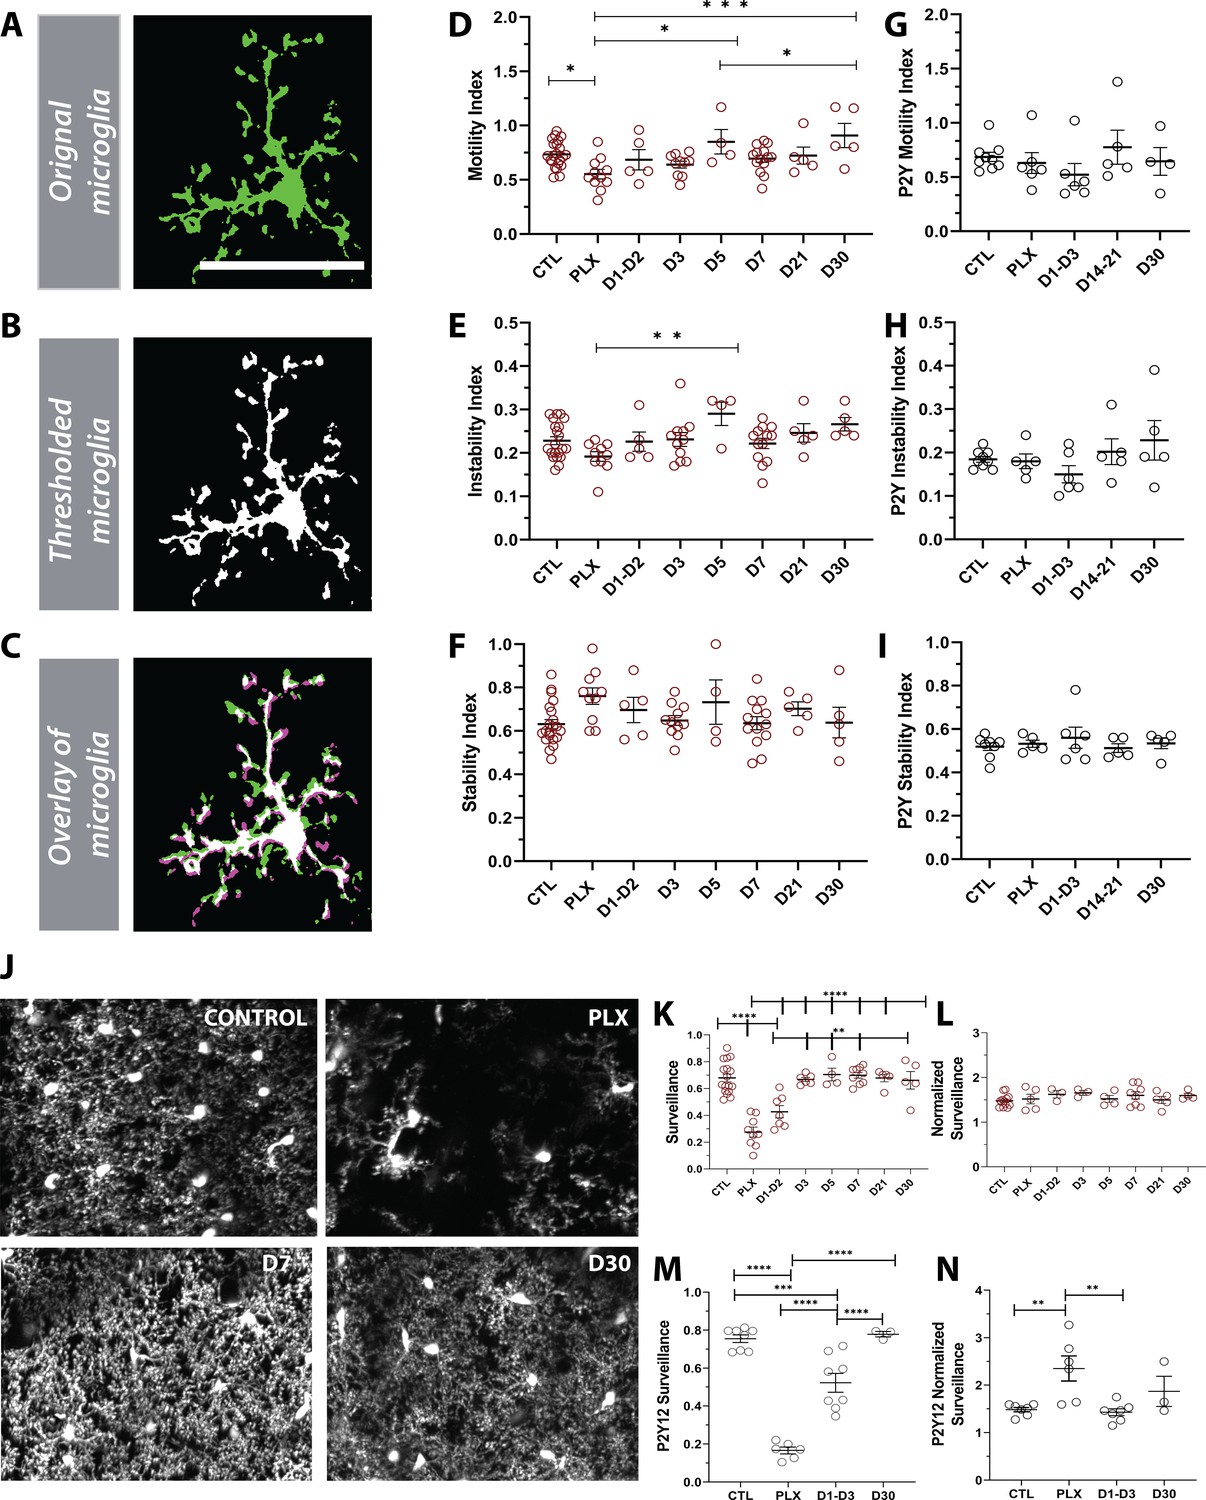
Newly born microglia are dynamic and survey the brain.
(A) Example of motility analysis showing the original microglia image, (B) Thresholded microglia (C) and a visual representation of microglial motility whereby thresholded imaged from two time points are combined with magenta representing retraction, green representing extension and white representing stable pixels. (D) Quantification of the motility index which compared the gain and loss of pixels across 5 min intervals. Microglia motility was decreased during depletion but recovered quickly with repopulation. (E) A similar trend toward decreases during depletion was observed in the instability index which was calculated as the proportion of stable pixels that retracted over the total stable pixels in the first time point. (F) No change in the stability index (the proportion of extended pixels that became stable divided by the total extended pixels in the first overlay) was observed (n=4–17 animals per group, *p<0.05, **p<0.01, ***p<0.001, One-way ANOVA, Dunnett post-hoc test). (G–I) There was no significant change in motility (G), instability (H) and stability (I) indices in the absence of P2Y12 (n=4–9 animals per group, ns, One-way ANOVA, Dunnett post-hoc test). (J) Maximum projection of microglial processes over the hour imaging session to observe surveillance (control, 7 days of PLX, 7 days of repopulation and 30 days of repopulation). (K) Microglial surveillance of the parenchyma dropped as microglia were depleted from the brain but recovered quickly during repopulation as soon as microglial numbers reached control levels (1 day −3 day). (L) Graph of surveillance normalized to the extent of microglial coverage in the first time point (n=4–17 animals per group, **p<0.01, ***p<0.001, ****p<0.0001 One-way ANOVA, Dunnett post-hoc test). (M) Microglial surveillance of the parenchyma dropped as microglia were depleted from the brain in the absence of P2Y12 but recovered quickly as shown in the CX3CR1 controls in (L). (N) Graph of surveillance normalized to the extent of microglial coverage in the first time point in the absence of P2Y12 (n=3–6 animals per group, **p<0.01, ***p<0.001, ****p<0.0001, One-way ANOVA, Dunnett post-hoc test). Graphs show mean ± s.e.m. Points represent individual animals. Scale bar, 50 µm. Figure 7—source data 1: Source data for Newly born microglia motility, surveillance during depletion and repopulation.
-
Figure 7—source data 1
Source data for newly born microglia motility, surveillance during depletion and repopulation.
- https://cdn.elifesciences.org/articles/61173/elife-61173-fig7-data1-v2.xlsx
Figure 7—figure supplement 1
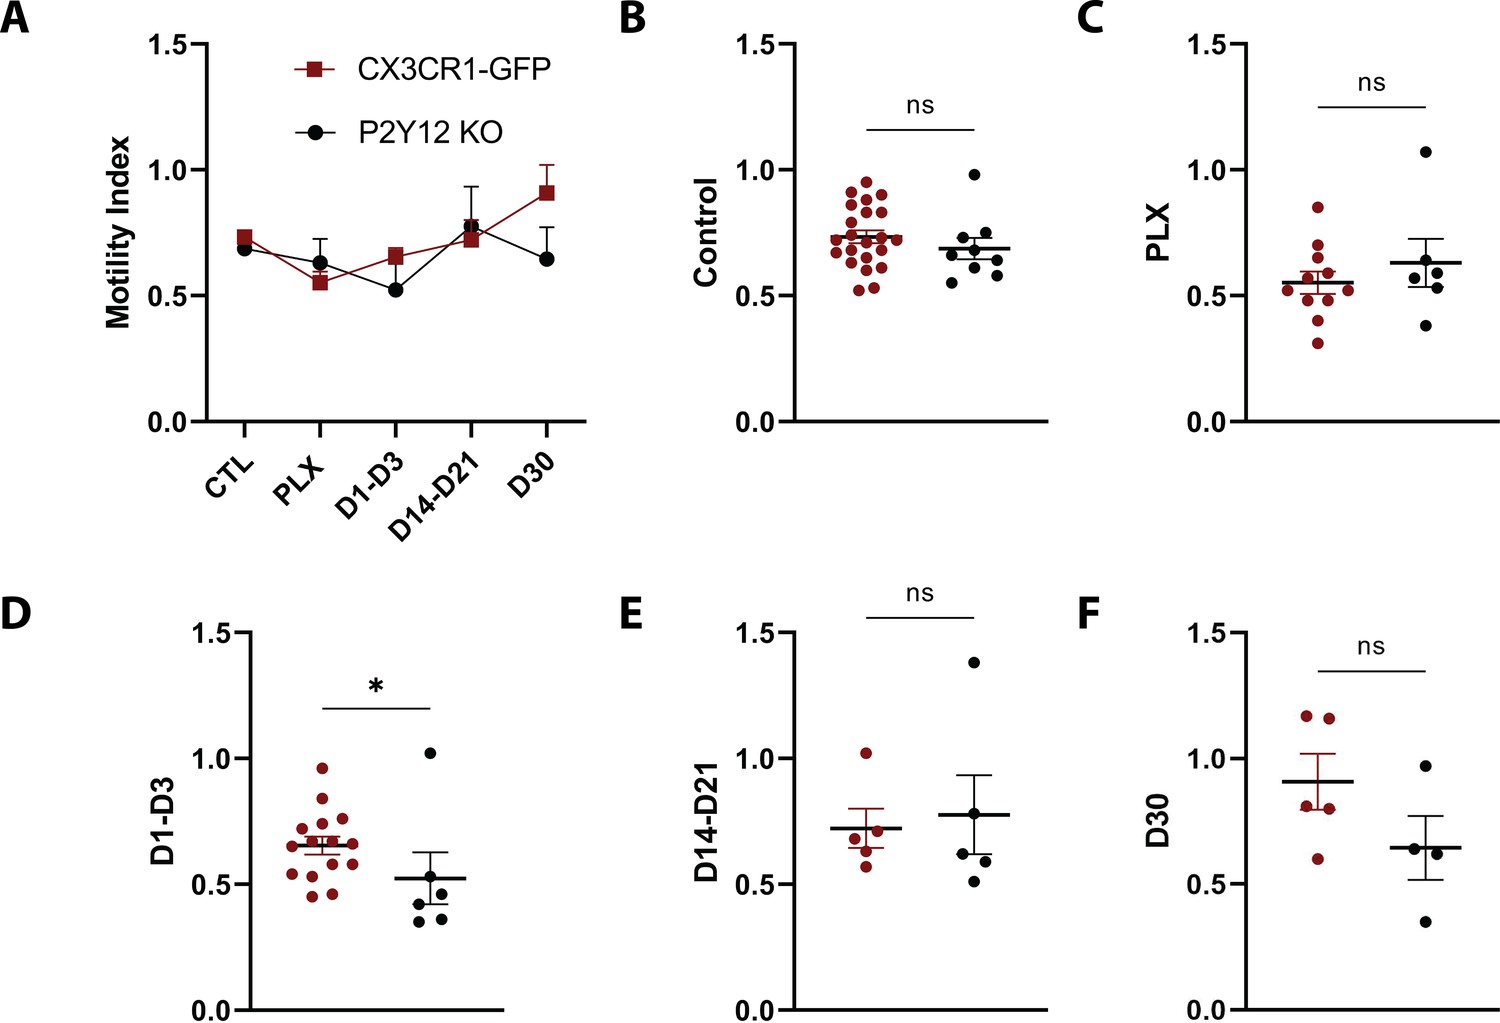
Comparison of motility over the course of repopulation in the presence and absence of P2Y12.
(A) The motility index for both CX3Cr1GFP/+ (red) and P2Y12KO (black) animals. (B–F) While there was a slight reduction in motility in P2Y12KO animals in the early stages of repopulation (D1–D3), motility was largely comparable in the two genotypes. n=4–13 mice per group, 2–5 microglia per mouse, T-test, *p<0.05. Graphs show mean ± s.e.m. Points represent individual animals.
Figure 7—figure supplement 2
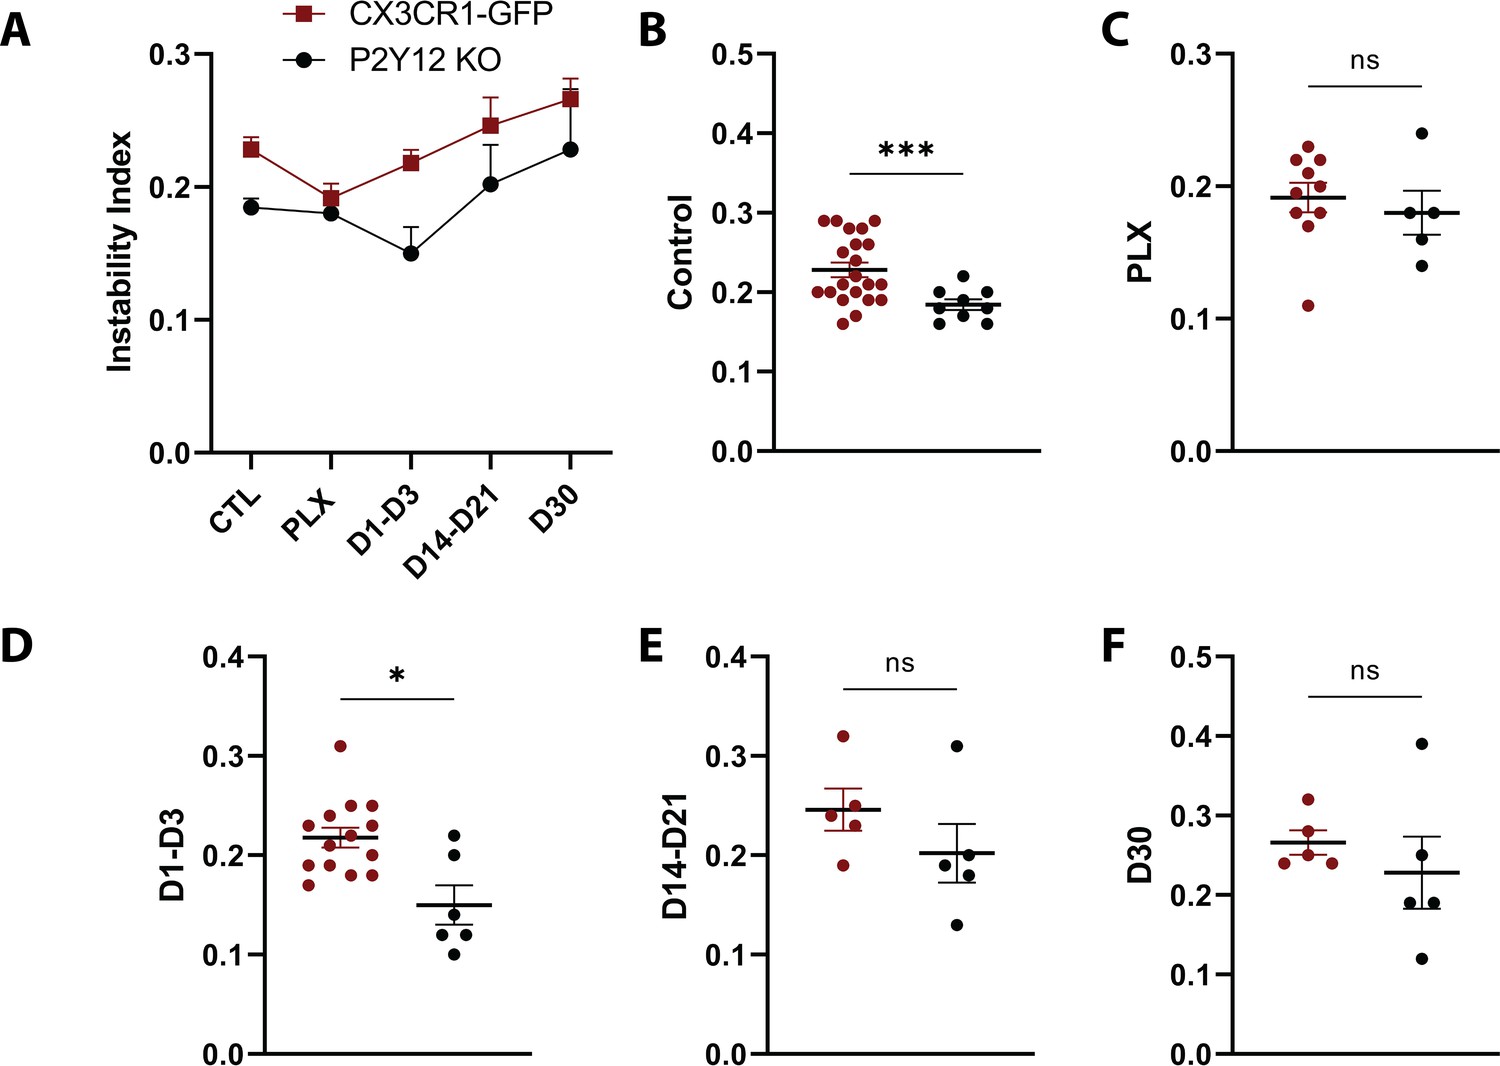
Comparison of changes in the instability index over the course of repopulation in the presence and absence of P2Y12.
The instability index is the proportion of stable pixels that retracted over the total stable pixels in the first time point. (A) The instability index in both CX3CR1-GFP (red) and P2Y12-KO (black) animals. (B-F) A significant decrease in the instability index was observed at control time points and in the early stages of repopulation. n=4–13 mice per group, 2–5 microglia per mouse, T-test, *p<0.05, ***p<0.001. Graphs show mean ± s.e.m. Points represent individual animals.
Figure 7—figure supplement 3
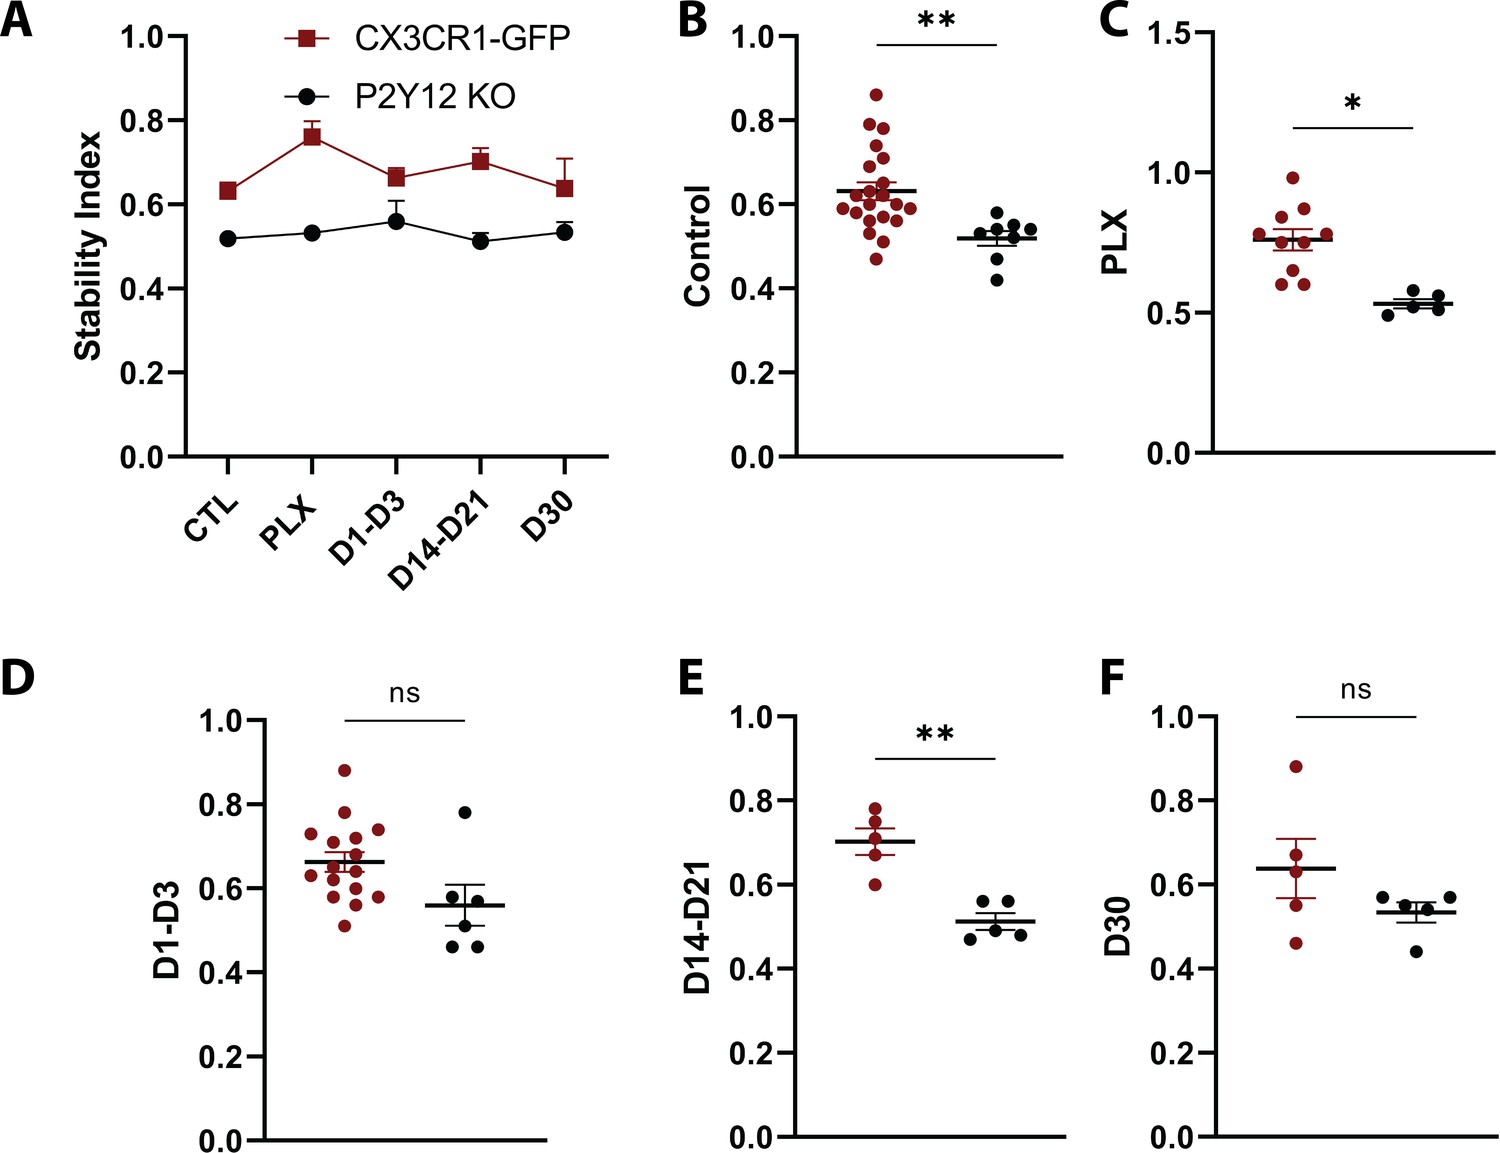
Comparison of the stability index over the course of repopulation in the presence and absence of P2Y12.
(A). The stability index (the proportion of extended pixels that became stable divided by the total extended pixels in the first overlay) was compared between the two genotypes. (B–F) P2Y12 KO mice generally had a lower stability index than CX3Cr1 GFP/+ animals throughout the course of the experiment. n=4–13 mice per group, 2–5 microglia per mouse, T-test, *p<0.05, **p<0.01. Graphs show mean ± s.e.m. Points represent individual animals.
Figure 7—figure supplement 4
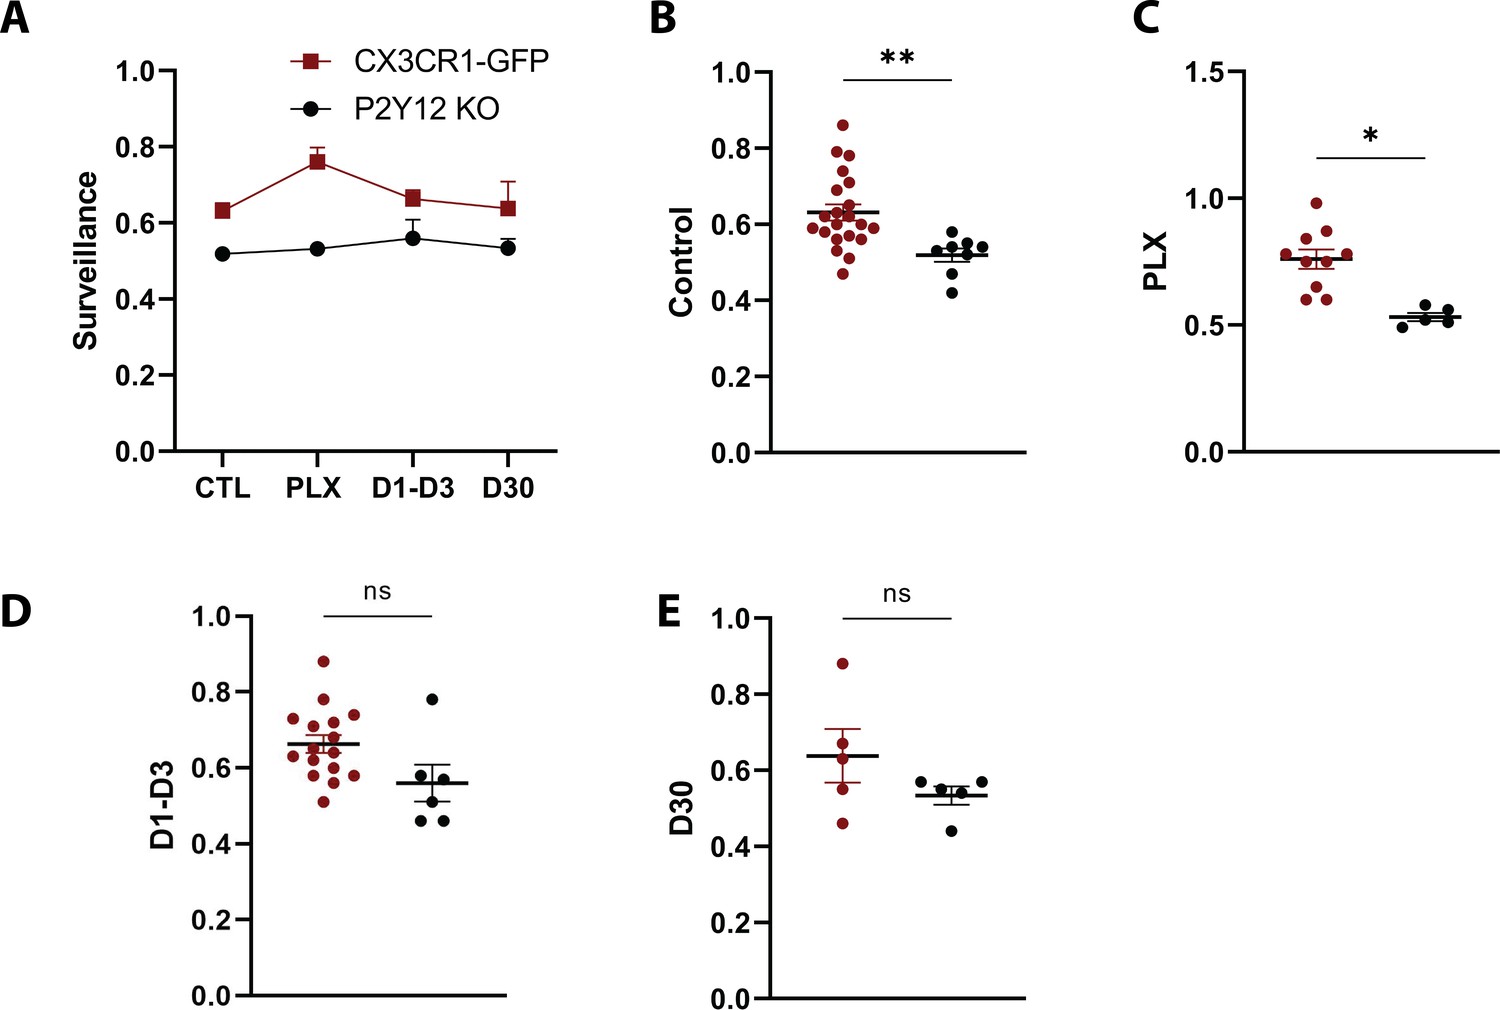
Comparison of Surveillance in the presence and absence of P2Y12.
(A) Microglial surveillance of the parenchyma compared between CX3CR1-GFP (red) and P2Y12-KO (black) animals for each imaging time point. (B–F) P2Y12 KO animals showed smaller surveillance at the control and PLX time points. n=5–13 mice per group, 2–5 microglia per mouse, T-test, *p<0.05, **p<0.01. Graphs show mean ± s.e.m. Points represent individual animals.
Figure 7—figure supplement 5
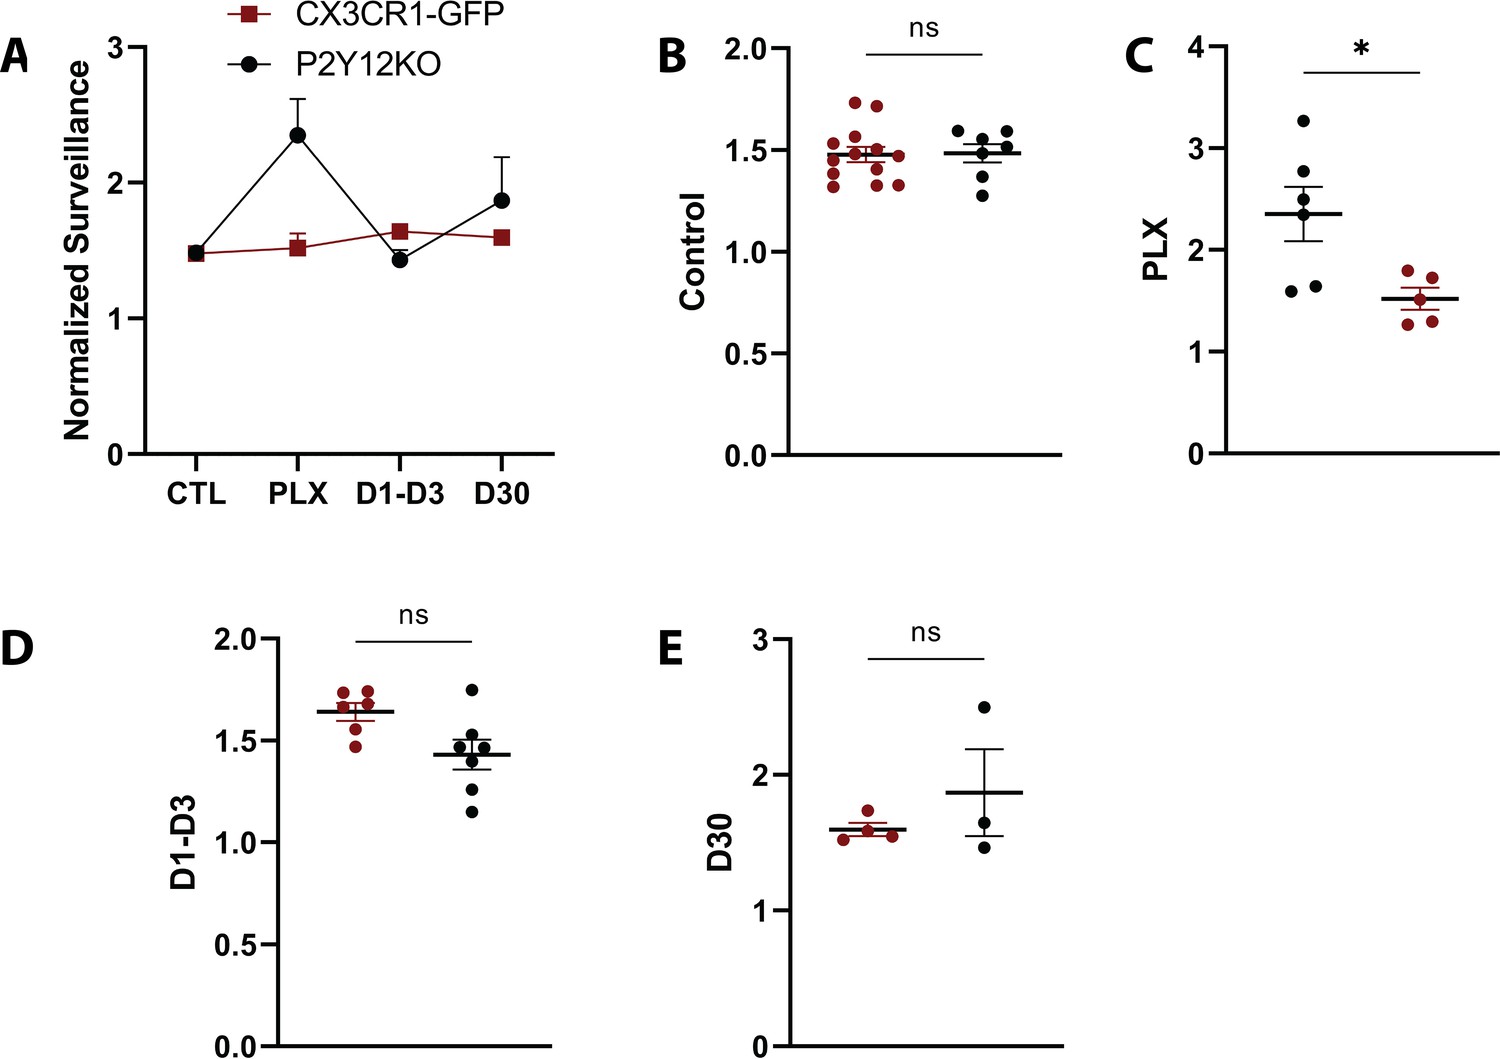
Comparison of normalized surveillance in the presence and absence of P2Y12.
(A) Graph of surveillance normalized to the extent of microglial coverage in the first time point compared between CX3CR1-GFP (red) and P2Y12-KO (black) animals for each imaging time point. (B–F) While normalized surveillance was decreased during PLX treatment in the P2Y12 KO animals, it was otherwise comparable across time point. n=5–13 mice per group, 2–5 microglia per mouse, T-test, *p<0.05, **p<0.01. Graphs show mean ± s.e.m. Points represent individual animals.
Figure 8
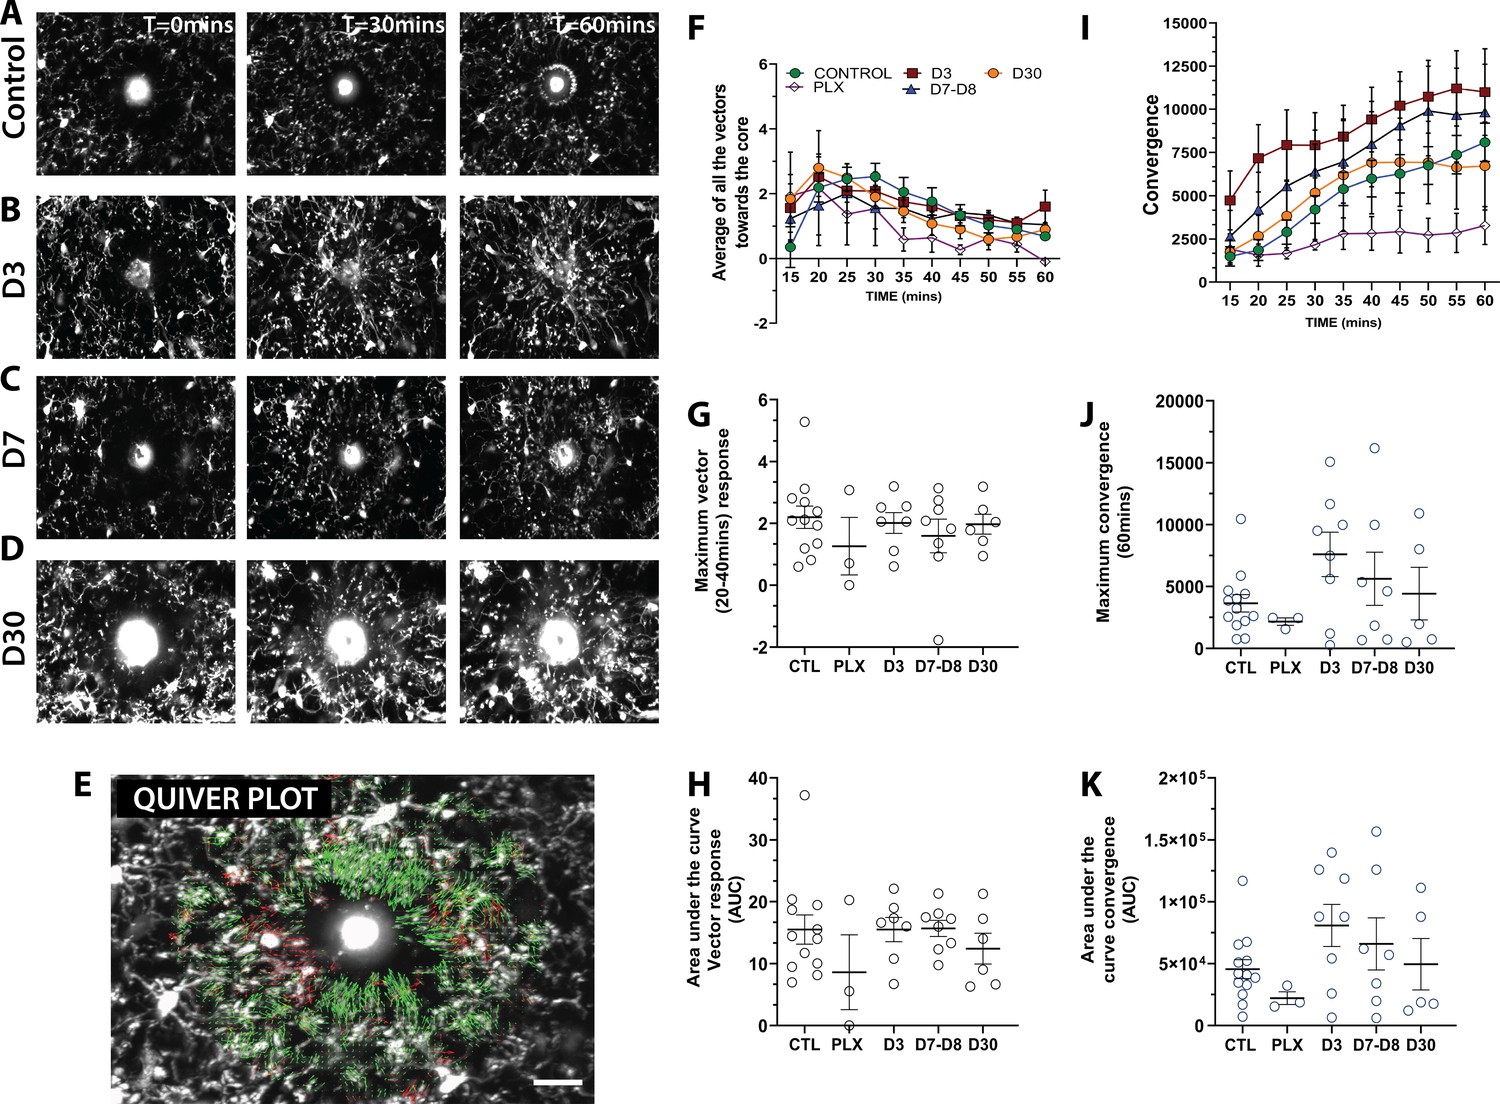
Newly born microglia respond robustly to acute laser ablation injury.
Example microglial response to focal laser ablation at t=0 min, t=30min and t=55 min after ablation for control (A), 3 days of repopulation (B), 7 days of repopulation (C), and 30 days of repopulation (D). (E) Quiver plot of microglial response. Green arrows correspond to vectors moving towards the core and red arrows correspond to vectors moving away from the core. (F) Graph showing the average vectors moving towards the core following focal laser ablation injury. (G-H; black circles – vector analysis) There were no statistically significant differences observed in the maximum directional response, or the integrated area under the curve over time. The dynamics of the convergence of microglial processes on the injury core n=12 (control), n=3 (PLX), n=8 (7–8 days), n=6 (30 days). (I) Graph showing the convergence towards to core following focal laser ablation injury. (J-K) There was no significant difference in the maximum convergence at 60 min, or the convergence response when assayed using the area under curve of the convergence graphs over time (blue circles – convergence analysis). n=3–12 animals per group, One-way ANOVA, Dunnett post hoc test. Graphs show mean ± s.e.m; ns. Points represent individual animals. Scale bar, 20 µm. Figure 8—source data 1: Source data for newly-born microglia response to acute laser ablation injury.
-
Figure 8—source data 1
Source data for newly-born microglia response to acute laser ablation injury.
- https://cdn.elifesciences.org/articles/61173/elife-61173-fig8-data1-v2.xlsx
Videos
Video 1
Example in vivo two-photon imaging in awake adult mice.
Two-photon in vivo images were obtained in CX3CR1-GFP awake mice following three consecutive days of training and habituation to the setup with a 1.5x zoom. This video shows a 100-slice z-stack starting at the pial surface and going deeper into the brain in a control awake animal. Microglia are evenly spaced and maintain this organization over many imaging sessions under control conditions. (Microglia are green). Scale bar, 50 µm.
Video 2
Example in vivo two-photon imaging in awake adult mice during depletion and repopulation.
Two-photon in vivo images were obtained in CX3CR1-GFP awake mice following three consecutive days of training and habituation to the setup with a 1.5x zoom. This video shows a 100-slice z-stack in the same region during depletion (2D, 4D, 6D, and 7D PLX) and repopulation (D1-D7, D14, D21, and D30). Scale bar, 50 µm.
Video 3
Example in vivo laser ablation video during depletion and repopulation.
Imaging was done in CX3CR1-GFP awake with a 1.5x zoom. Here, we compared a laser ablation during control condition, depletion (PLX), and repopulation (D7) and D30. Microglia responded rapidly during these two conditions. 48 slices total, 12 slices per group. Scale bar, 20 µm.
Tables
Key resources table
| Reagent type (species) or resource | Designation | Source or reference | Identifiers | Additional information |
|---|---|---|---|---|
| Strain, strain background | CX3CR1-GFP, C57/Bl6 background (Mouse) | JAX | RRID:IMSR_JAX:005582 Jax stock #005582 | B6.129P2(Cg)-Cx3cr1tm1Litt/J Male and Females used in our study |
| Strain, strain background | P2Y12 KO, C57/Bl6 background (Mouse) | Courtesy of Maiken Nedergaard lab via a Materials transfer agreement | Mice were generated by the Conley lab doi:10.1172/JCI17864. Male and Females used in our study | |
| Chemical compound, drug | PLX5622 drug | Research Diets, New Jersey, USA | AIN76A-D1001i | PLX5622 drug from Plexxikon Inc, Berkeley, CA, USA |
| Chemical compound, drug | Fentanyl (0.05 mg/kg) | University of Rochester Medical Center Pharmacy | ||
| Chemical compound, drug | Midazolam (5.0 mg/kg) | University of Rochester Medical Center Pharmacy | ||
| Chemical compound, drug | Dexmedetomidine (0.5 mg/kg) | University of Rochester Medical Center Pharmacy | ||
| Other | 3 mm Biopsy punch | Integra, Plainsboro, NJ, USA | Cat#: 33–32 | |
| Other | 0.5 mm drill bit | FST, Foster City, CA | Cat#: 19007–05 | |
| Other | UV Glue | Norland Optical Adhesive, Norland Inc, Cranbury, NJ, USA | Cat#: NOA 61 | |
| Other | Loctite 404 Glue | Henkel Corp, Bridgewater, NJ, USA | Cat#: A-A-309 | |
| Other | Headplate | Emachine shop | Design courtesy of Mriganka Sur | |
| Other | C and B Metabond Dental Cement | Parkell Inc Brentwood, NY, USA | SKU #: S380 | |
| Other | Ti: Sapphire | Mai-Tai Spectraphysics Olympics, Center Valley, PA | Custom built two photon microscope | |
| Antibody | Anti-Iba-1 (Rabbit polyclonal) | Wako | RRID:AB_839504 Cat # 019–19741 | IF(1:1000) |
| Antibody | Anti-GFAP Glial Fibrillary Acidic Protein (Mouse monoclonal) | Sigma | RRID:AB_477010 Cat# G3893 | IF(1:500) |
| Antibody | Anti-Galectin3 (Goat polcylonal) | R and D systems | RRID:AB_2234687 Cat# AF1197 | IF(1:1500) |
| Antibody | AlexaFlour 488 (Donkey Anti-Rabbit) | Invitrogen | RRID:AB_2762833 Cat# A32790 | IF(1:500) |
| Antibody | AlexaFlour 594 (Donkey Anti-Mouse) | Invitrogen | RRID:AB_2762826 Cat# A32744 | IF(1:500) |
| Antibody | AlexaFlour 594 (Donkey Anti-Goat) | Invitrogen | RRID:AB_2762828 Cat# A32758 | IF(1:1000) |
| Commercial assay or kit | MILLIPLEX MAP Mouse TH17 Magnetic Bead Panel (Mouse) | Millipore, Sigma | MTH17MAG-47K | |
| MATLAB | MATLAB and Statistics Toolbox Release 2012b, The MathWorks, Inc, Natick, | Massachusetts, United States | RRID:SCR_001622 | |
| GraphPad Prism | GraphPad Software, https://www.graphpad.com’. | San Diego, California USA, | RRID:SCR_002798 | |
| R | R Project for Statistical Computing | RRID:SCR_001905 |
Additional files
Download links
A two-part list of links to download the article, or parts of the article, in various formats.
Downloads (link to download the article as PDF)
Open citations (links to open the citations from this article in various online reference manager services)
Cite this article (links to download the citations from this article in formats compatible with various reference manager tools)
The role of P2Y12 in the kinetics of microglial self-renewal and maturation in the adult visual cortex in vivo
eLife 10:e61173.
https://doi.org/10.7554/eLife.61173


