Visual mode switching learned through repeated adaptation to color
- Department of Psychology, University of Minnesota, United States
Figures
Figure 1
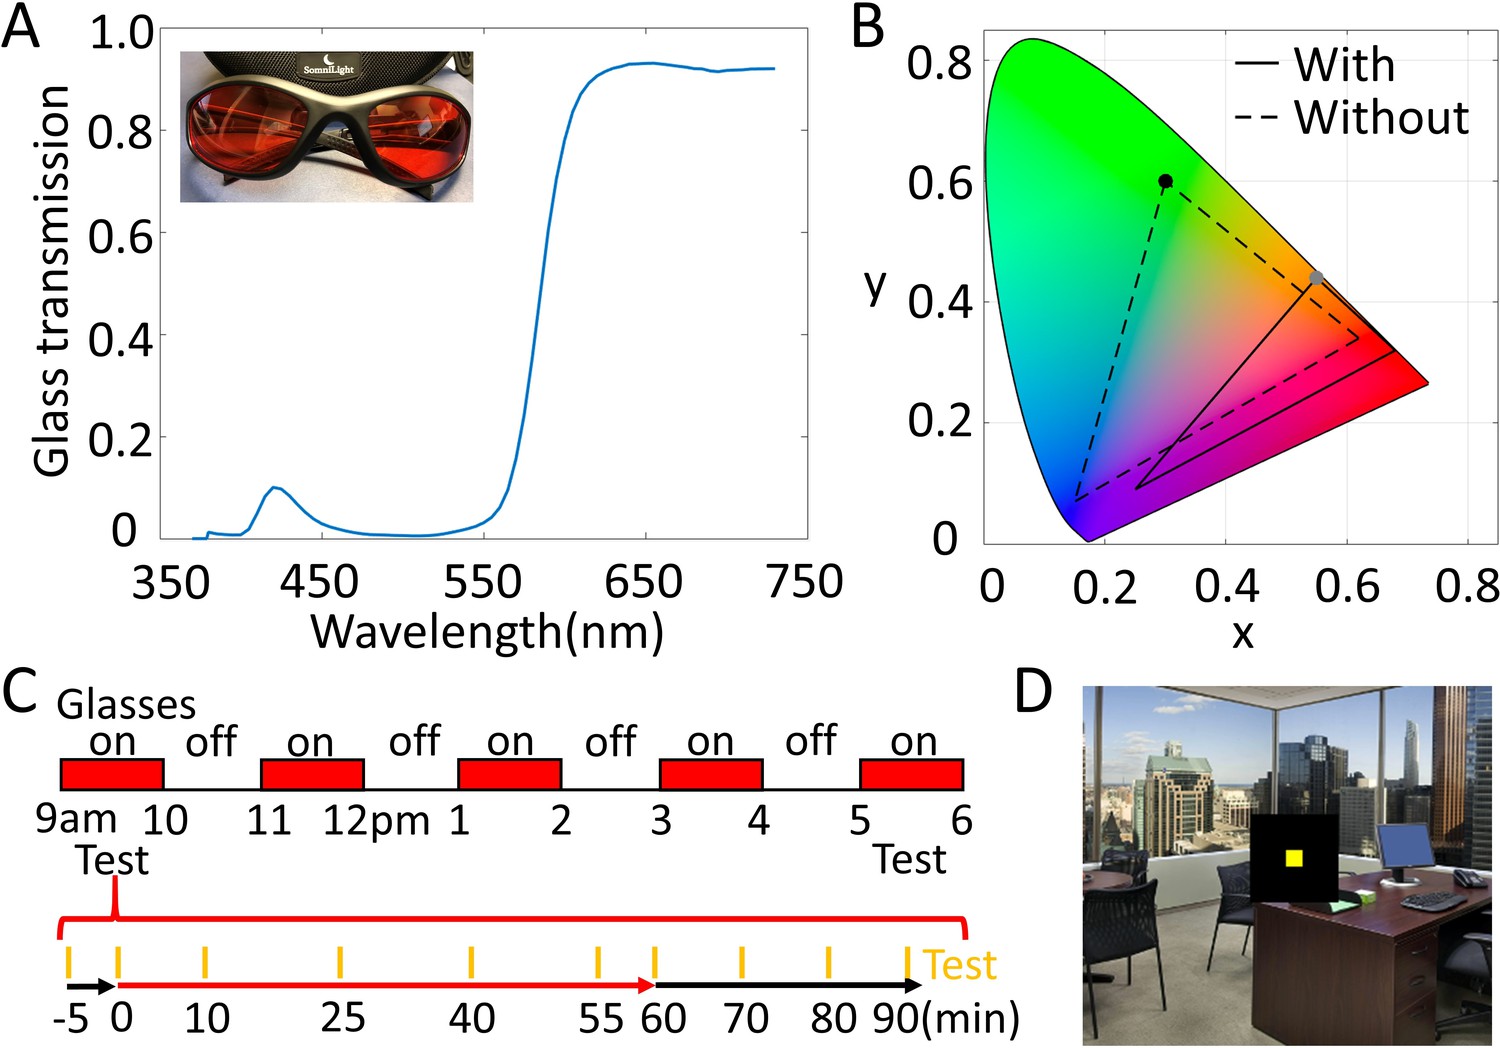
Glasses' characteristics and experimental procedures.
(A) The red glasses used in this study and their transmission spectrum. The glasses filter out most of the energy at short wavelengths and maintain most of the energy at long wavelengths. (B) Monitor gamut through (solid line) and without (dashed line) the glasses plotted in CIE color space. The glasses compress the gamut and shift it toward red chromaticity. For example, the greenest light produced by the monitor (black dot) falls in an orange part of color space through the red glasses (gray dot). (C) Experimental procedures. The upper panel indicates the times when the observers wore the glasses within 1 day. Two test sessions were conducted, during the first and last 1 hr of wearing the glasses. The lower panel illustrates the test procedure in each session. Orange bars indicate the time of test: 5 min before putting on the glasses, immediately after putting on the glasses, then following 10, 25, 40, and 55 min of wearing the glasses. Observers then removed the glasses and were tested immediately, and 10, 20, and 30 min later. (D) Test display. Observers adjusted the color of a square centered on a background image of a naturalistic office environment, presented on a monitor in a fully lit room. The fixed image of the office and skyline was presented on the test display to give observers context information when making the adjustments. A black square of 5.7° separated the 0.5° square test patch from the background image. The test patch was presented for 200 ms at 1.5 s intervals, and the observer’s goal was to set it to appear unique yellow. Observers viewed the test display through a 3-foot felt-lined tunnel, on a calibrated monitor, in the fully lit lab room.
Figure 2 with 2 supplements
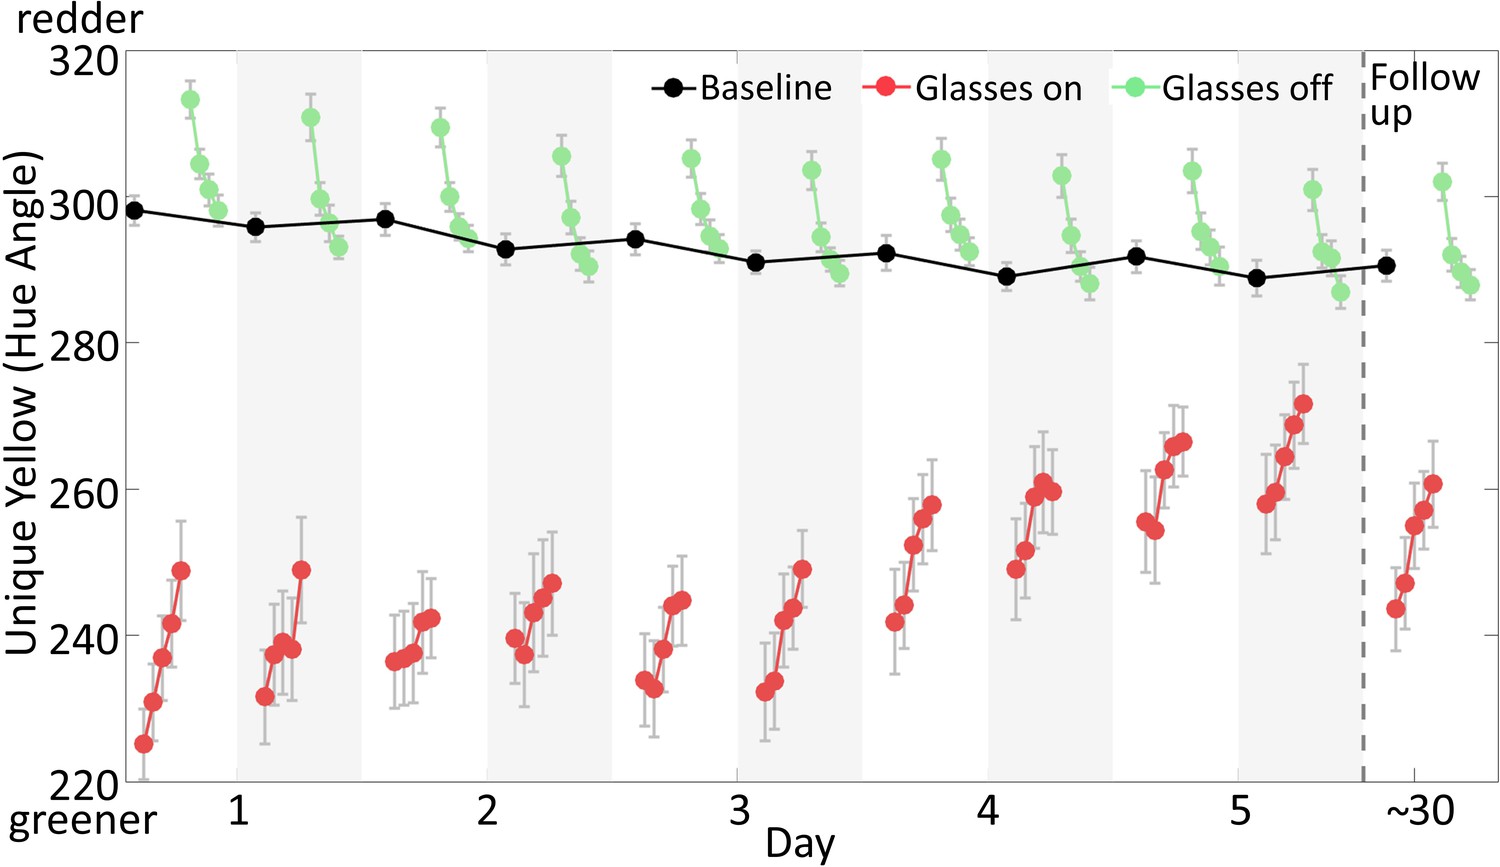
Results of the main experiment and the follow-up session.
Mean unique yellow settings represented in hue angle are plotted as a function of time for 5 days and the follow-up test. The black dots are baseline settings, made at the beginning of each test session with glasses off. The white background indicates morning sessions, and the light gray background indicates afternoon. The red dots plot settings with glasses on and the green dots are settings after removing the glasses. Successive symbols are plotted for each 5-min test (see Figure 1C). The gray bars represent standard errors of the mean, computed across participants (N = 11).
-
Figure 2—source data 1
Figure 2 data.
- https://cdn.elifesciences.org/articles/61179/elife-61179-fig2-data1-v1.xlsx
Figure 2—figure supplement 1
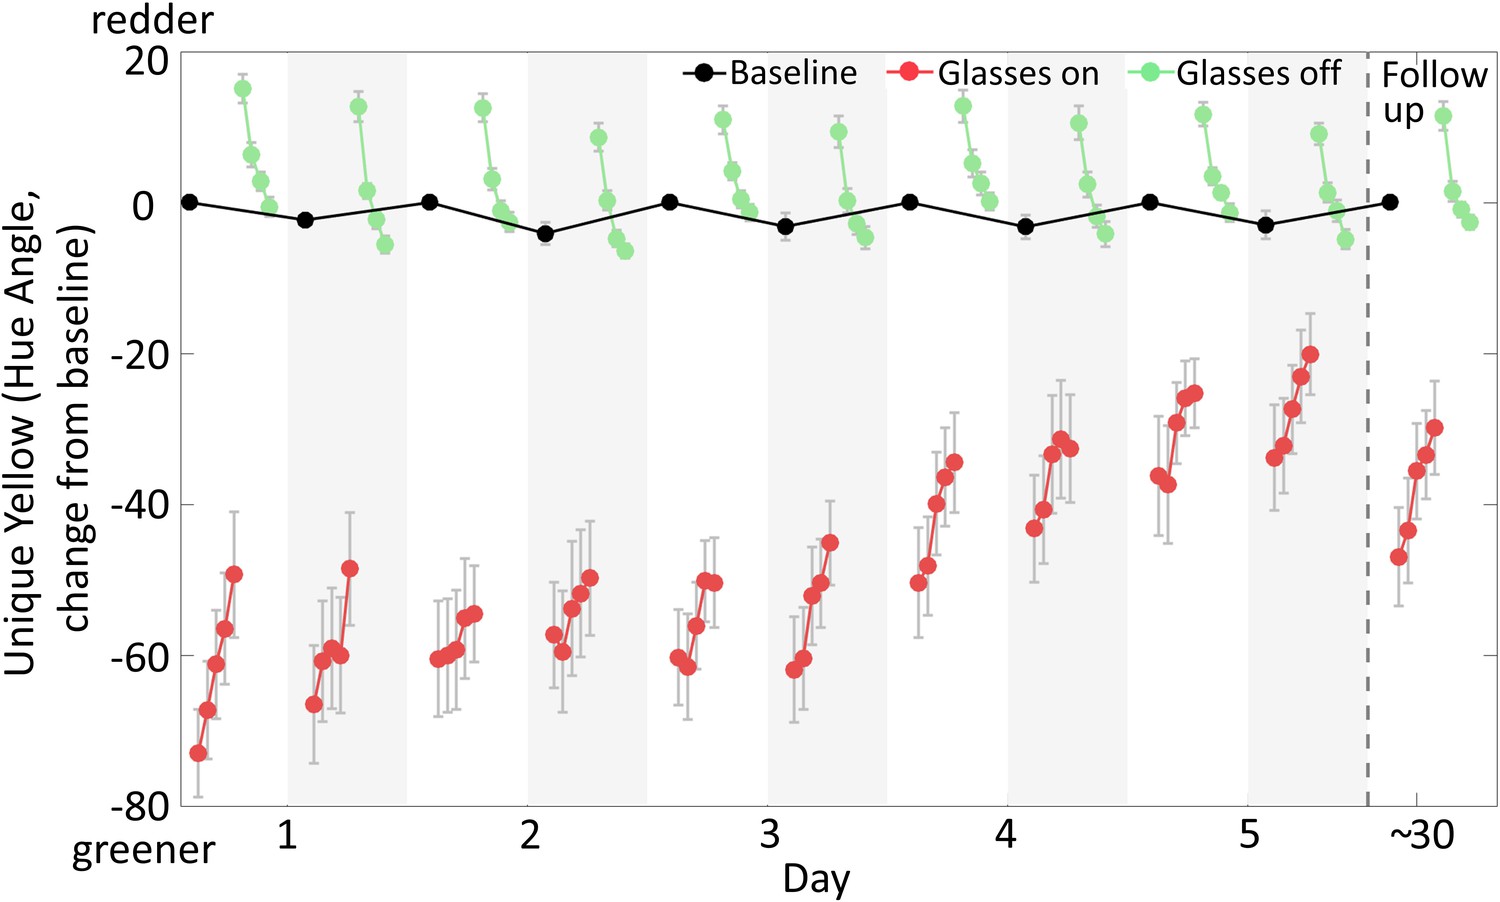
Baseline-corrected results of the main experiment and the follow-up session.
Mean unique yellow settings represented in hue angle are plotted as a function of time for 5 days and the follow-up test. Data were normalized by subtracting the baseline value for each morning test session, taken immediately before putting the glasses on in the morning. The black dots are baseline settings, made at the beginning of each test session with glasses off. The white background indicates morning sessions, and the light gray background indicates afternoon. The red dots plot settings with glasses on and the green dots are settings after removing the glasses. Successive symbols are plotted for each 5-min test. The gray bars represent standard errors of the mean, computed across participants (N = 11). These baseline-corrected results showed an identical overall pattern across days as the uncorrected data, though some effects became slightly larger.
Figure 2—figure supplement 2
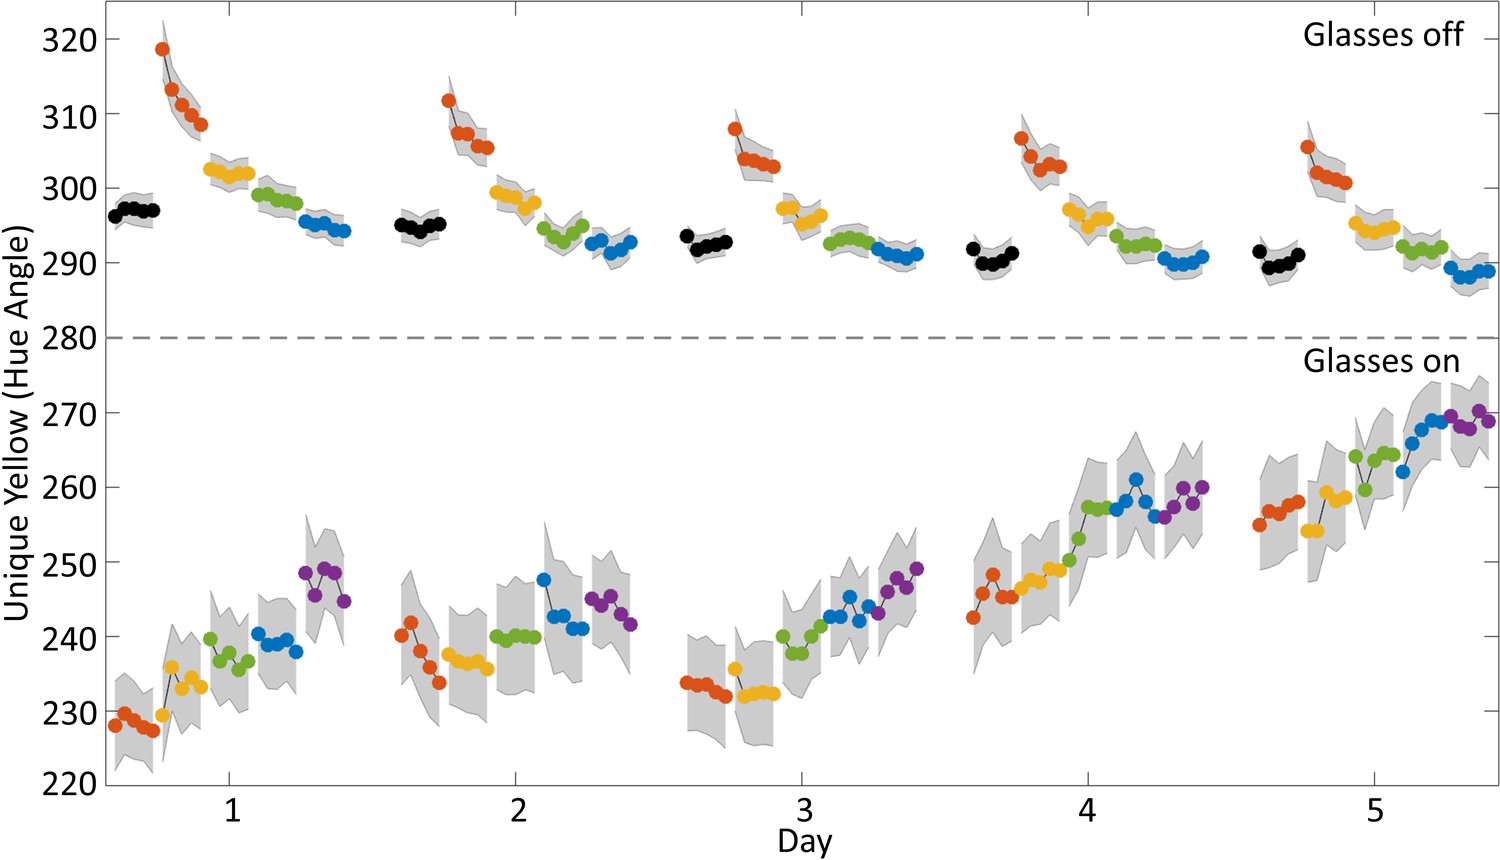
Block-by-block results.
Morning and afternoon sessions within a day were averaged. The upper section of the figure shows unique yellow settings made with the glasses off. The black dots are baseline settings made immediately before putting on the glasses. The lower section of the figure shows unique yellow settings made with glasses on. Each dot in this figure represents the mean setting of a 1-min block, and five connected dots show the five blocks of each test. The first matches from tests two to five with glasses on in each session were influenced by the transition to the test display after breaks, and so were excluded when calculating the means. This did not affect the overall pattern of the results. Note that there were different amounts of time between the tests (See Figure 1C), during which observers were viewing uncontrolled stimuli, so one cannot simply connect the lines to get accurate adaptation and deadaptation time courses.
Figure 3 with 1 supplement
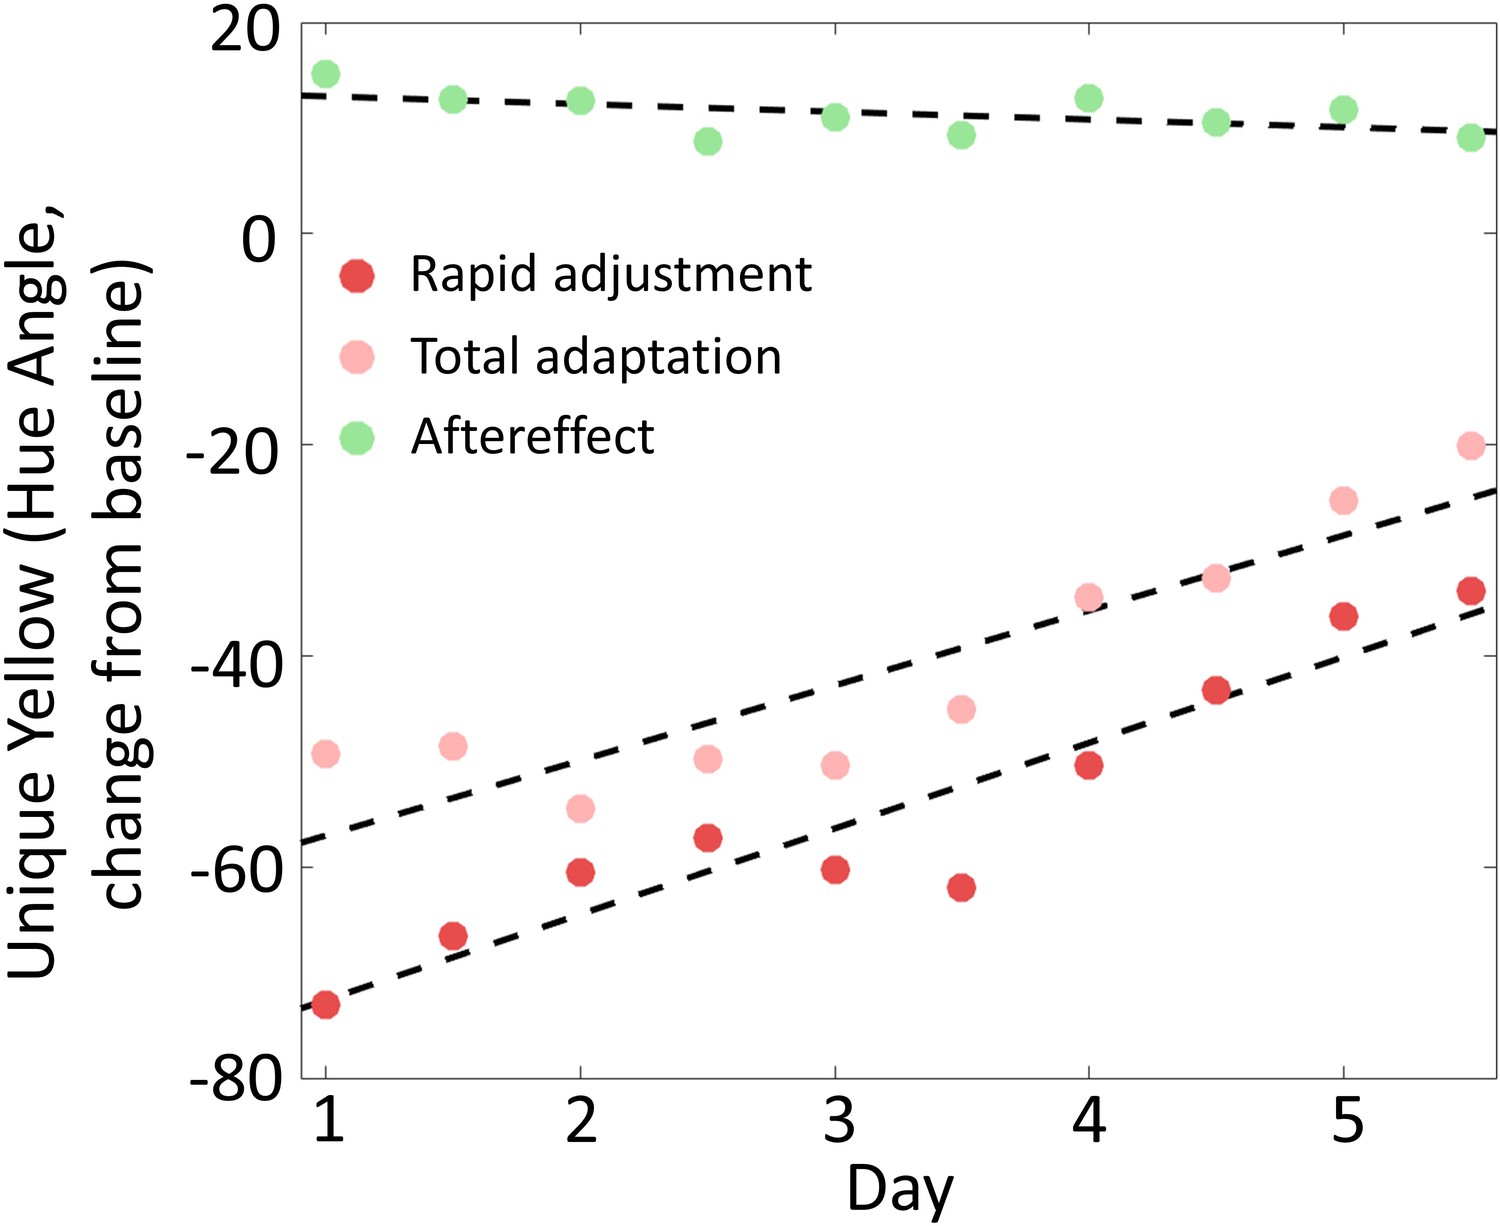
Rapid adjustment, total adaptation, and color aftereffect across 5 days.
Red dots show rapid adjustments, computed as mean settings from the first 5-min test of each session with the glasses on. Total adaptation effects, denoted by the pink dots, are mean settings from the test taken after 1hr of wearing the glasses. Green dots are mean settings of the first 5-min test after removing the glasses. Data have been corrected for possible baseline shifts by subtracting the baseline value for each morning session, taken immediately before putting the glasses on. The black dashed lines are linear fits to the rapid adjustment, total adaptation, and the aftereffect. Both rapid adjustment and total adaptation effect grew significantly over days, and there was a trend for aftereffects to decrease across day.
-
Figure 3—source data 1
Figure 3 data.
- https://cdn.elifesciences.org/articles/61179/elife-61179-fig3-data1-v1.xlsx
Figure 3—figure supplement 1

Rapid adjustment effects based upon the first match and the first block.
Red dots in the left scatter plot show rapid adjustment computed as the first match with the glasses on in each session. The black dashed line is the least-square fit; the rapid effects shifted significantly across days (p < 0.01). The red dots in the right scatter plot show rapid adjustment computed as the average of the first 1 min block of each session with the glasses on. The black dashed line is the least-square fit. The rapid effects shifted significantly across days (p < 0.001).
Figure 4
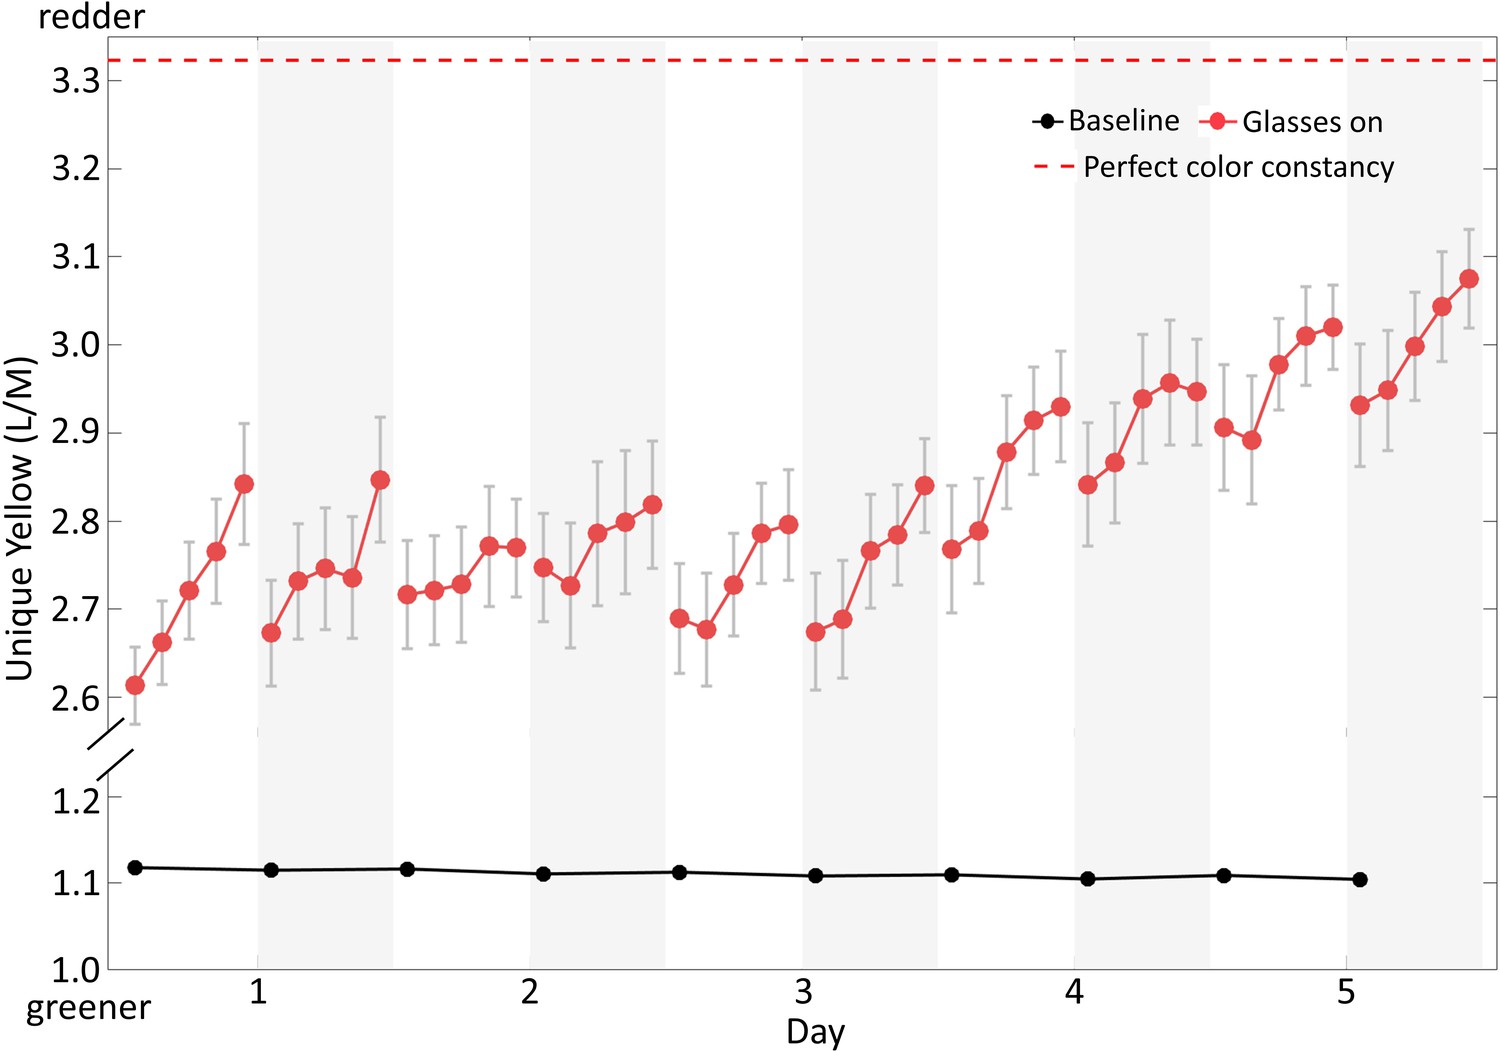
Results plotted as relative gain of cones, L/M.
The red symbols show the relative gain of L and M cones (k = L/M, see text) for settings with glasses on, corrected for the red glasses transmittance. The black dots are baseline settings taken at the beginning of each test session with glasses off. If the observers showed complete absence of color constancy, the unique yellow settings with glasses on should have been at the same level as this baseline. The red dashed line above corresponds to the baseline unique yellow corrected for the red glasses’ transmittance. If observers had perfect color constancy, their settings would produce identical physical colors on the monitor with and without glasses, and so should fall here when glasses were worn.
-
Figure 4—source data 1
Figure 4 data.
- https://cdn.elifesciences.org/articles/61179/elife-61179-fig4-data1-v1.xlsx
Figure 5

Individual differences in learning to adjust rapidly.
(A) Complete time courses for twoobservers. One observer (upper panel) showed a gradual increase of rapid adjustment during the 5 days. This observer also retained the stronger rapid adjustment in the follow-up test. Another observer (lower panel), showed a flatter pattern across days and little effect of learning in the follow-up test. (B) Test-retest reliability of individual differences. The change in rapid adjustment to the glasses (relative to the 1st day) measured on the 5th day significantly correlated with the change measured in follow-up test, across observers. This indicates observers differed in their ability to learn to rapidly switch visual modes. Red dots represent observers and the dashed line is the least-square fit. The light gray and black circles denote the individuals plotted in the upper and lower portion of panel A, respectively.
-
Figure 5—source data 1
Figure 5 data.
- https://cdn.elifesciences.org/articles/61179/elife-61179-fig5-data1-v1.xlsx
Author response image 1

Additional files
Download links
A two-part list of links to download the article, or parts of the article, in various formats.
Downloads (link to download the article as PDF)
Open citations (links to open the citations from this article in various online reference manager services)
Cite this article (links to download the citations from this article in formats compatible with various reference manager tools)
Visual mode switching learned through repeated adaptation to color
eLife 9:e61179.
https://doi.org/10.7554/eLife.61179


