Sensory experience during early sensitive periods shapes cross-modal temporal biases
- Biological Psychology and Neuropsychology, University of Hamburg, Germany
- Department of Psychology and Center of Neural Science, New York University, United States
- Child Sight Institute, Jasti V Ramanamma Children's Eye Care Center, LV Prasad Eye Institute, India
Figures
Figure 1 with 3 supplements

Effects of early visual experience on spatio-temporal order biases and resolution within and across vision, audition, and touch.
Thirteen individuals with surgically removed congenital, bilateral dense cataracts (CC) and sixteen individuals whose reversed cataracts had developed later in life (DC) as well as normally sighted individuals matched for age, gender, and handedness (MCC, MDC) took part in the study (see Table 1 for details about the samples). (A) Participants judged the spatio-temporal order of two successive stimuli –one presented in each hemifield– by indicating the location of the first stimulus. In Expt. 1, visual-visual, auditory-auditory, and visual-auditory stimulus pairs were presented, in Expt. 2, visual-visual, tactile-tactile, and visual-tactile stimulus pairs. (B) Psychometric curves: group average probabilities of a ‘right side first’-response as a function of SOA (negative values indicate ‘left side first’-stimulation). Data are split by the modality presented at the right side (visual = grey, auditory = dark blue, tactile = dark red) and the modality at the other side (rows, bimodal = different modality, unimodal = same modality). Curves display cumulative Gaussian distributions fitted to the group data for illustrative purposes. Error bars indicate standard errors of the mean in all panels. (C) Probit analysis: Group mean probits (CC = filled circle, MCC = open circle, DC = filled square, MDC = open square) of the probability for a ‘visual first’-response as a function of SOA (positive values indicate ‘visual first’-stimulation) in bimodal trials (visual-auditory = light blue, visual-tactile = light red). Lines show group averages of linear regression lines fitted to individual participant’s data. The longest SOA was excluded from the linear regression, if a participant’s performance had reached an asymptote. (D) Point of cross-modal subjective simultaneity (PSS): Box-and-whisker plots show the distribution (median, quartiles, minimum and maximum bounded at 1.5 x interquartile range, outliers) of individual PSS values; big circles indicate group mean values. Positive PSS values indicate that stimulus pairs in which the visual stimulus was presented first were perceived as simultaneous. (E) ‘Visual first’-bias: Box-and-whisker plots show the distribution of the proportion of ‘visual first’-responses per participant; big circles indicate group mean values. All SOAs were presented equally often, thus, a PSS of zero and a proportion of ‘visual first’-responses equal to 0.5 would have been correct. A positive PSS corresponds to a proportion of ‘visual first’-responses below 0.5 and vice versa. (F) Temporal order judgment accuracy: Distribution and group average probabilities of correct responses separately for each group and modality condition for each of three different modality combinations per experiment (light blue: visual-auditory, light red: visual-tactile, grey: visual-visual, dark blue: auditory-auditory, dark red: tactile-tactile). (G) Bias-accuracy relation: Single participants’ proportion of correct responses (x-axis) plotted against the absolute value of their ‘visual first’-bias (y-axis; markers as in (C)). Lines show linear regressions and 95% confidence intervals. (H) Reaction time (RT) distributions: Individually normalized RT in bimodal trials as a function of SOA (positive values indicate ‘visual first’-stimulation) per group. Markers and lines show group mean values (markers and line styles as in (C)).
Figure 1—figure supplement 1
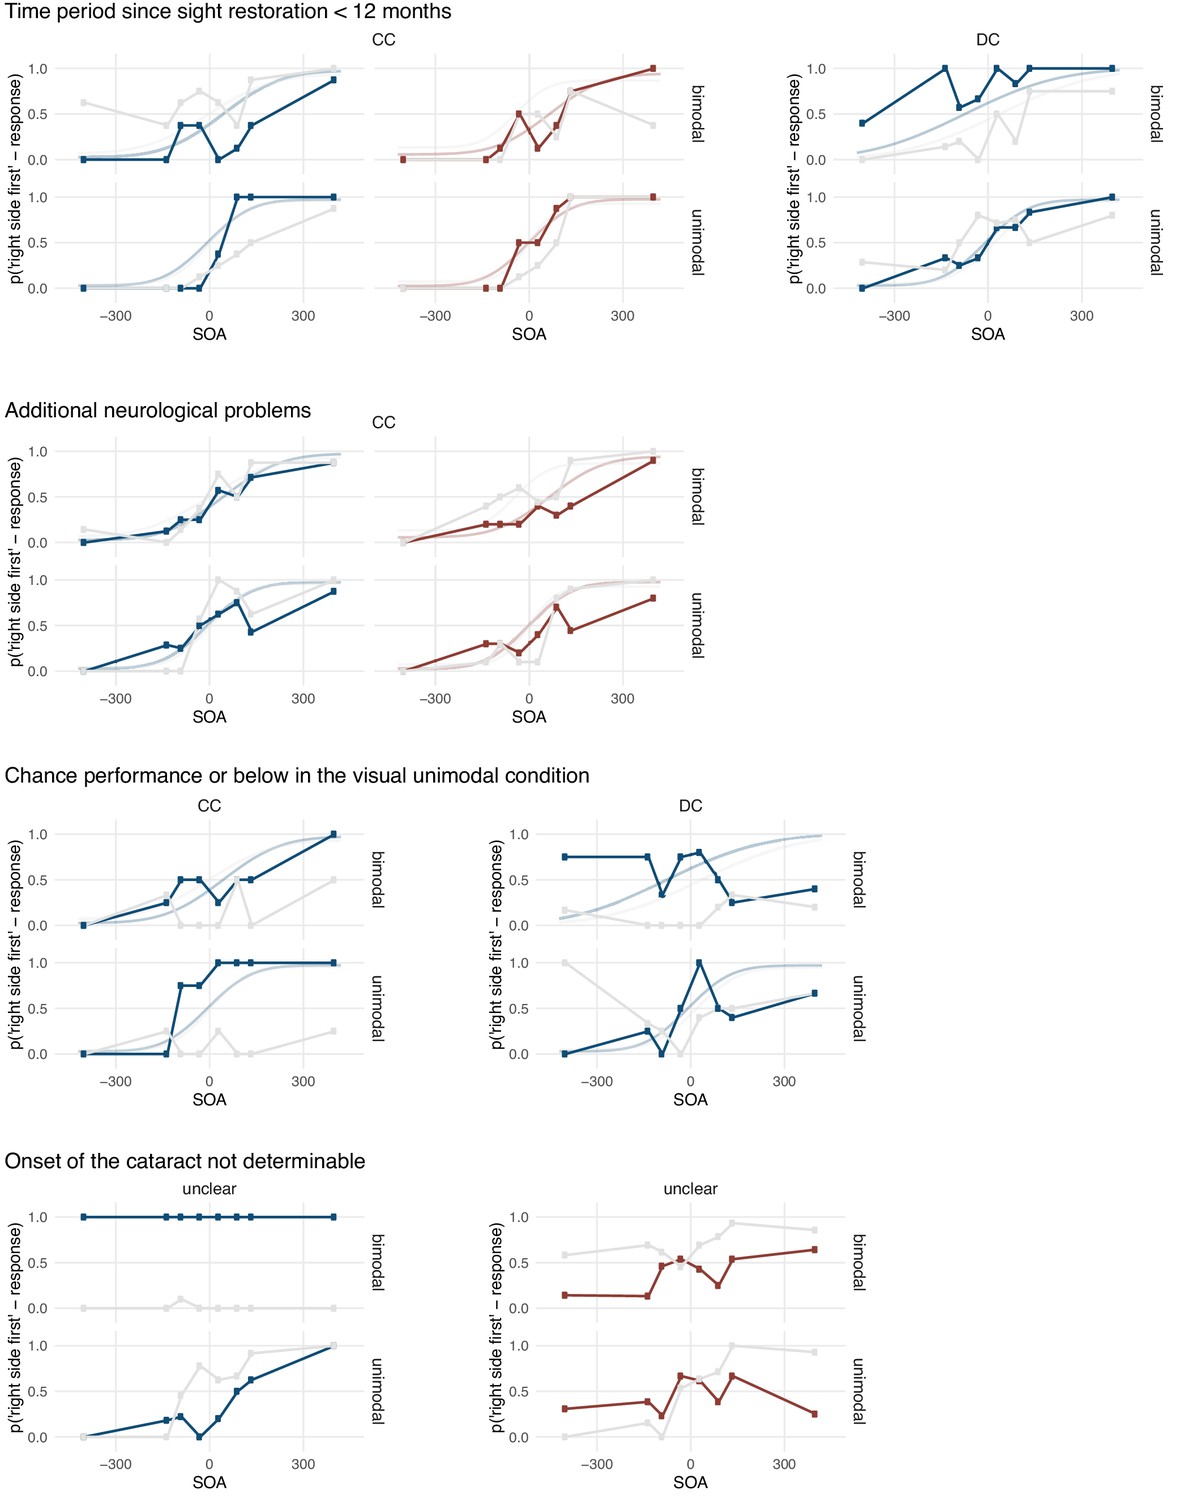
Excluded data.
Participant-level mean proportions of ‘right side first’-responses are shown as a function of the stimulus onset asynchrony (SOA) of the two stimuli, with negative values indicating ‘left side first’-stimulation. The data are split into responses to bimodal (top row) and unimodal (bottom row) stimulus pairs and according to the modality presented at the right side (visual = grey, auditory = dark blue, tactile = dark red). Sigmoid curves fitted to the group mean data reported in Figure 1B are shown as a reference for participants for whom the onset of the cataract could be identified.
Figure 1—figure supplement 2

Visual-auditory temporal order judgments in typically sighted individuals in an additional experiment controlling for the effects of visual stimulus brightness.
Five additional, typically sighted participants (all female and right-handed, 23–50 years old, mean age 34 years) completed the visual-auditory experiment. Here, a visual stimulus consisted of three activated LEDs whereas in the main experiment for typically sighted controls only one LED had been activated. Group mean proportions of ‘right side first’-responses are shown as a function of the stimulus onset asynchrony (SOA) of the two stimuli, with negative values indicating ‘left side first’-stimulation. The data are split into responses to bimodal (top row) and unimodal (bottom row) stimulus pairs and according to the modality presented at the right side (visual = grey, auditory = dark blue). Participants showed a typical bias of perceiving visual stimuli as delayed compared to auditory stimuli.
Figure 1—figure supplement 3
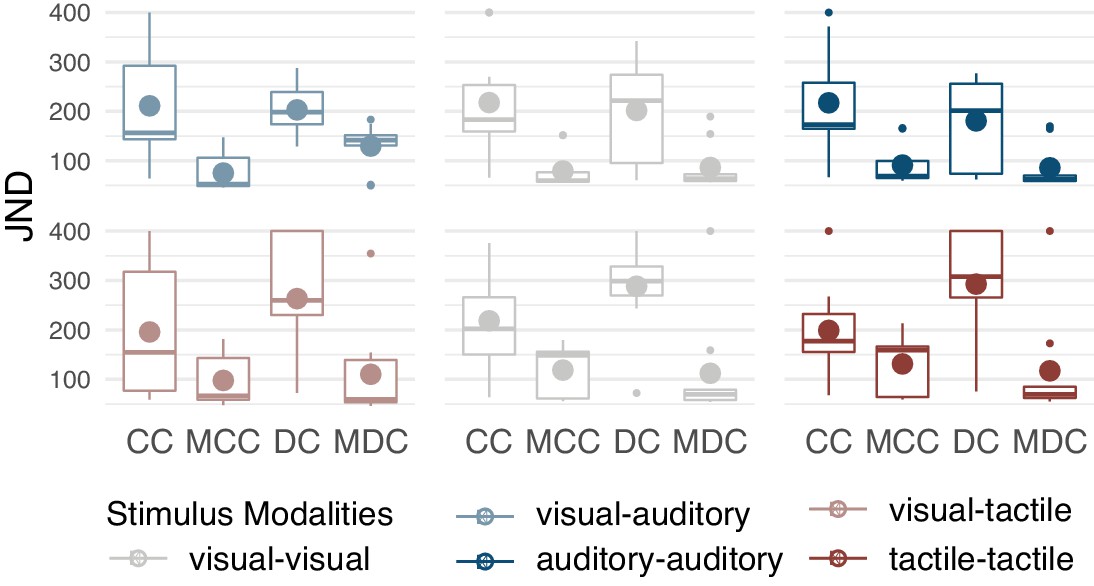
Just noticeable differences (JND).
Box-and-whisker plots show the distribution (median, quartiles, minimum and maximum bounded at 1.5 x interquartile range, outliers) of individual JND values; big circles indicate group mean values.
Tables
Table 1
Sample characteristics.
| N | Sex | Handedness | Visual acuity of the better eye | Age at testing | Age at surgery | Time period between surgery and testing | |
|---|---|---|---|---|---|---|---|
| CC – Expt. 1 visual-auditory | 10 | 8 males | 10 right-handed | 0.16–1.3 logMAR, mean 0.84 logMAR | 9–46 years, mean 30 years | 6–168 months, mean 60 months | 24–528 months, mean 296 months |
| DC – Expt. 1 visual-auditory | 9 | 7 males | 9 right-handed | −0.5–0.8 logMAR, mean 0.25 logMAR | 8–19 years, mean 13 years | 74–183 months, mean 120 months | 12–66 months, mean 30 months |
| CC – Expt. 2 visual-tactile | 10 | 10 males | 10 right-handed | 0.16–1.3 logMAR, mean 0.75 logMAR | 11–45 years, mean 30 years | 5–216 months, mean 57 months | 93–516 months, mean 296 months |
| DC – Expt. 2 visual-tactile | 9 | 6 males | 9 right-handed | 0–0.5 logMAR, mean 0.22 logMAR | 9–19 years, mean 14 years | 30–183 months, mean 102 months | 13–174 months, mean 63 months |
Additional files
-
Supplementary file 1
Supplementary statistical information.
- https://cdn.elifesciences.org/articles/61238/elife-61238-supp1-v2.docx
-
Transparent reporting form
- https://cdn.elifesciences.org/articles/61238/elife-61238-transrepform-v2.docx
Download links
A two-part list of links to download the article, or parts of the article, in various formats.
Downloads (link to download the article as PDF)
Open citations (links to open the citations from this article in various online reference manager services)
Cite this article (links to download the citations from this article in formats compatible with various reference manager tools)
Sensory experience during early sensitive periods shapes cross-modal temporal biases
eLife 9:e61238.
https://doi.org/10.7554/eLife.61238


