Structural basis for the reaction cycle of DASS dicarboxylate transporters
- Skirball Institute of Biomolecular Medicine, New York University School of Medicine, United States
- Department of Cell Biology, New York University School of Medicine, United States
- NIH Center for Macromolecular Modeling and Bioinformatics, Beckman Institute for Advanced Science and Technology, Department of Biochemistry, and Center for Biophysics and Quantitative Biology, University of Illinois at Urbana-Champaign, United States
- Perlmutter Cancer Center, New York University School of Medicine, United States
- Department of Medicine, New York University School of Medicine, United States
- Department of Biochemistry and Molecular Pharmacology, New York University School of Medicine, United States
Figures
Figure 1 with 2 supplements
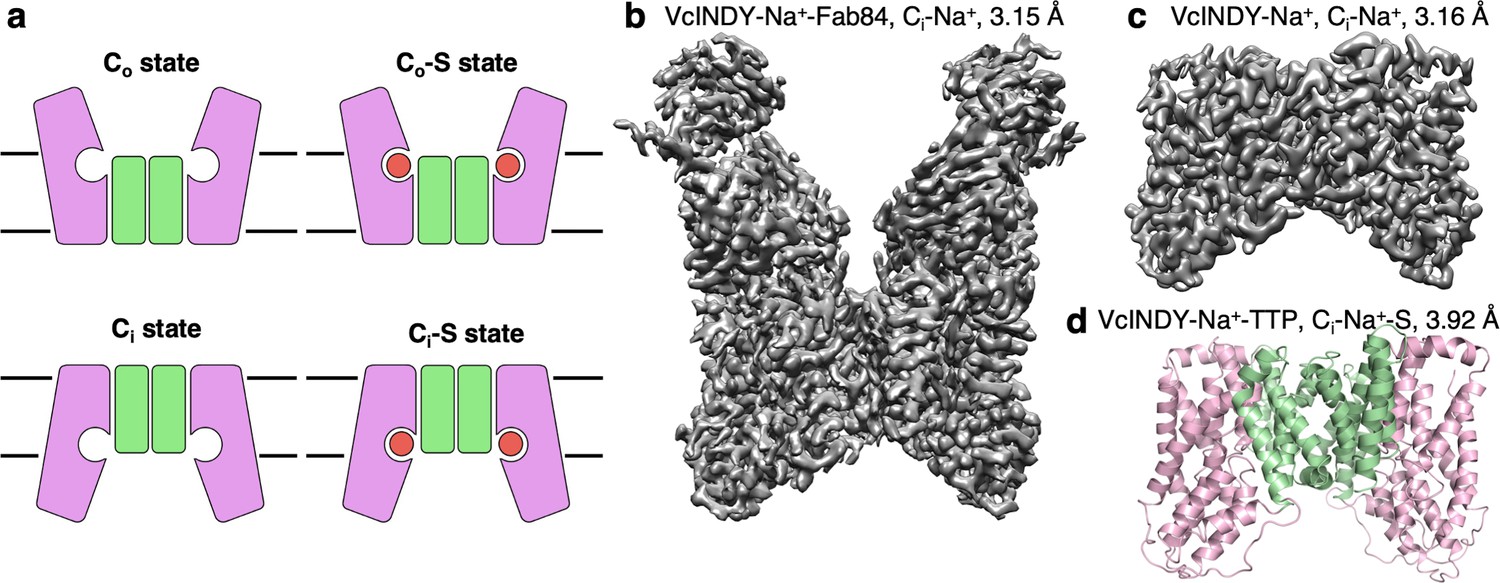
Structure determination of the Na+-dependent dicarboxylate cotransporter VcINDY in a Ci-Na+ state.
(a) The basic conformations and kinetic states of a DASS transporter: outward-facing (Co) and inward-facing (Ci) conformations, with or without substrate (S) bound. DASS proteins form a dimer, and each protomer translocates the substrate across the membrane via an elevator-like movement of the transport domain. The scaffold and the transport domains are colored in green and pink, respectively. (b) The 3.15 Å cryo-EM map of VcINDY-Na+-Fab84 complex in nanodiscs, showing the Ci-Na+ state. (c) The 3.16 Å cryo-EM map of VcINDY-Na+ in amphipol, showing the Ci-Na+ state. (d) The 3.92 Å X-ray structure of VcINDY-Na+-TTP (terephthalate) in detergent, showing the Ci-Na+-S state. The scaffold and the transport domains are colored in green and pink, respectively.
Figure 1—figure supplement 1
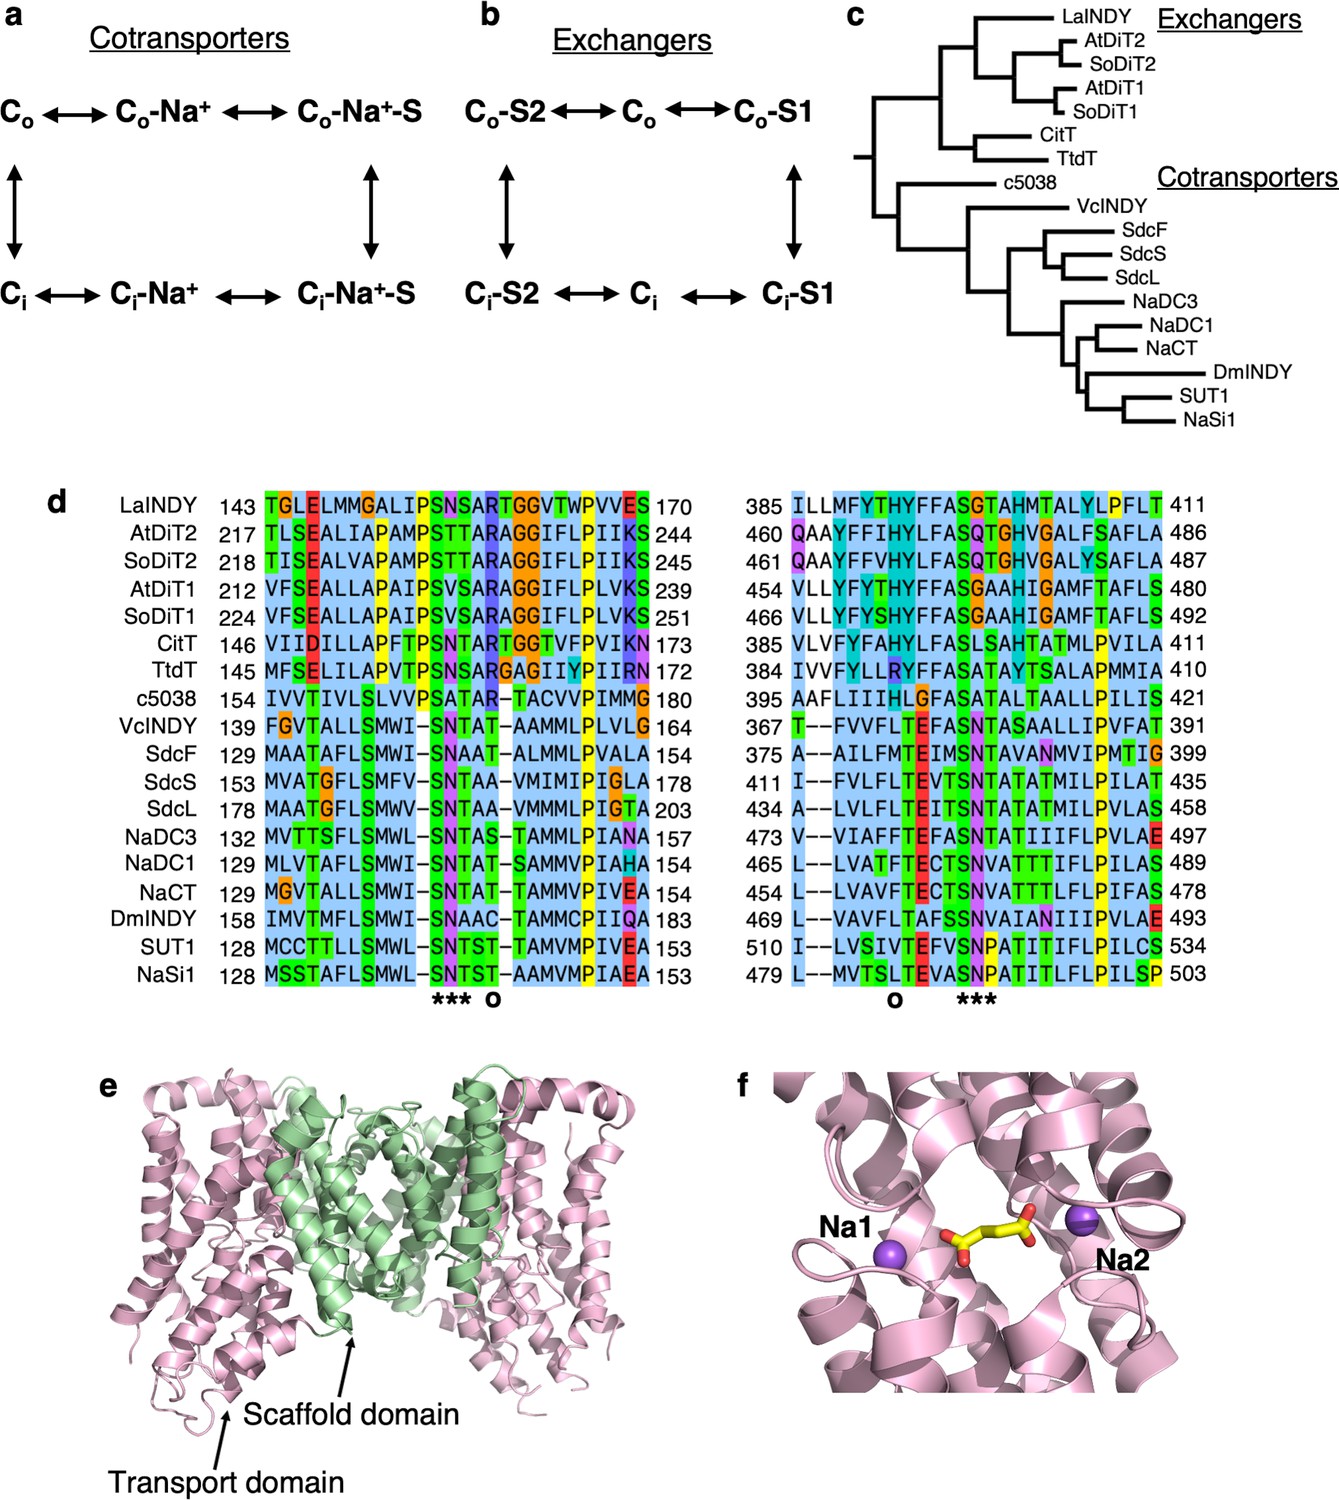
The DASS family consists of two distinct clades of cotransporters (DASS-C) and exchangers (DASS-E).
(a) Reaction cycle of cotransporters. (b) Reaction cycle of exchangers. (c) Phylogenetic tree. The amino acid sequence identity within the cotransporters and exchangers are 34.9% and 35.9%, respectively, whereas the identity between the two groups is 15.9%. The protein names are: LaINDY, succinate/dicarboxylate transporter from Lactobacillus acidophilus; AtDiT2, glutamate/malate translocator from Arabidopsis thaliana; SoDiT2, glutamate/malate translocator from Spinacia oleracea; AtDiT1, a-ketoglutarate/malate translocator from Arabidopsis thaliana, a-ketoglutarate/malate translocator (SoDiT1) from Spinacia oleracea; CitT, the citrate transporter from Escherichia coli; TtdT, the L-tartrate/succinate antiporter from Escherichia coli; c5038 from Escherichia coli; VcINDY, sodium-dependent dicarboxylate transporter from Vibrio cholerae; SdcF and SdcL, sodium-dependent dicarboxylate transporters from Bacillus licheniformis; SdcS, sodium-dependent dicarboxylate transporter from Staphyloccocus aureus; NaDC1, the human sodium-dependent dicarboxylate transporter-1 (SLC13A2); NaDC3, human sodium-dependent dicarboxylate transporter-3 (SLC13A3); NaCT, the human sodium-dependent citrate transporter (SLC13A5); DmINDY, citrate/a-ketoglutarate transporter from Drosophila melanogaster (I’m not dead yet); SUT1, the human sulphate transporter-1 (SLC13A4); NaSi1, human sodium-dependent inorganic sulphate transporter-1 (SLC13A1). (d) Amino acid sequence alignment of DASS-E and DASS-C transporters, shown around the two SNT motifs (indicated with ***) that are involved in substrate binding. The two positively-charged residues in DASS-E that substitutes Na+ ions in DASS-C are also indicated. (e) Previously-determined crystal structure of VcINDY in complex with Na+ and succinate, in the Ci-Na+-S state (PBD ID: 5UL7). Each protomer consists of a scaffold domain and a transporter domain. f, VcINDY substrate binding site with bound succinate and two Na+ ions.
Figure 1—figure supplement 2
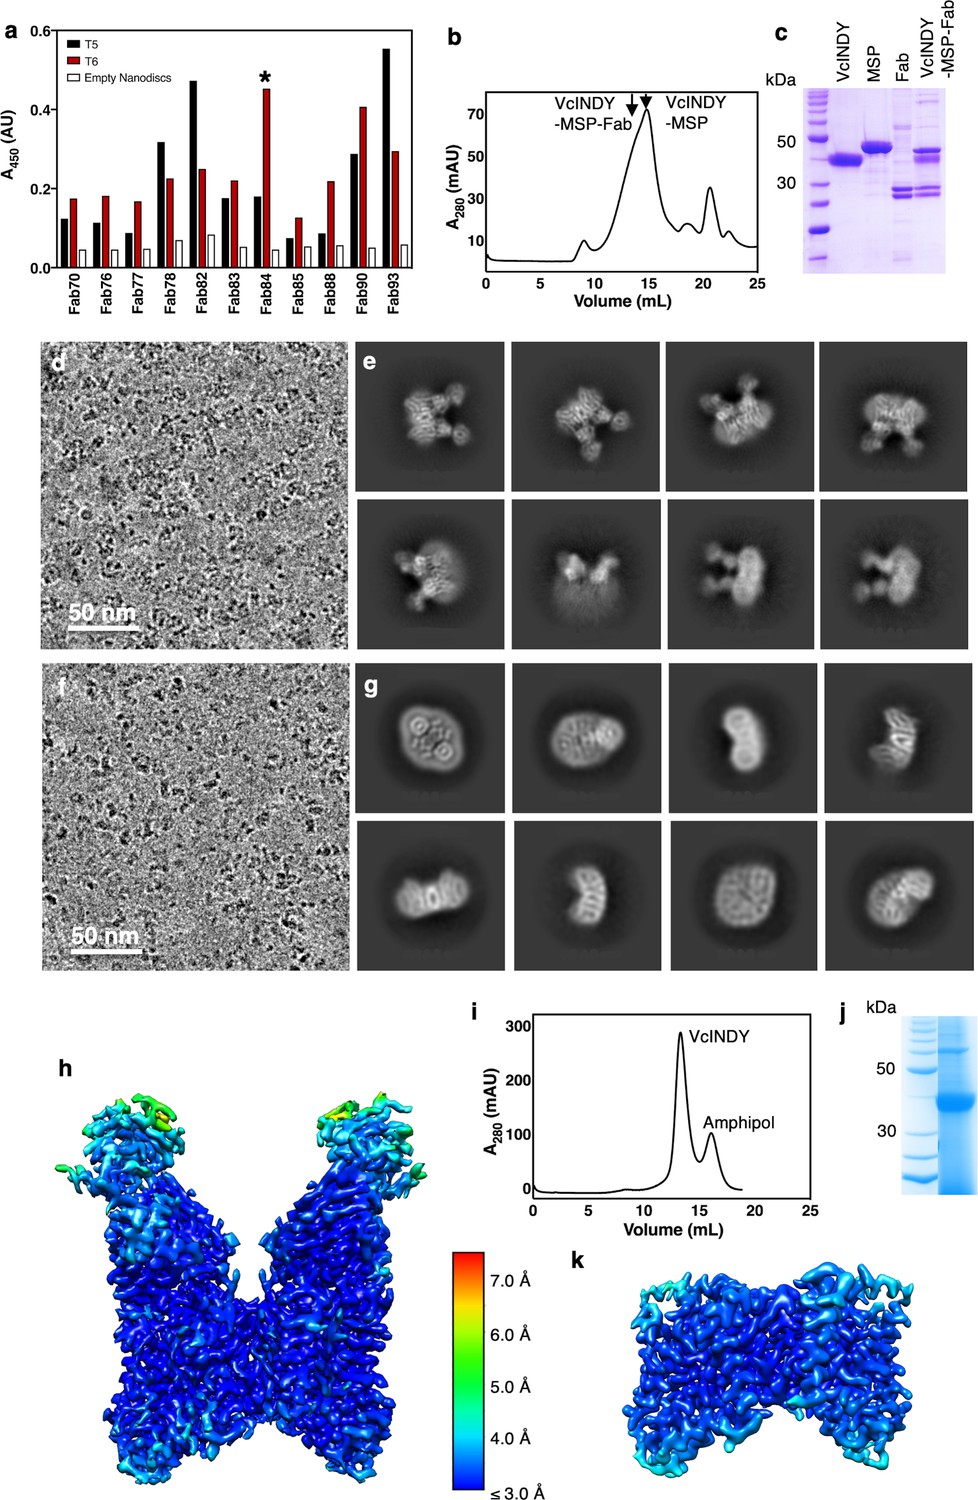
The VcINDY-Na+ structure determined by cryo-EM is in the Ci state.
(a) Fab screening using phase display technology. T5 = VcINDY in 100 mM NaCl; T6 = VcINDY in 100 mM NaCl with 2 mM succinate; Empty = empty nanodiscs. Clones #76, #78 and #83 were identical, whereas #93 was mixture of two Fabs. Fab84 (indicated by a *), which has the highest signal for the succinate bound state of VcINDY, was used for structure determination. (b) Preparative size-exclusion chromatography trace of VcINDY-Na+ in nanodiscs, in complex with Fab84, on a Superose 6 Increase column. The nanodiscs were reconstituted using membrane scaffold protein MSP2N2. (c) SDS-PAGE of VcINDY in reconstituted nanodiscs, in complex with Fab. (d) Cryo-EM micrograph of VcINDY-Na+-Fab84 in nanodiscs. (e) 2D classes of VcINDY-Na+-Fab84 in nanodiscs. (f) Cryo-EM micrograph of VcINDY-Na+ in amphipol. (g) 2D classes of VcINDY-Na+ particles in amphipol. (h) 3D map of VcINDY-Na+-Fab viewed from within the membrane plane, colored by local resolution. (i) Preparative size-exclusion chromatography trace of VcINDY-Na+ in amphipol on a Superdex 200 10/300 column. (j) SDS-PAGE of VcINDY in amphipol. (k) 3D map of VcINDY-Na+ in amphipol viewed from within the membrane plane, colored by local resolution.
Figure 2 with 2 supplements

Structure determination of the dicarboxylate exchanger LaINDY in Co and Co-S states.
(a) Whole-cell transport activity measurements of LaINDY in E. coli (N = 3). [3H]succinate was imported into E. coli whole cells, driven by the outward gradient of endogenous dicarboxylate such as succinate. When a high concentration of non-radioactive succinate or αKG was added to the external buffer at 90 s (blue arrow), [3H]succinate was exported by LaINDY in exchange for cold succinate or αKG. (b) The 3.09 Å cryo-EM map of the dicarboxylate exchanger LaINDY, showing the apo Co state. (c) The 3.36 Å cryo-EM map of LaINDY-malate, showing the Co-S state. (d) The 3.71 Å cryo-EM map of LaINDY-αKG, showing the Co-S state. In (b – d), the cryo-EM samples were prepared in amphipol. (e) The 2.86 Å X-ray structure of LaINDY-malate-αKG, showing the Co-S state.
Figure 2—figure supplement 1
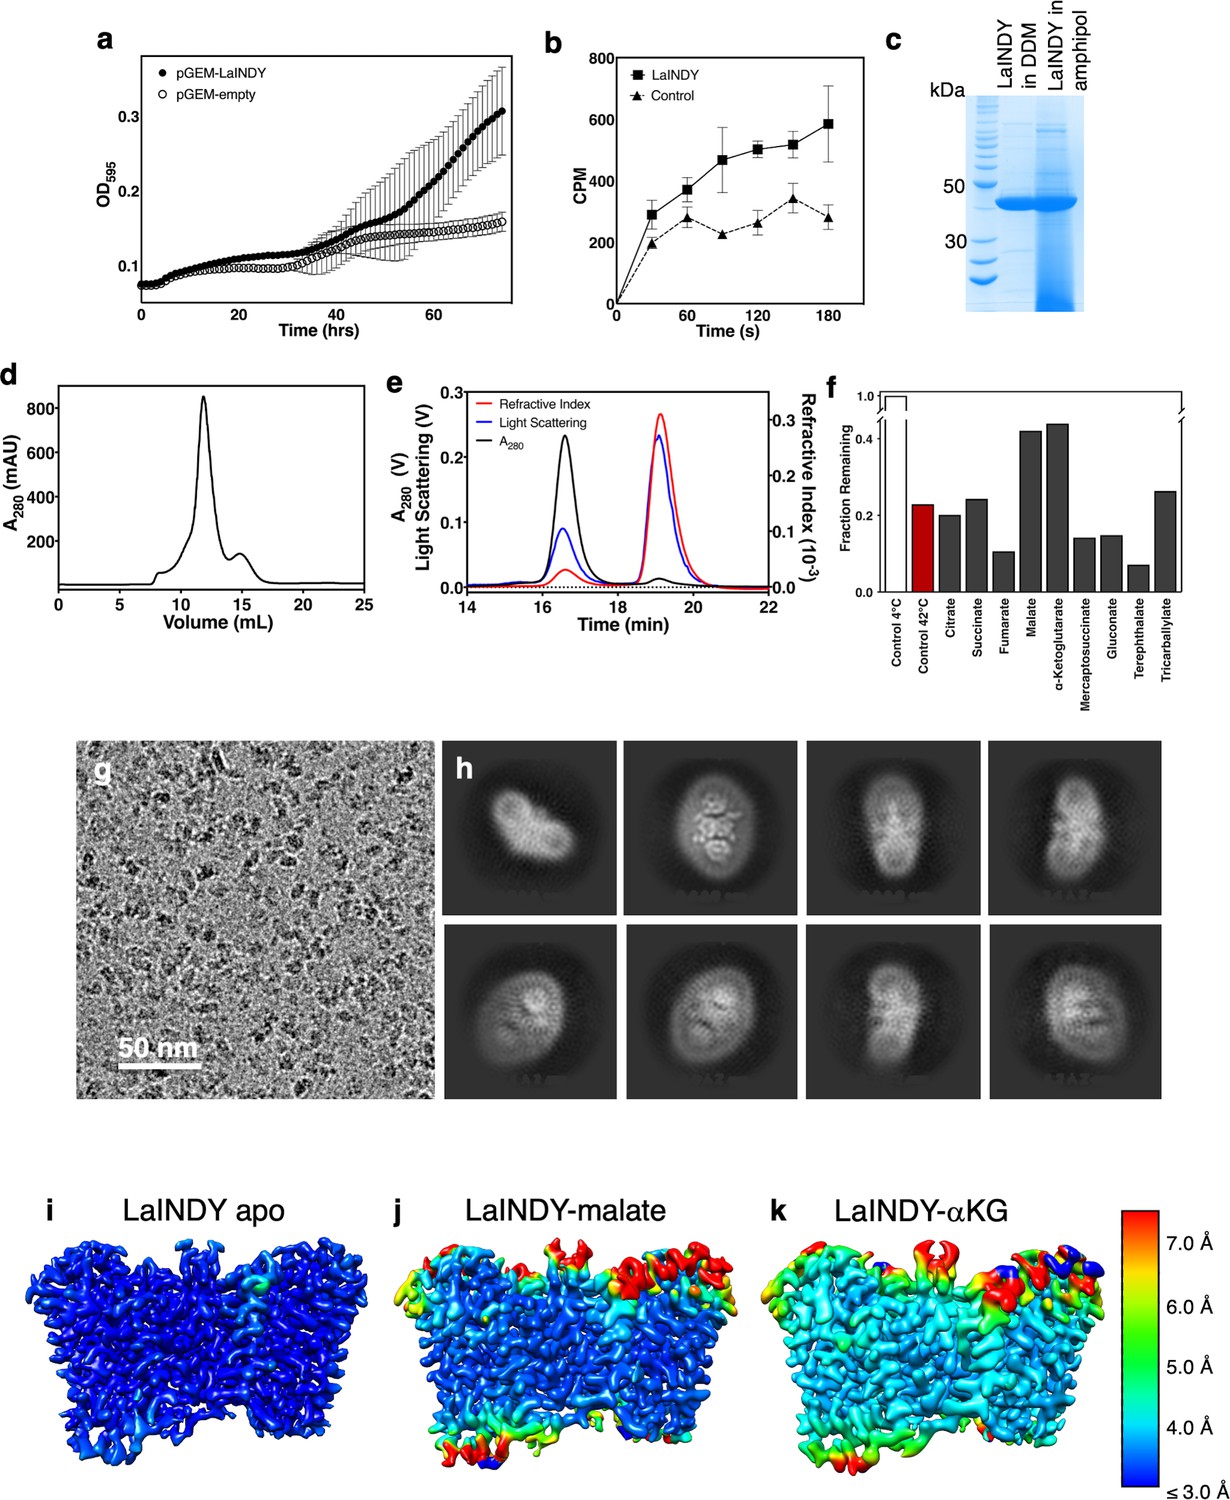
LaINDY is tentatively identified as an exchanger, and its structure is in the outward-facing, apo Co state and substrate-bound Co-S state.
(a) E. coli strain JW2571 complementation with a LaINDY-containing plasmid, grown in minimal media with aKG as the sole carbon source (N = 3). In the JW2571 strain, the only endogenous αKG transporter under aerobic conditions KgtP was knocked out. (b) Whole cell succinate uptake assay of LaINDY in E. coli using radioactive succinate (N = 3). (c) SDS-PAGE of purified LaINDY in amphipol. (d) Preparative size-exclusion chromatography trace of LaINDY in amphipol on a Superdex 200 10/300 column. (e) Molecular mass measurements of detergent-purified LaINDY using multiangle dynamic light scattering. (f) Thermostabilization of detergent-purified LaINDY in various potential substrates and substrate-analogs. (g) Cryo-EM micrograph of LaINDY preserved in amphipol. (h) 2D classes of LaINDY particles. 3D maps colored by local resolution of (i) apo LaINDY in amphipol (j) LaINDY-malate in amphipol and (k) LaINDY-aKG in amphipol.
Figure 2—figure supplement 2
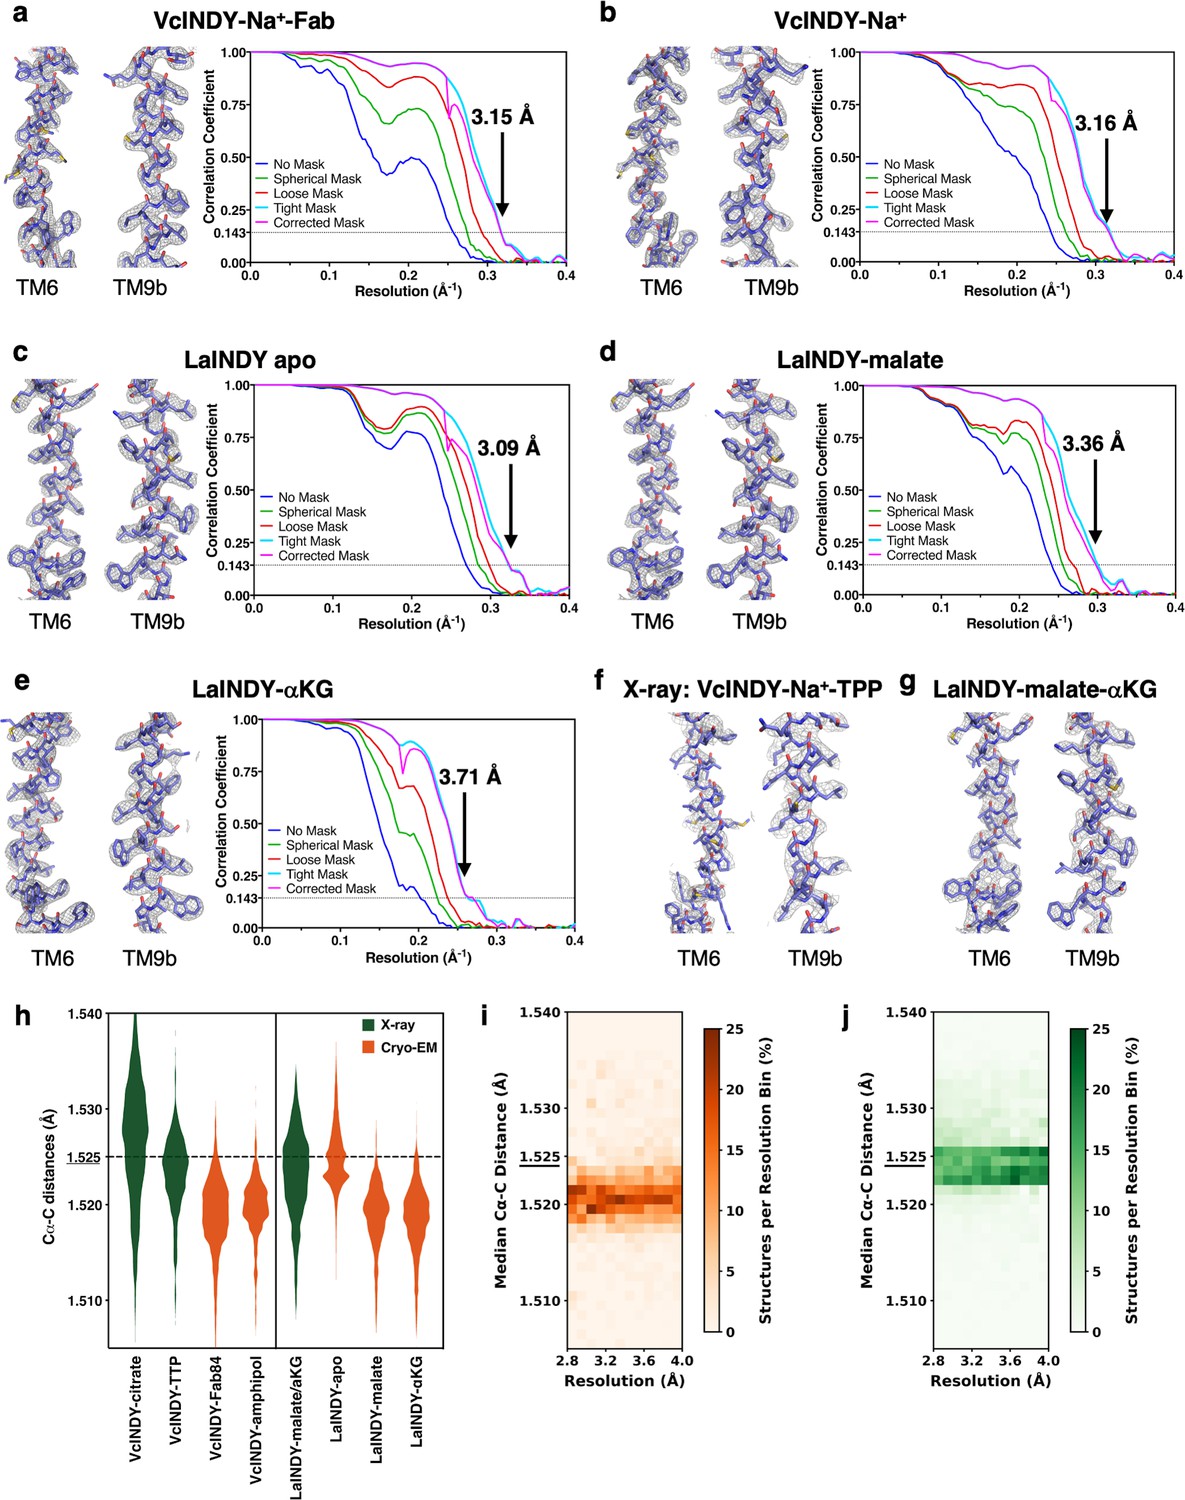
Accuracy of structure determination by cryo-EM and X-ray crystallography.
Exemplary cryo-EM densities showing the quality of the chain tracing and cryo-EM map Fourier shell coefficient of (a) VcINDY-Na+-Fab map in nanodiscs, indicating 3.15 Å global map resolution (b) VcINDY-Na+ map in amphipol, indicating 3.16 Å global map resolution (c) apo LaINDY map in amphipol, indicating a 3.09 Å global map resolution (d) LaINDY-malate map, indicating 3.36 Å global map resolution (e) LaINDY-aKG map, indicating 3.71 Å global map resolution. (f) Exemplary electron densities showing the quality of the chain tracing of VcINDY-TTP X-ray map at 3.92 Å resolution. (g) Exemplary electron densities showing the quality of the chain tracing of LaINDY-malate-aKG X-ray map at 2.86 Å resolution. Notably, in a – g, the same two transmembrane a-helices are chosen to show the quality of the chain tracing for all the seven structures reported here. (h) Violin plot showing distribution of Ca-C distances in the seven cryo-EM and X-ray structures reported here, along with the published 2.8 Å VcINDY-Na+-citrate X-ray structure (PDB ID: 5UL9). Measured values in X-ray structures are colored in green, and values in cryo-EM structures in orange. The Ca-C distances measured by cryo-EM are typically smaller than those by X-ray crystallography. The ideal Ca-C distance measured is 1.525 Å, determined by X-ray crystallography of peptide crystals. (i) Resolution dependence of the distribution of the median Ca-C distance for single particle cryo-EM structures in the PDB. (j) Resolution dependence of the distribution of the median Ca-C distance for X-ray structures in the PDB. The discrepancy in Ca-C distance between the cryo-EM and X-ray structures is independent of resolution. For i and j, all recent protein structures in the PDB with a resolution better than 4.0 Å, 2045 by single particle cryo-EM and 64,676 by X-ray, were included in the analysis.
Figure 3
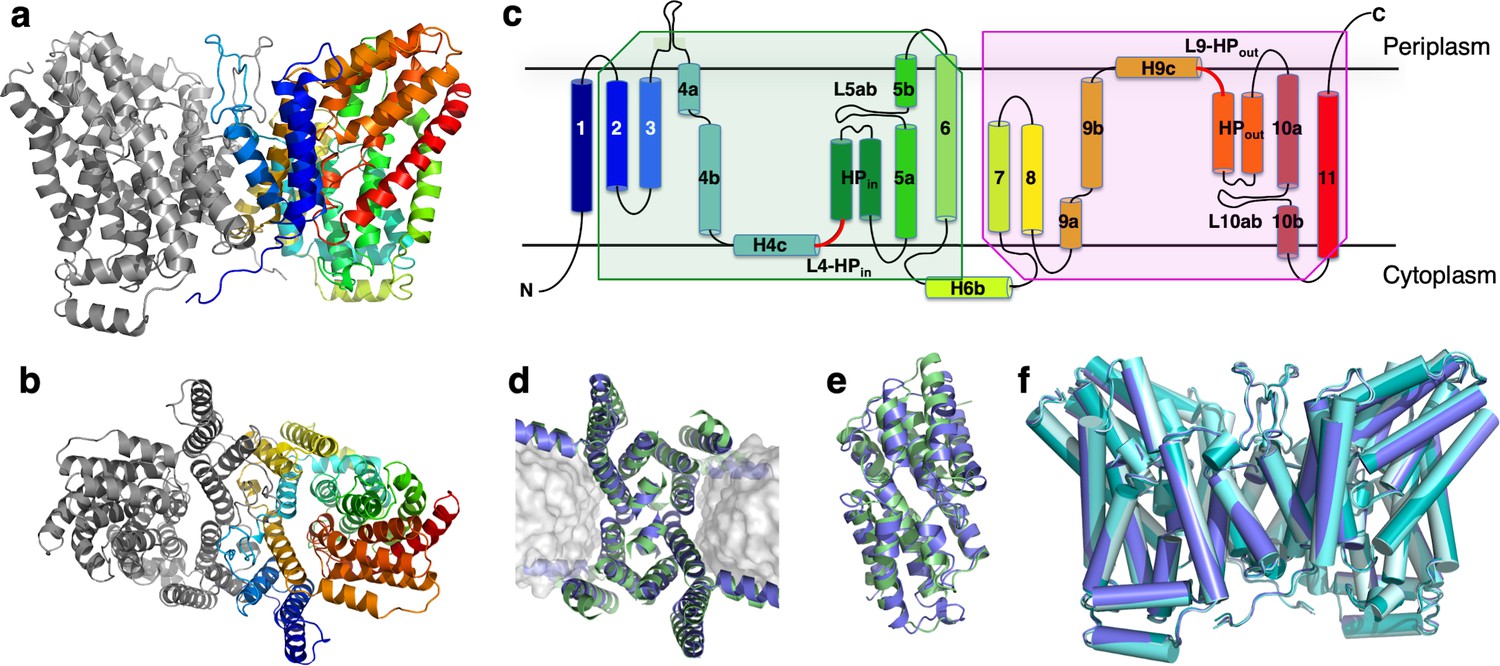
Structure of LaINDY and its structural homology to VcINDY.
The 3.09 Å Co structure of apo LaINDY dimer determined by cryo-EM as viewed from (a) within the membrane plane and (b) the periplasm. (c) Topology of LaINDY. Unique to LaINDY is an extrusion near the dimer interface into the periplasmic space, formed by a sequence insertion between TM3 and TM4. The two hinge loop regions between the scaffold and the transport domain, L4-HPin and L9-HPout, are colored red. Structural alignment of LaINDY (blue) and VcINDY (PDB ID: 5UL9, green) between (d) the scaffold domains and (e) the transport domains. (f) Overlay of the LaINDY-apo structure (blue) with its three substrate-bound structures, LaINDY-malate cryo-EM structure (pale blue), LaINDY-αKG cryo-EM structure (aquamarine) and LaINDY-malate-αKG X-ray structure (teal).
Figure 4
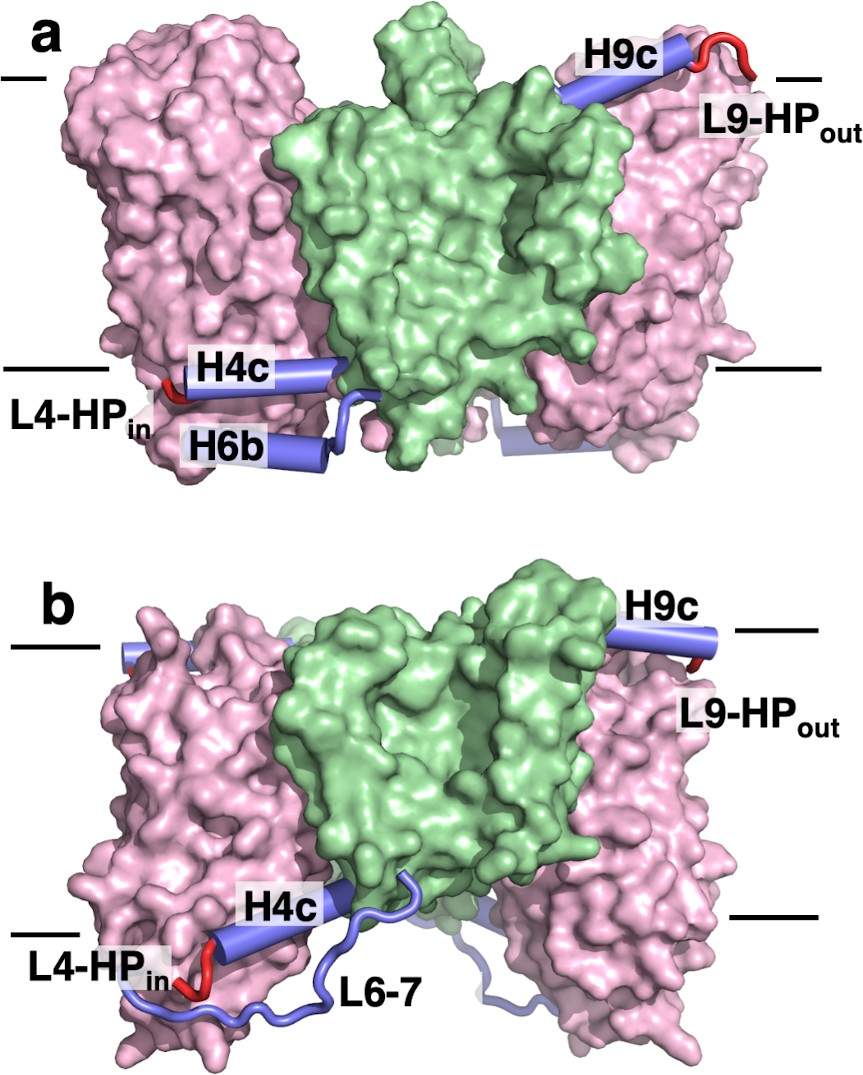
The transport domains of DASS proteins are cradled by helical arms.
The transport and scaffold domains of (a) LaINDY and (b) VcINDY are shown in surface presentation, with the arm helices H4c, H6b, and H9c shown as blue cylinders, loop L6-7 as a blue wire, and the connecting loops L4-HPin and L9-HPout as red wires.
Figure 5 with 1 supplement
LaINDY rigidity when binding substrate.
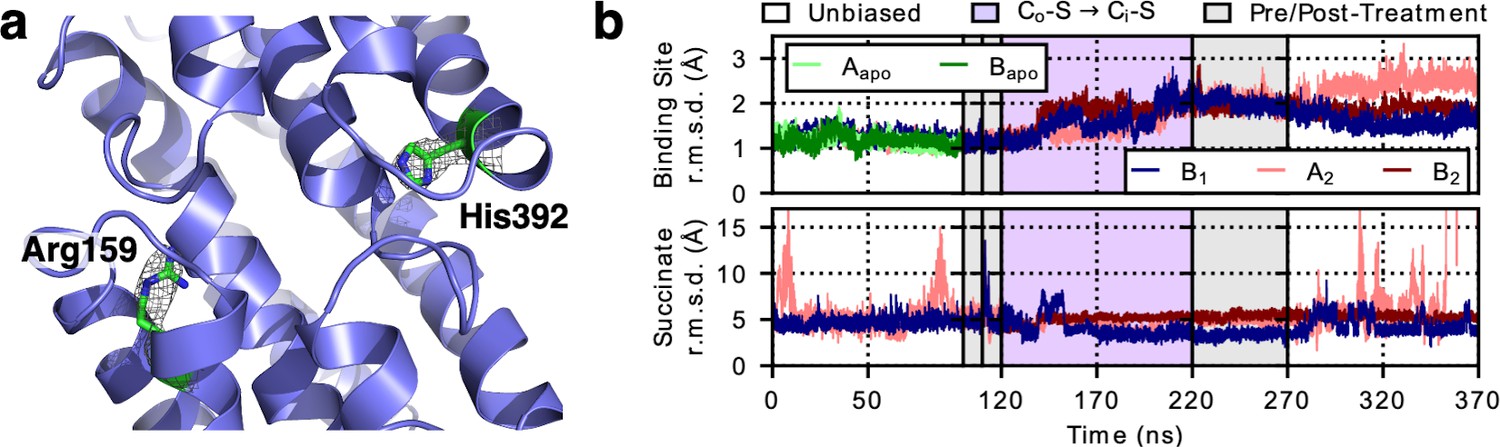
(a) The side chain of Arg159 in LaINDY is found at the location equivalent to the Na1 site in VcINDY, while His392 is found in the Na2 site. Both Arg159 and His392 are conserved in DASS exchangers but absent in cotransporters. These two positively-charged residues in exchangers are hypothesized to act as permanent surrogates of the Na+ ions in cotransporters. (b) Time series of the r.m.s.d. (of Cα and heavy side-chain atoms) of the binding site and the substrate (i.e., succinate) of apo LaINDY (protomers Aapo and Bapo) and substrate-bound LaINDY (protomers B1, A2, and B2). R.m.s.d. values were calculated by comparing the frames of the MD simulations with the X-ray crystal structure after overlaying the helices of the transport domain. The succinate is well ordered during the transition but exhibits increased mobility in the Co and Ci conformations, corresponding to substrate binding and release.
Figure 5—figure supplement 1
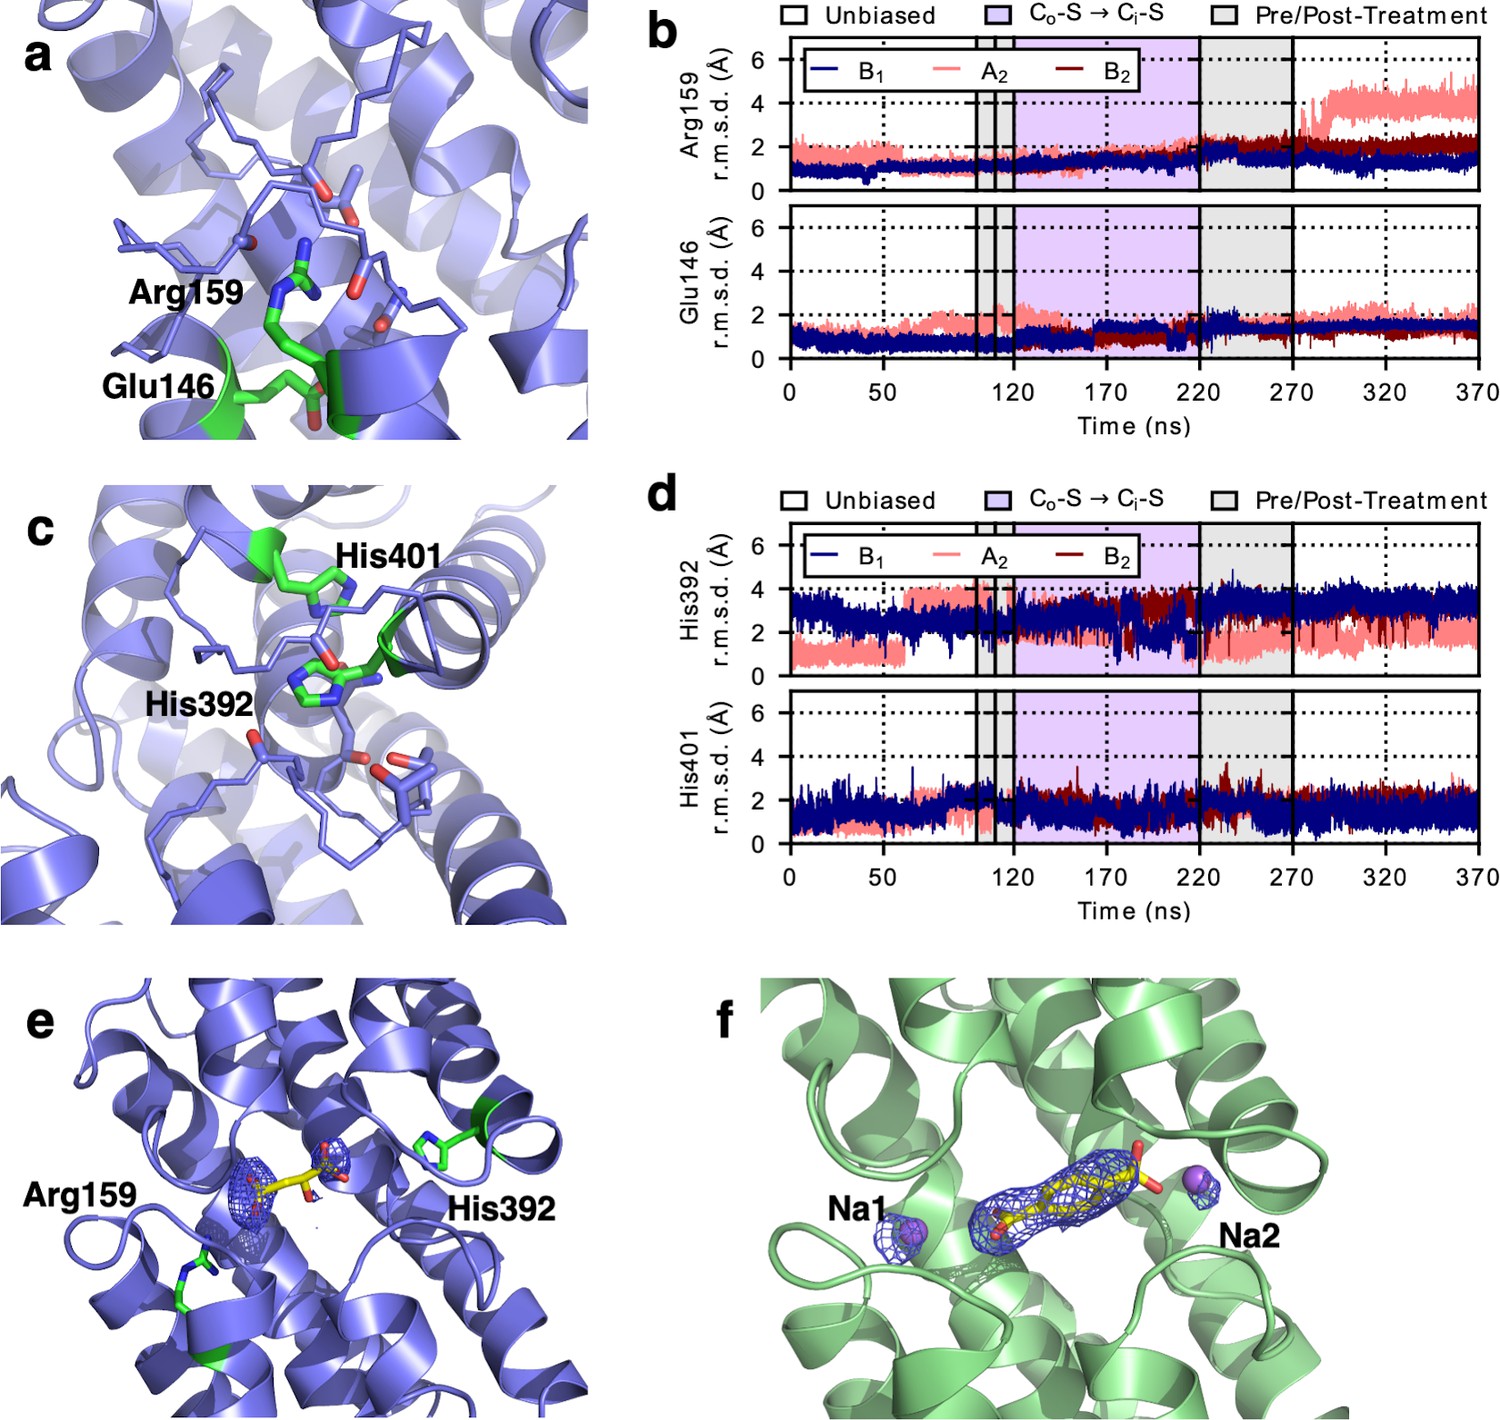
Charged residues in the binding site of LaINDY act equivalently to Na+ in VcINDY.
LaINDY structures showing Arg159 and His392 occupying sites equivalent to the Na1 and Na2 sites of VcINDY. (a) At the equivalent of Na1, Arg159 forms an ion pair with Glu146. (b) Time series from MD simulations of LaINDY showing that both Arg159 and Glu146 remain at the same locations within the transport domain during the Co-S to Ci-S state transition. (c) At the equivalent of the Na2 site, His392 interacts with another histidine, His401. (d) Time series from MD simulations of LaINDY showing that both His392 and His401 remain at the same general locations within the transport domain during the Co-S to Ci-S state transition. (e) Substrate-binding site in the LaINDY-malate-aKG X-ray structure superimposed with a substrate omit map. Because both types of the substrates were present in the crystals, the crystal structure corresponds to a superimposition of both molecules. Therefore, the omit density corresponds to the two shared carboxylate moieties of both molecules. A malate molecule is placed in the densities to illustrate the spatial relationship. (f) Substrate- and Na+-binding sites in VcINDY-TPP X-ray structure superimposed with a TTP and Na+ omit map.
Figure 6 with 1 supplement

Structural changes during the LaINDY Co-S to Ci-S transition.
(a) Bulky residues pack around the elbow preceding the H9c arm of LaINDY. In LaINDY structural interactions among five conserved bulky residues at the junction between the N-terminus of H4c and the core of the scaffold domain make the TM4b – H4c angle rigid. (b) A conserved salt bridge is formed between Arg122 of arm H4c and Glu283 of TM7 in the scaffold domain. This salt bridge helps to keep the angle between TM9b and H9c rigid. (c) Representative MD structure from the simulation of the LaINDY Co-S state. (d) Representative MD structure from the simulation of the LaINDY Ci-S state. Between the Co-S and Ci-S states, the angles at TM4b – H4c and at TM9b – H9c stay rigid, while the angles at L4-HPin and at L9- HPout change. The change in orientation of HPina to H4c and HPouta to H9c accompany the translation and rotation of the transport domain within the framework formed by H4c and H9c and the rest of the scaffold domain. Time series from MD simulations of LaINDY (protomers B1, A2, and B2) showing the structural change at (e) the elbow and (f) hinge regions. During the Co-S to Ci-S transition, while the angles at the two elbows are both rigid, the angle of HPina relative to H4c and HPouta relative to H9c changed by 27° and 33°, respectively.
Figure 6—figure supplement 1
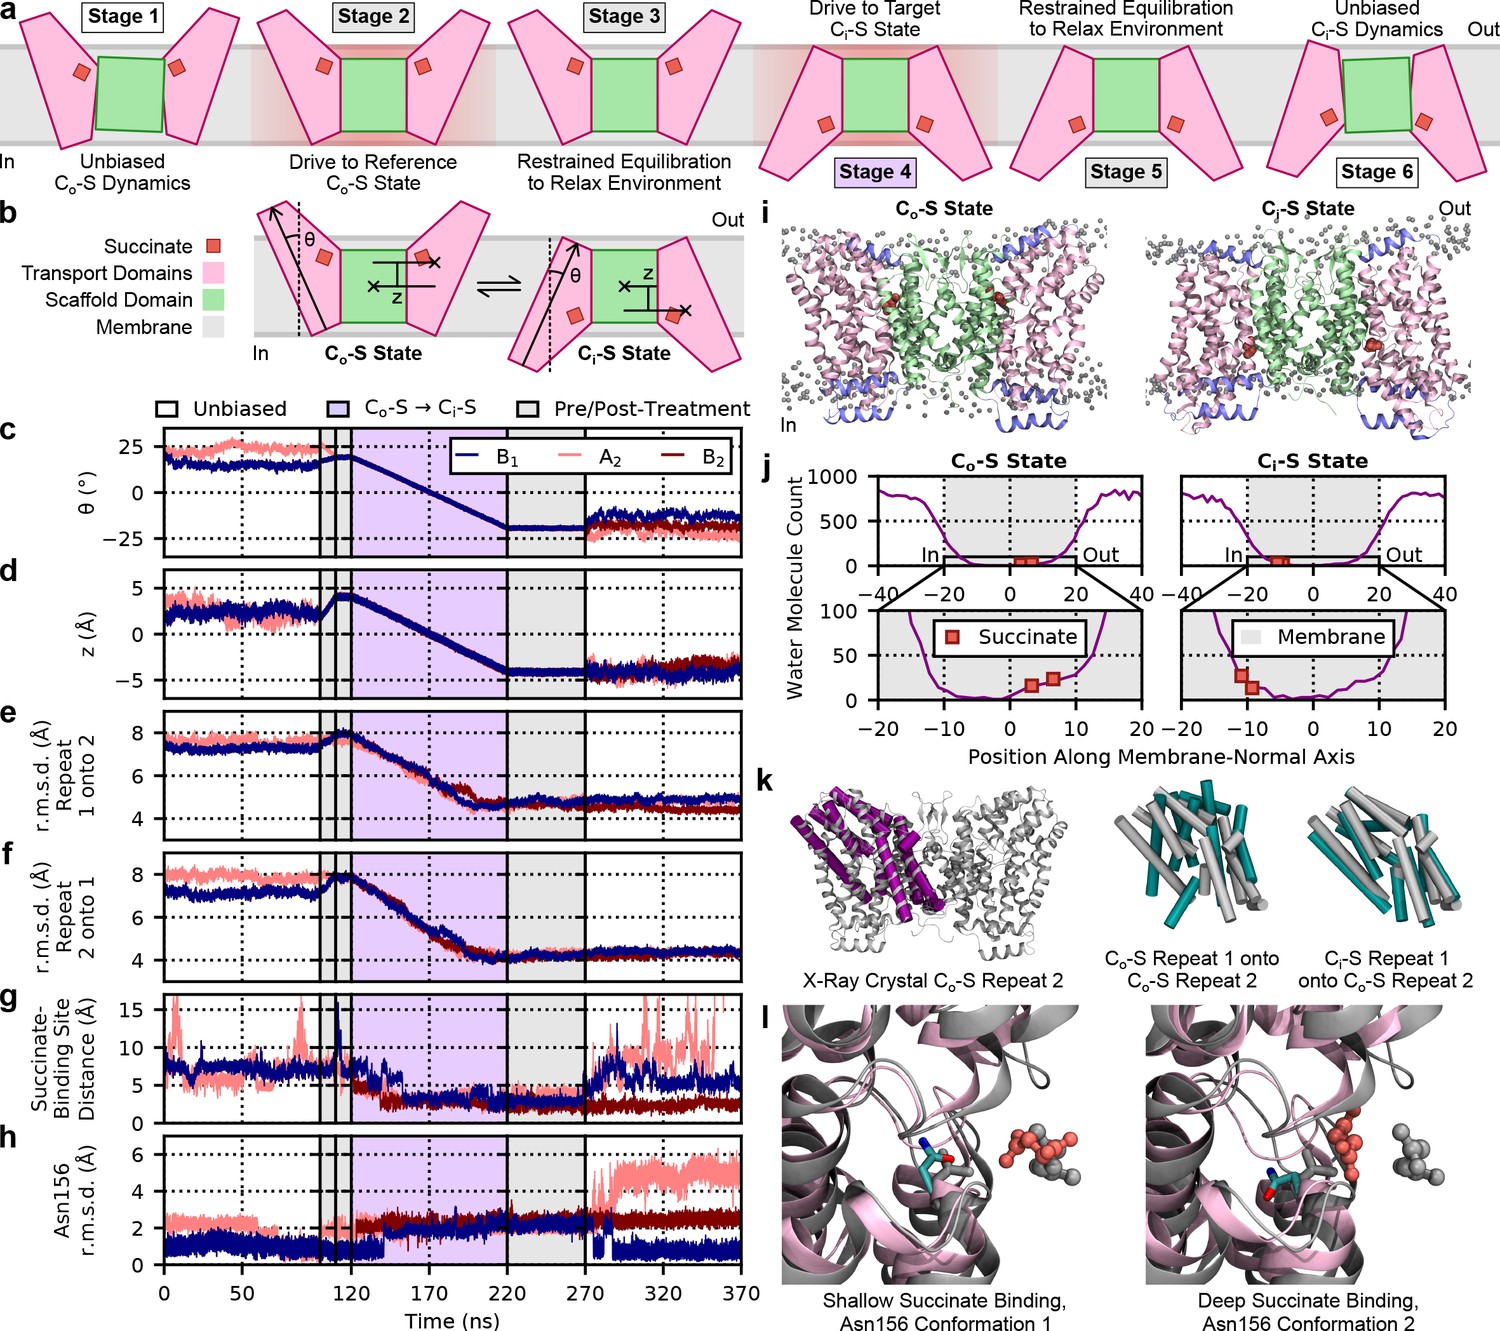
Molecular dynamics simulations of LaINDY.
(a) Schematic of all stages of the molecular dynamics (MD) simulations performed. See Materials and methods for details on each stage, see (b) for a legend of the component colors, and see above (c) for a legend of the background colors of the simulation stage labels. (b) Schematic of the collective variables z and θ used in the custom biased MD simulation protocol. See Materials and methods for detailed definitions of the collective variables. (c) Time series of the collective variable z. See (b) for a schematic definition of z, and see Materials and methods for a detailed definition. In this and all subsequent time series, data are shown for protomers B1, A2, and B2, (see the inset legend). Individual simulation stages are separated by solid vertical lines, and background colors indicate different types of simulations (see the legend above the plots). (d) Time series of the collective variable θ. See (b) for a schematic definition of θ, and see Materials and methods for a detailed definition. (e) Time series of the r.m.s.d. of the first inverted topological repeat of LaINDY with reference to the second repeat from the crystal structure. Common helix Cα atoms found by a structure-based sequence alignment were used to define the repeats. (f) Time series of the r.m.s.d. of the second repeat of LaINDY with reference to the first repeat from the crystal structure. (g) Time series of the distance between the centers of mass of the heavy atoms of succinate and the Cα atoms of the binding site. All residues found within 5 Å of succinate during the Co-S to Ci-S transition were used in the definition of the binding site (i.e., P154-T160, N199, T203, T208-V215, A396-A400, A435, Y440-A445, and I447). (h) Time series of the r.m.s.d. of Asn156 with reference to the crystal structure. Structural alignment was performed on all helix Cα atoms of the transport domain, and r.m.s.d. was measured on the Cα atom and heavy side chain atoms. (i) Co-S and Ci-S states of membrane-embedded LaINDY generated by MD simulations. Transport domains are shown in light pink, the scaffold domain in green, helices H4c, H6b, and H9c in purple, bound succinate in dark pink, and lipid phosphorous atoms in gray. These structures are highlighted as representative of the ensembles generated by the unbiased MD simulations of the Co-S and Ci-S states because their protomers have the most concurrently representative values of z and θ. (j) Water accessibility profiles for the Co-S and Ci-S states of LaINDY, with the position of membrane (gray) and bound succinate (dark pink) highlighted (see inset legends). (k) Structural comparisons of the inverted topological repeats of LaINDY in various states. When being highlighted, repeat 1 is shown in teal, and repeat 2 is shown in purple. When used for reference, the repeats are shown in gray, as is the entire structure of LaINDY. (l) Structural comparison of the two main conformations of Asn156 observed during the MD simulations and the two associated binding depths of succinate (dark pink) with reference to the X-ray crystal structure (gray).
Figure 7 with 1 supplement
Substrate release-induced conformational changes in the Ci state of VcINDY.
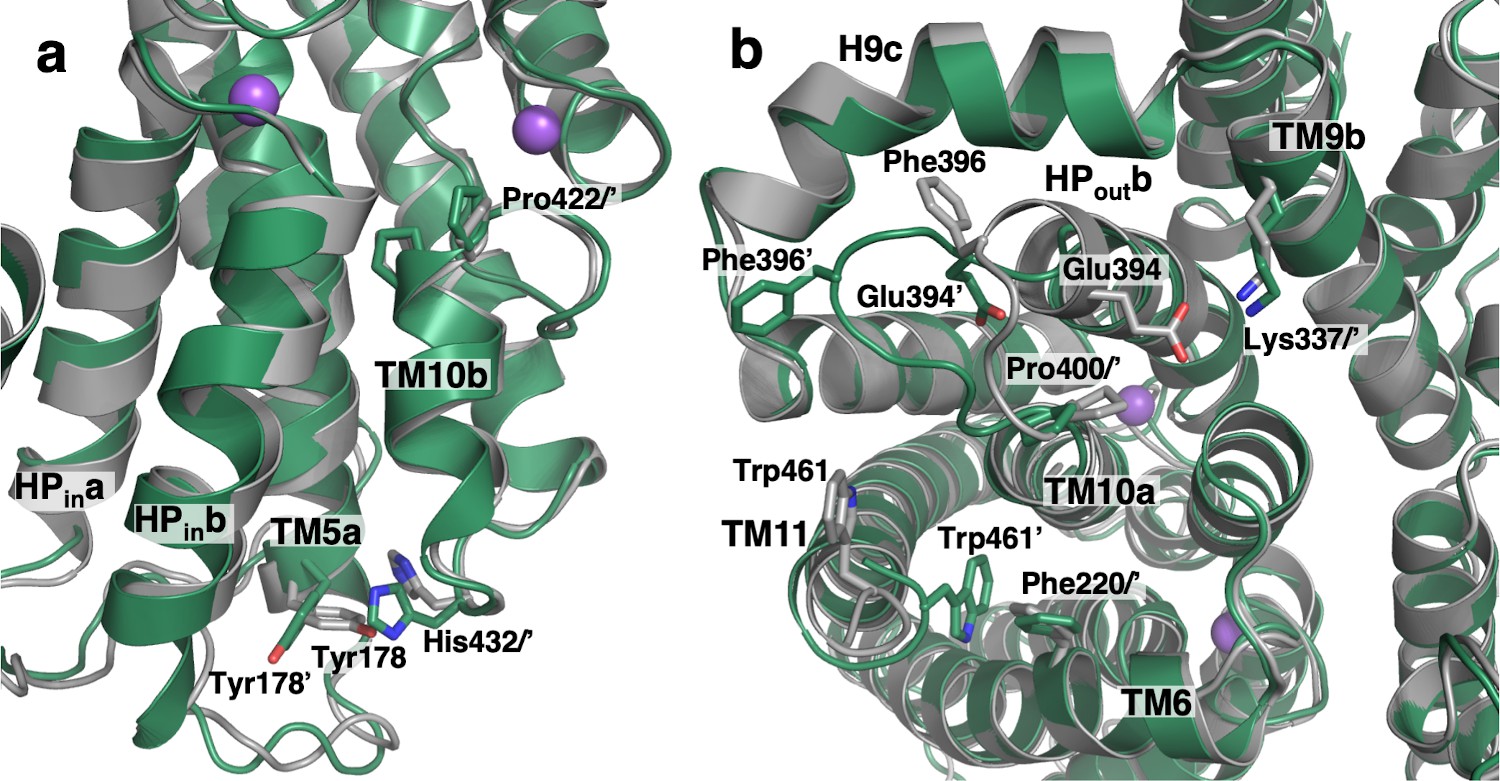
The cryo-EM structure of VcINDY in a Ci-Na+ state, determined in amphipol (dark green), is superimposed on the Ci-Na+-S state X-ray structure (grey). Amino acids of the Ci-Na+-S and Ci-Na+ states are labeled without and with an apostrophe, respectively. (a) At the substrate-binding site Pro422 at the N-terminus of TM10b moves closer to the center in the substrate free structures by 1.5 Å. Concurrently, at the C-terminus of the same helix on the cytoplasmic surface His432 is rotated by 73°. This movement of His432 causes a steric clash with its neighbor, Tyr178, inducing a rotation in that side chain by 41°. These rearrangements lead to movements of HPina, HPinb and TM5a by up to 1.4 Å toward the scaffold domain. (b) On the extracellular surface, the C-terminus of HPoutb unwinds by one turn and the entire loop connecting HPoutb and TM10a, from Val392 to Pro400, extrudes toward the lateral edge of the protein. As a result, the conserved salt bridge between Glu394 and Lys337 of TM9b breaks, and Phe396 moves away from its contact with H9c. The last four residues at the C-terminus of the protein, Leu459 to Gln462, move closer to the protein surface and the side chain of Trp461 inserts between TM6, TM10a and TM11, packing against another aromatic residue, Phe220.
Figure 7—figure supplement 1
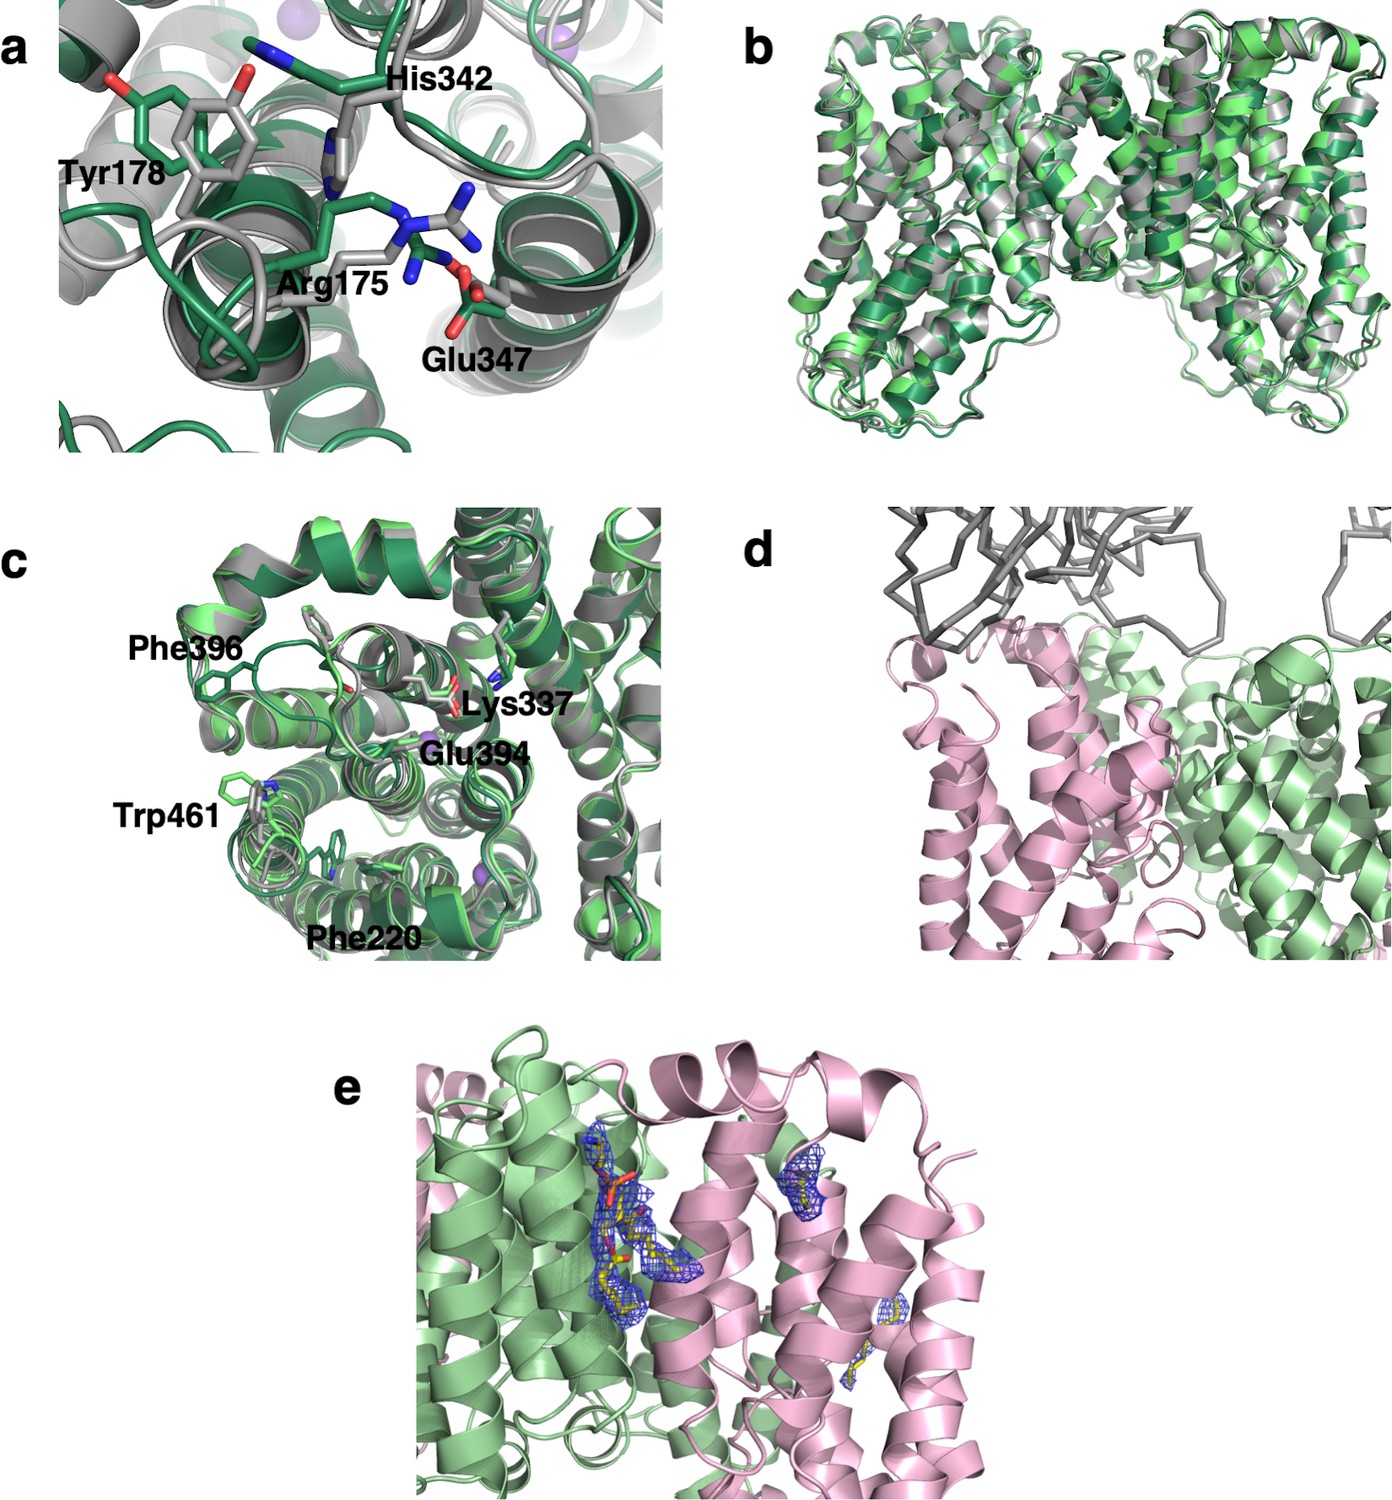
Lipid and Fab binding of VcINDY, and its conformational changes between Ci-Na+-S and Ci-Na+ states.
(a) Overlay of the Ci-Na+ VcINDY amphipol structure (dark green) and with Ci-Na+-S state (grey), viewed from the (b) membrane plane and, (c) cytoplasmic side. Superimposition of Ci-Na+ (dark green) and Ci-Na+-Fab (light green) structures with Ci-Na+-S state (grey), viewed from the periplasmic side. The epitope of Fab84 includes the loop connecting HPoutb and TM10a, and consequently partially restrains its movement. (d) Interaction between VcINDY and Fab in the VcINDY-Na+-Fab map, determined in lipid nanodiscs. VcINDY is shown as cartoon and Fab84 in ribbon. (e) Lipid density in the VcINDY-Na+-Fab map.
Videos
Video 1
Approach used to generate and characterize the approximate LaINDY Ci-S target model used by the custom biased molecular dynamics simulation protocol to induce the structural transition.
In this approach, the approximate target model suggested by LaINDY’s internal inverted repeat topological symmetry was generated by rotating the original Co-S state 180° about a membrane-parallel axis. Next, the rigid-body domain transformations needed to structurally align the original state’s inverted repeats with those of the approximate target model were identified and quantified. This information formed the foundation for the simulation protocol used to induce a transition between the Co-S and Ci-S states of LaINDY. See Materials and methods for details.
Video 2
Molecular dynamics simulation of LaINDY.
All stages of the simulation are shown (370 ns), including the unbiased simulation of the Co-S state (100 ns), the induced transition to the approximate Ci-S target (100 ns), and the unbiased simulation of the Ci-S state (100 ns). Transport domains are shown in light pink; scaffold domain in green; helices H4c, H6b, and H9c in purple; bound succinate in dark pink; and lipid phosphorous atoms in gray. Structural alignment was performed using the scaffold domain’s center of mass along the membrane-normal axis and using the transport domains’ centers of mass along the membrane-parallel axes.
Video 3
Structural dynamics of the connections between the transport and scaffold domains during the LaINDY Co-S to Ci-S transition.
Transport domains are shown in transparent light pink; scaffold domain in transparent green; helices H4c, H6b, and H9c in transparent purple; bound succinate in dark pink; lipid phosphorous atoms in gray; helices TM4b and H4c in cyan; helix HPina in dark green; helices TM9b and H9c in light orange; and helix HPouta in dark orange. Structural alignment was performed using the scaffold domain’s center of mass along the membrane-normal axis and using the transport domains' centers of mass along the membrane-parallel axes.
Video 4
Linear interpolation of VcINDY between Ci-Na+-S and Ci-Na+ states.
Morph of VcINDY between Ci-Na+-S and Ci-Na+ states by linear interpolation.
Tables
Table 1
Cryo-EM data collection and structure determination of VcINDY and LaINDY.
| VcINDY-Na+-Fab84 | VcINDY-Na+ | LaINDY-apo | LaINDY-Malate | LaINDY-αKG | |
|---|---|---|---|---|---|
| EMDB | EMD-21928 | EMD-21904 | EMD-21902 | EMD-21903 | EMD-21905 |
| PDB | 6WW5 | 6WU3 | 6WU1 | 6WU2 | 6WU4 |
| Data collection | |||||
| Microscope | Arctica-PNCC | Arctica-PNCC | Krios-NYUSoM | Krios-PNCC | Arctica-NYUSoM |
| Magnification | 36,000 | 36,000 | 130,000 | 81,000 | 36,000 |
| Voltage (kV) | 200 | 200 | 300 | 300 | 200 |
| Frames | 826 | 1670 | 3122 | 3255 | 1665 |
| Electron dose (e-/Å2) | 44 | 40 | 75.05 | 50 | 46.13 |
| Defocus range (μm) | 0.1–1.5 | 1.0–2.5 | 1.5–2.0 | 0.8–2.5 | 1.5–3.0 |
| Collection mode | Counting | Super-resolution | Counting | Super-resolution | Super-resolution |
| Effective pixel size (Å) | 1.142 | 0.571 | 1.048 | 0.5295 | 0.5575 |
| Data processing | |||||
| Initial number of particles | 369,769 | 1,072,408 | 3,285,813 | 1,680,542 | 1,564,796 |
| Final number of particles | 92,239 | 192,836 | 278,663 | 277,286 | 64,216 |
| Symmetry imposed | C2 | C2 | C2 | C2 | C2 |
| B-factor sharpening | 119.25 | 136.57 | 140.25 | 176.17 | 36.71 |
| Map resolution* (Å) | 3.15 | 3.16 | 3.09 | 3.36 | 3.71 |
| Model refinement | |||||
| Non-hydrogen atoms | 13,382 | 6674 | 7708 | 7592 | 7520 |
| Protein residues | 1764 | 890 | 978 | 978 | 978 |
| Ligands | 6 | 0 | 24 | 10 | 0 |
| Mean B factor | |||||
| Protein | 28.00 | 75.89 | 10.76 | 11.21 | 95.96 |
| Ligands | 35.87 | - | 61.19 | 58.04 | - |
| RMS deviations | |||||
| Bond lengths (Å) | 0.013 | 0.008 | 0.007 | 0.010 | 0.010 |
| Bond angles (°) | 0.947 | 0.602 | 0.605 | 0.689 | 0.677 |
| Molprobity score | 2.41 | 2.58 | 2.08 | 1.84 | 2.14 |
| Clash score | 15.44 | 8.95 | 6.26 | 6.48 | 9.97 |
| Poor rotamers (%) | 1.52 | 6.27 | 2.78 | 0.76 | 0.00 |
| Ramachandran plot | |||||
| Favored (%) | 88.87 | 91.65 | 94.15 | 91.99 | 86.86 |
| Allowed (%) | 10.56 | 8.35 | 5.44 | 7.80 | 12.73 |
| Outliers (%) | 0.57 | 0.00 | 0.41 | 0.21 | 0.41 |
| Model Resolution† | 3.5 | 3.5 | 3.3 | 3.6 | 3.7 |
-
*Resolution determined by Gold-Standard FSC threshold of 0.143 for corrected masked map.
†Resolution determined by FSC threshold of 0.5 for sharpened map.
Table 2
X-ray crystallography data collection and structure determination of VcINDY and LaINDY.
| VcINDY-TTP | LaINDY-Malate-αKG | |
|---|---|---|
| PDB | 6WTX | 6WTW |
| Data collection | ||
| Space group | P21 | P21 |
| Cell dimensions | a = 108.458 Å, b = 103.062 Å, c = 174.446 Å, β = 95.848° | a = 91.328 Å, b = 76.609 Å, c = 96.946 Å, β = 90.485° |
| Resolution (Å) | 50.0–3.90 | 50.0–2.86 |
| Rsym(%)* | 11.2 (100.4) | 15.1 (67.2) |
| I/σ(I) | 13.3 (2.46) | 16.0 (1.48) |
| No. reflections | 145,036 | 192,243 |
| Unique reflections | 33,199 | 30,640 |
| Completeness (%) | 97.4 (98.0) | 99.4 (93.5) |
| Redundancy | 4.4 (4.3) | 6.3 (5.1) |
| CC1/2 | 0.962 (0.814) | 0.966 (0.800) |
| Model refinement | ||
| Resolution (Å) | 3.92 | 2.86 |
| No. reflections | 28,636 | 30,628 |
| Rwork/Rfree (%)† | 29.0/30.8 | 22.0/27.5 |
| Non-hydrogen atoms | 13,428 | 7504 |
| Protein residues | 1780 | 978 |
| Mean B factor | ||
| Protein | 5.64 | 73.46 |
| Ligands | 5.92 | - |
| RMS deviations | ||
| Bond lengths (Å) | 0.006 | 0.006 |
| Bond angles (°) | 1.17 | 0.94 |
| Molprobity score | 2.16 | 1.90 |
| Clash score | 9.92 | 9.94 |
| Poor rotamers (%) | 1.42 | 0.0 |
| Ramachandran Plot | ||
| Favored (%) | 90.74 | 94.46 |
| Allowed (%) | 6.89 | 4.11 |
| Outliers (%) | 2.37 | 1.44 |
-
*Values in parentheses are for the highest resolution shell.
†Ten percent of the data were used in the Rfree calculation.
Key resources table
| Reagent type (species) or resource | Designation | Source or reference | Identifiers | Additional information |
|---|---|---|---|---|
| Gene (Lactococcus acidophilus) | LaINDY | ENA | AAV42769.1 | |
| Gene (Vibrio cholorea) | VcINDY | ENA | AAF95939.1 | |
| Strain, strain background (Escherichia coli) | BL21(DE3) | Sigma-Aldrich | CMC0014 | |
| Strain, strain background (Escherichia coli) | JW2571 | Keio collection | JW2571 | |
| Strain, strain background (Escherichia coli) | 55244 | ATCC | 27C7 | |
| Recombinant DNA reagent | pET-LaINDY (plasmid) | This study | See Materials and methods. To obtain the plasmid, contact the D.N. Wang Lab. | |
| Recombinant DNA reagent | pET-VcINDY (plasmid) | Mancusso et al., 2012 | ||
| Recombinant DNA reagent | pFab101 (plasmid) | Miller et al., 2012 | ||
| Antibody (synthetic monoclonal) | Fab84 | This study | See Materials and methods (3:1 molar ratio Fab:VcINDY). To obtain the Fab plasmid, contact the S. Koide Lab or the D.N. Wang Lab. | |
| Chemical compound, drug | Amphipol | Anatrace | PMAL-C8 | |
| Software, algorithm | cryoSPARC | Structura Biotechnology | RRID:SCR_016501 | |
| Software, algorithm | Chimera | Pettersen et al., 2004 | RRID:SCR_004097 | |
| Software, algorithm | PyMOL | Schrodinger | RRID:SCR_000305 | |
| Software, algorithm | COOT | Emsley and Cowtan, 2004 | RRID:SCR_014222 | |
| Software, algorithm | PHENIX | Adams et al., 2010 | RRID:SCR_014224 | |
| Software, algorithm | Prism | GraphPad Software | RRID:SCR_002798 | |
| Others | QuantiAuFoil R1.2/1.3 | Quantifoil |
Additional files
Download links
A two-part list of links to download the article, or parts of the article, in various formats.
Downloads (link to download the article as PDF)
Open citations (links to open the citations from this article in various online reference manager services)
Cite this article (links to download the citations from this article in formats compatible with various reference manager tools)
Structural basis for the reaction cycle of DASS dicarboxylate transporters
eLife 9:e61350.
https://doi.org/10.7554/eLife.61350


