Differential activation of JAK-STAT signaling reveals functional compartmentalization in Drosophila blood progenitors
- Jawaharlal Nehru Centre for Advanced Scientific Research, India
- National Centre for Biological Sciences, Tata Institute of Fundamental Research, India
- Shanmugha Arts, Science, Technology & Research Academy, India
- University of Clermont Auvergne, CNRS, Inserm, GReD, France
Figures
Figure 1 with 2 supplements
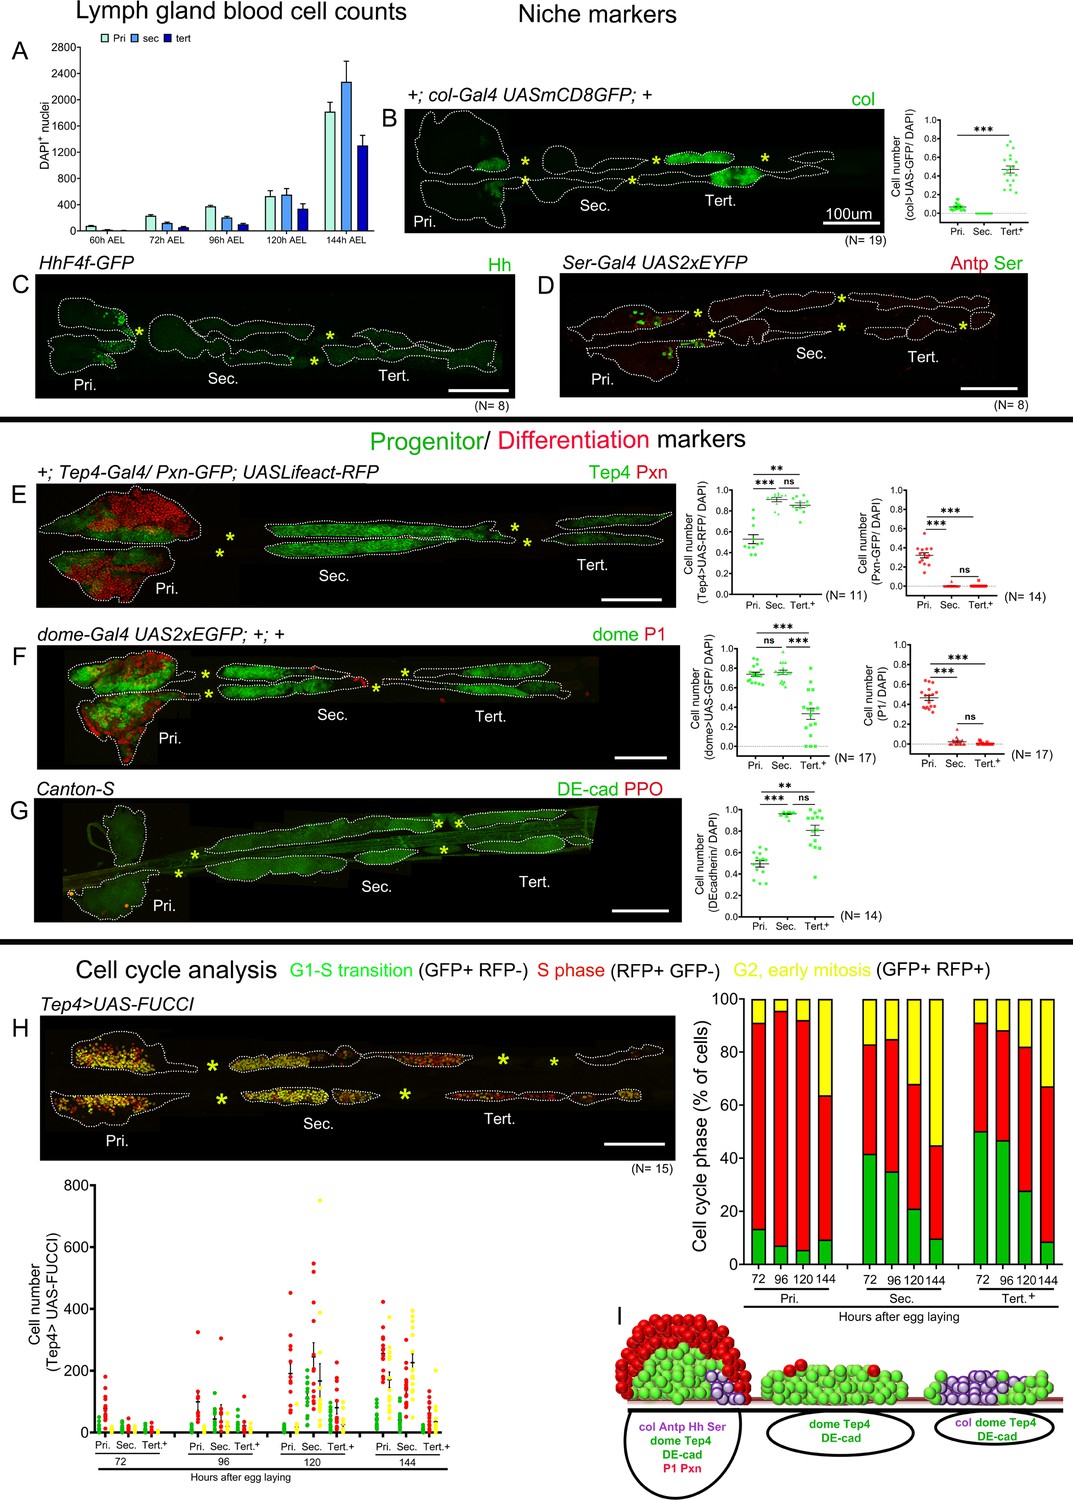
Blood cell counts and gene expression analysis in the larval lymph gland.
Whole lymph gland preparations (including primary and posterior lobes [sec., tert., quat. lobes]) were analyzed for third instar larvae except where time points are mentioned. (A) Total lymph gland blood cell counts (DAPI+ cells) at the indicated time points. (B–D) Expression profiles of posterior signaling center (PSC) markers. (B) col-Gal4,UASmCD8-GFP (green) is expressed in the PSC and in the tertiary lobes; graph represents ratio of col>GFP+/DAPI+ cells. (C) hhF4f-GFP (green) and (D) Antp (red) and Ser-Gal4,UAS2xEYFP (green pseudo color) are expressed in the PSC only. (E–G) Expression profiles of medullary zone (MZ)/progenitor (green) and cortical zone (CZ)/differentiation (red) markers. (E) Tep4-Gal4,UASLifeact-RFP (green pseudo color), (F) dome-Gal4,UAS2xEGFP (green), and (G) DE-cadherin (green) expression are observed in the MZ as well as in the posterior lobes; (E) Pxn-GFP (red pseudo color), (F) P1 (red), and (G) ProPO (red) are restricted to the primary lobes. Quantification panels indicate ratios of Tep4+/DAPI+ or Pxn+/DAPI+ (E), dome+/DAPI+ or P1+/DAPI+ (F), and DE-cad+/DAPI+ (G) cells respectively. (H) Cell cycle analysis for Tep4-Gal4> FUCCI. GFP+/RFP-: G1 phase; GFP-/RFP+: S-phase, GFP+/RFP+: G2/M phase. (I) Schematic representation of the expression of indicated markers in the third instar larval lymph gland. Pri. indicates primary lobes, Sec. indicates secondary lobes, Tert. indicates tertiary lobes, and Post. indicates posterior lobes. (B–D and E–H) Yellow asterisks indicate pericardial cells. Lobes are outlined by white dashed lines. Nuclei were stained with DAPI, which is not displayed for clarity. (B–G) Kruskal–Wallis test was used for statistical analysis. **p<0.01, ***p<0.001, ns: nonsignificant, and error bars represent SEM. (B–H) Scale bar: 100 µm.
-
Figure 1—source data 1
Numerical data plotted and statistical analysis related to Figure 1.
- https://cdn.elifesciences.org/articles/61409/elife-61409-fig1-data1-v2.xlsx
Figure 1—figure supplement 1

Analysis of lymph gland lobes and gene expression analysis.
Whole lymph gland preparations (including primary and posterior lobes [sec., tert., quat. lobes]) are shown. (A) Table shows number of larvae that have one or two primary/secondary/tertiary/quaternary lobes during development at the indicated time points. (B–F) Shows total lymph gland blood cell counts (DAPI+ cells) at 60 hr after egg laying (AEL), 72 hr AEL, 96 hr AEL, 120 hr AEL, and 144 hr AEL, respectively. (B) Yellow and red arrowheads indicate secondary and tertiary lobes. (B–F) Kruskal–Wallis test was used for analysis of DAPI+ cells and for fold-change analysis Student's t-test was used. (G–K) Wandering third instar larvae whole lymph gland preparations showing the expression of (G): col-Gal4,UAS-GFP (green) and Col (red), (H) Tep4 (red), (I) domeMESO-GFP (green), (J) shg-GFP (green), or (K) Tep4-Gal4,UAS-RFP (red) and Hnt (green) as revealed by fluorescent immunostaining (G and I–K) or in situ hybridization (H). Nuclei were stained with DAPI (blue). Pri. indicates primary lobes, Sec. indicates secondary lobes, and Tert. indicates tertiary lobes. (G–K) Right panels: single channel images. Scale bar: (B) 50 µm, (C–K) 100 µm.
-
Figure 1—figure supplement 1—source data 1
Numerical data plotted and statistical analysis related to Figure 1—figure supplement 1.
- https://cdn.elifesciences.org/articles/61409/elife-61409-fig1-figsupp1-data1-v2.xlsx
Figure 1—figure supplement 2
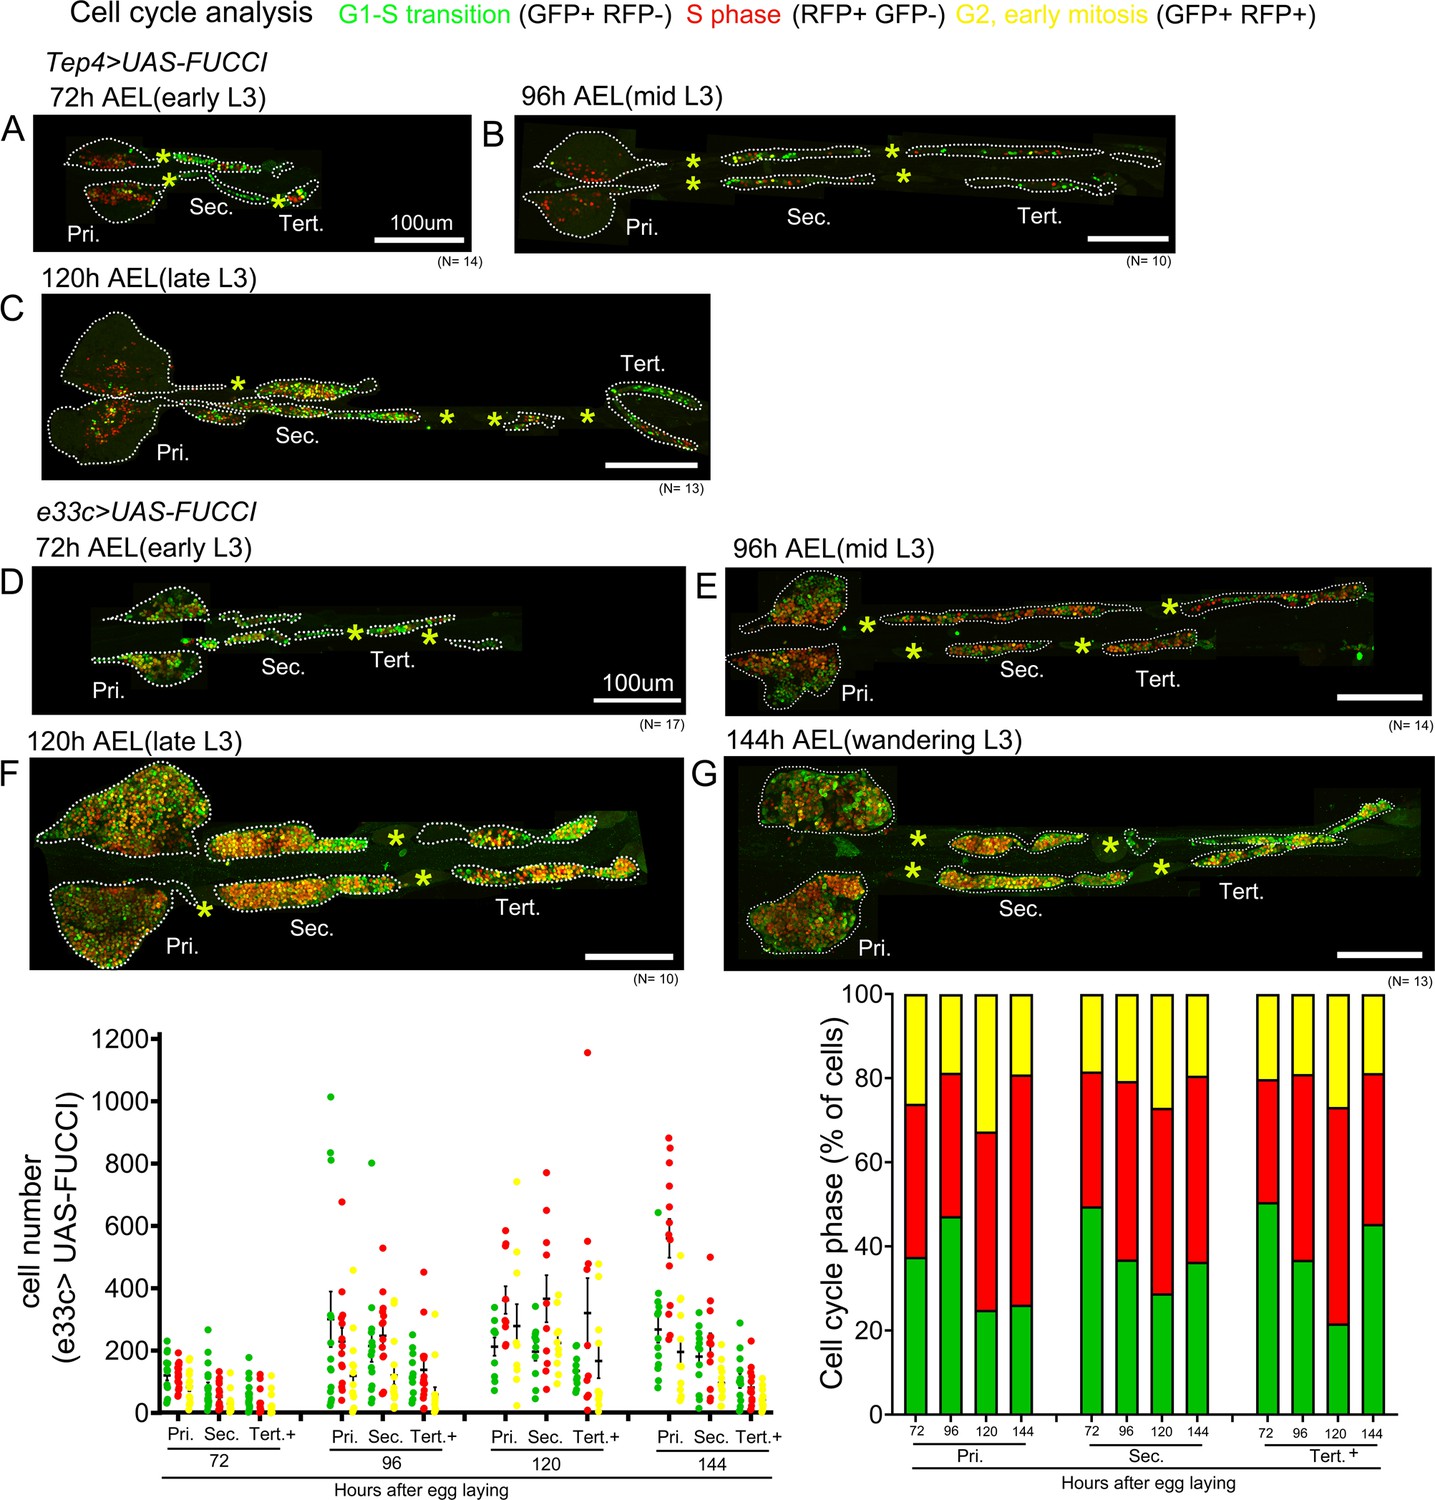
Blood cell progenitor cell cycle pattern.
(A–G) Cell-cycle analyses for Tep4-Gal4> FUCCI (A–C) or e33c-Gal4> FUCCI (D–G) are shown at the indicated time points. GFP+/RFP-: G1 phase; GFP-/RFP+: S-phase, GFP+/RFP+: G2/early M phase. Pri. indicates primary lobes, Sec. indicates secondary lobes, and Tert. indicates tertiary lobes. Yellow asterisks indicate pericardial cells. Lobes are outlined by white dashed lines. Nuclei were stained with DAPI, which is not displayed for clarity. Scale bar: (A–G) 100 µm.
-
Figure 1—figure supplement 2—source data 1
Numerical data plotted and statistical analysis related to Figure 1—figure supplement 2.
- https://cdn.elifesciences.org/articles/61409/elife-61409-fig1-figsupp2-data1-v2.xlsx
Figure 2 with 1 supplement
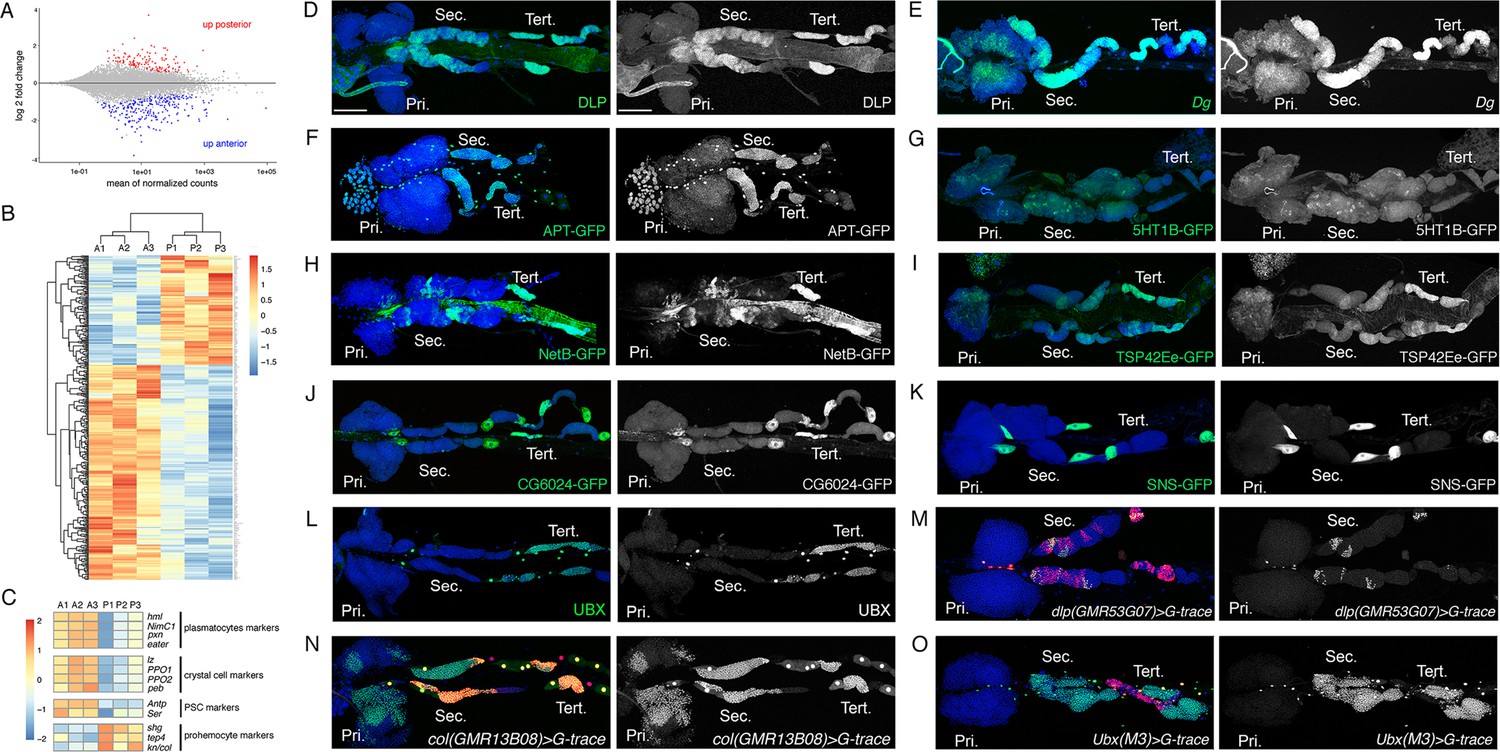
Characterization of the expression profile of the lymph gland anterior and posterior lobes and identification of new markers.
(A) MA-plot of DESeq2 results for RNA-seq data comparison between anterior and posterior lymph gland lobes dissected from wandering third instar larvae. Genes that are differentially expressed (adjusted p<0.01 and fold-change >1.5) are highlighted in red (up in posterior lobes) or blue (up in anterior lobes). (B) Heat map of differentially expressed genes between the anterior (A1, A2, and A3) and posterior (P1, P2, and P3) lobes RNA-seq samples. Hierarchical clustering was performed using R-Bioconductor. (C) Heat map of gene expression between anterior and posterior lobes for selected markers of lymph gland blood cell populations. (D–O) Third instar larvae whole lymph gland preparations showing the expression of the indicated genes or knock-in GFP fusions as revealed by immunostaining or RNA in situ (D–L) or the G-traced (green) and live (red) expression of the indicated Gal4 drivers (M–O). Nuclei were stained with DAPI (blue). The right-hand panels display the green channel only. Pri. indicates primary lobes, Sec. indicates secondary lobes, and Tert. indicates tertiary lobes. Scale bar: 100 µm.
Figure 2—figure supplement 1
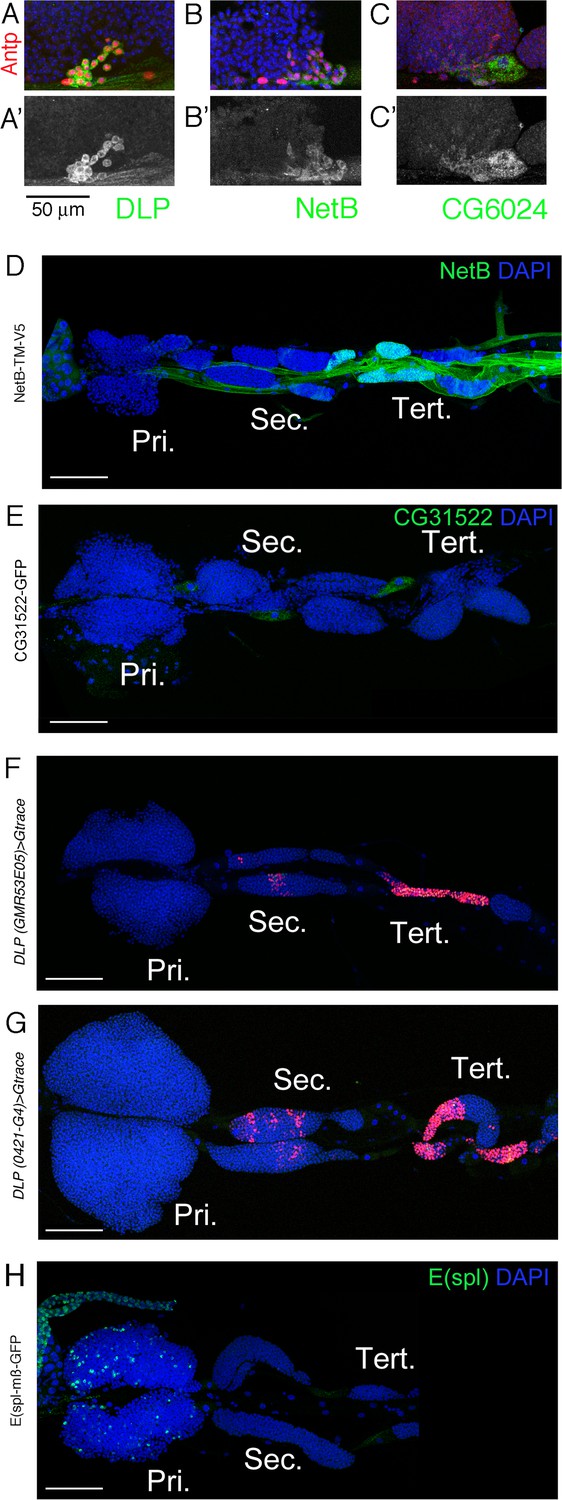
Expression of new markers in the lymph gland.
(A–C) High magnification views of the posterior tip of the anterior lobe in wandering third instar larval lymph glands show that Dlp (A, green), NetB-GFP (B, green), and CG6024-GFP (C, green) are expressed in the posterior signaling center (PSC), as revealed by Antp immunostaining (red). (A’–C’) show the green channel only. Scale bar: 50 µm. (D–H) Third instar larvae whole lymph gland preparations showing the expression of NetB-TM-V5, CG31522-GFP, E(spl)mß-HLH-GFP or dlp enhancers GMR35E05 and 0421-G4 as revealed by immunostaining against V5 (D, green) or GFP (E and H, green) or by G-trace (F and G, red). (H) E(spl)mß-HLH-GFP used as a control for genes overexpressed in the primary lobes. Pri. indicates primary lobes, Sec. indicates secondary lobes, and Tert. indicates tertiary lobes. (D–H) Scale bar: 100 µm. (A–H) Nuclei were stained with DAPI (blue).
Figure 3
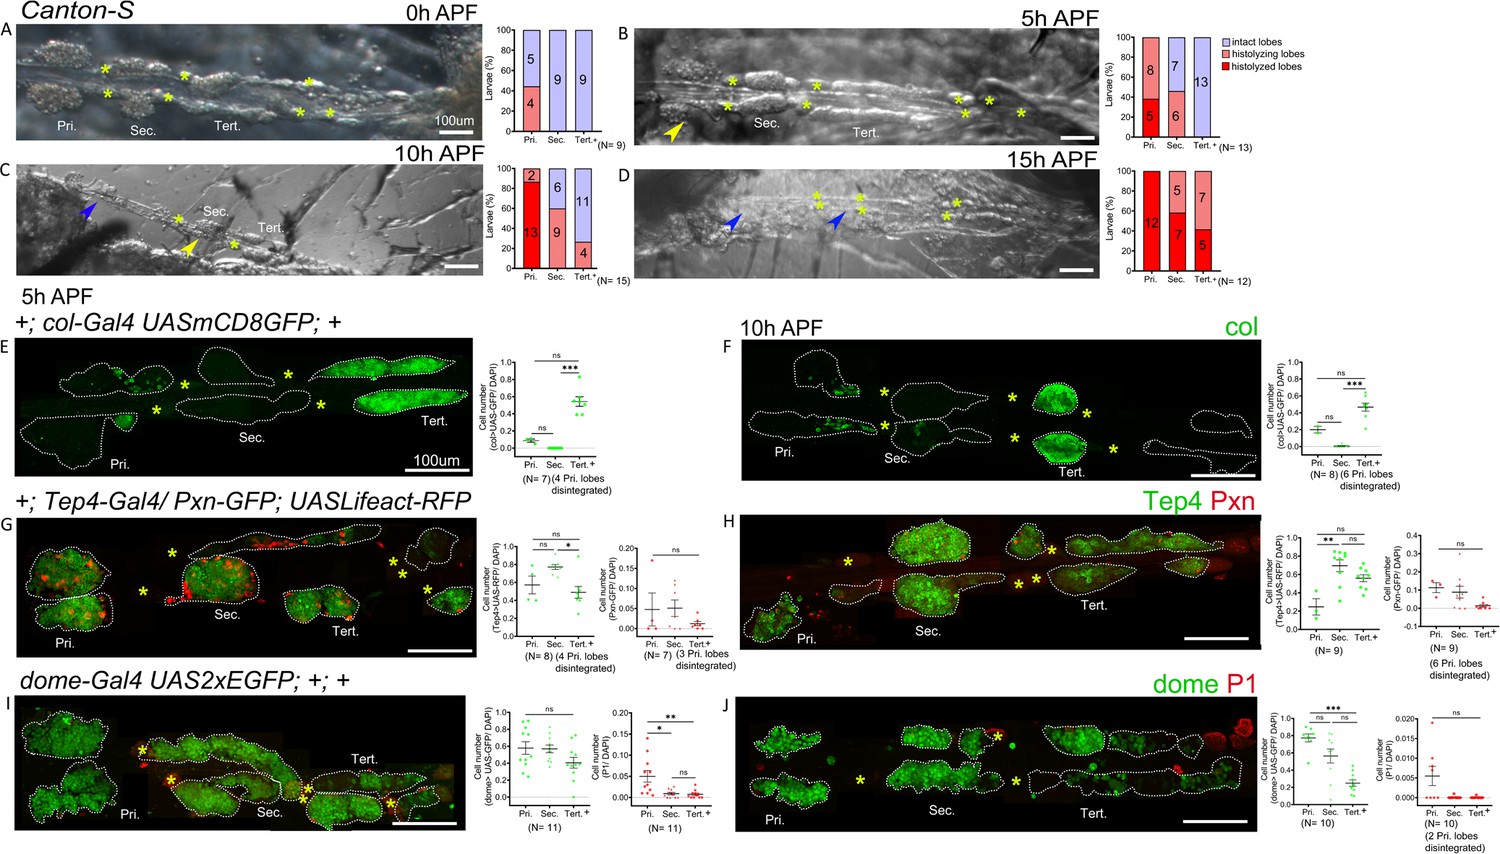
Gene expression analysis in the pupal lymph gland.
(A–D) Whole lymph gland hemi-dissected preparations indicating lobe histolysis during pupal development at 0 hr after pupa formation (APF), 5 hr APF, 10 hr APF, and 15 hr APF. (A–D) Yellow arrowheads indicate histolyzing lobes and blue arrowheads indicate histolyzed lobes. (E and F) col-Gal4,UASmCD8-GFP (green) is expressed in the posterior signaling center (PSC) and tertiary lobes during 5 hr APF, 10 hr APF. (G and H) 5 hr APF and 10 hr APF lymph glands express Tep4-Gal4> UASlifeact-RFP (green, pseudo color) in the primary lobes and posterior lobes; very few cells express Pxn-GFP (red pseudo color) in the primary and posterior lobes. (I and J) 5 hr APF, 10 hr APF lymph glands express dome-Gal4,UAS2xEGFP (green) in the primary lobes and posterior lobes, very few cells express P1 (red). Quantification panels indicate ratios of col+/DAPI+ (E and F) or Tep4+/DAPI+ or Pxn+/DAPI+ (G and H) and dome+/DAPI+ or P1+/DAPI+ (I and J) at the indicated time points. (E–J) Kruskal–Wallis test was used for statistical analysis. *p<0.05, **p<0.01, ***p<0.001, ns: nonsignificant, and error bars represent SEM. (A–J) Yellow asterisks indicate pericardial cells, and (E–J) nuclei were stained with DAPI (not shown for clarity). Pri. indicates primary lobes, Sec. indicates secondary lobes, and Tert. indicates tertiary lobes. (A–J) Scale bar: 100 µm.
-
Figure 3—source data 1
Numerical data plotted and statistical analysis related to Figure 3.
- https://cdn.elifesciences.org/articles/61409/elife-61409-fig3-data1-v2.xlsx
Figure 4 with 2 supplements
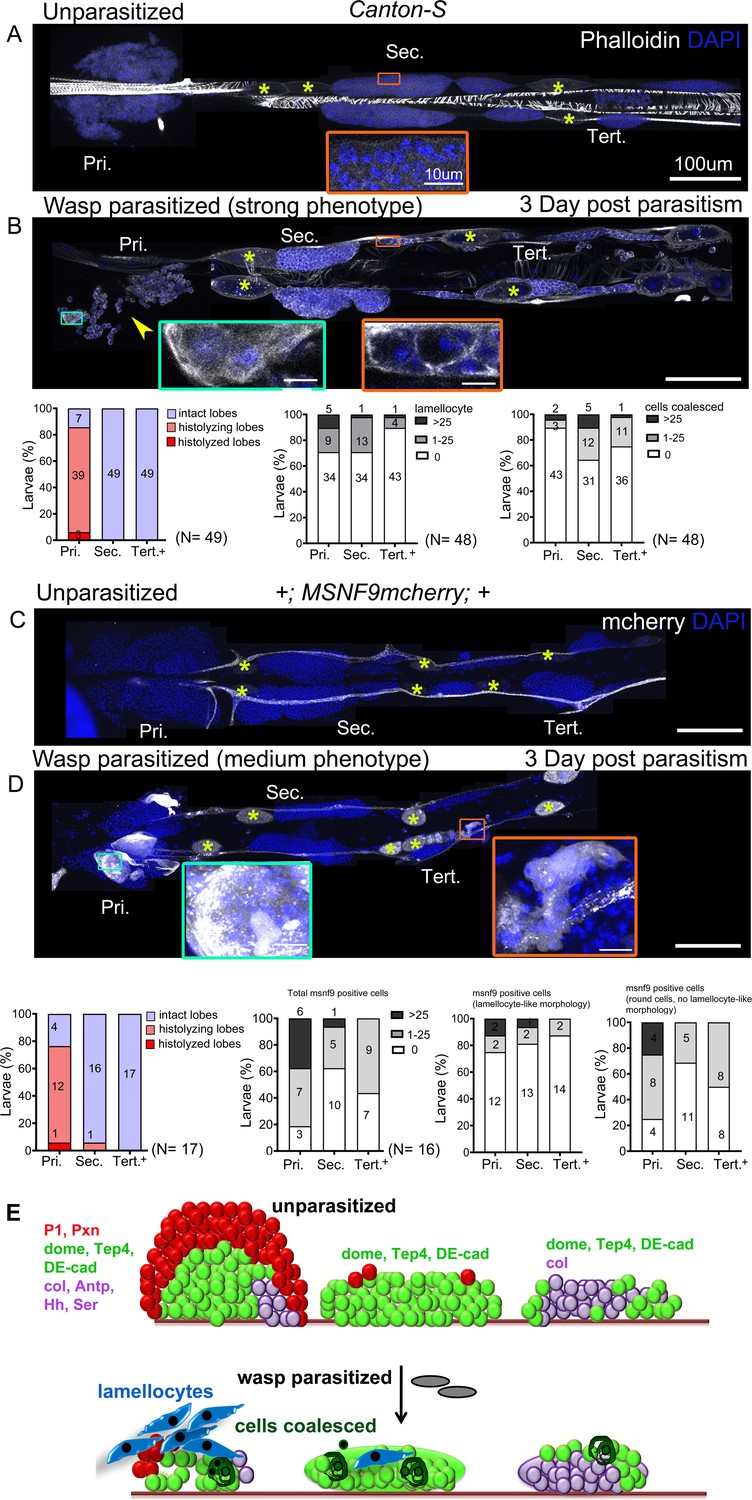
Lymph gland progenitor response to wasp parasitism.
(A and B) Canton-S wild-type strain lymph gland lobes were analyzed 3 days post-parasitism by L. boulardi. Age-matched unparasitized larvae were used as controls. Phalloidin (white) marks actin and was used for identifying lamellocytes as well as changes in cell morphology. (B) Yellow arrowhead indicates disintegrating primary lobes, green inset shows lamellocyte formation in the primary lobes, and orange inset displays compromised cell boundaries in the secondary lobes. (C and D) MSNF9-mcherry larvae were analyzed for lamellocyte formation 3 days post-parasitism. Green and orange insets show lamellocytes in the primary and the posterior lobes, respectively. For quantifications, nuclei showing lamellocyte morphology (phalloidin) or lamellocyte marker expression (MSNF9-mCherry, white pseudo color) were manually counted. Graphs indicate quantification for the cellular phenotypes: premature histolysis of lymph gland lobes, lamellocyte induction, or compromised cell boundaries. Pri. indicates primary lobes, Sec. indicates secondary lobes, and Tert. indicates tertiary lobes. Yellow asterisks indicate pericardial cells. (E) Schematic representation of the lymph gland response to wasp parasitism. (A–D) Scale bars: 100 µm or 10 µm in inset.
-
Figure 4—source data 1
Numerical data plotted and statistical analysis related to Figure 4.
- https://cdn.elifesciences.org/articles/61409/elife-61409-fig4-data1-v2.xlsx
Figure 4—figure supplement 1
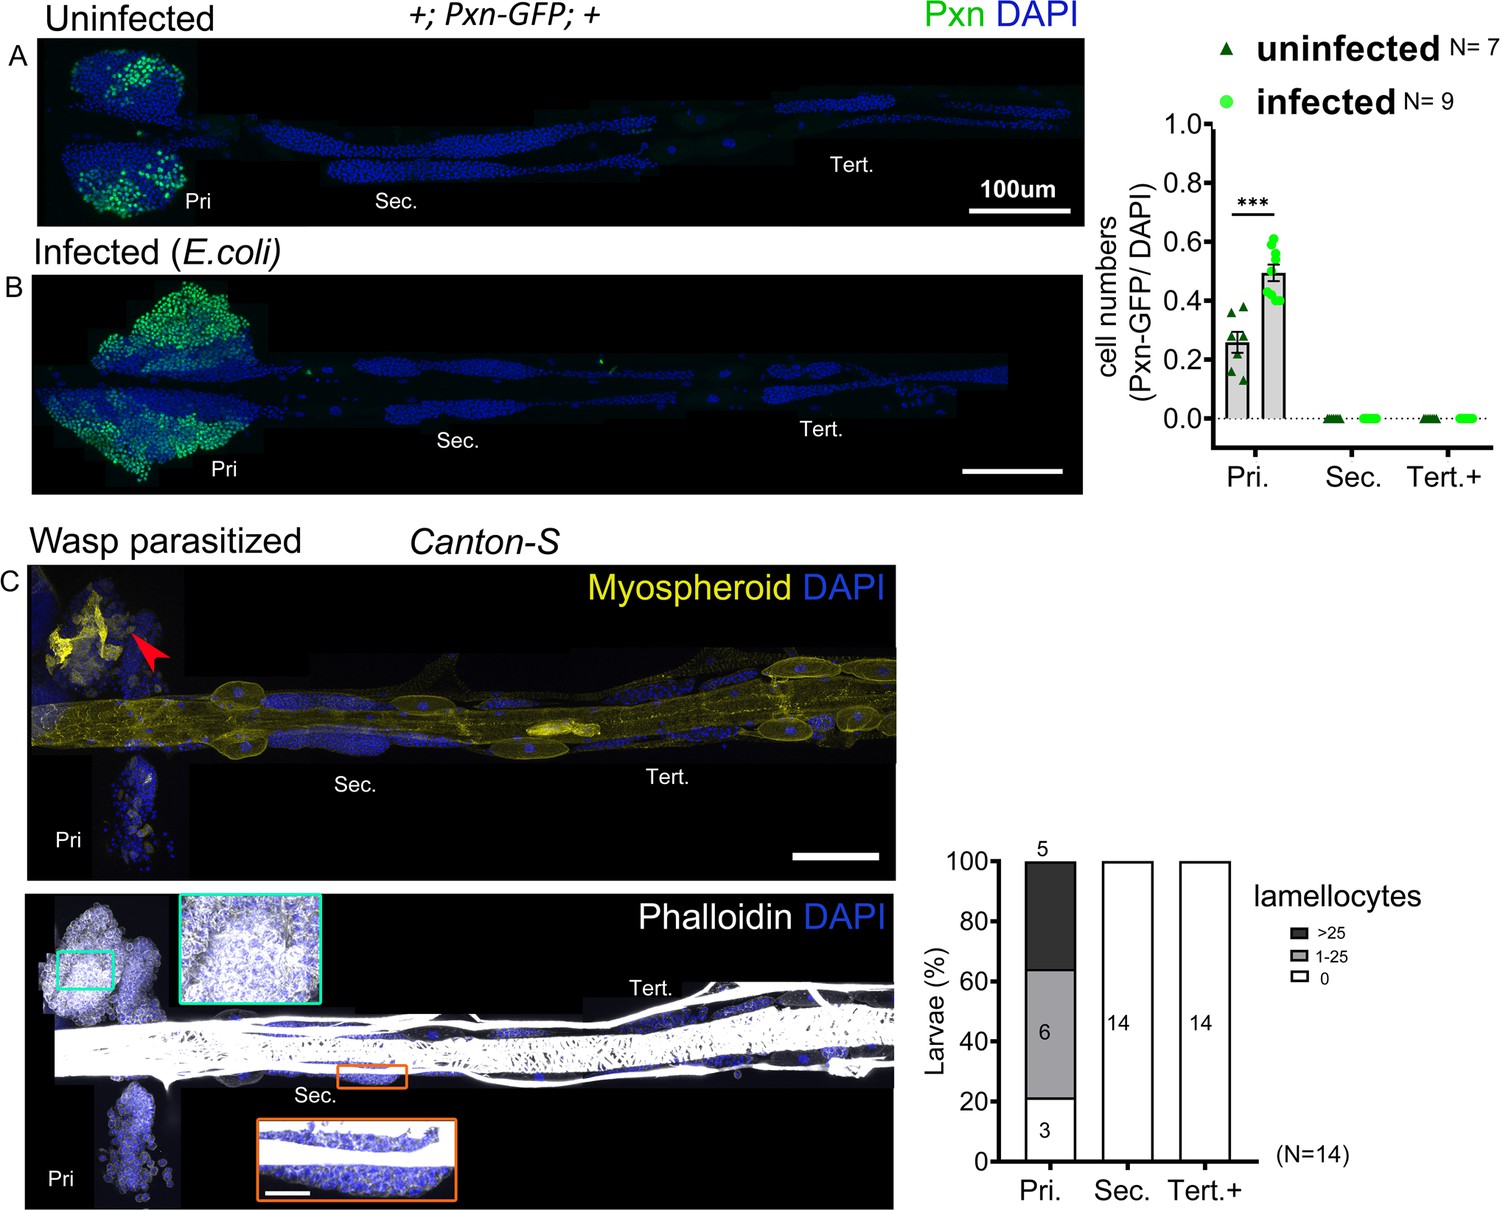
Posterior progenitors (PP) do not differentiate in response to E. coli infection and wasp parasitism.
(A and B) Primary lobes show increased expression of Pxn-GFP (green) in response to E. coli infection whereas PP are maintained. Graph indicates ratio of Pxn+/DAPI+ cells. Mann–Whitney nonparametric test was used for statistical analysis and error bars represent SEM. (C) Lymph gland response 2 days post-parasitism by L. boulardi. Immunostaining against the ß-integrin Myospheroid (yellow) reveals lamellocyte differentiation (red arrowhead). Phalloidin (white) marks actin. Green and orange insets: high magnification views of the primary and secondary lobes, respectively. Pri. indicates primary lobes, Sec. indicates secondary lobes, and Tert. indicates tertiary lobes. Graph indicates quantification for lamellocyte induction. ***p<0.001 and ns indicates nonsignificant. (A–C) Scale bar: 100 µm.
-
Figure 4—figure supplement 1—source data 1
Numerical data plotted and statistical analysis related to Figure 4—figure supplement 1.
- https://cdn.elifesciences.org/articles/61409/elife-61409-fig4-figsupp1-data1-v2.xlsx
Figure 4—figure supplement 2
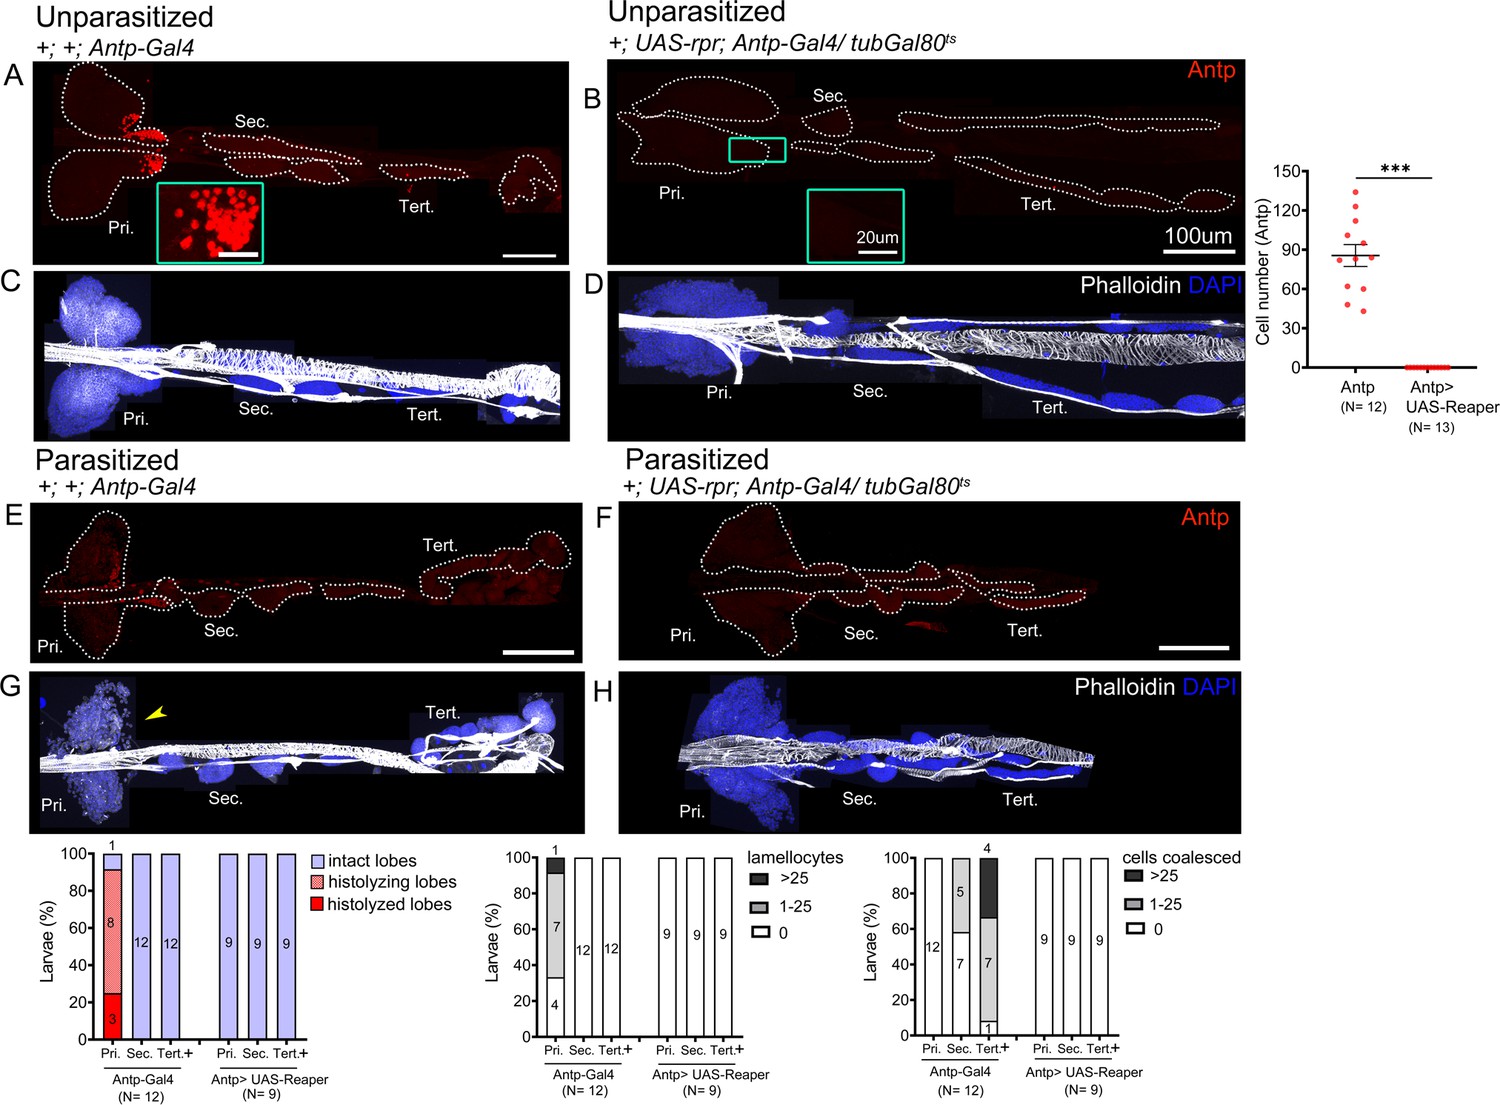
Posterior signaling center (PSC)-less lymph glands do not differentiate in response to wasp parasitism.
(A–D) Unparasitized and (E–H) parasitized lymph glands analyzed 4 days post-parasitism. Antennapedia (red) is expressed in the PSC (A and E) and is absent in PSC-ablated lymph glands (B and F). (A and B) Green inset shows PSC and graph shows quantification for Antp+ cells in PSC ablated larvae as compared to controls in unparasitized conditions. Mann–Whitney nonparametric test was used for statistical analysis. (H) PSC-ablated lymph glands do not form lamellocytes and cell coalescence is inhibited in response to wasp parasitism as compared to parasitized control lymph glands (G). For quantifications, nuclei of cells showing lamellocyte morphology (phalloidin) (white) were manually counted. Graphs indicate quantification for the cellular phenotypes: premature histolysis of lymph gland lobes, lamellocyte induction, or compromised cell boundaries. Yellow arrowheads indicate histolyzing lobes. Pri. indicates primary lobes, Sec. indicates secondary lobes, and Tert. indicates tertiary lobes. ***p<0.001. (A–H) Scale bar: 100 µm or 20 µm in inset.
-
Figure 4—figure supplement 2—source data 1
Numerical data plotted and statistical analysis related to Figure 4—figure supplement 2.
- https://cdn.elifesciences.org/articles/61409/elife-61409-fig4-figsupp2-data1-v2.xlsx
Figure 5 with 2 supplements
Posterior progenitors activate STAT in response to wasp parasitism.
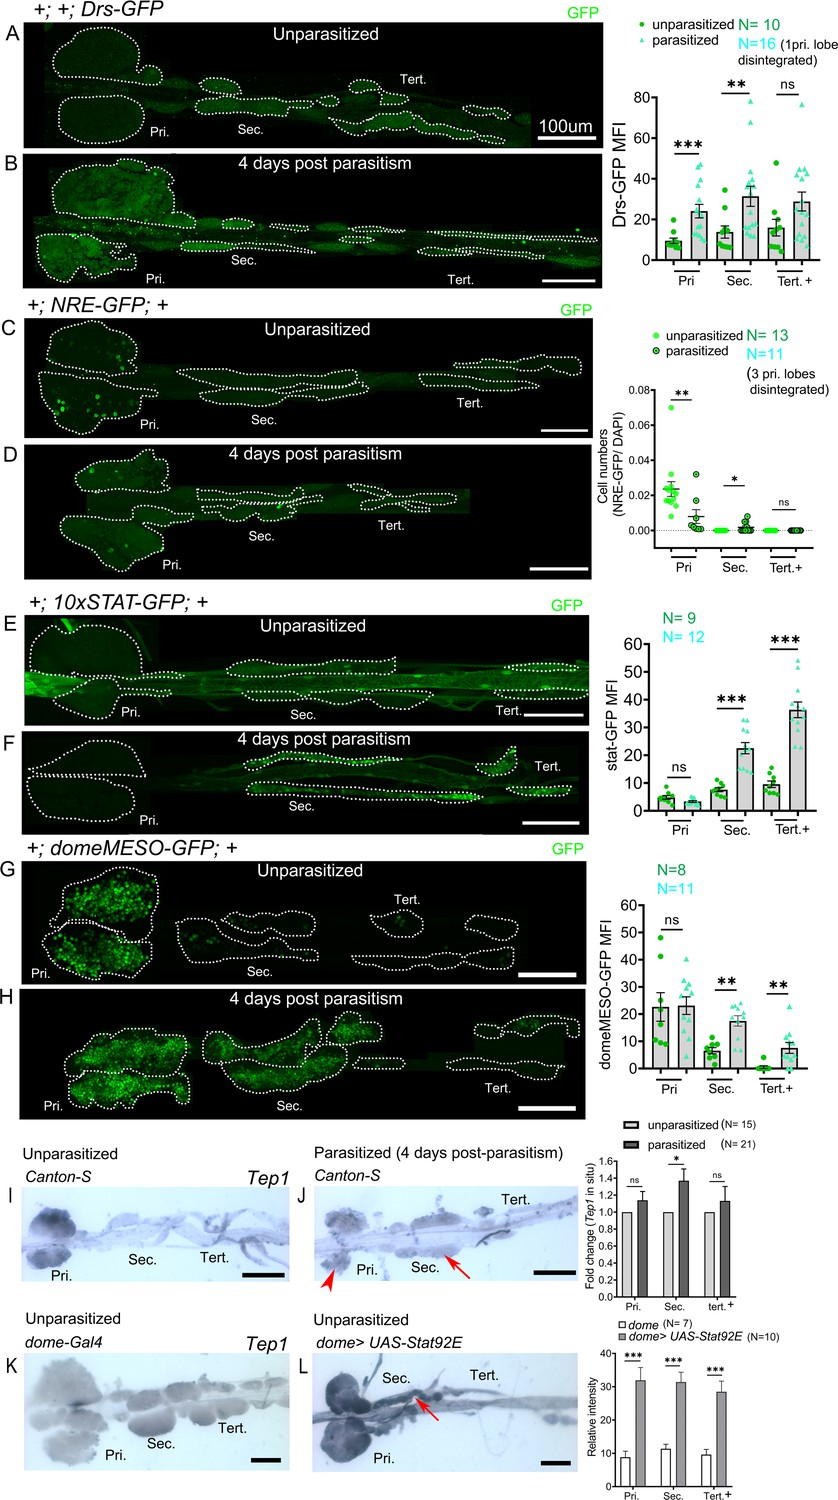
(A–H) Toll/NF-kB or Notch or JAK-STAT signaling reporter activity (green) in the lymph gland lobes analyzed in age-matched unparasitized and 4 days post-parasitism larvae. (A and B) Toll/NF-kB reporter activity monitored using Drosomycin-GFP (Drs-GFP) expression. Graph represents mean fluorescence intensity (MFI) for Drs-GFP. Mann–Whitney nonparametric test was used for statistical analysis. (C and D) Notch activity monitored using Notch responsive element (NRE-GFP) reporter activity. Graph represents ratio of NRE-GFP+/DAPI+ cells. Mann–Whitney nonparametric test was used for statistical analysis. (E–H) JAK-STAT activity monitored using 10xSTAT-GFP (E and F) or domeMESO-GFP (G and H) reporter. Graph represents MFI for 10xSTAT-GFP or domeMESO-GFP. Mann–Whitney nonparametric test was used for statistical analysis. (I and J) RNA in situ hybridization shows that Tep1 expression is induced in the secondary lobes (red arrow) post-parasitism as compared to unparasitized larval lymph glands. (J) Red arrowhead indicates disintegrating primary lobes. (K and L) Overexpression of Stat92E leads to transcriptional induction of Tep1 (red arrow) in unparasitized conditions. Student's t-test was used for statistical analysis. Error bars represent SEM. *p<0.05, **p<0.01, ***p<0.001, and ns indicates nonsignificant. Pri. indicates primary lobes, Sec. indicates secondary lobes, and Tert. indicates tertiary lobes. (A–L) Scale bars: 100 µm.
-
Figure 5—source data 1
Numerical data plotted and statistical analysis related to Figure 5.
- https://cdn.elifesciences.org/articles/61409/elife-61409-fig5-data1-v2.xlsx
Figure 5—figure supplement 1
JAK-STAT reporter activity in response to wasp parasitism.
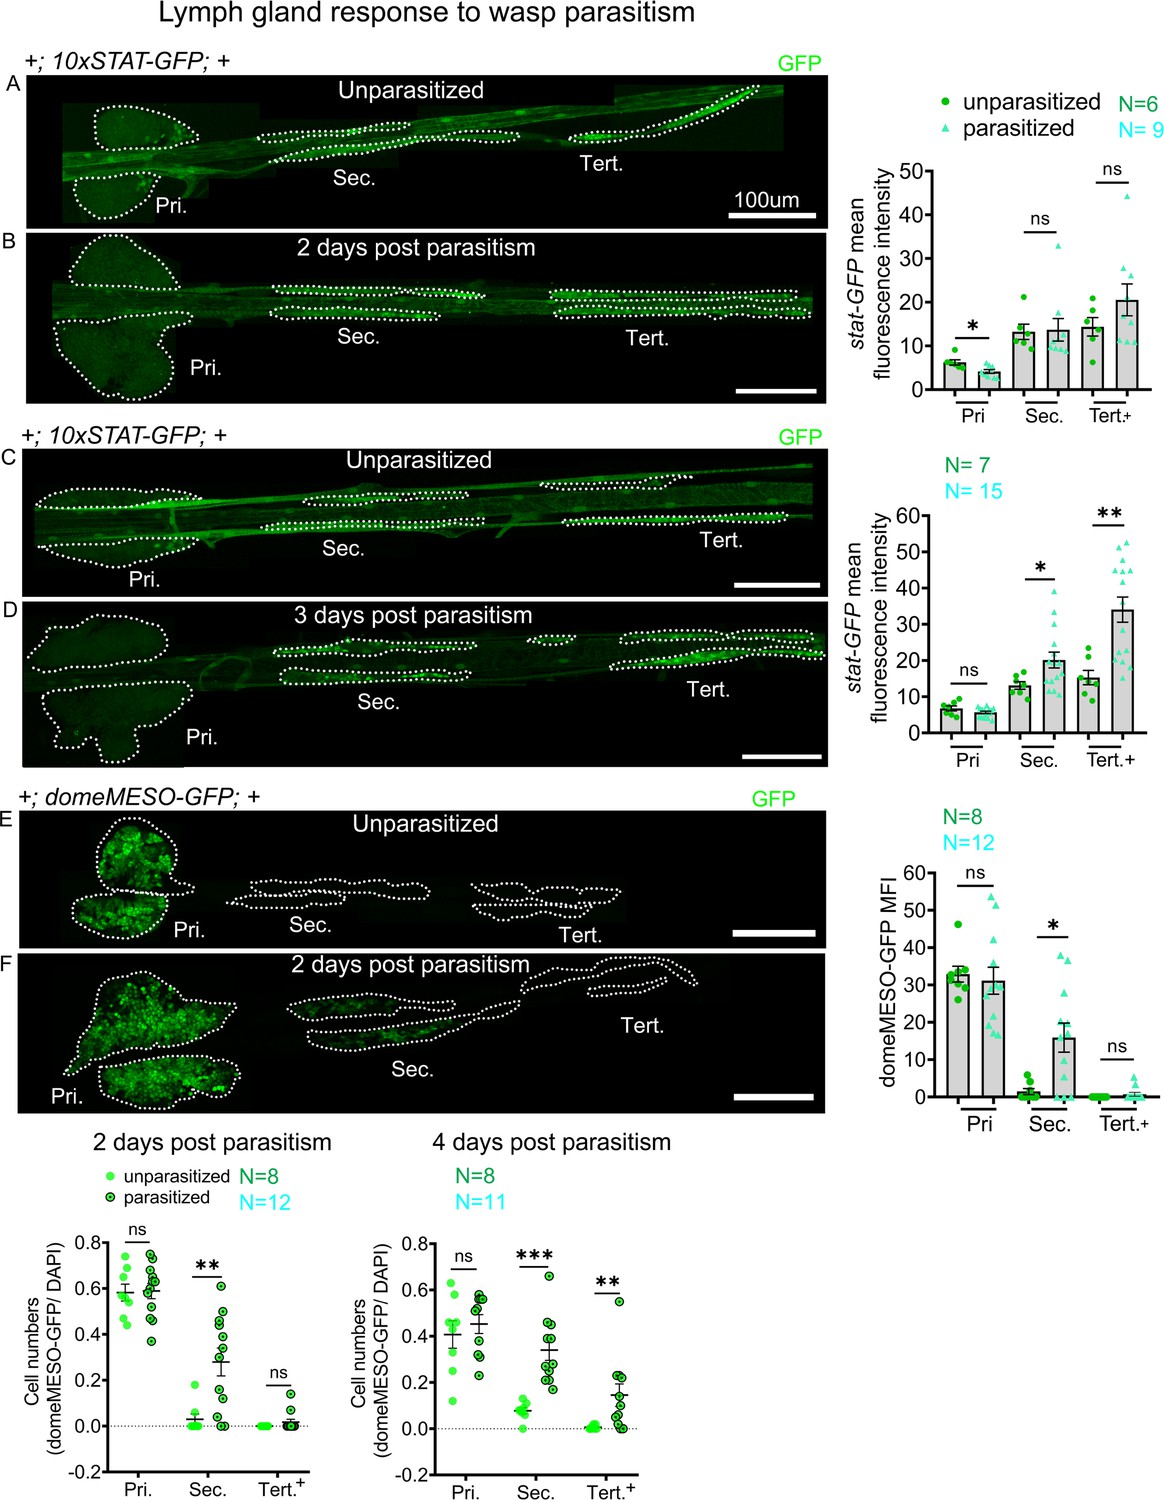
JAK-STAT activity is monitored using 10xSTAT-GFP (A–D) and domeMESO-GFP (E and F) reporter. Reporter activity in the lymph gland lobes is compared and quantified between age-matched unparasitized and parasitized larvae at the indicated time points. (A and B) 2 days post-parasitism 10xSTAT-GFP reporter activity (green) decreases in the primary lobes and remains unchanged in the posterior lobes. (C and D) 3 days post-parasitism 10xSTAT-GFP activity (green) increases in the posterior lobes. Graphs representing the mean fluorescence intensity (MFI) for 10xSTAT-GFP are plotted for each time point. (E and F) 2 days post-parasitism domeMESO-GFP reporter activity (green) remains unchanged in the primary lobes and the tertiary lobes but increases in the secondary lobes. Graphs representing ratio of domeMESO-GFP+/DAPI+ cells and MFI are plotted. Mann–Whitney nonparametric test was used for statistical analysis and error bars represent SEM. *p<0.05, **p<0.01, ***p<0.001, and ns indicates nonsignificant. Pri. indicates primary lobes, Sec. indicates secondary lobes, and Tert. indicates tertiary lobes. (A–F) Scale bar: 100 µm.
-
Figure 5—figure supplement 1—source data 1
Numerical data plotted and statistical analysis related to Figure 5—figure supplement 1.
- https://cdn.elifesciences.org/articles/61409/elife-61409-fig5-figsupp1-data1-v2.xlsx
Figure 5—figure supplement 2
10xSTAT-GFP reporter activity in response to bacterial infection and wasp egg mimic.
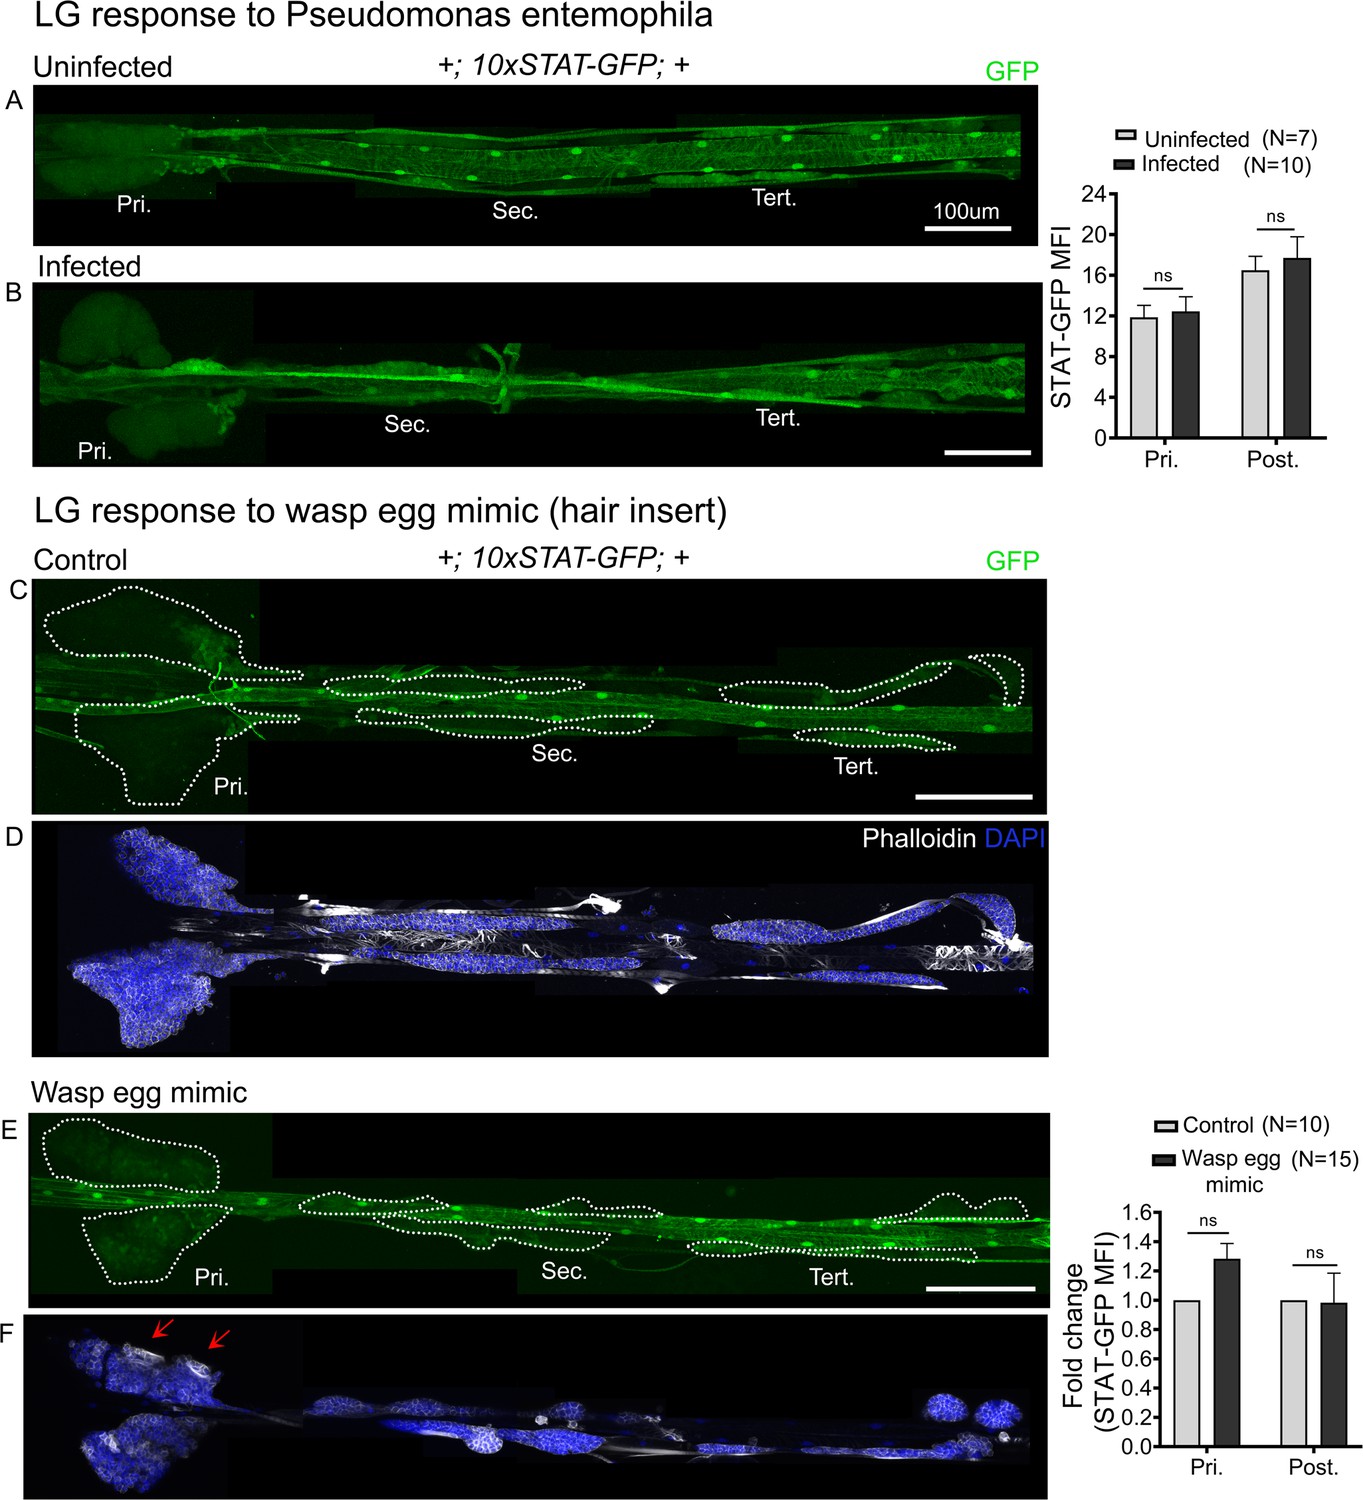
(A and B) 10xSTAT-GFP reporter activity (green) remains unchanged upon Pseudomonas entemophila infection. Uninfected larval lymph gland (A) compared with Pseudomonas entemophila infected lymph gland (B). Graph representing the mean fluorescence intensity (MFI) for 10xSTAT-GFP is plotted. Mann–Whitney nonparametric test was used for statistical analysis. (C–F) 10xSTAT-GFP reporter (green, C and E) and Phalloidin (white, D and F) in control (C and D) and wasp egg mimic conditions (E and F) show no change in reporter activity. (F) Lamellocytes in the primary lobes are shown (red arrows). Graphs represent MFI for 10xSTAT-GFP. Student's t-test is used for calculating fold change, error bars represent SEM. *p<0.05, **p<0.01, ***p<0.001, and ns indicates nonsignificant. Pri. indicates primary lobes, Sec. indicates secondary lobes, Tert. indicates tertiary lobes, and Post. indicates posterior lobes. (A–F) Scale bar: 100 µm.
-
Figure 5—figure supplement 2—source data 1
Numerical data plotted and statistical analysis related to Figure 5—figure supplement 2.
- https://cdn.elifesciences.org/articles/61409/elife-61409-fig5-figsupp2-data1-v2.xlsx
Figure 6 with 1 supplement
STAT limits lamellocyte differentiation in the posterior lobes.
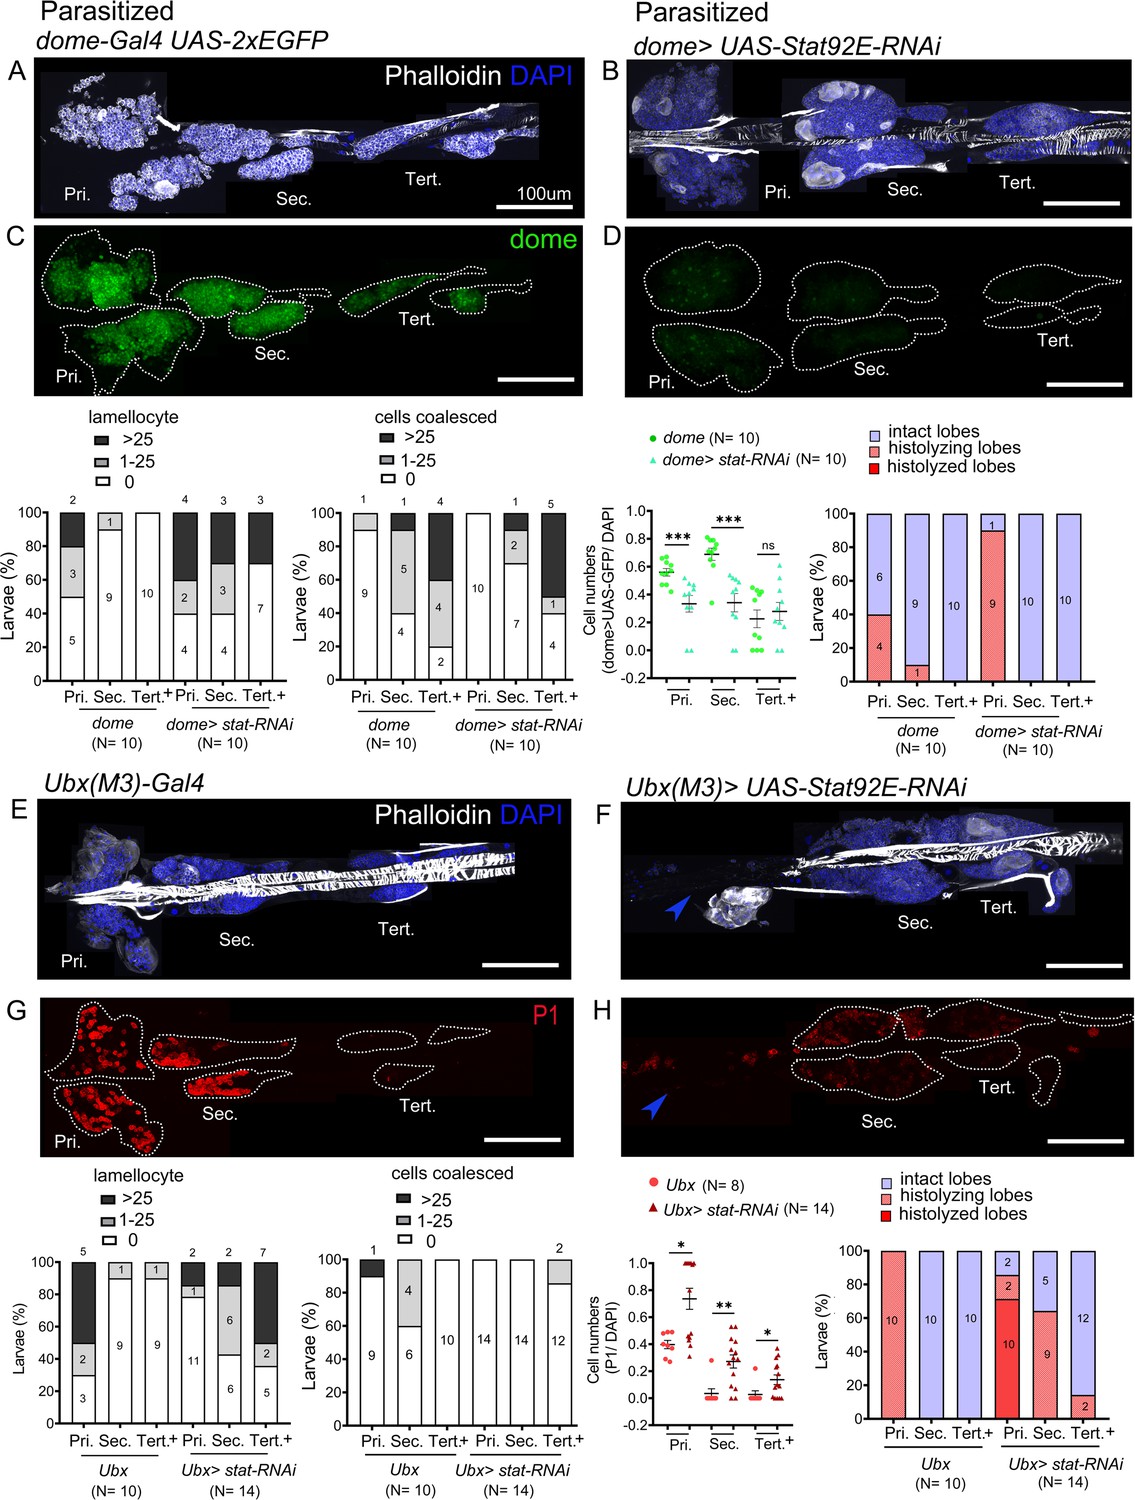
Lymph glands were analyzed 4 days post-parasitism, and age-matched parasitized larvae were used for comparison. (A–H) Phenotypes for targeted knockdown of Stat92E in the progenitor population are shown. (A–D) Stat92E knockdown in the progenitors is associated with massive lamellocyte differentiation in the posterior lobes as revealed by phalloidin staining (white) (A and B) and a reduction in the progenitor pool as indicated by dome-Gal4,UAS-2xEGFP (green) expression (C and D) in parasitized larvae. (E–H) Posterior progenitors (PP) specific knockdown of Stat92E induces lamellocyte and plasmatocyte differentiation in the posterior lobes following parasitism. Graphs indicate quantification for the phenotypes-lamellocyte induction, compromised cell boundaries, dome+ or P1+ relative cell number, and lobe histolysis. (F and H) Blue arrowheads indicate histolyzed lobes. Mann–Whitney nonparametric test was used for statistical analysis of dome and P1 and error bars represent SEM. *p<0.05, **p<0.01, ***p<0.001, and ns indicates nonsignificant. Pri. indicates primary lobes, Sec. indicates secondary lobes, and Tert. indicates tertiary lobes. (A–H) Scale bar: 100 µm.
-
Figure 6—source data 1
Numerical data plotted and statistical analysis related to Figure 6.
- https://cdn.elifesciences.org/articles/61409/elife-61409-fig6-data1-v2.xlsx
Figure 6—figure supplement 1

Stat92E is essential for survival post-parasitism.
(A and B) Percentage of survival in Stat92E perturbed conditions post-parasitism. (C–J) Targeted knockdown of Stat92E in unparasitized conditions is shown. (C–F) Stat92E knockdown in the progenitors does not lead to lamellocyte differentiation as revealed by phalloidin staining (white) (C and D) and does not affect the progenitor pool as indicated by dome-Gal4,UAS-2xEGFP (green) expression (E and F). (G–J) Posterior progenitors (PP) specific knockdown of Stat92E does not induce lamellocyte and plasmatocyte differentiation in the posterior lobes. Pri. indicates primary lobes, Sec. indicates secondary lobes, and Tert. indicates tertiary lobes. (C–J) Scale bar: 100 µm.
Figure 7 with 2 supplements
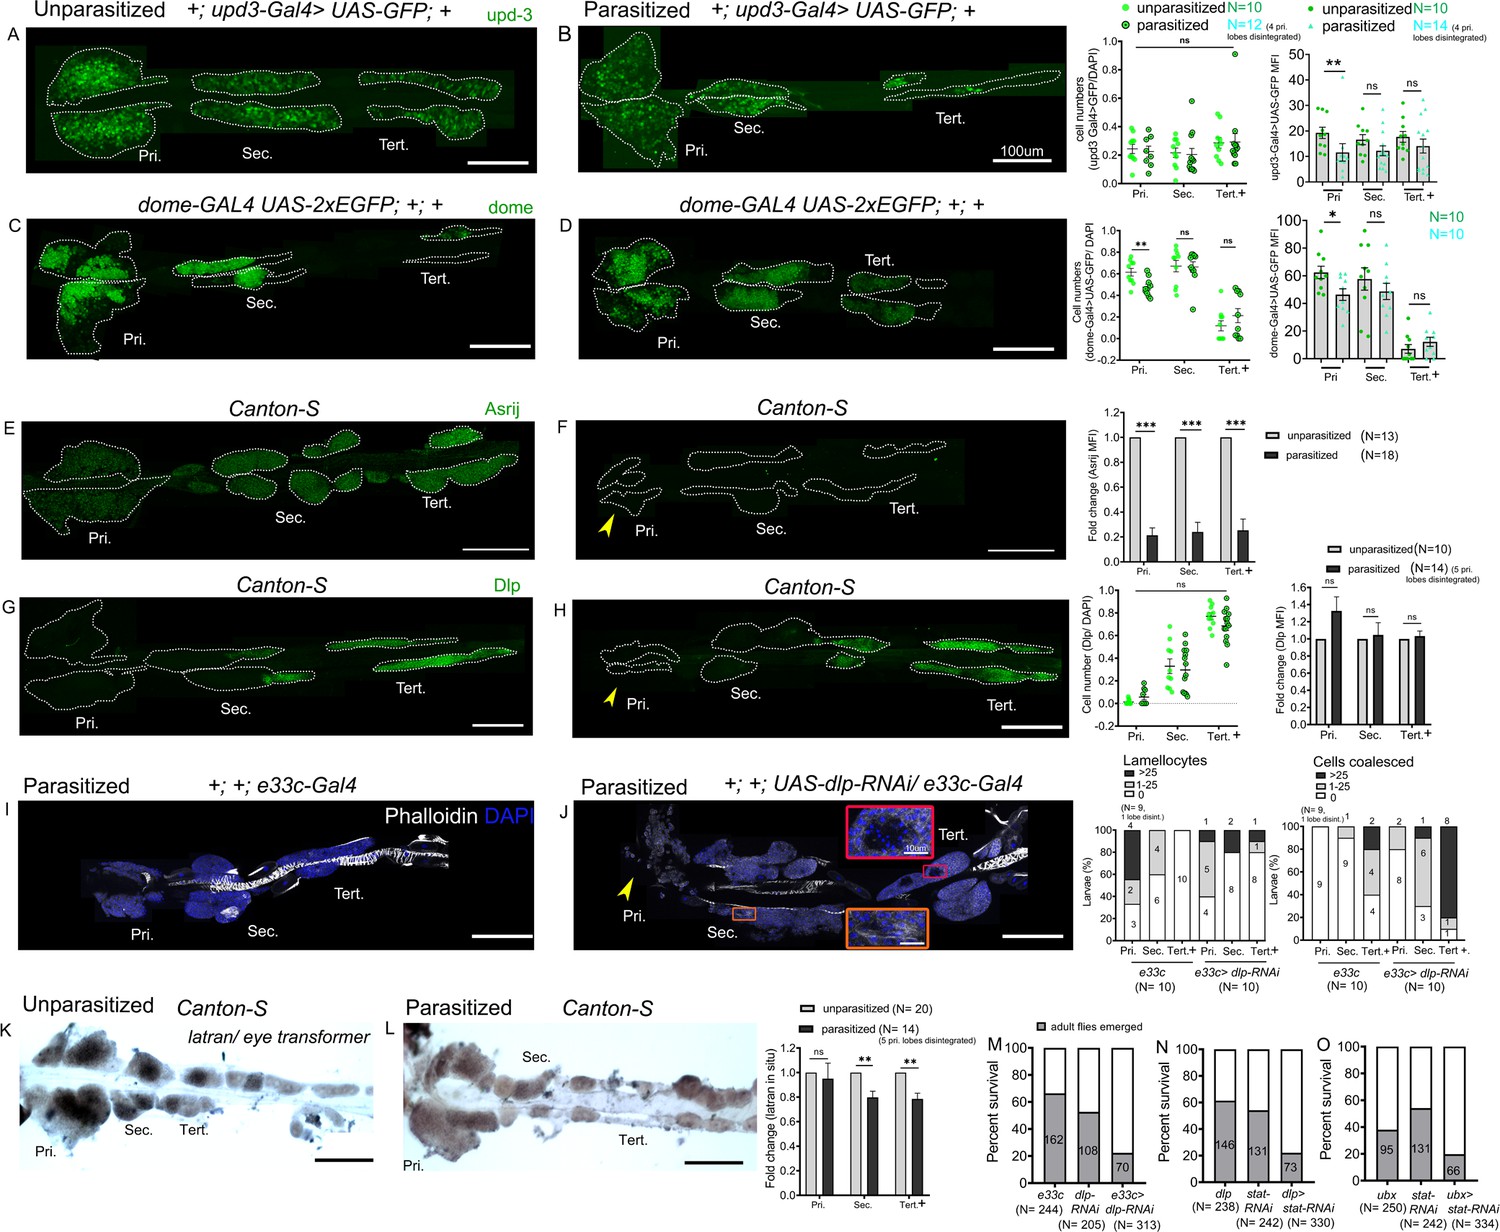
Differential regulation of the JAK-STAT inhibitor latran in anterior progenitors (AP) and posterior progenitors (PP) following parasitism.
Lymph glands were analyzed 4 days post-parasitism, and age-matched unparasitized larvae were used for analysis in each case. (A and B) upd3-Gal4> GFP (green) expression reduces in the primary lobe and remains unchanged in the posterior lobes in parasitized conditions. dome-Gal4 >2 xEGFP (green) expression in unparasitized (C) and parasitized (D) conditions show reduced expression of dome in the primary lobes post-parasitism. Graphs represent ratio of cells positive for each marker or mean fluorescence intensity (MFI) in the respective lobes. Mann–Whitney nonparametric test was used for statistical analysis. (E and F) show reduced expression of Asrij (green) in the lymph gland post-parasitism. Graph represents fold-change for MFI in the respective lobes; Student's t-test was used for statistical analysis. Dlp (green) expression remains unchanged in unparasitized (G) and parasitized (H) conditions. Graphs represent ratio of Dlp+/DAPI+ and MFI in the respective lobes. Mann–Whitney nonparametric test and Student's t-test were used for statistical analysis. (I and J) Targeted knockdown of dlp leads to lamellocyte formation and affects cell boundaries in the posterior lobes. Phalloidin (white) marks actin and is used for identifying lamellocytes and changes in cell morphology. (J) Orange inset shows lamellocyte formation in the secondary lobes and red inset displays compromised cell boundaries in the tertiary lobes. (K and L) RNA in situ hybridization for latran shows decreased expression in the PP post-parasitism. Graph represents fold-change; Student's t-test is used for statistical analysis. (M–O) indicate percentage of survival in JAK-STAT signaling perturbed conditions. (F, H, and J) Yellow arrowhead indicates disintegrating primary lobes. Error bars represent SEM. *p<0.05, **p<0.01, ***p<0.001, and ns indicates nonsignificant. Pri. indicates primary lobes, Sec. indicates secondary lobes, and Tert. indicates tertiary lobes. (A–L) Scale bar: 100 µm or 10 µm in inset.
-
Figure 7—source data 1
Numerical data plotted and statistical analysis related to Figure 7.
- https://cdn.elifesciences.org/articles/61409/elife-61409-fig7-data1-v2.xlsx
Figure 7—figure supplement 1
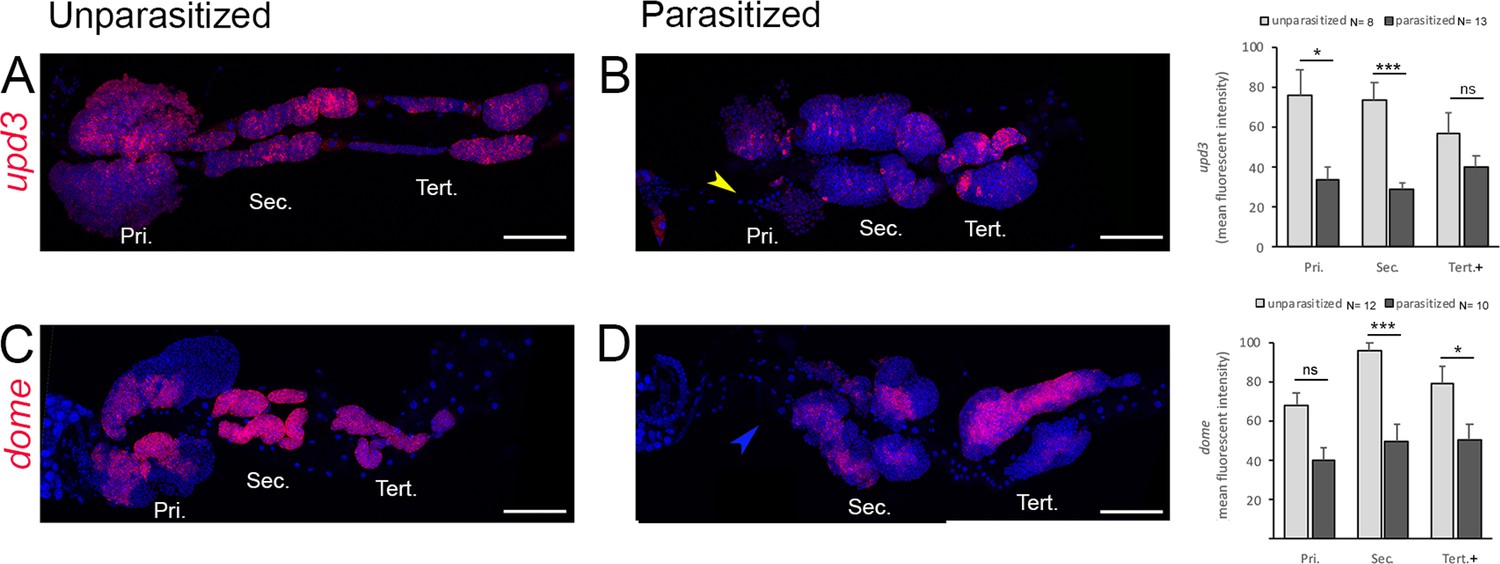
dome and upd3 transcripts are downregulated upon parasitism.
Whole lymph gland preparations showing the expression of upd3 (A and B) and dome (C and D) as revealed by RNA in situ in age-matched unparasitized (A and C) and parasitized (B and D) larvae. Graphs representing the mean-fluorescence intensity (MFI) are plotted to the right. Yellow arrowheads indicate histolyzing primary lobes and blue arrowheads indicate histolyzed primary lobes. Error bars represent SEM. Pri. indicates primary lobes, Sec. indicates secondary lobes, and Tert. indicates tertiary lobes. Student's t-test was used for statistical analysis. *p<0.05, **p<0.01, ***p<0.001, and ns indicates nonsignificant. (A–D) Scale bar: 100 µm.
-
Figure 7—figure supplement 1—source data 1
Numerical data plotted related to Figure 7—figure supplement 1.
- https://cdn.elifesciences.org/articles/61409/elife-61409-fig7-figsupp1-data1-v2.xlsx
Figure 7—figure supplement 2
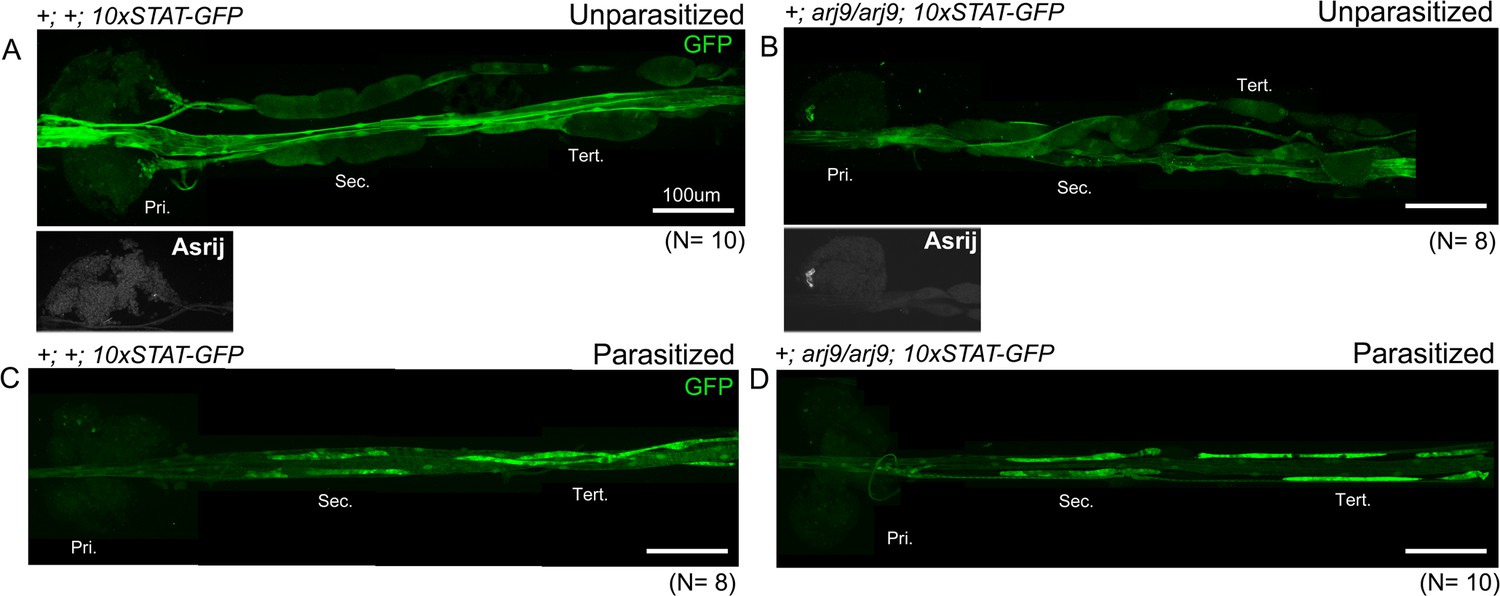
Asrij-independent upregulation of STAT activity in posterior progenitors following parasitism.
(A and B) asrij null mutants show reduced expression of 10xSTAT-GFP. (C and D) 10xSTAT-GFP activity increases in asrij null mutants following L. boulardi parasitism as compared to unparasitized controls. Pri. indicates primary lobes, Sec. indicates secondary lobes, and Tert. indicates tertiary lobes. (A–D) Scale bar: 100 µm.
Figure 8

Model depicting lymph gland progenitor heterogeneity and response to immune challenge.
Schematics showing the entire Drosophila third instar (wandering) larval lymph gland. Uninfested – primary lobe is demarcated into the niche/PSC (purple), progenitor/MZ (green), and differentiated/CZ (red) zones. Posterior lobes harbor a heterogeneous progenitor pool that is not segregated into zones. Posterior progenitor (PP) markers identified from this study are indicated in light blue (extracellular ligands, matrix components, and receptors) or black (transcription factors) font. The status of JAK-STAT signaling is indicated below for each lobe. Upon wasp infestation, JAK-STAT pathway is downregulated in anterior progenitors leading to lamellocyte differentiation (dark blue) and histolysis. Systemic signals lead to production of ligands such as Upd (pink) that may be selectively trapped by extracellular matrix components such as Dlp around the posterior lobes (light blue border), leading to increased JAK-STAT signaling, in an Asrij-independent and Latran-dependent manner. PPs are maintained and few coalesced cells are seen (dark green). Pri. indicates primary lobes, Sec. indicates secondary lobes, and Tert. indicates tertiary lobes. PSC: posterior signaling center; MZ: medullary zone; CZ: cortical zone.
Tables
Table 1
Main terms enriched in gene ontology (GO) analysis.
| Up in anterior lobes | Up in posterior lobes | |||
|---|---|---|---|---|
| p-value | #genes | p-value | # genes | |
| GO-term biological processes | ||||
| Response to stimulus | 6,88E-10 | 92 | 1,24E-05 | 47 |
| Extracellular matrix (ECM) organization | 1,97E-09 | 11 | ns | 0 |
| Immune system process | 1,09E-07 | 26 | ns | 4 |
| Cell–cell adhesion | ns | 6 | 9,75E-10 | 12 |
| Nephrocyte filtration | ns | 0 | 1,88E-07 | 0 |
| Neurogenesis | 1,30E-04 | 34 | 8,88E-06 | 20 |
| GO-term cellular components | ||||
| Collagen-containing ECM | 2,21E-13 | 10 | ns | 1 |
| Cell–cell junction | ns | 5 | 3,28E-06 | 8 |
| Nephrocyte diaphragm | ns | 0 | 2,15E-06 | 4 |
Additional files
-
Supplementary file 1
List of genes expressed in the lymph gland anterior and/or posterior lobes.
The expression level of each gene (RPKM values) in each of the six RNA-seq samples (three anterior lobes and three posterior lobes) is indicated. Only genes with a FPKM ≥1 in all three samples of the anterior lobes or of the posterior lobes are considered.
- https://cdn.elifesciences.org/articles/61409/elife-61409-supp1-v2.xlsx
-
Supplementary file 2
List of differentially expressed genes between posterior and anterior lobes (p<0.01, fold change >1.5).
Blue: genes overexpressed in the posterior lobes. Red: genes overexpressed in the anterior lobes.
- https://cdn.elifesciences.org/articles/61409/elife-61409-supp2-v2.xlsx
-
Supplementary file 3
Over-represented GO categories (Biological Processes, Cellular Components, Molecular functions) among genes overexpressed in the anterior or posterior lobes.
- https://cdn.elifesciences.org/articles/61409/elife-61409-supp3-v2.xls
-
Transparent reporting form
- https://cdn.elifesciences.org/articles/61409/elife-61409-transrepform-v2.pdf
Download links
A two-part list of links to download the article, or parts of the article, in various formats.
Downloads (link to download the article as PDF)
Open citations (links to open the citations from this article in various online reference manager services)
Cite this article (links to download the citations from this article in formats compatible with various reference manager tools)
Differential activation of JAK-STAT signaling reveals functional compartmentalization in Drosophila blood progenitors
eLife 10:e61409.
https://doi.org/10.7554/eLife.61409


