Structural basis of ClpXP recognition and unfolding of ssrA-tagged substrates
- Departments of Biology, Massachusetts Institute of Technology, United States
- Chemistry, Massachusetts Institute of Technology, United States
Figures
Figure 1 with 3 supplements

ClpXP complexes with ssrA degrons.
(A) Side and top views of the composite cryo-EM density from the recognition complex. (B) The upper portion of the panel shows transparent density for the ssrA degron (stick representation) in the recognition and intermediate complexes; the lower portion shows the offset positions of the ssrA degron (space-filling representation) in the channel of ClpX (cartoon representation) in both complexes after removal of subunit F. In this and all subsequent figures, ClpX is colored blue, green, or purple; ClpP is yellow; and substrate is orange/gold.
Figure 1—figure supplement 1

Cryo-EM data and strategy.
Data processing workflow. EM images contained singly capped complexes (one ClpX hexamer bound to one ClpP tetradecamer) or doubly capped complexes (two ClpX hexamers bound to one ClpP tetradecamer). Singly capped complex (red boxes) were selected for further refinement and classification. The recognition and intermediate complexes accounted for 92% of all of the singly capped complexes.
Figure 1—figure supplement 2
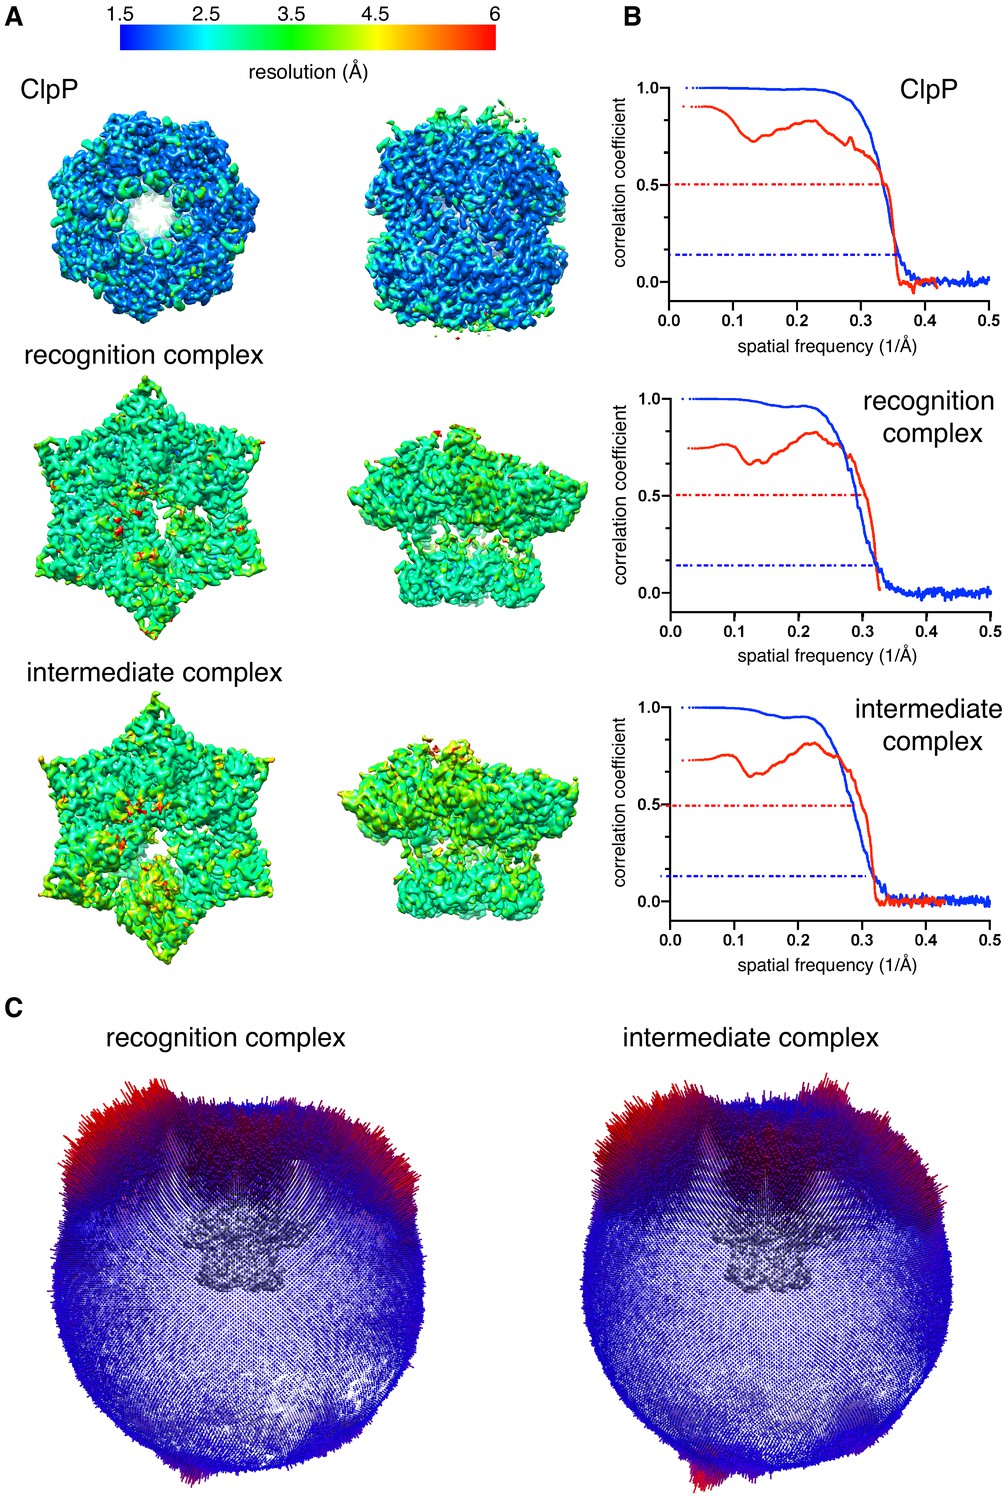
Cryo-EM data validation.
(A) Density maps of ClpP, the recognition complex, and the intermediate complex are colored by local resolution. (B) Fourier Shell Correlation (FSC) plots of half maps (blue) or model-map (red). Dashed lines show a cut-off value of 0.143 (blue) or 0.5 (red). Resolutions reported are for a half map FSC of 0.143. (C) Euler-angle orientation distribution for the recognition and intermediate complexes.
Figure 1—figure supplement 3
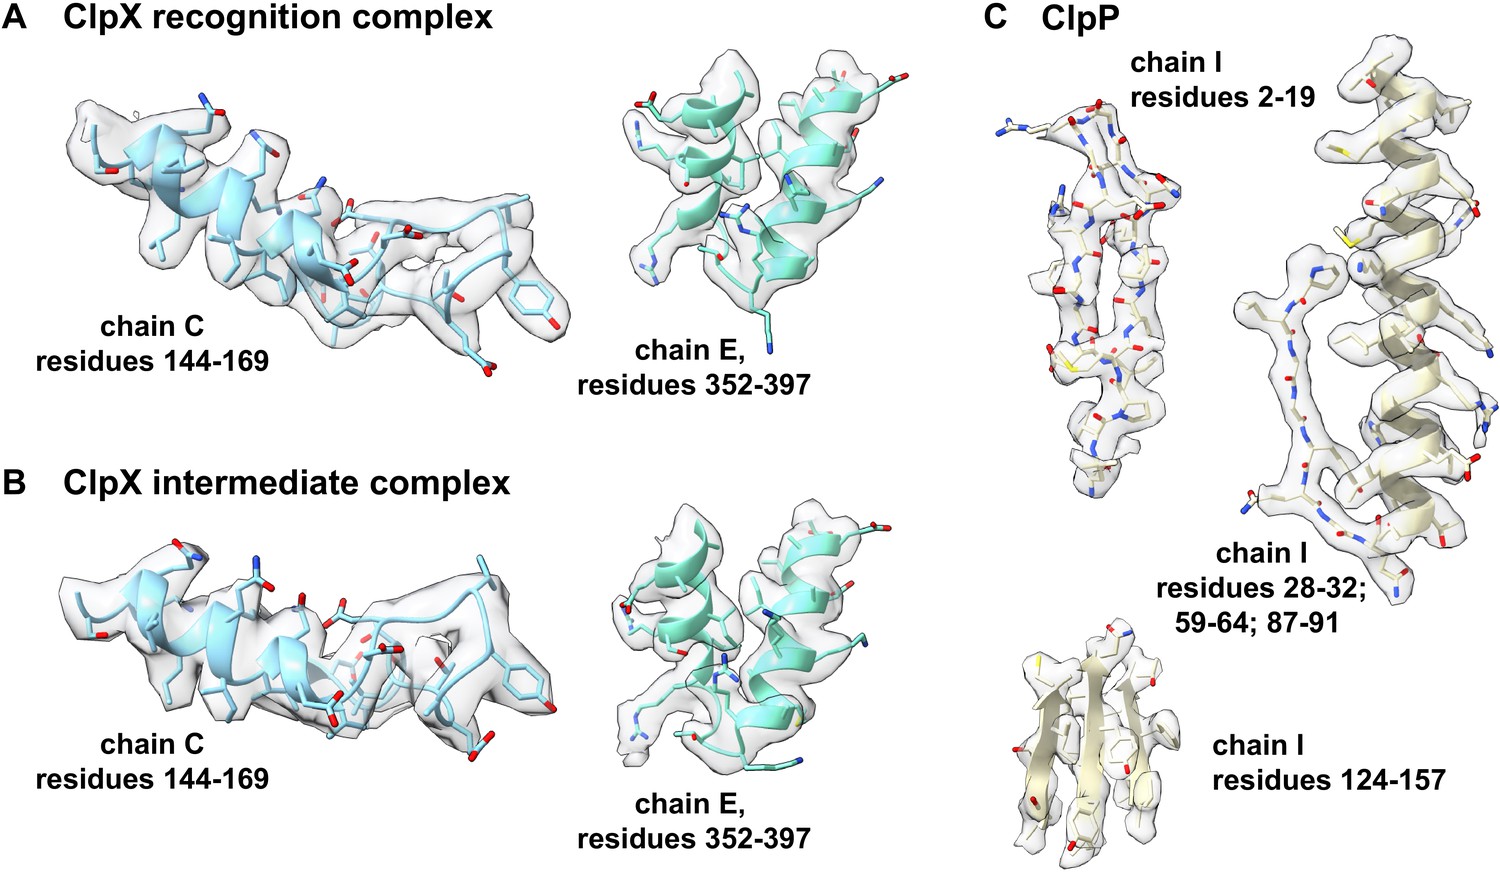
Representative density.
Density for portions of the ClpX component of the recognition complex is shown in panel (A); for the ClpX component of the intermediate complex in panel (B); and for ClpP in panel (C).
Figure 2 with 2 supplements

ClpX-degron interactions.
(A) Positions of the RKH loop (blue), pore-1 loop (red), and pore-2 loop (green) in subunit A of the ClpX hexamer in the recognition complex relative to the positions of the ssrA degron (orange/gold). (B) Cutaway views of the recognition complex (left) and intermediate complex (right). In the recognition complex, the pore-2 loop of ClpX subunit A (denoted by red arrows) blocks the axial pore. The pore is open in the intermediate complex. (C) Key ClpX residues (blue or purple) and the C-terminal segment of the ssrA degron (gold) in the recognition complex are shown in stick representation. Dashed lines indicate hydrogen bonds. (D) ClpX-degron contacts in the recognition and intermediate complexes. ClpX or degron residues are shown in stick representation with semi-transparent density. (E) Subunit nucleotide state and degron/pore-loop interactions in the recognition and intermediate complexes.
Figure 2—figure supplement 1
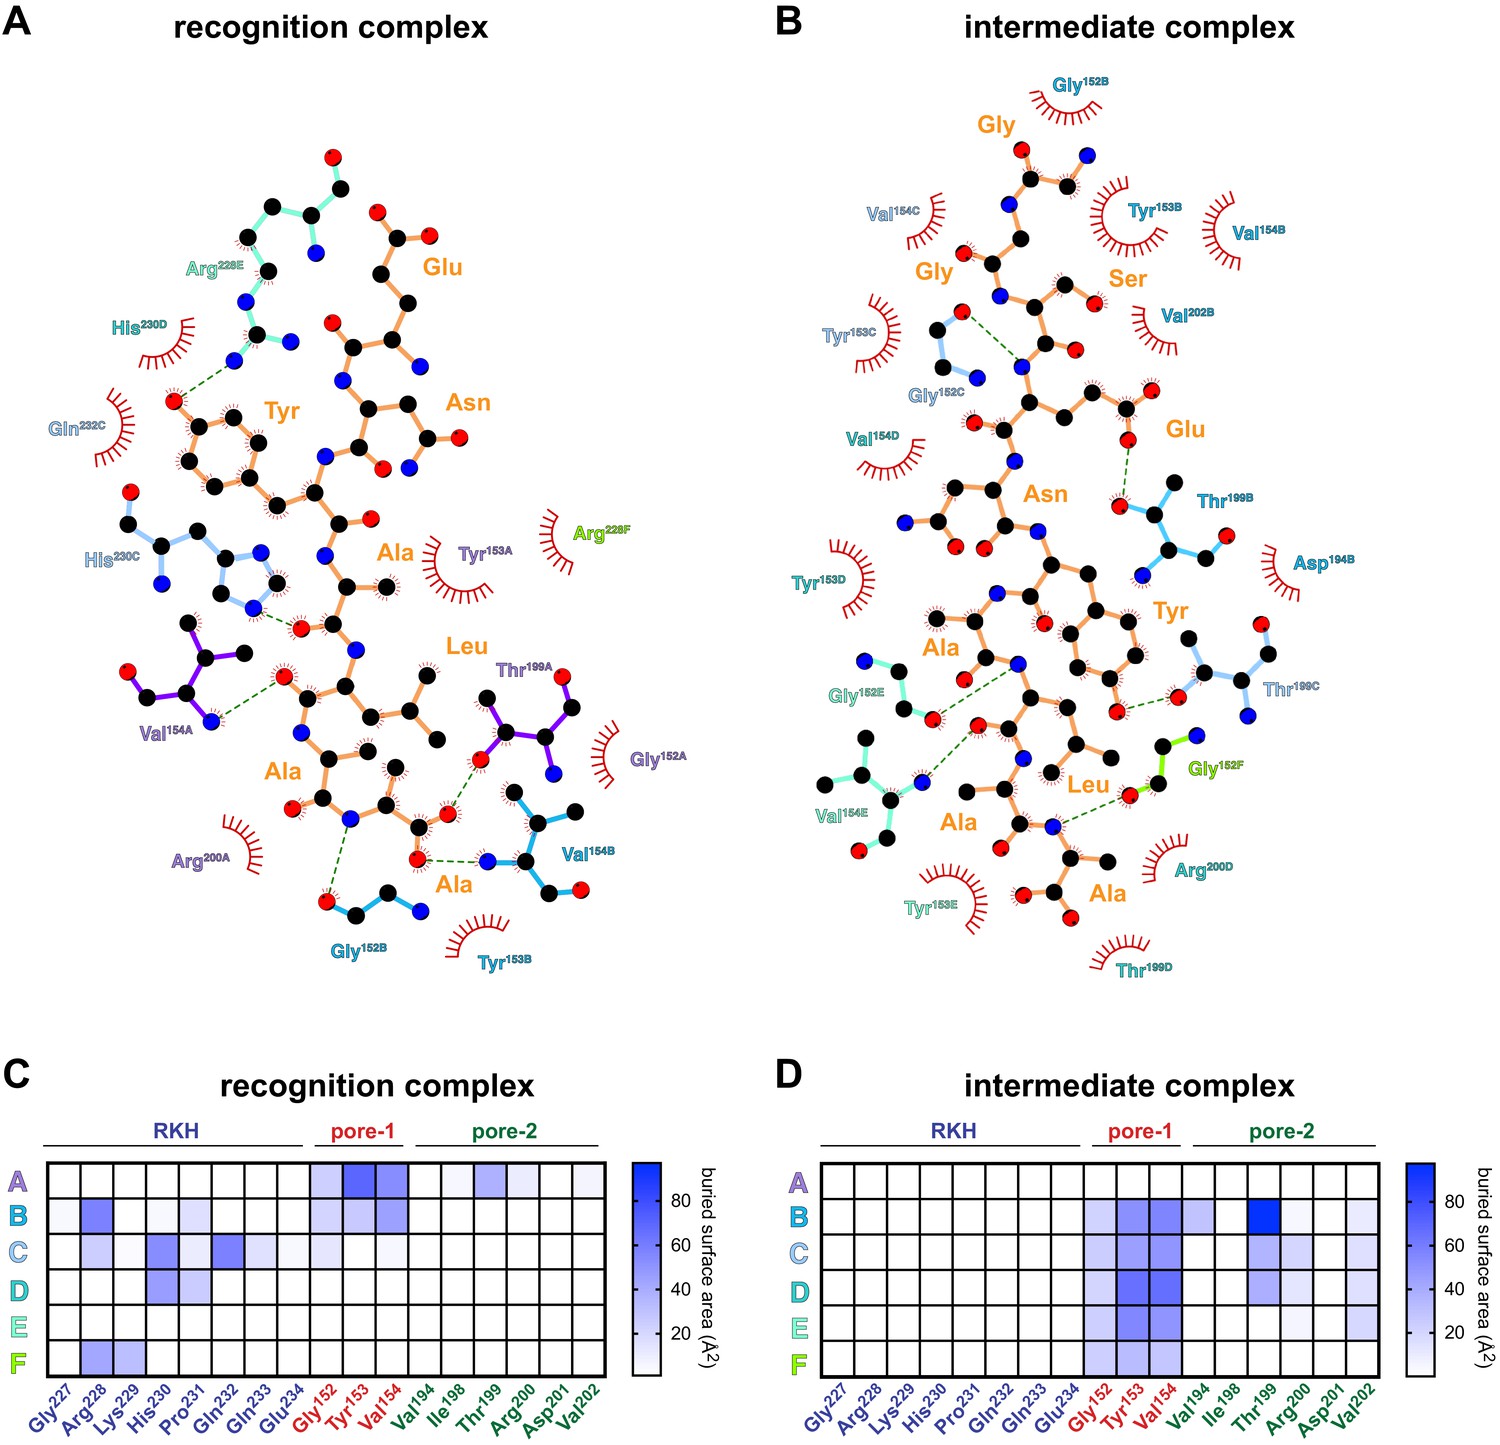
Detailed contacts between ClpX and the ssrA degron.
(A) Schematic representation of recognition-complex contacts between ClpX side chains and the ssrA degron prepared using LigPlot (Wallace et al., 1995). Dashed lines indicate hydrogen bonds. Hydrophobic and van der Waal’s contacts are indicated by arcs with spokes. (B) LigPlot schematic of ClpX-degron contacts in the intermediate complex. (C, D) Surface area buried in the recognition or intermediate complexes between the ssrA degron and ClpX residues (X-axis) for different ClpX subunits (Y-axis).
Figure 2—figure supplement 2
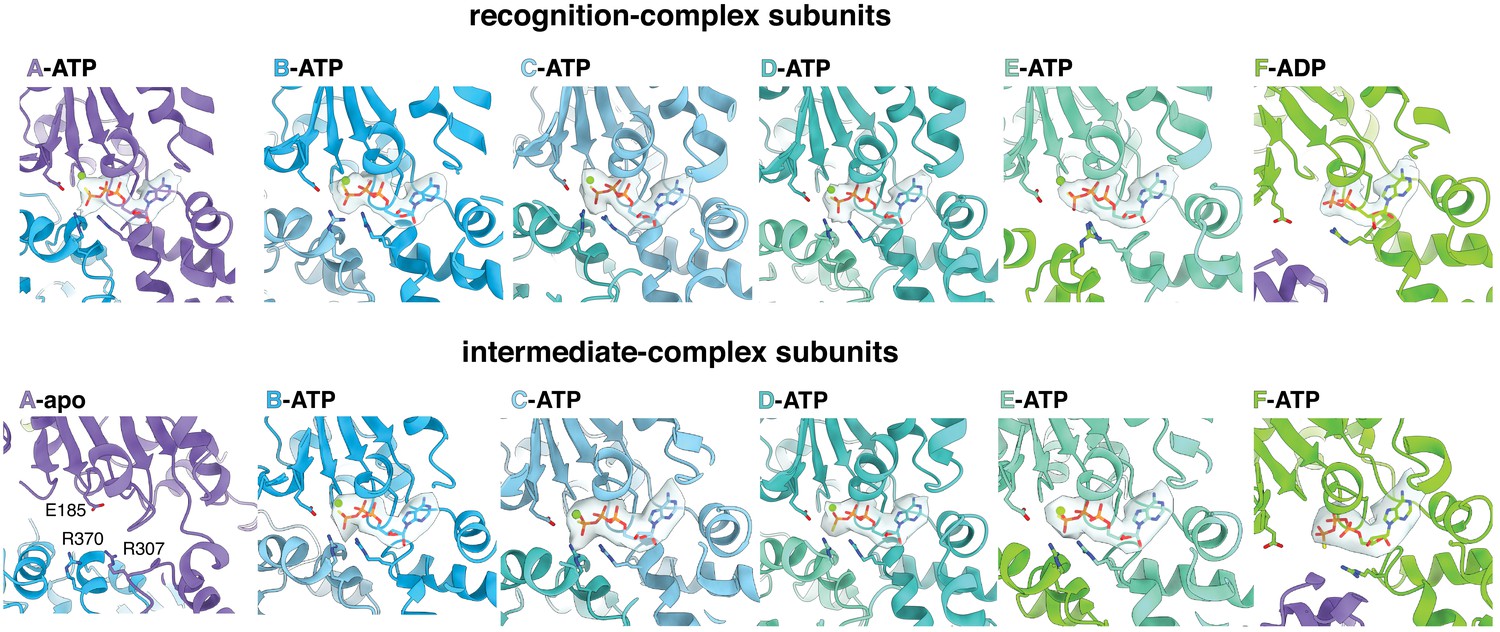
Nucleotide density in subunits of the recognition complex (top) and the intermediate complex (bottom).
Figure 3
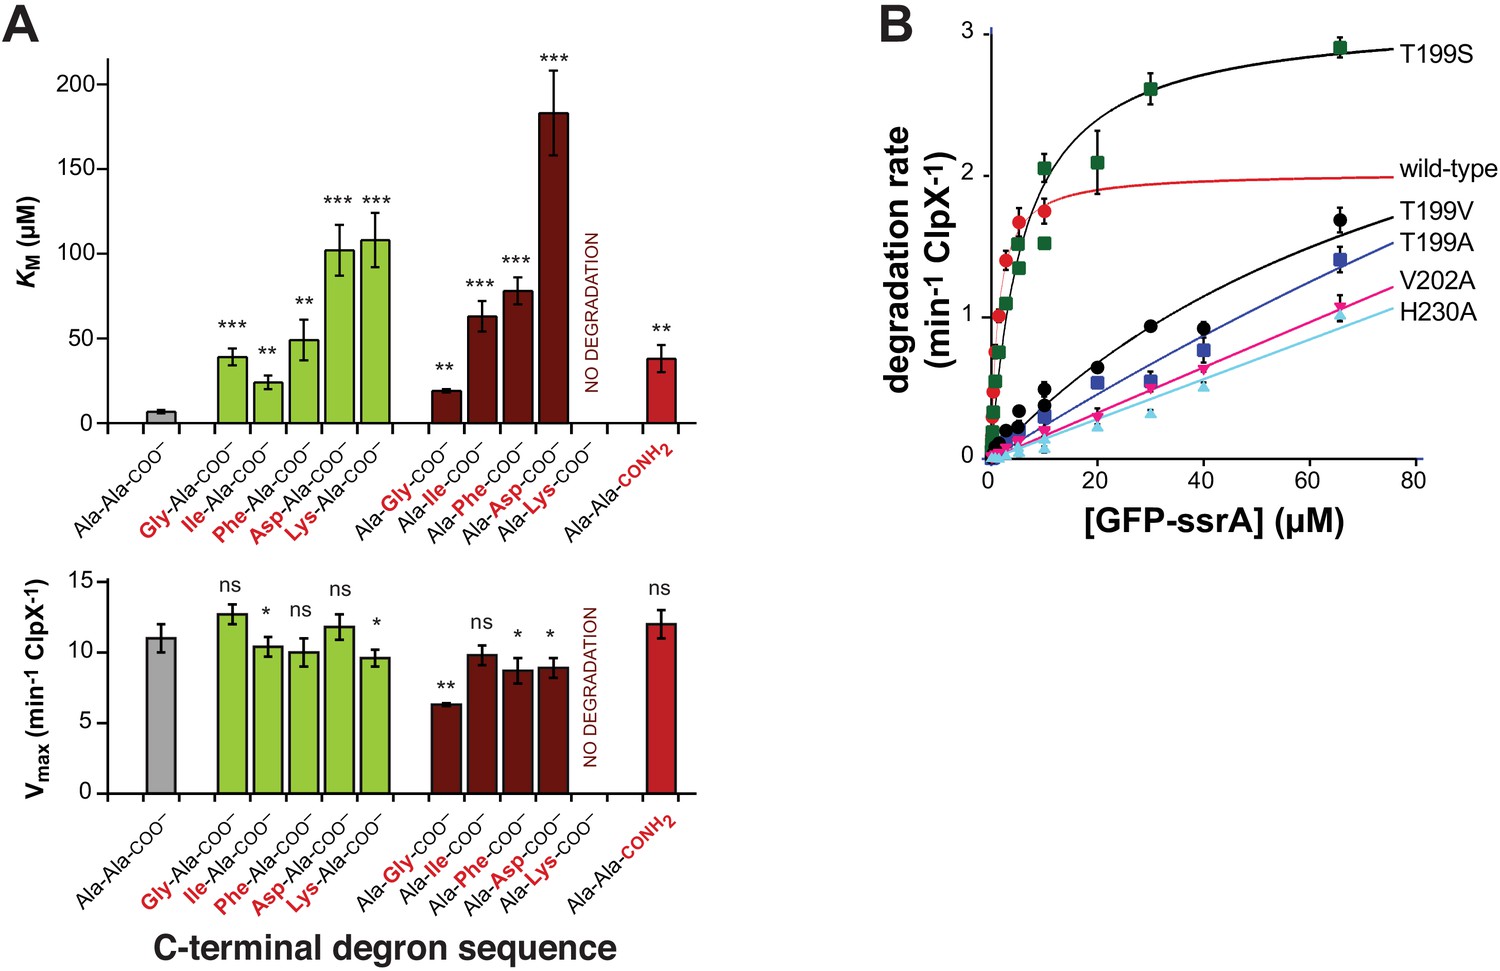
Mutations affecting recognition-complex contacts increase KM for ClpXP degradation.
(A) Steady-state KM (top) and Vmax (bottom) parameters (means ± SD; n = 3) for wild-type ClpXP degradation of synthetic peptide substrates containing an aminobenzoic-acid (ABZ) fluorophore and nitrotyrosine (YNO2) quencher (wild-type sequence ABZ-FAPHMALVPYNO2GYGGKKLAANDENYALAA; gray bar) with substitutions for the penultimate residue (green bars), C-terminal residue (dark red bars), or α-carboxylate (red bar). The statistical significance of KM or Vmax values relative to the wild-type Ala-Ala-COO– values was calculated using Student's two-tailed t-test (ns, not significant; *, p<0.05; **, p<0.01; ***, p<0.001). (B) Degradation of GFP-ssrA by ClpX∆N/ClpP and variants. Data are means ± SD (n = 3 to 6), and lines are fits to the Michaelis-Menten equation. Fitted KM values (µM) were 1.3 ± 0.2 (wild type), 6.3 ± 1.7 (T199S), and 89 ± 34 µM (T199V). Fitted Vmax values (min−1 ClpX−1) were 2.0 ± 0.1 (wild type), 3.1 ± 0.2 (T199S), and 3.7 ± 2.0 (T199V). For the T199A, V202A, and H230A variants, unconstrained fits had huge error limits, and fits with Vmax constrained to less than or equal to 4 min−1 ClpX−1 gave KM values from 140 to 240 µM.
Figure 4
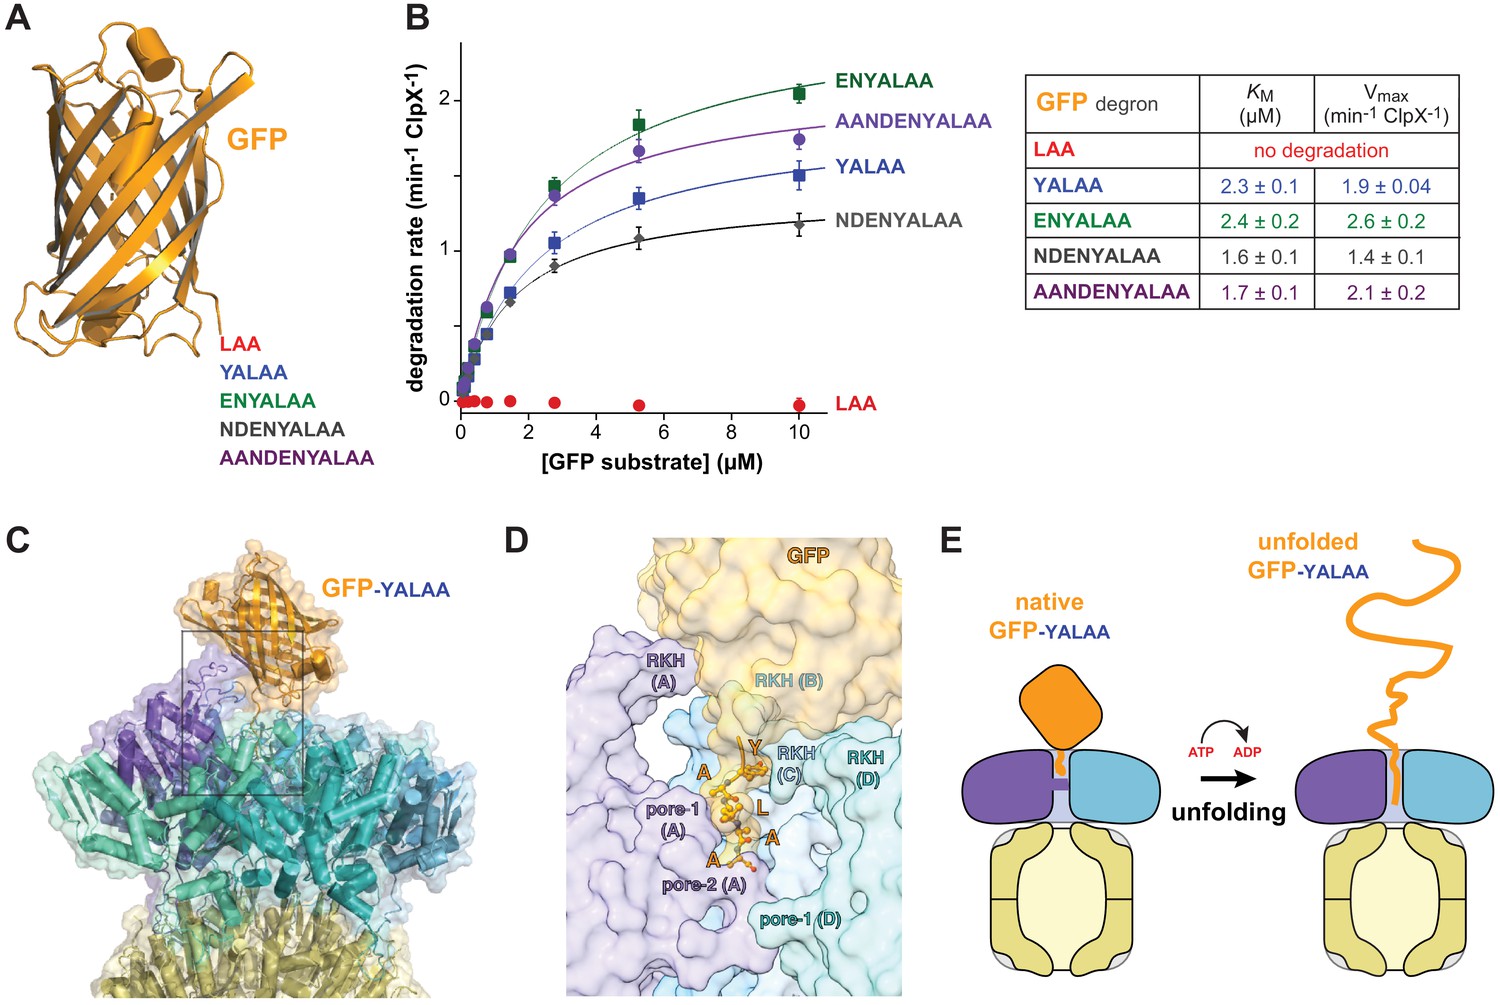
Degradation dependence on degron length.
(A) Cartoon of GFP (pdb 1EMA; Ormö et al., 1996) with degron tails of 3, 5, 7, 9, and 11 residues. (B) Plots of steady-state ClpX∆N/ClpP degradation rates (means ± SD; n = 3) as a function of substrate concentration. Lines are fits to the Michaelis-Menten equation. Fitted KM and Vmax values represent averages of three independent determinations ± SD. (C) Model of GFP-yalaa bound to ClpXP (cartoon and semi-transparent surface representation) created by aligning the yalaa of GFP to the same sequence in the recognition complex and then minimizing clashes both manually and computationally. (D) Close-up view of the ClpX-GFP-yalaa model (subunits E and F removed), corresponding to the dashed rectangle in panel C, with the yalaa shown in ball-and-stick representation. (E) Cartoon in which one power stroke unfolds GFP by translocating the yalaa degron six residues deeper into the channel of ClpX.
Figure 5
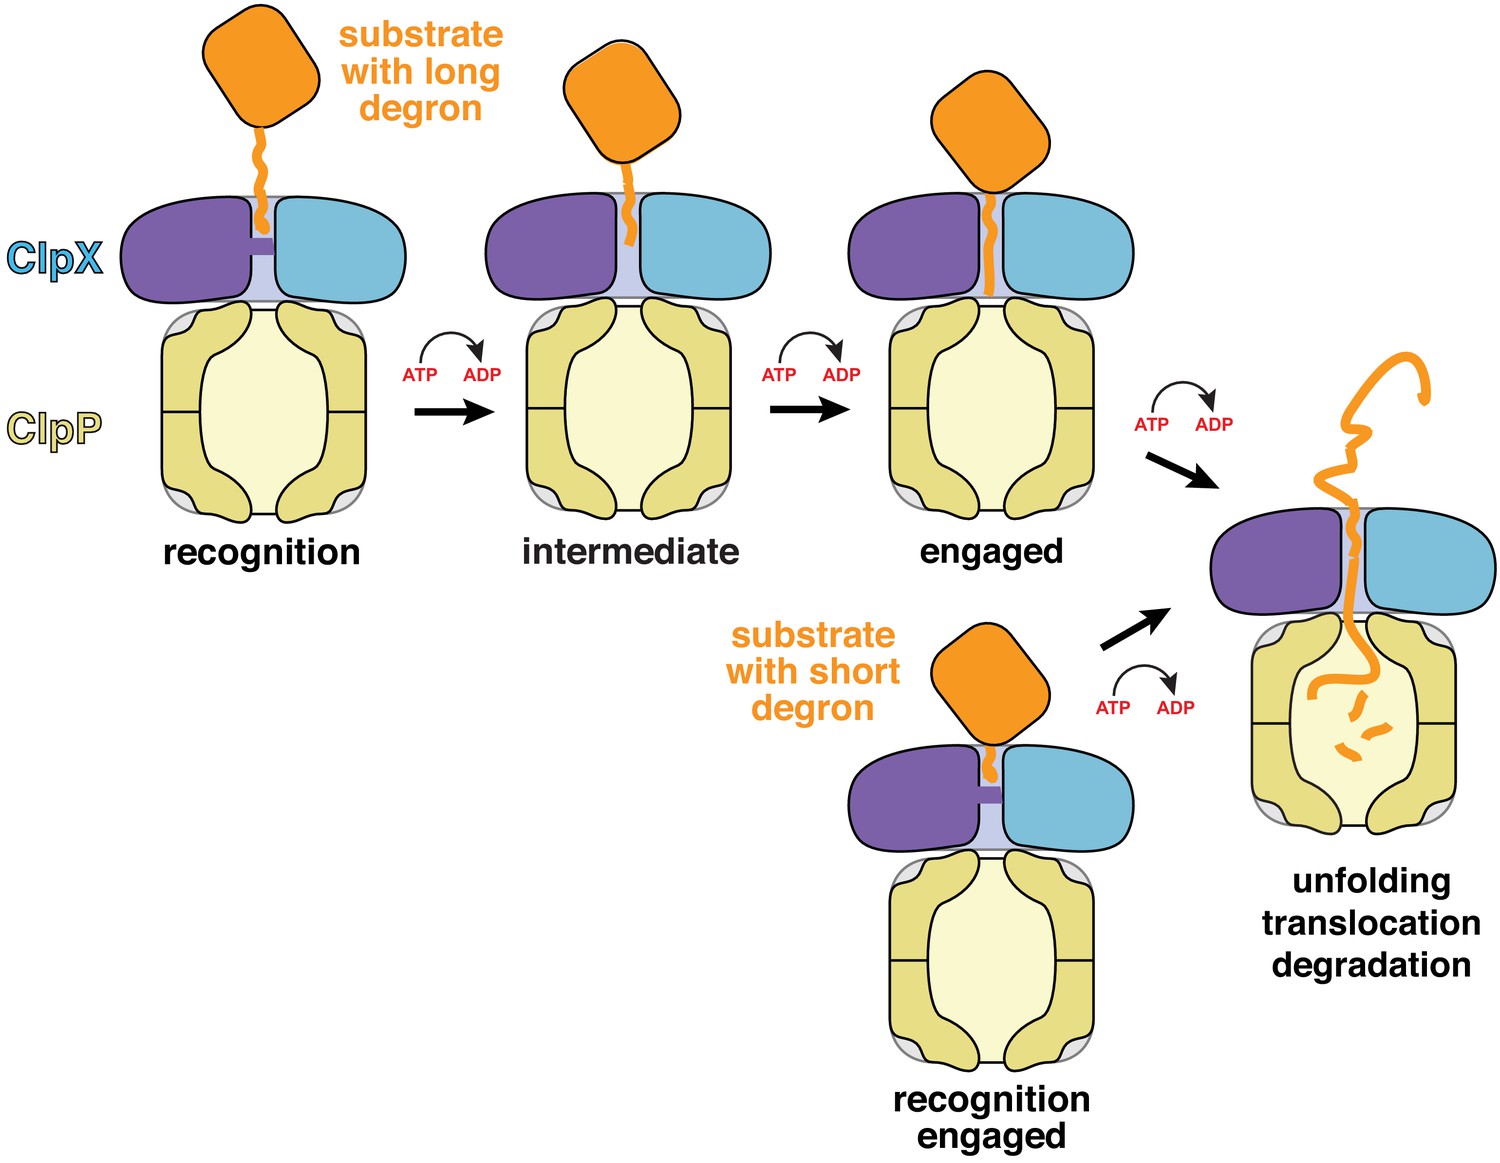
Models for substrate recognition, engagement, and unfolding by ClpXP.
Top. A substrate with a relatively long degron (~20 residues) is recognized and subsequent ATP-dependent power strokes then move the degron deeper into the ClpX channel in the intermediate complex, and then the engaged complex, from which unfolding occurs. Bottom. A substrate with a short degron (~5 residues) forms a recognition complex that is engaged and can therefore carry out direct ATP-dependent unfolding.
Videos
Video 1
Interaction of the ssrA degron with ClpX in the recognition complex.
The ssrA tag is contacted by pore loops located at the top of the axial channel of ClpX. EM density is shown as a transparent surface. Hydrogen bonds between pore loops and the ssrA degron are shown as dashed lines.
Video 2
Interaction of the ssrA degron with ClpX in the intermediate complex.
The pore-1 and pore-2 loops from different subunits of ClpX interact with every two residues of the ssrA degron, as observed in other structures of ClpXP and related AAA+ proteins. EM density is shown as a transparent surface. Hydrogen bonds between pore loops and the ssrA degron are shown as dashed lines.
Video 3
Model of the interaction between GFP-yalaa and the ClpX portion of the recognition complex.
GFP with a five-residue yalaa degron docks snuggly and without major clashes with the ClpX ring.
Video 4
Side and top views of a morph between the recognition and intermediate complexes with one ClpX subunit removed for clarity.
This morph was generated by aligning subunit A in the recognition complex spiral with subunit F in the intermediate complex spiral after superimposing the ClpP portions of the two structures. In the morph, the purple subunit and ssrA degron move 25 Å or six residues deeper into the axial channel toward ClpP.
Tables
Table 1
Cryo-EM data collection, processing, model building, and validation statistics.
| Name | ClpP | ClpXP-ssrA Recognition complex | ClpXP-ssrA Intermediate complex |
|---|---|---|---|
| PDB ID | 6WR2 | 6WRF | 6WSG |
| EMDB ID | EMD-21875 | EMD-21882 | EMD-21892 |
| Data collection/processing | |||
| Microscope | Talos Arctica | ||
| Camera | K3 | ||
| Magnification | 45,000X | ||
| Voltage (kV) | 200 | ||
| Total electron dose (e-/Å2) | 53 | ||
| Defocus range (µm) | −1.2 to −2.5 | ||
| Pixel size (Å) | 0.435 | ||
| Micrographs collected | 4525 | ||
| Final particles | 344069 | 139817 | 130240 |
| Symmetry | C1 | C1 | C1 |
| Resolution Å (FSC 0.143) | 2.8 | 3.1 | 3.2 |
| Model composition | |||
| Non-hydrogen atoms | 21,310 | 26,835 | 25,932 |
| Protein residues | 2729 | 3450 | 3334 |
| Ligands | 0 | 6 | 5 |
| Refinement | |||
| Map-model CC | 0.82 | 0.77 | 0.74 |
| RMSD bond lengths (Å) | 0.015 | 0.003 | 0.011 |
| RMSD bond angles (degrees) | 1.16 | 0.73 | 1.13 |
| Validation | |||
| MolProbity score | 0.89 | 0.94 | 0.96 |
| Clash score | 1.5 | 1.9 | 1.7 |
| C-beta deviations | 0 | 0 | 0 |
| Rotamer outliers (%) | 0 | 0.07 | 0 |
| Ramachandran favored (%) | 98.9 | 99 | 99.3 |
| Ramachandran disallowed (%) | 0 | 0 | 0 |
Table 2
Comparisons between high-resolution ClpXP structures.
(A). RMSDs between Cα positions. (B). Nucleotides bound in different subunits of high-resolution ClpXP structures. Gray shading indicates subunits that always contain ATP or ATPγS.
| Table 2A | ||||
|---|---|---|---|---|
| PDB ID | Name | Reference | RMSD (Å) | RMSD (Å) |
| Recognition complex | Intermediate complex | |||
| 6WSG | Intermediate complex | This paper | 2.8 | 0.0 |
| 6PP8 | Class 1 | Fei et al., 2020 | 2.0 | 1.9 |
| 6PP7 | Class 2 | Fei et al., 2020 | 2.8 | 1.3 |
| 6PP6 | Class 3 | Fei et al., 2020 | 1.4 | 2.7 |
| 6PP5 | Class 4 | Fei et al., 2020 | 1.4 | 2.9 |
| 6VFS | Conformation A | Ripstein et al., 2020 | 3.0 | 2.6 |
| 6VFX | Conformation B | Ripstein et al., 2020 | 1.6 | 3.0 |
| Table 2B | ||||||||
|---|---|---|---|---|---|---|---|---|
| PDB ID | Name | ClpX subunit | Reference | |||||
| A | B | C | D | E | F | |||
| 6WRF | Recognition complex | ATP | ATP | ATP | ATP | ATP | ADP | This paper |
| 6WSG | Intermediate complex | - | ATP | ATP | ATP | ATP | ATP | This paper |
| 6PP8 | Class 1 | ATP | ATP | ATP | ATP | ATP | ADP | Fei et al., 2020 |
| 6PP7 | Class 2 | ADP | ATP | ATP | ATP | ATP | ATP | Fei et al., 2020 |
| 6PP6 | Class 3 | ATP | ATP | ATP | ATP | ATP | ADP | Fei et al., 2020 |
| 6PP5 | Class 4 | ATP | ATP | ATP | ATP | ATP | ADP | Fei et al., 2020 |
| 6VFS | Conformation A | ADP | ATP | ATP | ATP | ATP | ADP | Ripstein et al., 2020 |
| 6VFX | Conformation B | ATP | ATP | ATP | ATP | ATP | ADP | Ripstein et al., 2020 |
Key resources table
| Reagent type (species) or resource | Designation | Source or reference | Identifiers | Additional information |
|---|---|---|---|---|
| Strain, strain background (Escherichia coli) | ER2566 | NEB | 1312 | Chemically competent cells |
| Gene (Escherichia coli) | clpX | E. coli (strain K12) EXPASY | UniProtKB- P0A6H1 | |
| Gene (Escherichia coli) | clpP | E. coli (strain K12) EXPASY | UniProtKB- P0A6G7 | |
| Recombinant DNA reagent | pT7 ClpX (plasmid) | Kim et al., 2000 | N-terminally His6-tagged ClpX for overexpression | |
| Recombinant DNA reagent | pT7 ClpXΔN(plasmid) | Martin et al., 2005 | N-terminally His6-tagged ClpXΔN(residues 62–424) for overexpression | |
| Recombinant DNA reagent | pT7-ClpXΔN-T199A (plasmid) | This paper, Material and methods | ClpXΔN (residues 62–424) T199A mutant, can be obtained from the Sauer lab | |
| Recombinant DNA reagent | pT7-ClpXΔN-T199S (plasmid) | This paper, Material and methods | ClpXΔN (residues 62–424) T199S mutant, can be obtained from the Sauer lab | |
| Recombinant DNA reagent | pT7-ClpXΔN-T199V (plasmid) | This paper, Material and methods | ClpXΔN (residues 62–424) T199V mutant, can be obtained from the Sauer lab | |
| Recombinant DNA reagent | pT7-ClpXΔN-V202A (plasmid) | This paper, Material and methods | ClpXΔN (residues 62–424) V202A mutant, can be obtained from the Sauer lab | |
| Recombinant DNA reagent | pT7-ClpXΔN-H230A (plasmid) | This paper, Material and methods | ClpXΔN (residues 62–424) H230A mutant, can be obtained from the Sauer lab | |
| Recombinant DNA reagent | PACYC-ClpXΔN6-TEV-cHis6 (plasmid) | Martin et al., 2005 | ClpX expression, can be obtained from the Sauer lab | |
| Recombinant DNA reagent | pT7 ClpP (plasmid) | Kim et al., 2000 | C-terminally His6-tagged ClpP for overexpression | |
| Recombinant DNA reagent | pT7-GFP-ssrA (plasmid) | Kim et al., 2000 | Expresses fluorescent substrate for degradation assays, can be obtained from the Sauer lab | |
| Recombinant DNA reagent | pT7 GFP LAA (plasmid) | This paper | N-terminally His6-tagged GFP (1-229) substrates with a LAA C-terminal tail, for overexpression. | |
| Recombinant DNA reagent | pT7 GFP YALAA (plasmid) | This paper | N-terminally His6-tagged GFP (1-229) substrates with a YALAA C-terminal tail, for overexpression. | |
| Recombinant DNA reagent | pT7 GFP ENYALAA (plasmid) | This paper | N-terminally His6-tagged GFP (1-229) substrates with a ENYALAA C-terminal tail, for overexpression. | |
| Recombinant DNA reagent | pT7 GFP NDENYALAA (plasmid) | This paper | N-terminally His6-tagged GFP (1-229) substrates with a NDENYALAA C-terminal tail, for overexpression. | |
| Recombinant DNA reagent | pT7 GFP AANDENYALAA (plasmid) | This paper | N-terminally His6-tagged GFP (1-229) substrates with a AANDENYALAA C-terminal tail, for overexpression. | |
| Peptide, recombinant protein | ABZ-FAPHMALVPYNO2GYGGKKLAANDENYALAA-COO- | This paper | Fluorescent peptide, for degradation assays | |
| Peptide, recombinant protein | ABZ-FAPHMALVPYNO2GYGGKKLAANDENYALGA-COO- | This paper | Fluorescent peptide, for degradation assays | |
| Peptide, recombinant protein | ABZ-FAPHMALVPYNO2GYGGKKLAANDENYALIA-COO- | This paper | Fluorescent peptide, for degradation assays | |
| Peptide, recombinant protein | ABZ-FAPHMALVPYNO2GYGGKKLAANDENYALFA-COO- | This paper | Fluorescent peptide, for degradation assays | |
| Peptide, recombinant protein | ABZ-FAPHMALVPYNO2GYGGKKLAANDENYALDA-COO- | This paper | Fluorescent peptide, for degradation assays | |
| Peptide, recombinant protein | ABZ-FAPHMALVPYNO2GYGGKKLAANDENYALKA-COO- | This paper | Fluorescent peptide, for degradation assays | |
| Peptide, recombinant protein | ABZ-FAPHMALVPYNO2GYGGKKLAANDENYALAG-COO- | This paper | Fluorescent peptide, for degradation assays | |
| Peptide, recombinant protein | ABZ-FAPHMALVPYNO2GYGGKKLAANDENYALAI-COO- | This paper | Fluorescent peptide, for degradation assays | |
| Peptide, recombinant protein | ABZ-FAPHMALVPYNO2GYGGKKLAANDENYALAF-COO- | This paper | Fluorescent peptide, for degradation assays | |
| Peptide, recombinant protein | ABZ-FAPHMALVPYNO2GYGGKKLAANDENYALAD-COO- | This paper | Fluorescent peptide, for degradation assays | |
| Peptide, recombinant protein | ABZ-FAPHMALVPYNO2GYGGKKLAANDENYALAK-COO- | This paper | Fluorescent peptide, for degradation assays | |
| Peptide, recombinant protein | ABZ-FAPHMALVPYNO2GYGGKKLAANDENYALAA-CONH2 | This paper | Fluorescent peptide, for degradation assays | |
| Software, algorithm | Relion | Zivanov et al., 2018 | RRID:SCR_016274 | EM reconstruction software |
| Software, algorithm | UCSF Chimera | Pettersen et al., 2004 | RRID:SCR_004097 | Molecularvisualizationsoftware |
| Software, algorithm | UCSF ChimeraX | Goddard et al., 2018 | RRID:SCR_015872 | Molecularvisualizationsoftware |
| Software, algorithm | Phenix | Adams et al., 2010 | RRID:SCR_014224 | Structure refinement software |
| Software, algorithm | MolProbity | Williams et al., 2018 | RRID:SCR_014226 | Protein modelevaluationsoftware |
| Software, algorithm | PyMOL | Schrödinger, LLC. | RRID:SCR_000305 | Molecularvisualizationsoftware |
| Software, algorithm | Coot | Emsley and Cowtan, 2004 | RRID:SCR_014222 | Protein modelbuildingsoftware |
| Software, algorithm | Ctffind | Rohou and Grigorieff, 2015 | RRID:SCR_016732 | EM image analysis software |
| Software, algorithm | PISA | 'Protein interfaces, surfaces and assemblies' service PISA at the European Bioinformatics Institute (http://www.ebi.ac.uk/pdbe/prot_int/pistart.html) | RRID:SCR_015749 | Protein modelanalysis software |
Additional files
Download links
A two-part list of links to download the article, or parts of the article, in various formats.
Downloads (link to download the article as PDF)
Open citations (links to open the citations from this article in various online reference manager services)
Cite this article (links to download the citations from this article in formats compatible with various reference manager tools)
Structural basis of ClpXP recognition and unfolding of ssrA-tagged substrates
eLife 9:e61496.
https://doi.org/10.7554/eLife.61496


