Real-time monitoring of peptidoglycan synthesis by membrane-reconstituted penicillin-binding proteins
- Centre for Bacterial Cell Biology, Biosciences Institute, Newcastle University, United Kingdom
- Institute for Science and Technology Austria (IST Austria), Austria
- Membrane Biochemistry and Biophysics, Bijvoet Centre for Biomolecular Research, University of Utrecht, Netherlands
Figures
Figure 1 with 4 supplements
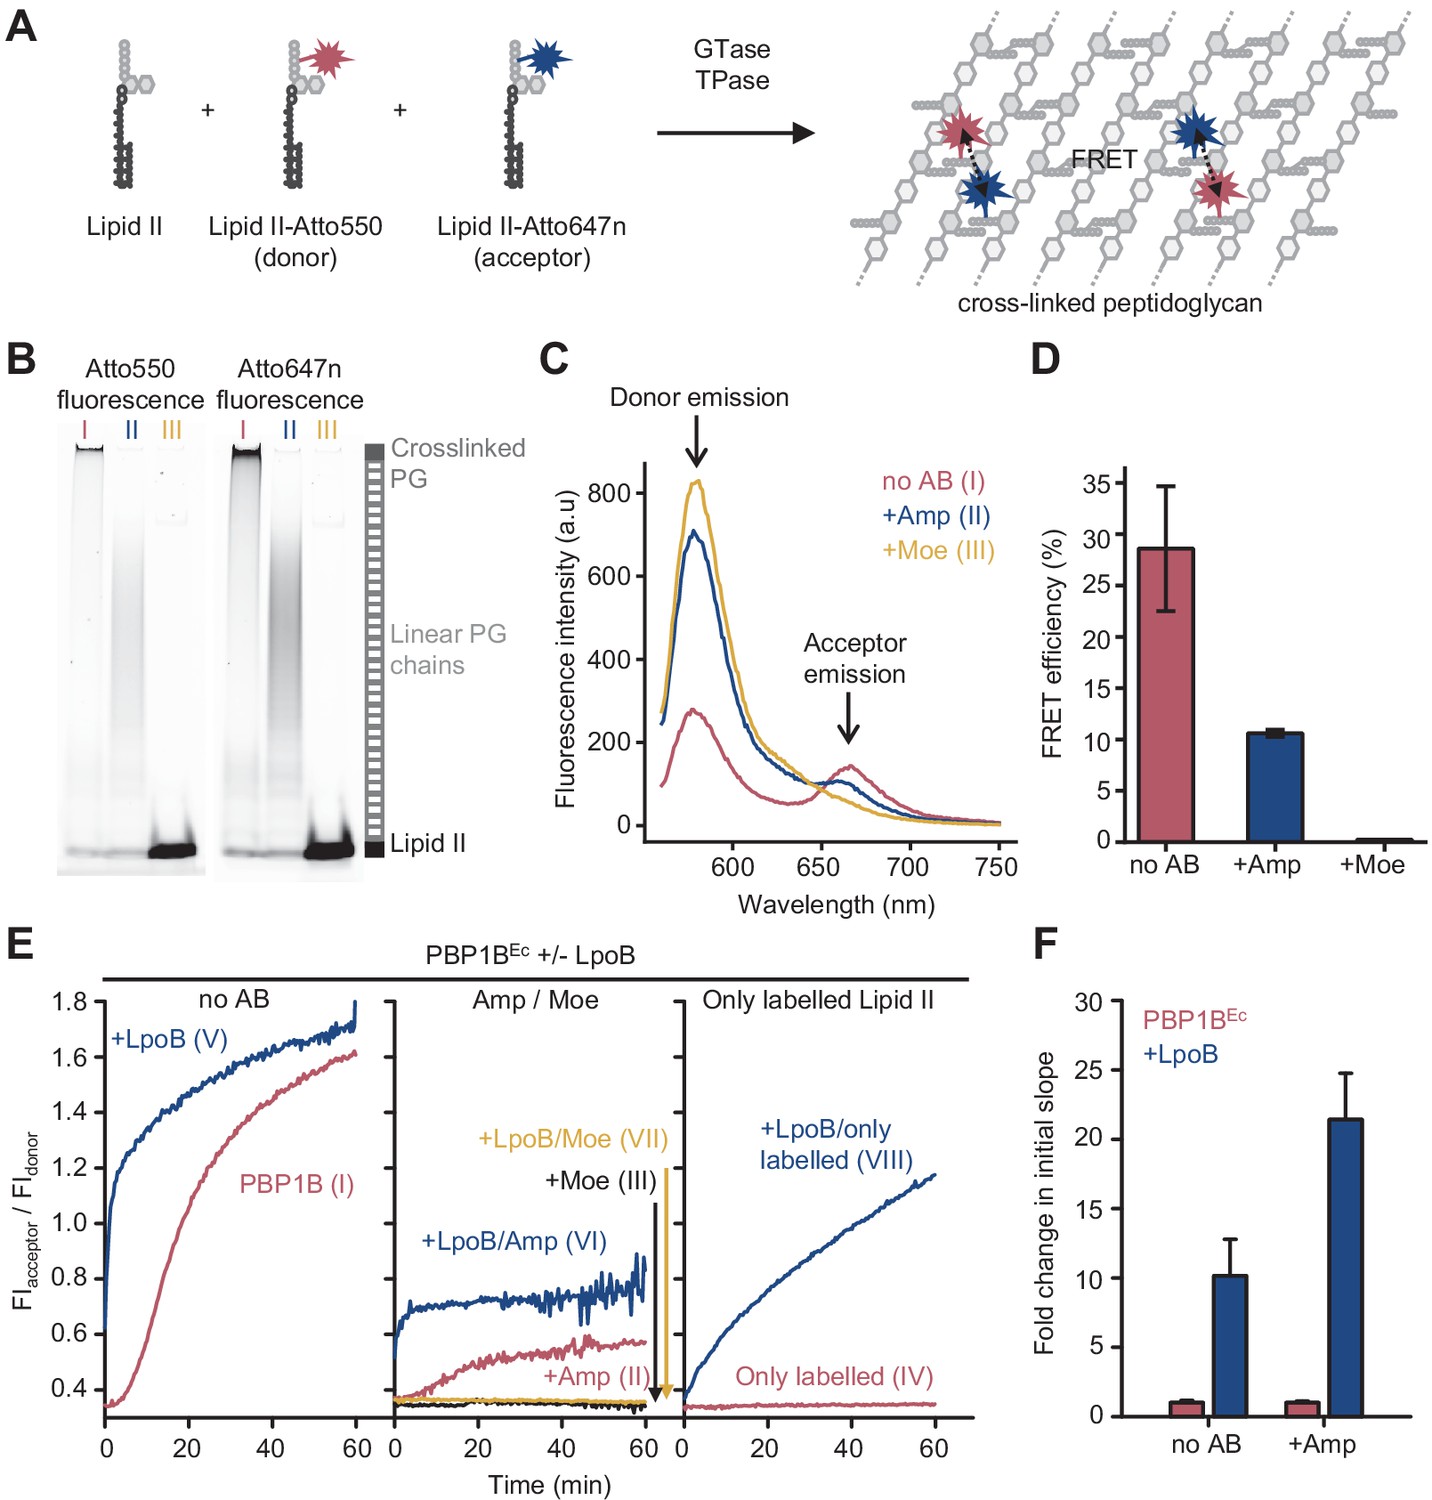
Förster resonance energy transfer (FRET) assay to monitor peptidoglycan synthesis in real time.
(A) Scheme of the reactions of a class A penicillin-binding protein (PBP) (GTase-TPase) with unlabelled lipid II and the two versions of labelled lipid II, yielding a peptidoglycan (PG) product that shows FRET. (B) SDS-PAGE analysis of PG products by PBP1BEc (0.5 µM) reactions with unlabelled lipid II, Atto550-labelled lipid II, and Atto647n-labelled lipid II at a 1:1:1 molar ratio (each 5 µM), in the absence of antibiotics (I, red) or in the presence of 1 mM ampicillin (II, blue) or 50 µM moenomycin (III, yellow). Samples were incubated for 1 hr at 37°C and boiled for 5 min. (C) Representative fluorescence emission spectra taken after reactions performed as described in B and following the same labelling pattern. (D) FRET efficiency for PBP1BEc reactions carried out as indicated in B, calculated using the (ratio)A method (see Materials and methods). Values are mean ± SD of at least three independent samples. (E) Representative reaction curves from FRET assays of detergent-solubilized PBP1BEc. The same components as indicated in B were incubated in the presence or absence of 2 µM LpoB(sol). Reactions were performed in the absence of antibiotic (left), with 1 mM ampicillin (Amp) or 50 µM moenomycin (Moe) (middle), or by omitting unlabelled lipid II (right). The numbers indicate the corresponding lane of the gel in Figure 1—figure supplement 2D. Samples were incubated for 1 hr at 25°C. (F) Averaged initial slopes from reaction curves obtained by the FRET assay for detergent-solubilized E. coli PBP1B in the presence (blue) or absence (red) of LpoB, and in the presence or absence of ampicillin. Values are normalized relative to the slope in the absence of activator for each condition and are mean ± SD of 2–3 independent experiments.
-
Figure 1—source data 1
Numerical data to support graphs in Figure 1 and original gel images for Figure 1B.
- https://cdn.elifesciences.org/articles/61525/elife-61525-fig1-data1-v2.zip
Figure 1—figure supplement 1
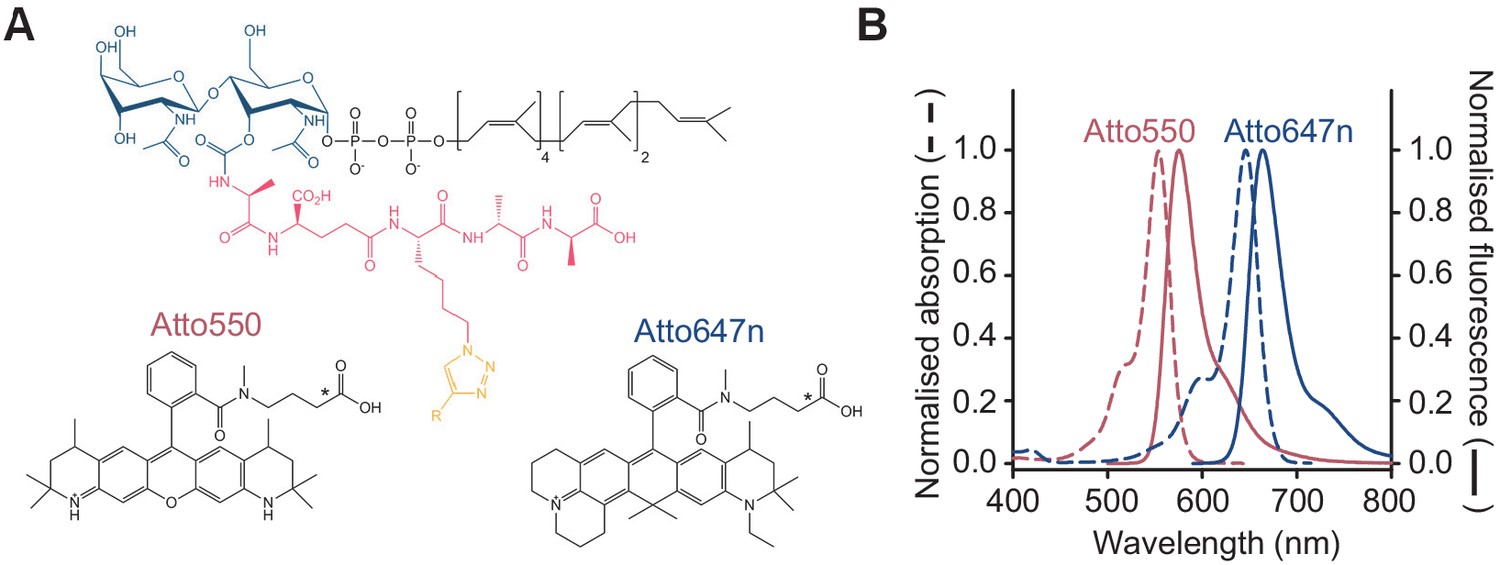
Fluorescent lipid II analogues to monitor peptidoglycan synthesis in real time.
(A) Chemical structures of lipid II analogues used for the Förster resonance energy transfer assay. R corresponds to Atto550n (donor) or Atto647n (acceptor) in the corresponding analogue. The chemical structures of alkyne versions of Atto550 and Atto647n probes that were used for derivatization are not published. Therefore, the carboxylic variants are depicted here with an asterisk indicating where the alkyne versions diverge. (B) Absorbance (dashed lines) and fluorescence emission (solid lines) spectra for Atto550 (red lines) and Atto647n (blue lines).
Figure 1—figure supplement 2
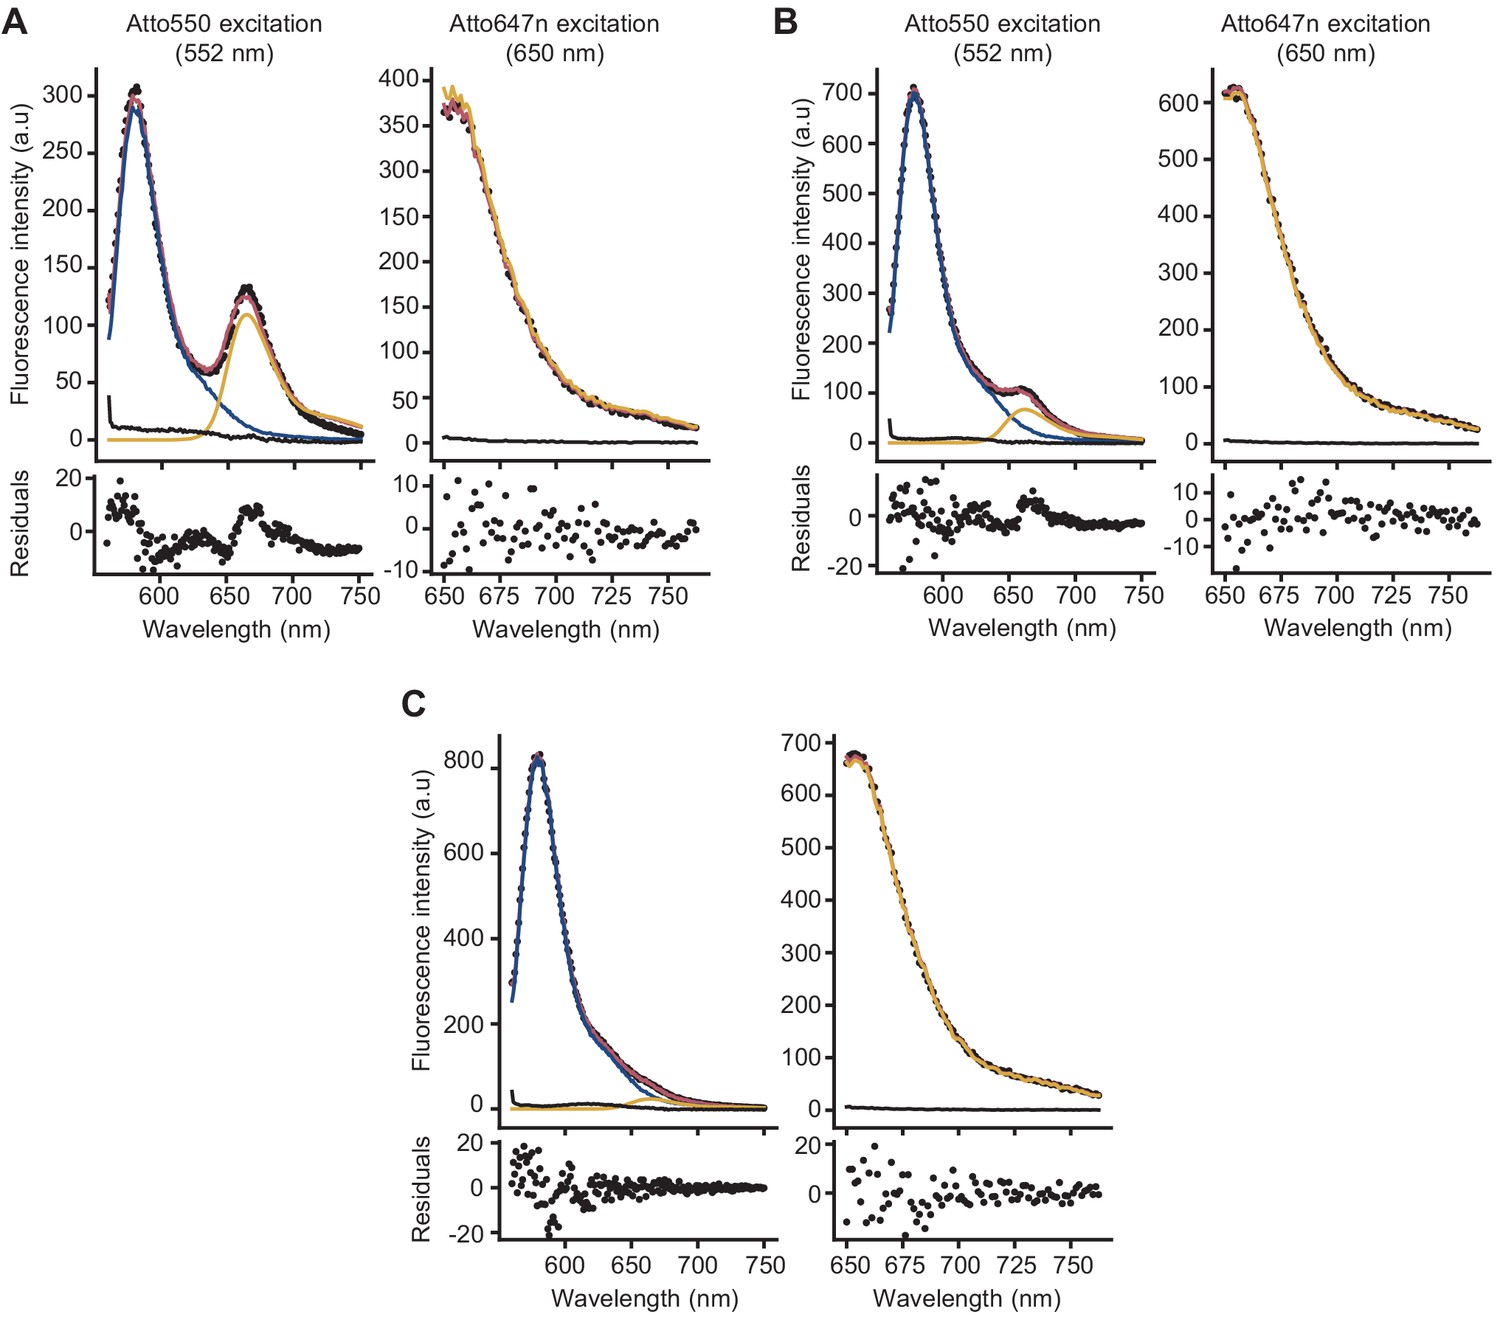
Analysis of fluorescence spectra to calculate Förster resonance energy transfer (FRET) efficiency.
Examples of deconvolution of the fluorescence spectra of peptidoglycan samples prepared in the presence of lipid II-Atto550, Lipid II-Atto647n, and unlabelled lipid II, obtained from a reaction without antibiotics (A) or in the presence of ampicillin (B) or moenomycin (C). FRET efficiencies were calculated using the (ratio)A method, in which the enhancement of emission of the acceptor due to the donor is calculated by comparing the emission of (only) the acceptor when exciting at the donor excitation with the emission of the acceptor when exciting only the acceptor (Vámosi and Clegg, 1998). For this, two spectra were taken for every sample, either exciting at 552 nm (donor excitation) or at 650 nm (acceptor excitation). To process the spectra and separate the emission of the acceptor from that of the donor in the spectra taken at the donor excitation, reference spectra were measured from (1) reactions containing lipid II-Atto550 and unlabelled lipid II (donor reference), (2) reactions containing lipid II-Atto647n and unlabelled lipid II (acceptor references at both excitation wavelengths), and (3) reactions containing only unlabelled lipid II (background references at both excitation wavelengths). Reference samples were prepared for every antibiotic condition measured. The reference spectra were then used to analyse the spectrum containing both donor and acceptor probes (black dots). Spectra taken with donor excitation were deconvolved into three components: donor (blue), acceptor (yellow), and background (black), while the spectrum taken with acceptor excitation was deconvolved into two components: acceptor (yellow) and background (black). The fitted spectra are shown in red, and the residuals of the fit are shown below each spectrum.
-
Figure 1—figure supplement 2—source data 1
Numerical data to support graphs in Figure 1—figure supplement 2.
- https://cdn.elifesciences.org/articles/61525/elife-61525-fig1-figsupp2-data1-v2.xlsx
Figure 1—figure supplement 3
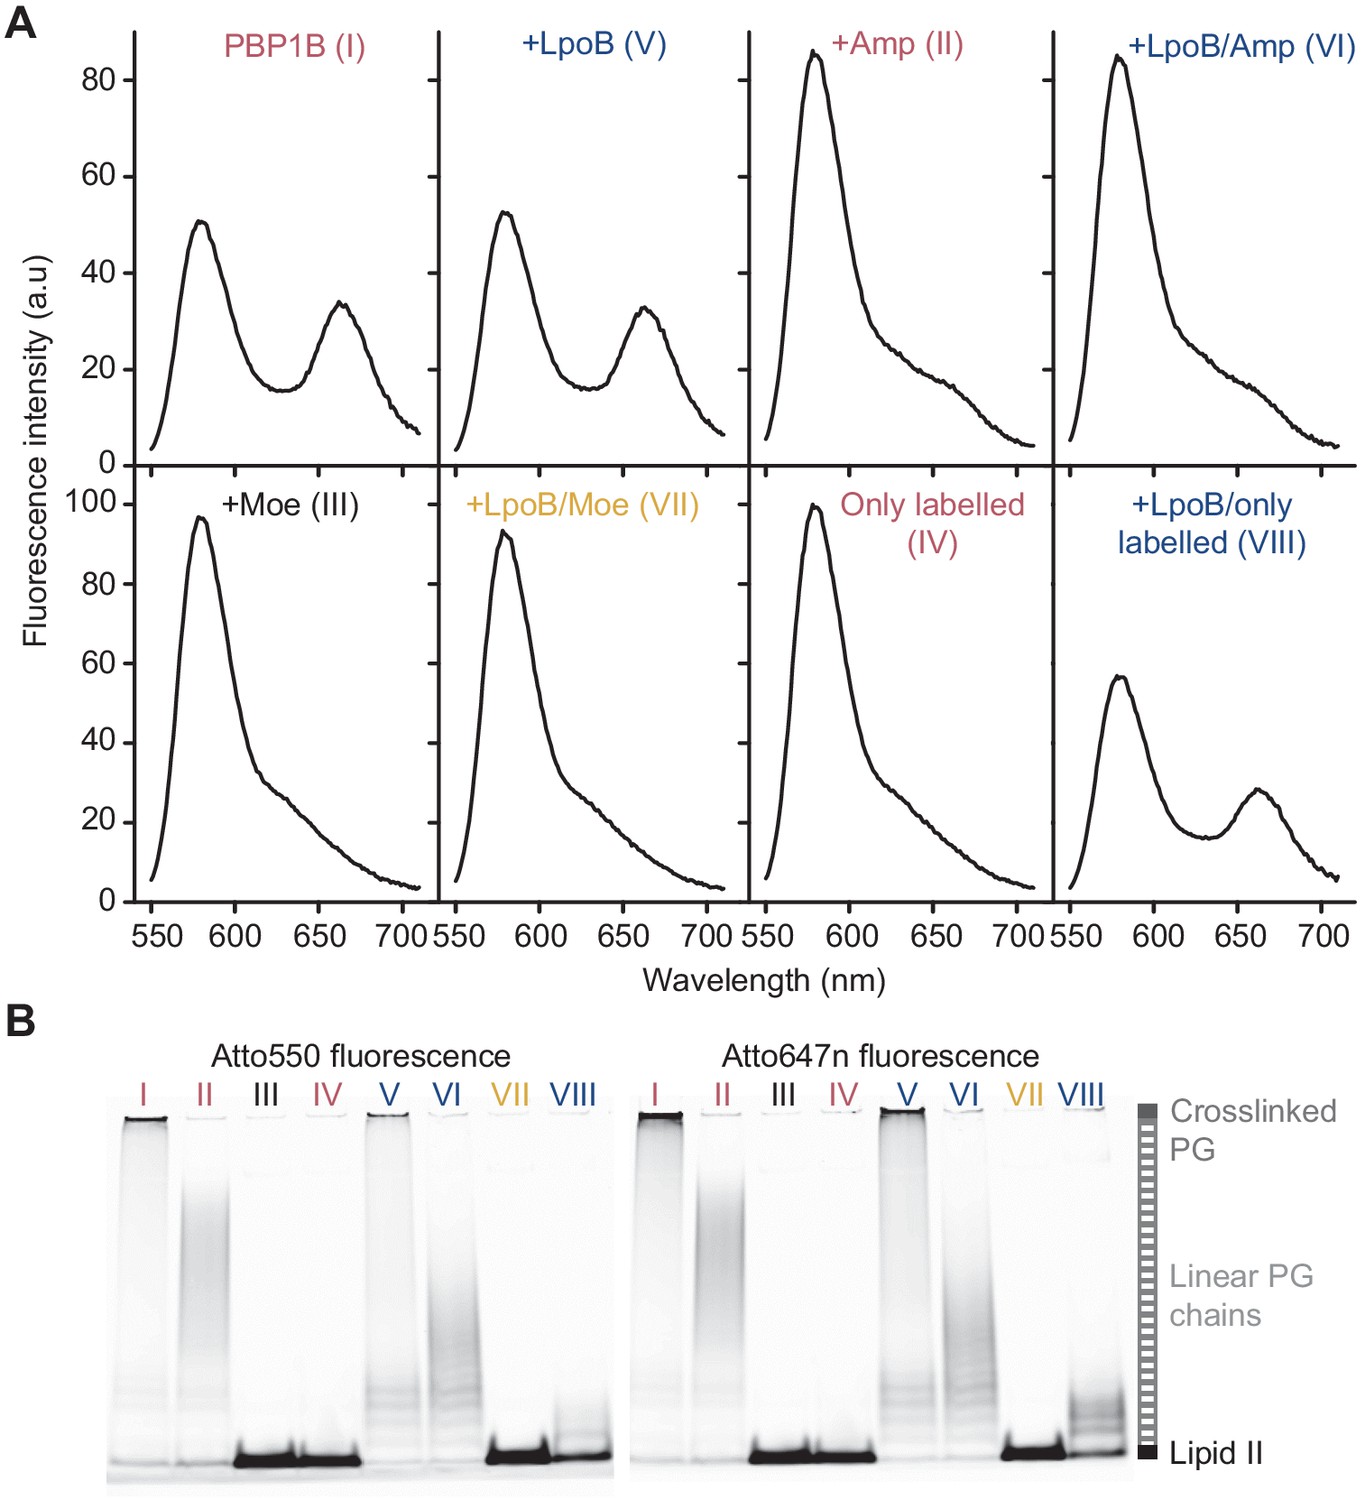
Förster resonance energy transfer assay to monitor peptidoglycan synthesis in real time.
(A) Fluorescence emission spectra taken at the end (t = 1 hr) of the reactions of E. coli PBP1B shown in Figure 1E (t = 60 min). (B) Aliquots at the end of the reactions shown in Figure 1E were boiled and analysed by SDS-PAGE using fluorescence detection, and lanes are labelled with the reaction numbers as in Figure 1E.
-
Figure 1—figure supplement 3—source data 1
Original gel images for Figure 1—figure supplement 3.
- https://cdn.elifesciences.org/articles/61525/elife-61525-fig1-figsupp3-data1-v2.zip
Figure 1—figure supplement 4
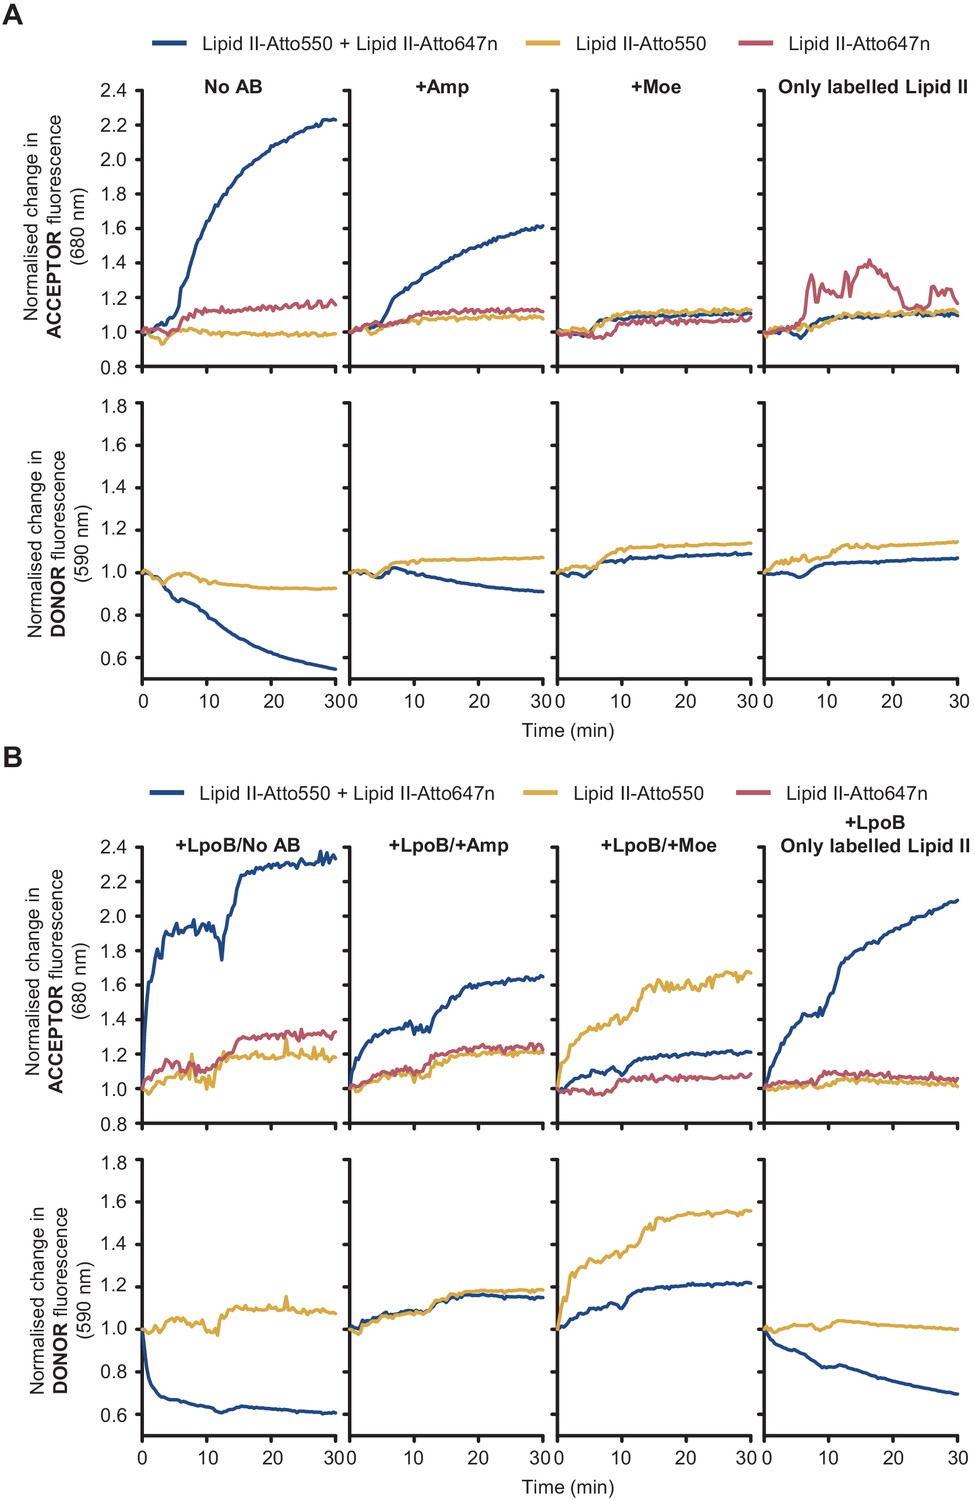
Fluorescence intensity (FI) of lipid II-Atto550 and lipid II-Atto647n only changes significantly during reactions when both versions are present.
FI at the acceptor and donor emission wavelengths (590 and 680 nm, respectively) only changed significantly when there was peptidoglycan synthesis activity, and both lipid II-Atto647n and lipid II-Atto550 were added to reactions. Moreover, these changes were indicative of Förster resonance energy transfer (decrease at the donor wavelength and increase at the acceptor wavelength). (A) PBP1BEc reactions in the presence of unlabelled lipid II plus different combinations of labelled substrates (lipid II-Atto550, yellow; lipid II-Atto647n, red; or a mixture of both, blue) were monitored in real time by measuring FI at 590 nm (bottom row) and 680 nm (top row). Reactions without lipid II-Atto550 were monitored at 680 nm only. Reactions were performed at four conditions (left to right): with no antibiotics, with 1 mM ampicillin, with 100 µM moenomycin, or omitting unlabelled lipid II. Changes in FI were normalized by calculating the ratio FI(ti)/FI(t = 0). (B) Same reactions as in A, but performed in the presence of activator LpoB. In both A and B, the final concentration of each labelled lipid II was 5 µM and the total concentration of lipid II (labelled plus unlabelled) was made 15 µM by adding unlabelled lipid II.
-
Figure 1—figure supplement 4—source data 1
Numerical data to support graphs in Figure 1—figure supplement 4.
- https://cdn.elifesciences.org/articles/61525/elife-61525-fig1-figsupp4-data1-v2.xlsx
Figure 2 with 1 supplement
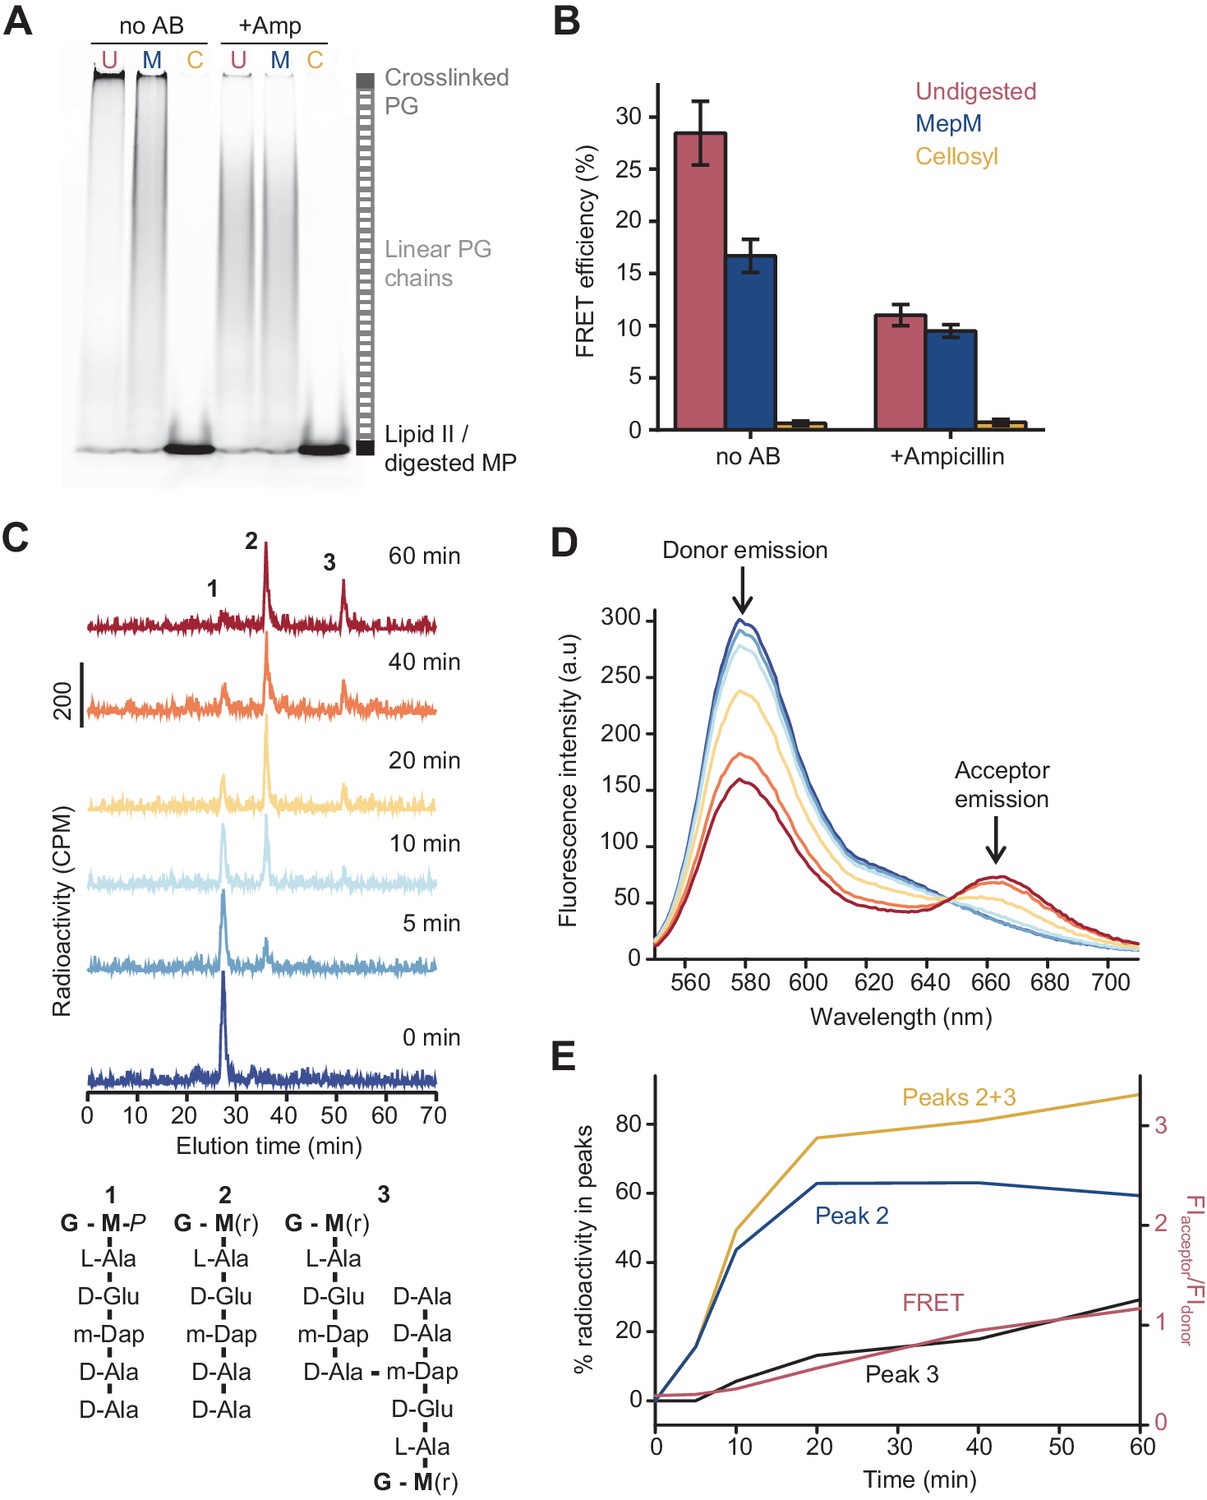
The Förster resonance energy transfer (FRET) signal arises from both the glycosyltransferase and transpeptidase reactions.
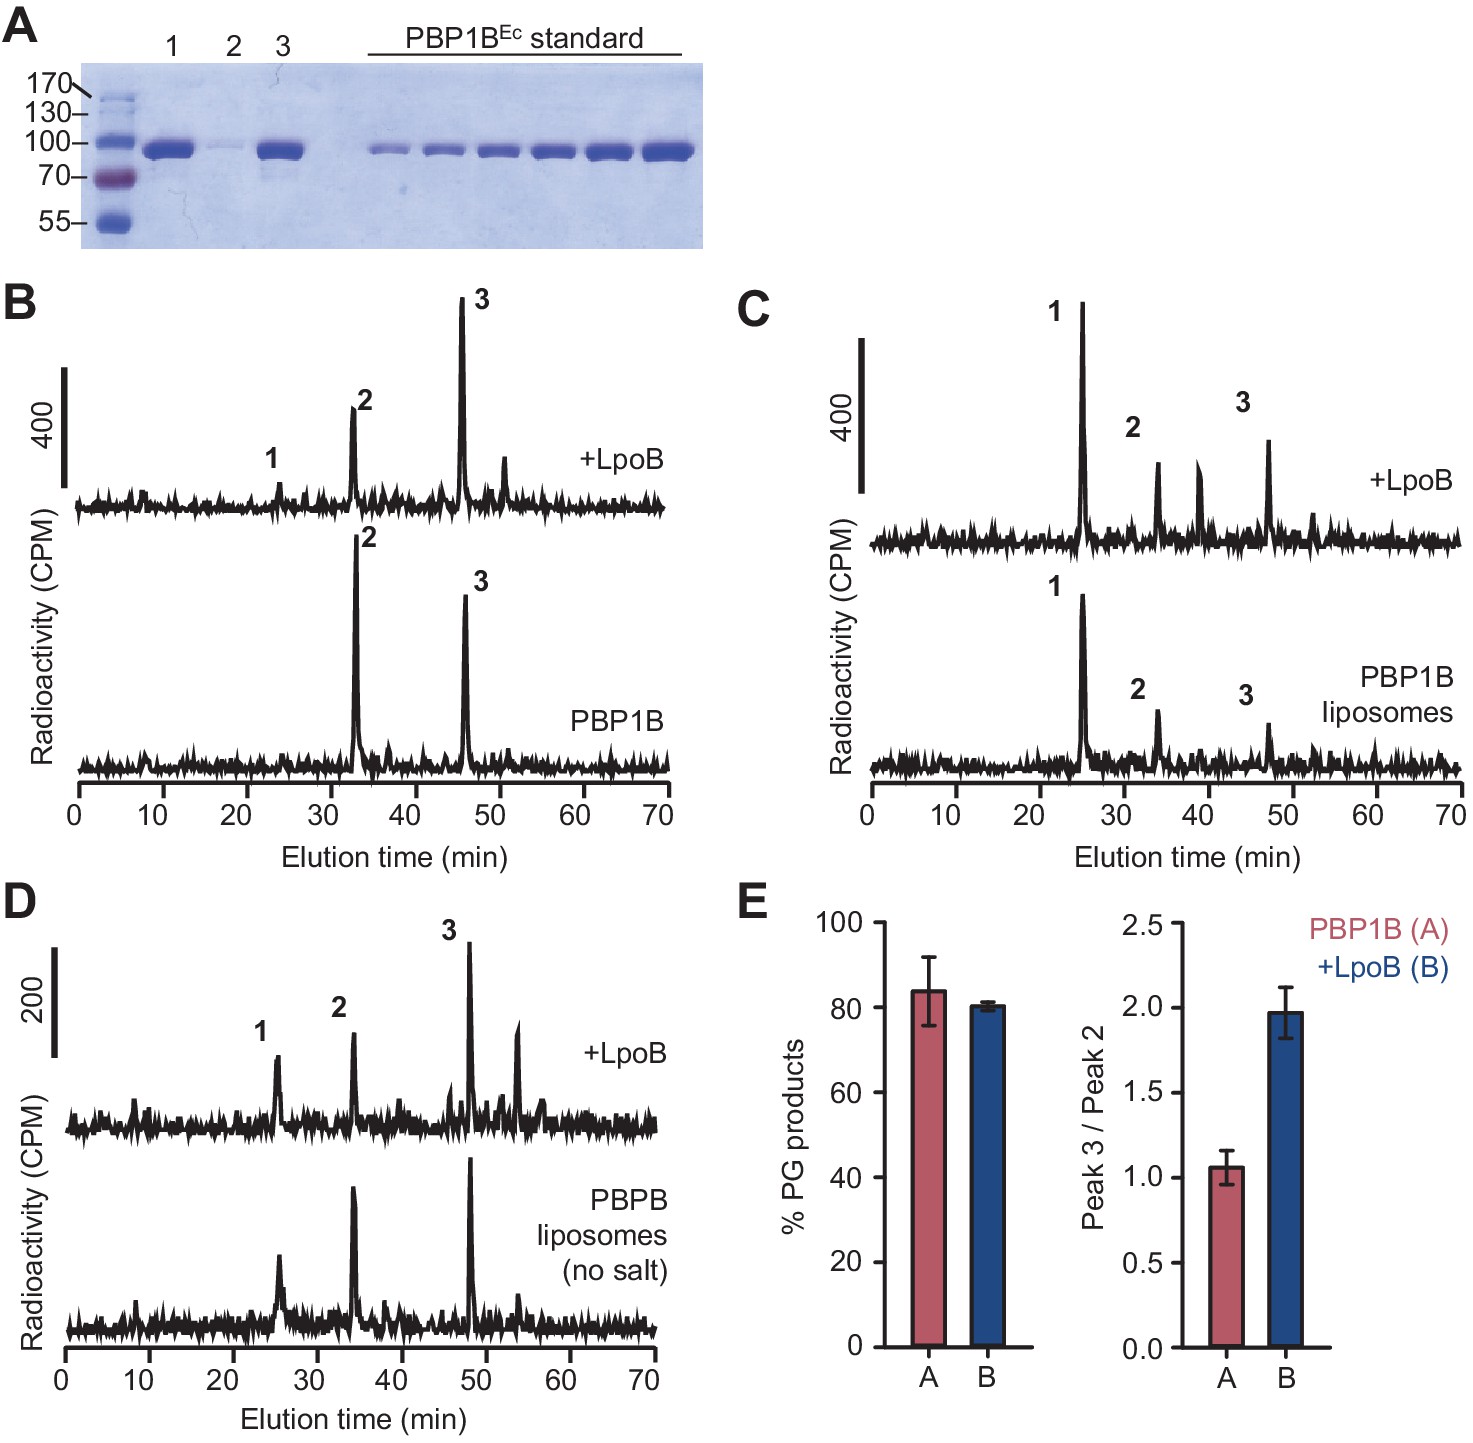
(A) Peptidoglycan (PG) synthesized in reactions of PBP1BEc in the presence or absence of 1 mM ampicillin was incubated with no PG hydrolase (U), DD-endopeptidase MepM (M), or muramidase cellosyl (C), and aliquots were analysed by SDS-PAGE. Reaction conditions were the same as indicated in Figure 1B–D. (B) FRET efficiency for samples prepared as indicated in A, calculated using the (ratio)A method (see Materials and methods). Values are mean ± SD of at least three independent experiments. (C) PBP1BEc (0.5 µM) was incubated with 5 µM each of lipid II-Atto647n, lipid II-Atto550, and 14C-labelled lipid II. At indicated time points, aliquots were taken and reactions were stopped by addition of moenomycin. After measuring fluorescence (see D), the PG was digested with the muramidase cellosyl, and the resulting muropeptides were reduced with sodium borohydride and separated by HPLC. The structures of muropeptides corresponding to peaks 1–3 are shown below the chromatograms. (D) Fluorescence spectra taken with excitation at 522 nm for the samples described in C. (E) Quantification of peak 2 (GTase product, blue), peak 3 (GTase+TPase, black), or the sum of both 2 and 3 (yellow) from chromatograms in C, along with the FRET signal (red) calculated as the ratio of acceptor emission over donor emission from data in D.
-
Figure 2—source data 1
Numerical data to support graphs in Figure 2 and original gel images for Figure 2B.
- https://cdn.elifesciences.org/articles/61525/elife-61525-fig2-data1-v2.zip
Figure 2—figure supplement 1
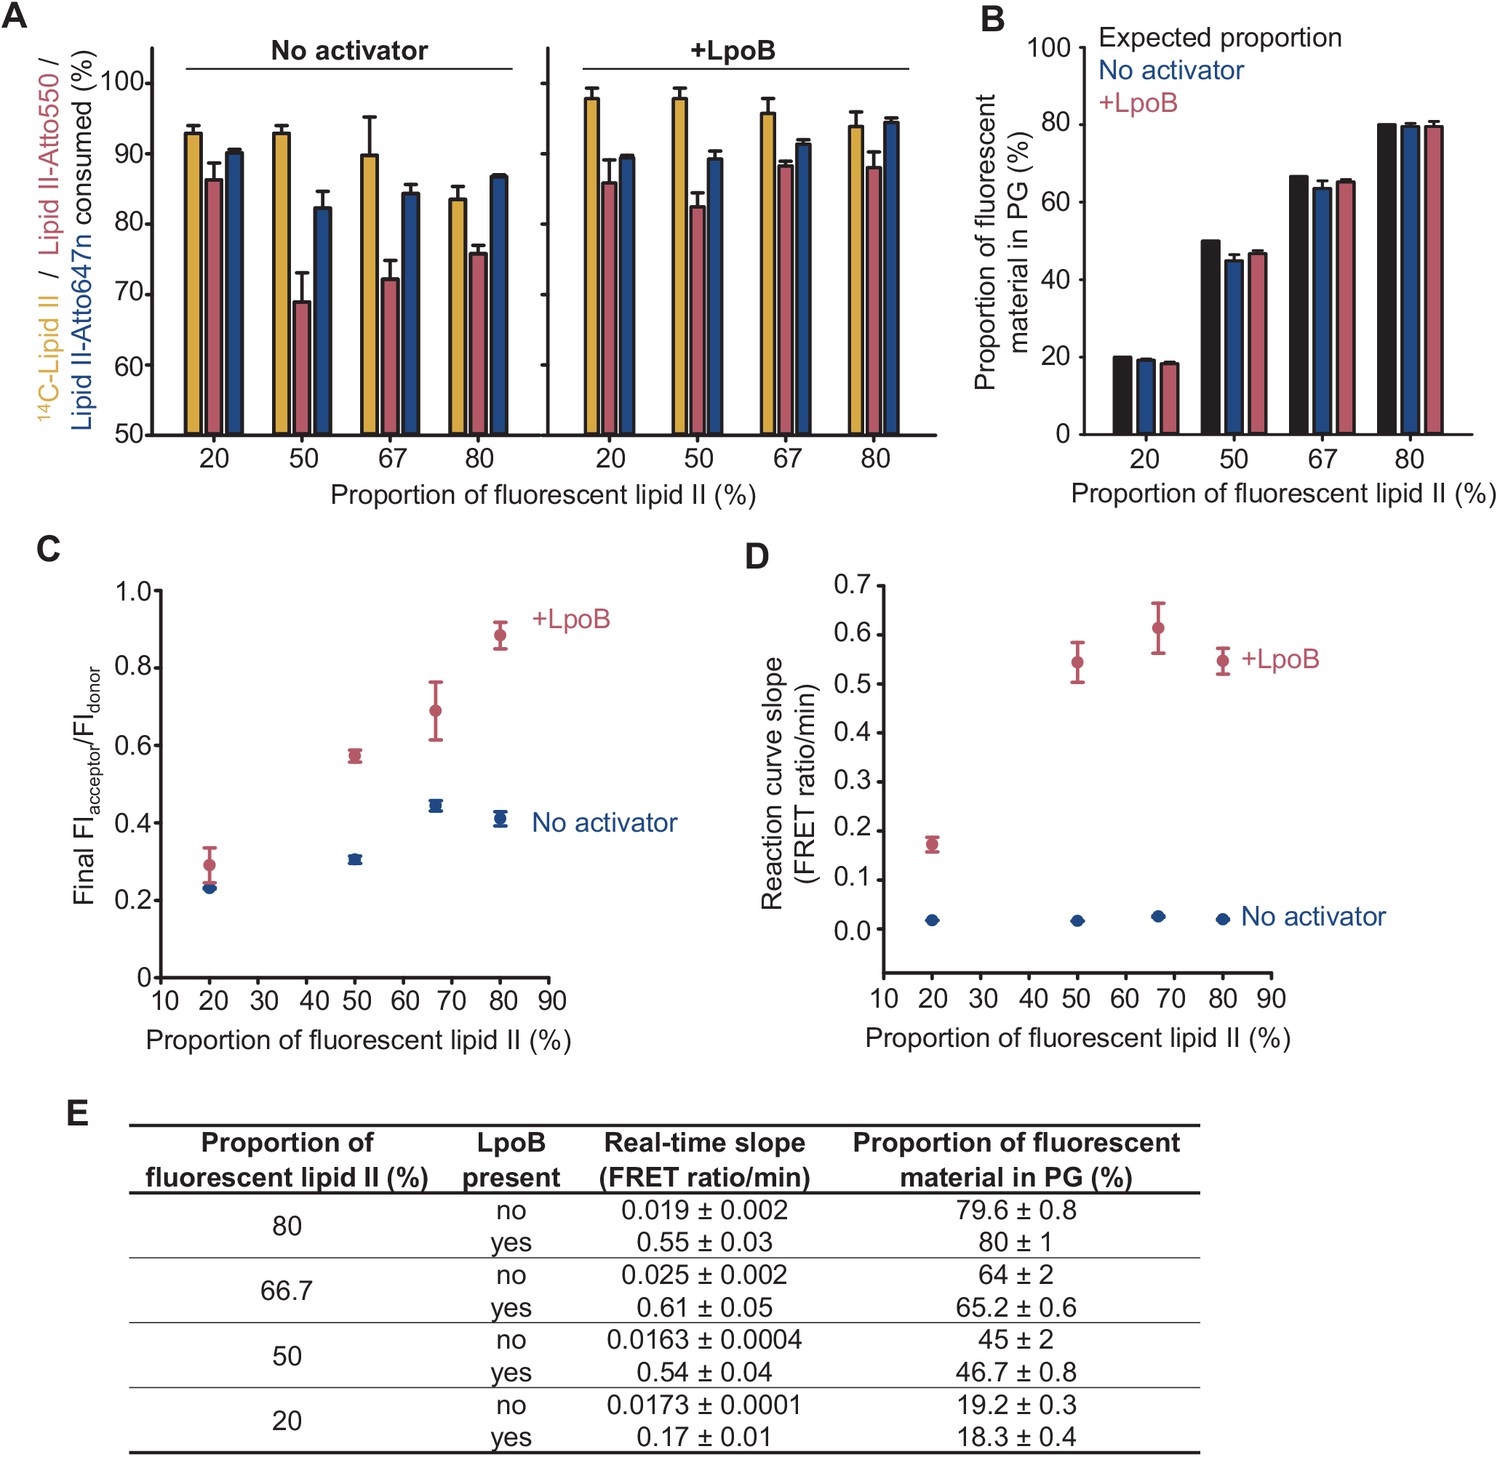
Effect of proportion of labelled lipid II substrates on PBP1BEc activity in detergents.
Triton X-100-solubilized PBP1BEc with or without LpoB were incubated with mixtures of lipid II substrates (14C-lipid II, lipid II-Atto550, and lipid II-Atto647) with increasing molar proportions of fluorescently labelled lipid II over the total amount of substrate. Reactions were monitored by fluorescence measurements, and each version of lipid II was quantified at the end. The total concentration of lipid II was kept at 15 µM while the molar ratio of lipid II-Atto550 to lipid II-Atto647n was always 1:1. (A) Consumption of each version of lipid II, monitored as described in Materials and methods, was higher in the presence of LpoB and decreased slightly with higher amounts of labelled lipid II. In all cases, the consumption of 14C-lipid II was slightly higher than that of fluorescent lipid II substrates. (B) The proportion of fluorescent material incorporated into peptidoglycan, calculated based on the consumption data in A, did not deviate significantly from the proportion of fluorescent substrates at the start of reactions. (C) A higher proportion of fluorescent lipid II increased the final FIacceptor/FIdonor ratio, but the increase was higher in the presence of LpoB. (D) The initial slope of Förster resonance energy transfer reaction curves increased significantly with the proportion of labelled lipid II in the presence of LpoB but not in its absence. (E) Table listing the data represented in B and D. The real-time slope represents the increase in FIacceptor/FIdonor per minute at the start of reactions. All values are ± SD of three technical replicates.
-
Figure 2—figure supplement 1—source data 1
Numerical data to support graphs in Figure 2—figure supplement 1 and original gel images used to quantify labelled lipid II consumption.
- https://cdn.elifesciences.org/articles/61525/elife-61525-fig2-figsupp1-data1-v2.zip
Figure 3 with 8 supplements
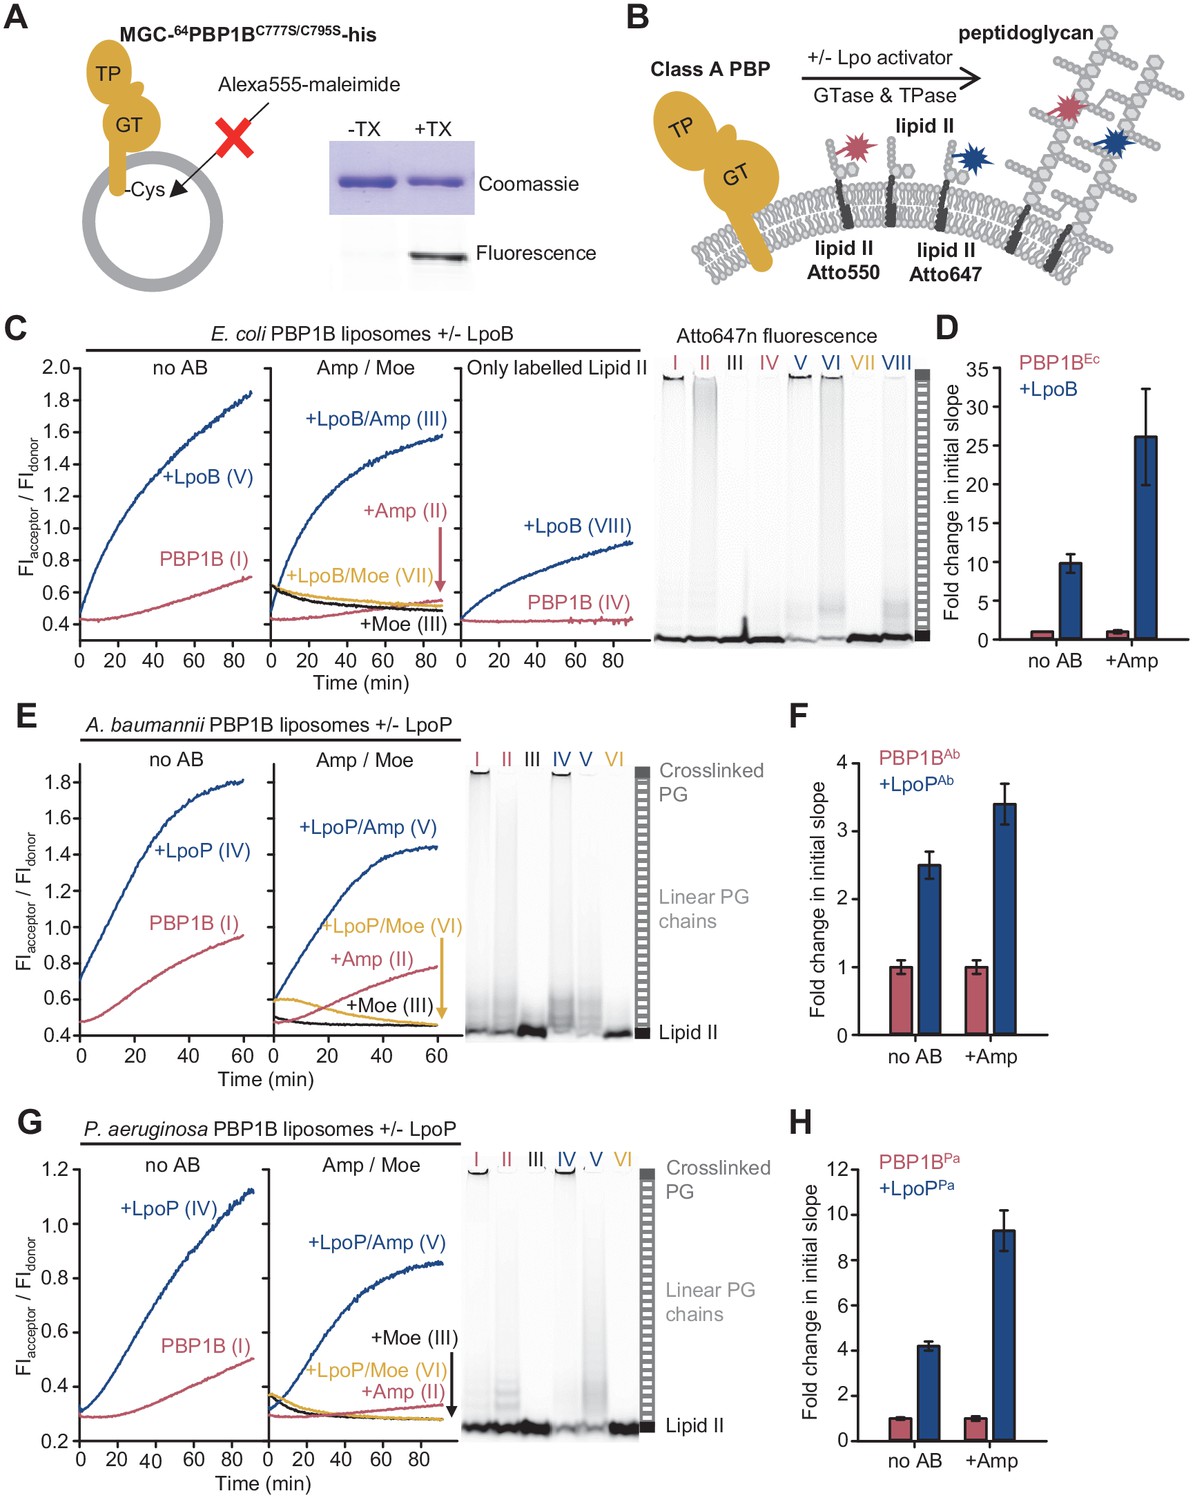
The Förster resonance energy transfer (FRET) assay for peptidoglycan synthesis can be adapted for reactions on liposomes.
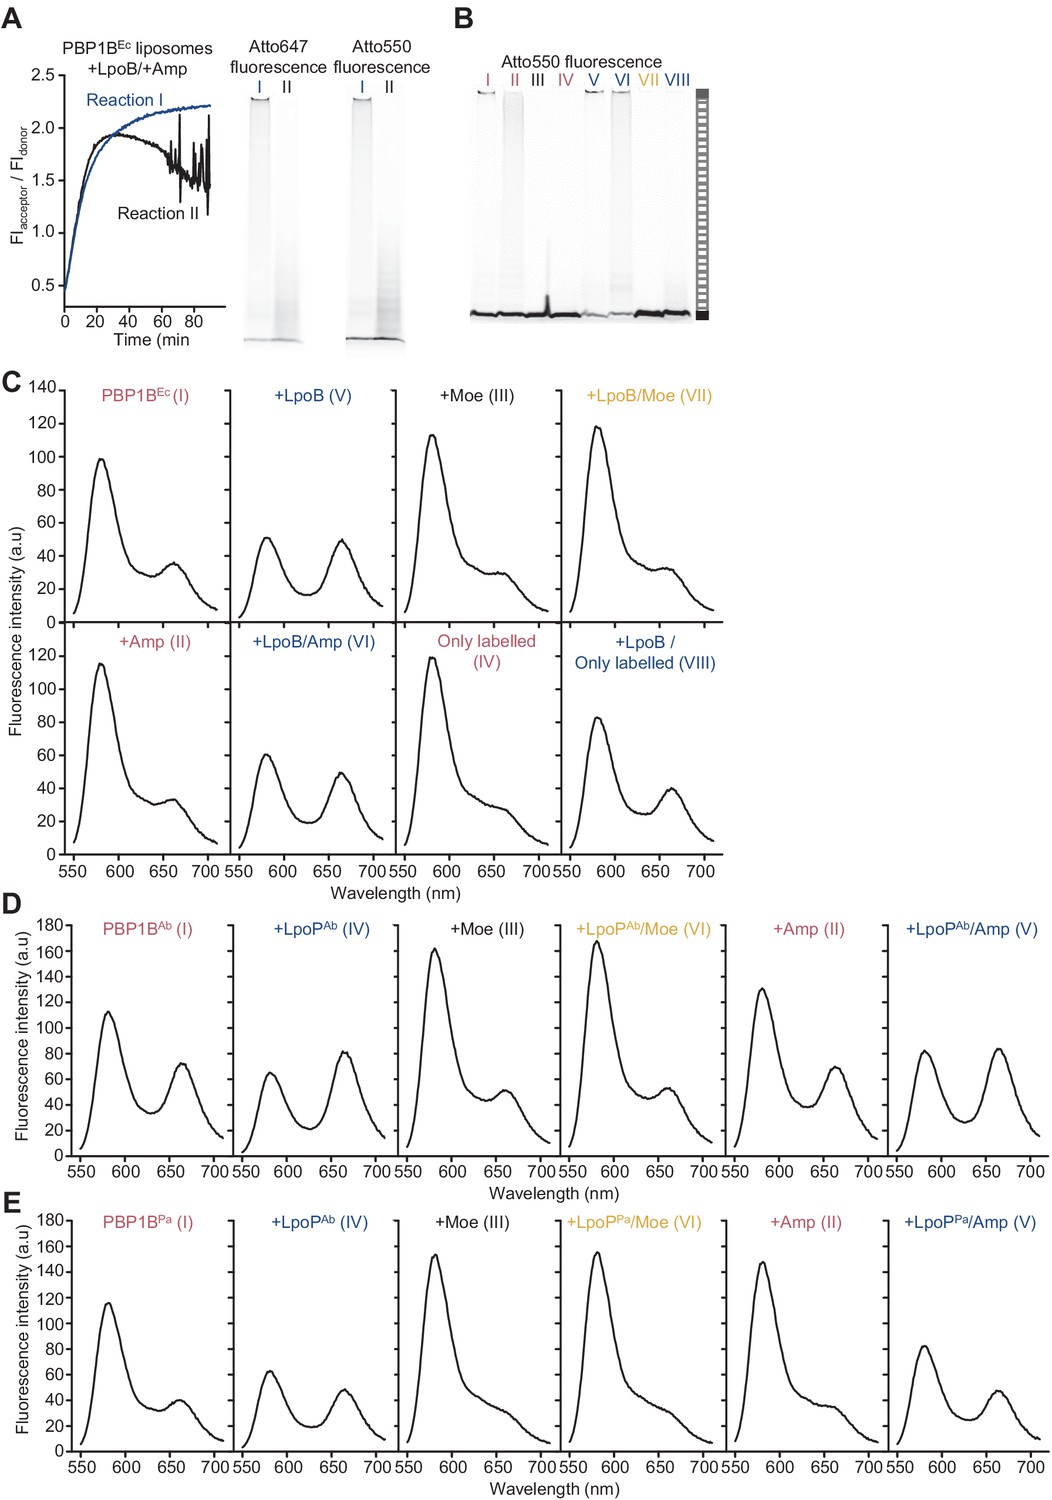
(A) Class A penicillin-binding proteins (PBPs) were reconstituted in E. coli polar lipid (EcPL) liposomes. To assess the orientation of the liposome-reconstituted PBPs, MGC-64PBP1B-his C777S C795S containing a single cysteine in the N-terminal region was reconstituted as in A. The accessibility of the cysteine was determined by staining with sulfhydryl-reactive fluorescent probe, Alexa Fluor555-maleimide, in the presence or absence of Triton X-100 (TX). Samples were analysed by SDS-PAGE with fluorescence scanning to detect labelled protein followed by Coomassie staining. (B) To perform activity assays in liposomes, class A PBPs were reconstituted along a 1:1 molar ratio mixture of Atto550-labelled lipid II and Atto647n-labelled lipid II in liposomes as in A. Reactions were started by addition of unlabelled lipid II in the presence or absence of lipoprotein activators (lpo). Using this methodology, we monitored the activity of PBP1BEc (C, D), PBP1BAb (E, F), and PBP1BPa (G, H). Representative reaction curves are shown. Reactions were carried out in the presence (blue lines) or absence (red lines) of the lipoprotein activators (LpoB(sol) for PBP1BEc, LpoPAb(sol) for PBP1BAb, and LpoPPa(sol) for PBP1BPa), and either in the absence of antibiotic (left) or presence of 1 mM ampicillin (Amp) or 50 µM moenomycin (Moe, black and yellow lines) (middle). For PBP1BEc, control reactions in the absence of unlabelled lipid II (right) are also shown. Products were analysed by SDS-PAGE followed by fluorescence scanning at the end of reactions (right side). Curves are numbered according to the corresponding lane on the SDS-PAGE gels. PBP1BEc, PBP1BAb, and PBP1BPa were reconstituted in EcPL liposomes containing labelled lipid II (0.5 mol% of lipids, 1:1 molar ratio mixture of Atto550-labelled lipid II and Atto647n-labelled lipid II), at protein-to-lipid molar ratios of 1:3000, 1:2000, and 1:3000, respectively. Reactions were started by adding unlabelled lipid II (final concentration 12 µM) and incubated at 37°C for 60 min (PBP1BEc and PBP1BAb) or 90 min (PBP1BPa) while monitoring fluorescence at 590 and 680 nm with excitation at 522 nm. (D), (F), and (H) show averaged initial slopes from reaction curves obtained by the FRET assay for liposome-reconstituted PBP1BEc, PBP1BAb, and PBP1BPa, respectively, in the presence (blue) or absence (red) of lipoprotein activators and in the presence or absence of ampicillin. Values are normalized relative to the slope in the absence of activator and are mean ± variation of two independent experiments.
-
Figure 3—source data 1
Numerical data to support graphs in Figure 3 and original gel images for Figure 3C, E and G.
- https://cdn.elifesciences.org/articles/61525/elife-61525-fig3-data1-v2.zip
Figure 3—figure supplement 1
Activity of membrane-reconstituted PBP1BEc is optimal in E. coli polar lipids at low ionic strength.
(A) Representative SDS-PAGE analysis of the reconstitution of PBP1BEc in liposomes made of E. coli polar lipids at a 1:3000 mol:mol protein:lipid ratio. After reconstitution, proteoliposome samples (lane 1) were centrifuged at low speed to remove aggregates and both pellet and supernatant samples were analysed (lanes 2 and 3, respectively). The supernatant was subsequently used for peptidoglycan (PG) synthesis reactions. A gradient of PBP1BEc (0.25, 0.41, 0.62, 0.82, 1.23, and 1.65 µg) was loaded as a standard to estimate protein concentration by densitometry. (B–D) Representative chromatograms showing the muropeptide analysis of PG produced by detergent-solubilized PBP1BEc (B) or liposome-reconstituted PBP1BEc in the presence or absence of NaCl (C and D, respectively). The concentration of PBP1BEC was 0.5 µM and, if added, that of LpoB(sol) was 2 µM LpoB(sol). The reaction buffer contained 150 mM NaCl in B and C. Samples were incubated at 37°C for 60 min in B and 90 min in C and D. The labelled peaks correspond to the muropeptides shown in Figure 1E. (E) Quantification of the total amount of radioactivity incorporated into PG (left) or the ratio between the radioactivity of peaks 3 and 2 (indicative of the degree of crosslinking of the PG, right) for activity assays for PBP1BEc in liposomes in the same conditions as in D. Values are mean ± SD (or variation) of at least two reactions.
Figure 3—figure supplement 2
The Förster resonance energy transfer (FRET) assay for peptidoglycan synthesis can be adapted for reactions on liposomes.
(A) Comparison of the two possible outcomes of FRET curves for reactions of PBP1BEc liposomes assayed in the presence of LpoB and ampicillin (left) and the final SDS-PAGE analysis of the same reactions (right). A third of assays in this condition resulted in curves similar to reaction I. Reaction conditions were the same as in Figure 3C. (B) The same gels depicted in Figure 3C, but scanned using the donor fluorescence (Atto550n). (C) Spectra corresponding to E. coli PBP1B reactions shown in Figure 3C, taken at t = 60 min. (D) Spectra corresponding to A. baumannii PBP1B reactions shown in Figure 3E, taken at t = 60 min. (E) Spectra corresponding to P. aeruginosa PBP1B reactions shown in Figure 3G, taken at t = 90 min.
-
Figure 3—figure supplement 2—source data 1
Numerical data to support graphs in Figure 3—figure supplement 2 and original gel images for Figure 3—figure supplement 2A.
- https://cdn.elifesciences.org/articles/61525/elife-61525-fig3-figsupp2-data1-v2.zip
Figure 3—figure supplement 3
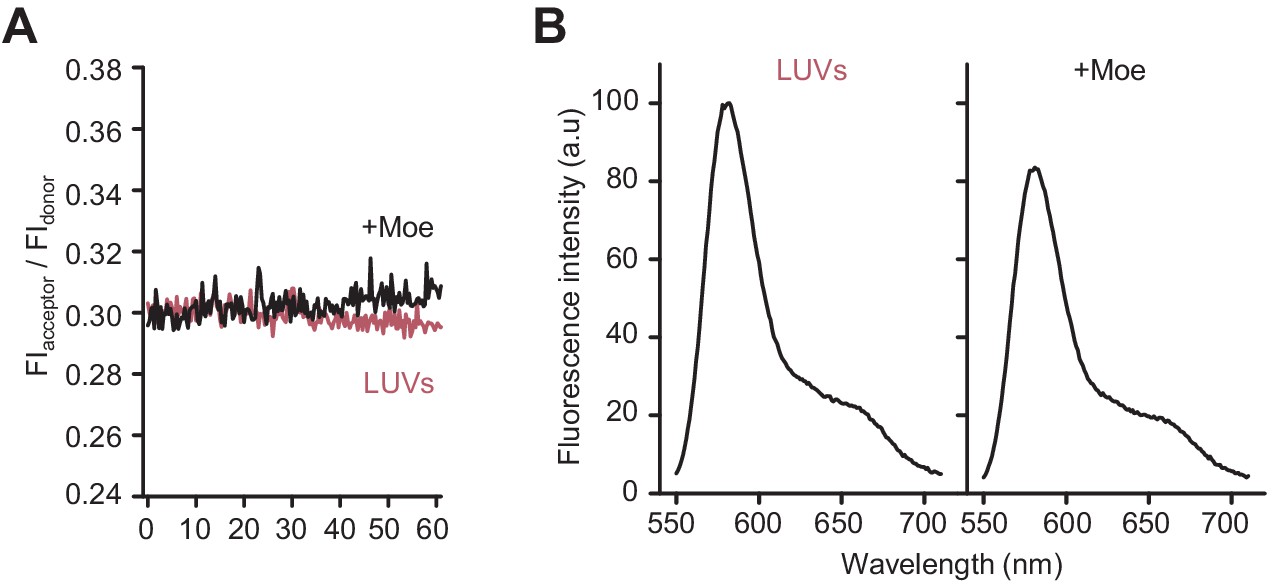
Moenomycin does not affect Förster resonance energy transfer (FRET) on liposomes with lipid II-Atto550 and lipid II-Atto647n in the absence of class A penicillin-binding proteins.
(A) E. coli polar lipids liposomes incorporating an equimolar amount of lipid II-Atto550 and lipid II-Atto647n at 0.5% mol of the total lipid contents were incubated in the presence of 12 µM lipid II and in the presence (black line) or absence (red line) of 50 µM moenomycin for 60 min at 37°C while monitoring FRET as indicated in Materials and methods. (B) Fluorescence spectra for the samples described in A at the end of the incubation period (t = 60 min).
-
Figure 3—figure supplement 3—source data 1
Numerical data to support graphs in Figure 3—figure supplement 3.
- https://cdn.elifesciences.org/articles/61525/elife-61525-fig3-figsupp3-data1-v2.xlsx
Figure 3—figure supplement 4
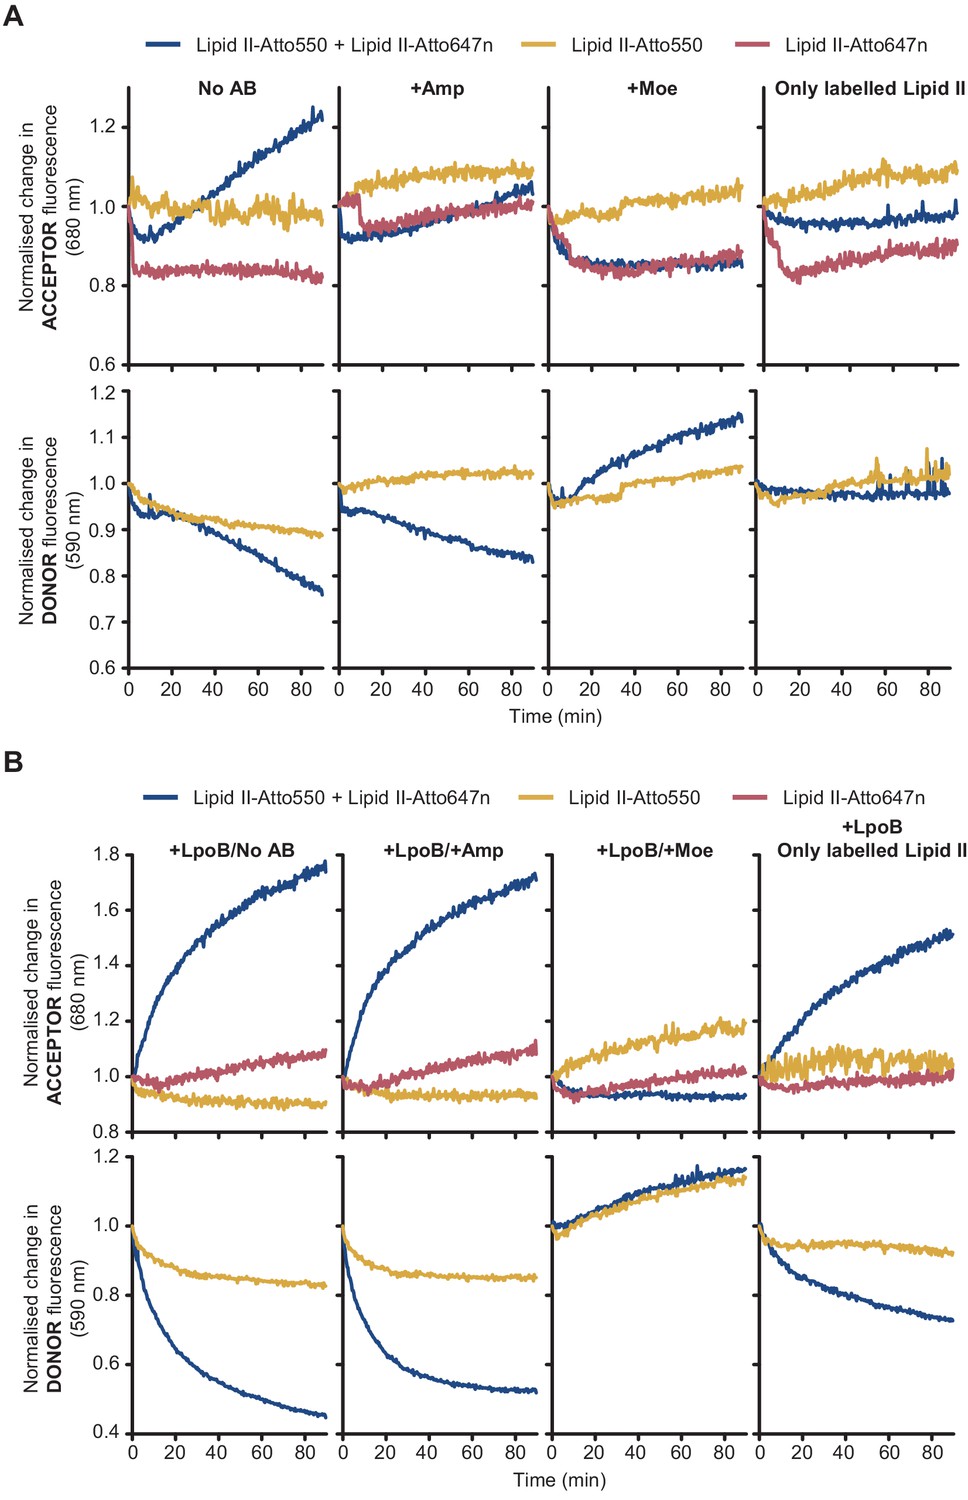
Fluorescence intensity (FI) of lipid II-Atto550 and lipid II-Atto647n in the membrane only changes significantly during reactions when both species are present.
FI at the acceptor and donor emission wavelengths (590 and 680 nm, respectively) only changed significantly when there was peptidoglycan synthesis activity in liposomes and both lipid II-Atto647n and lipid II-Atto550 were co-reconstituted in the same liposomes. Moreover, these changes were indicative of Förster resonance energy transfer (decrease at the donor wavelength and increase at the acceptor wavelength). (A) Reactions with PBP1BEc reconstituted in liposomes along different combinations of labelled substrates (lipid II-Atto550, yellow; lipid II-Atto647n, red; or a mixture of both, blue) were monitored in real time by measuring fluorescence intensity at 590 nm (bottom row) and 680 nm (top row). Reactions with lipid II-Atto647n only were monitored at 680 nm only. Reactions were performed in four conditions (left to right): with no antibiotics, with 1 mM ampicillin, with 100 µM moenomycin, or omitting unlabelled lipid II. Changes in FI were normalized by calculating the ratio FI(ti)/FI(t = 0). (B) Same reactions as in A, but performed in the presence of activator LpoB. In both A and B, reactions were started by addition of 12 or 24 µM non-fluorescent lipid II (for reactions with both fluorescent lipid II variants or reactions with variants, respectively), except in the indicated control condition.
-
Figure 3—figure supplement 4—source data 1
Numerical data to support graphs in Figure 3—figure supplement 4.
- https://cdn.elifesciences.org/articles/61525/elife-61525-fig3-figsupp4-data1-v2.xlsx
Figure 3—figure supplement 5
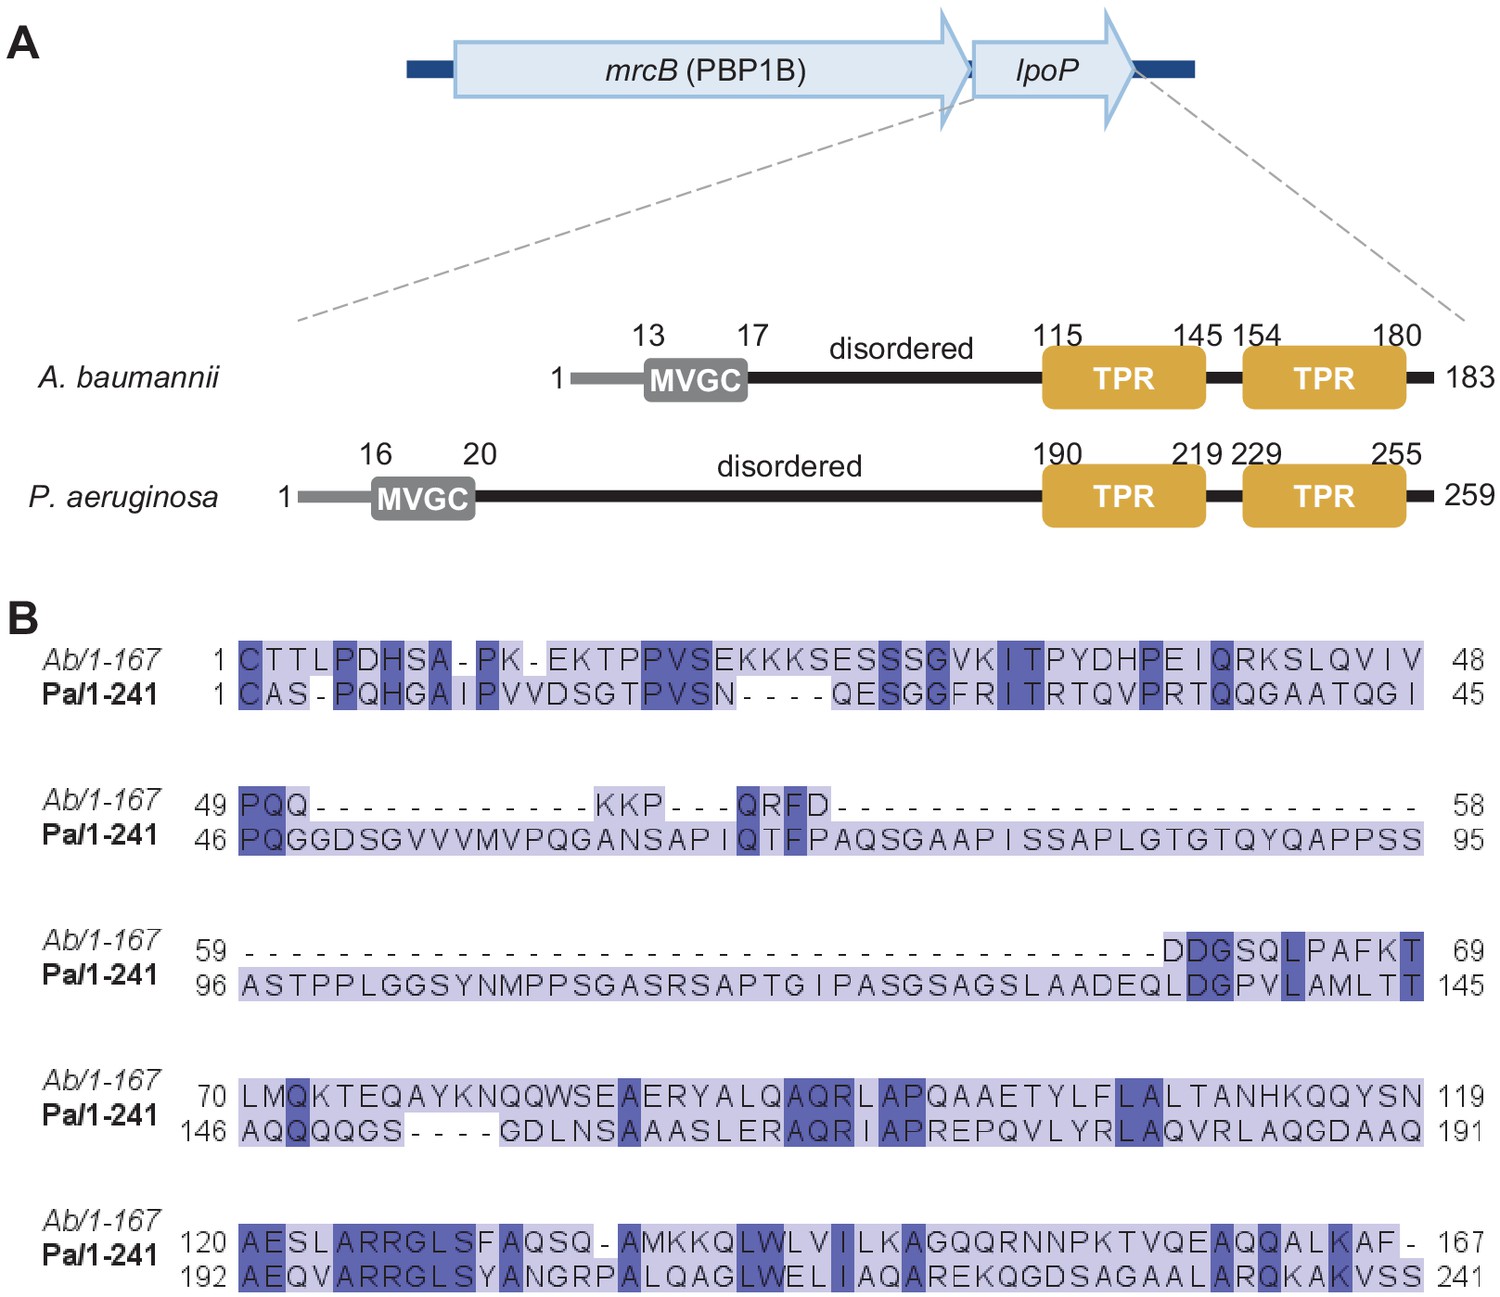
Amino acid sequence comparison between LpoP homologues from A.baumannii and P.aeruginosa.
(A) In the genomes of A. baumannii and P. aeruginosa, the gene encoding LpoP is present within the same operon as the gene encoding their cognate PBP1B. Both LpoP proteins are predicted lipoproteins with a disordered region between the N-terminal Cys and the C-terminal globular domain containing the tetratricopeptide repeats (TPRs). LpoPAb has a shorter disordered linker than LpoPPa. (B) Sequence comparison between the globular regions of LpoPAb (Ab) and LpoPPa (Pa). Proteins sequences (minus the signal peptides) were aligned using T-COFFEE EXPRESSO, and the resulting alignment was visualized using JALVIEW. Residues conserved in both proteins are highlighted in a darker colour.
Figure 3—figure supplement 6
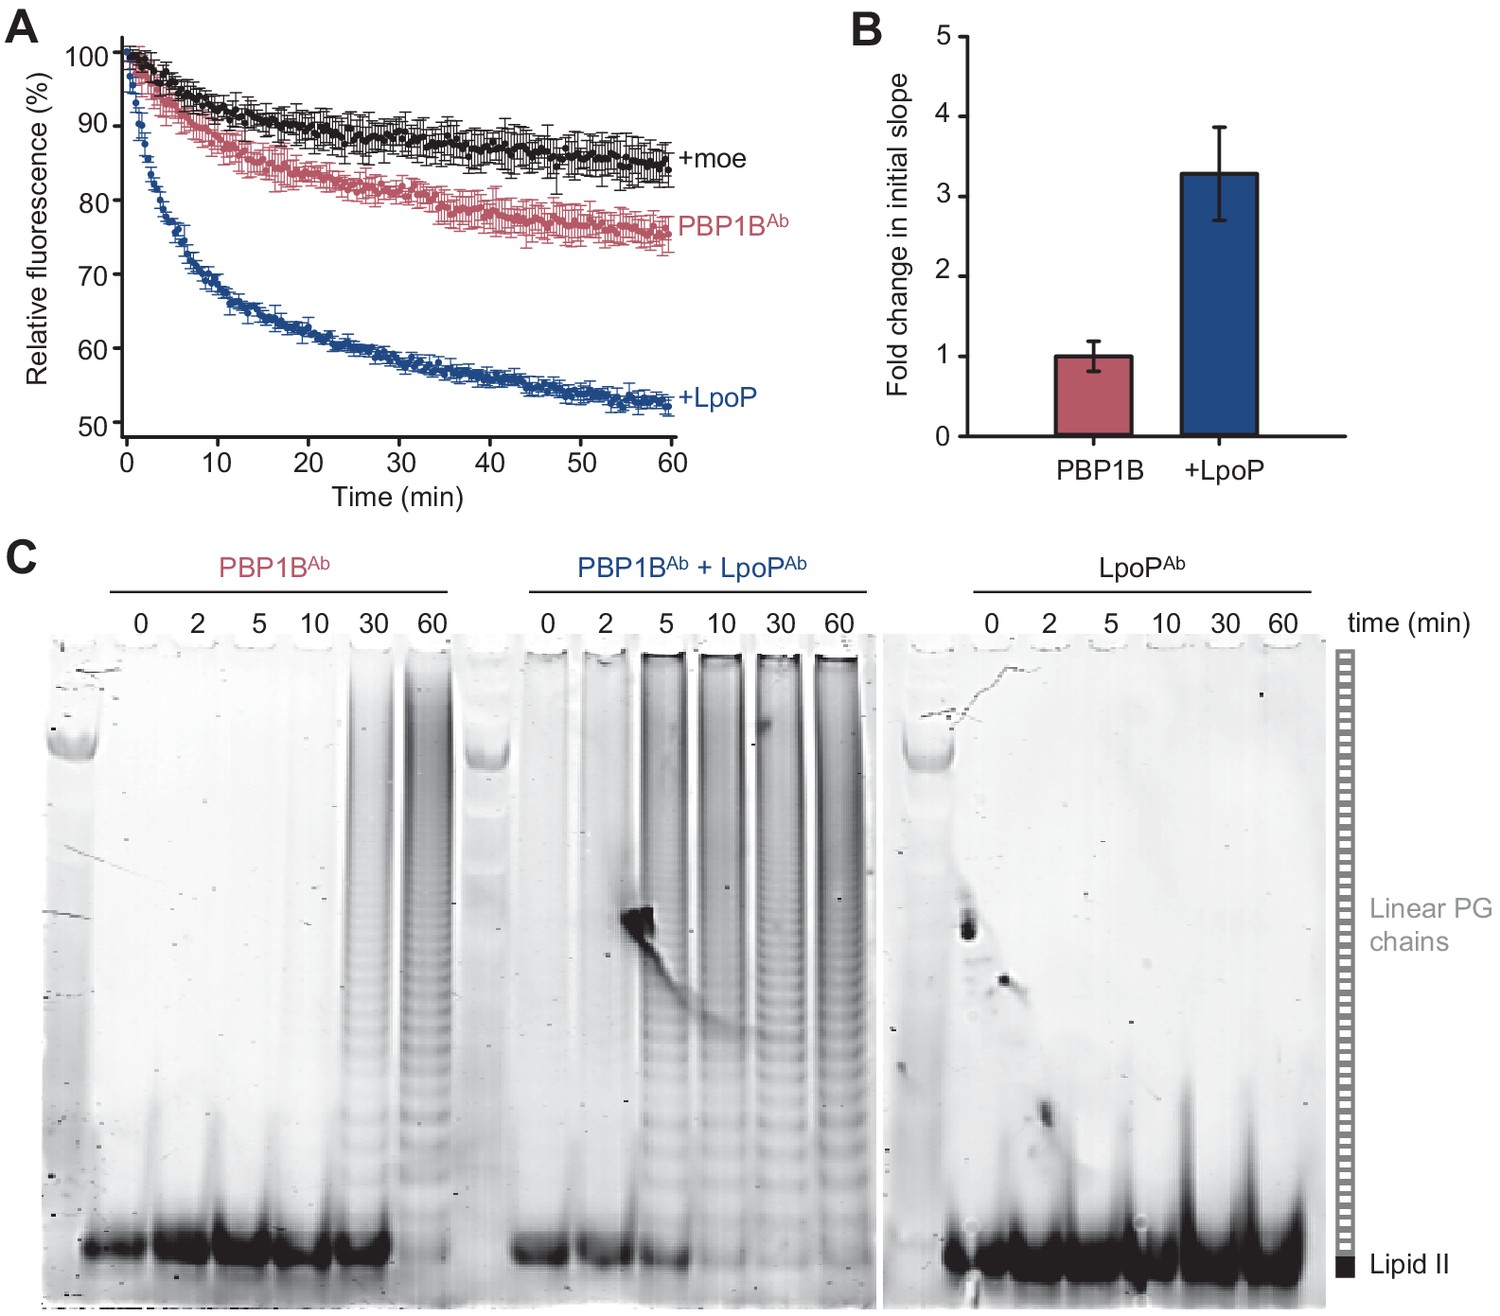
LpoPAb stimulates the glycosyltransferase activity of PBP1BAb.
(A) Real-time glycosyltransferase activity assays using dansyl-lipid II and detergent-solubilized A. baumannii PBP1B (PBP1BAb). PBP1BAb (0.5 µM) was mixed with 10 µM dansyl-lipid II in the presence or absence of soluble 0.5 µM A. baumannii LpoP (LpoPAb(sol)). A control was performed by adding 50 µM moenomycin (black). Each data point represents mean ± SD of three independent experiments. (B) Averaged initial slopes from reaction curves in A. Values are normalized relative to the slope in the absence of activator and are mean ± SD of three independent experiments. (C) Time-course GTase assay by SDS-PAGE followed by fluorescence detection. Detergent-solubilized PBP1BAb was incubated with 5 µM lipid II-Atto550 and 25 µM unlabelled lipid II in the presence or absence of 1.5 µM LpoPAb(sol). Reactions contained 1 mM ampicillin to block transpeptidation. Aliquots were taken at the indicated times (in min), boiled, and analysed by SDS-PAGE. A control in which only LpoPAb(sol) was present is also shown.
-
Figure 3—figure supplement 6—source data 1
Numerical data to support graphs in Figure 3—figure supplement 6.
- https://cdn.elifesciences.org/articles/61525/elife-61525-fig3-figsupp6-data1-v2.xlsx
Figure 3—figure supplement 7
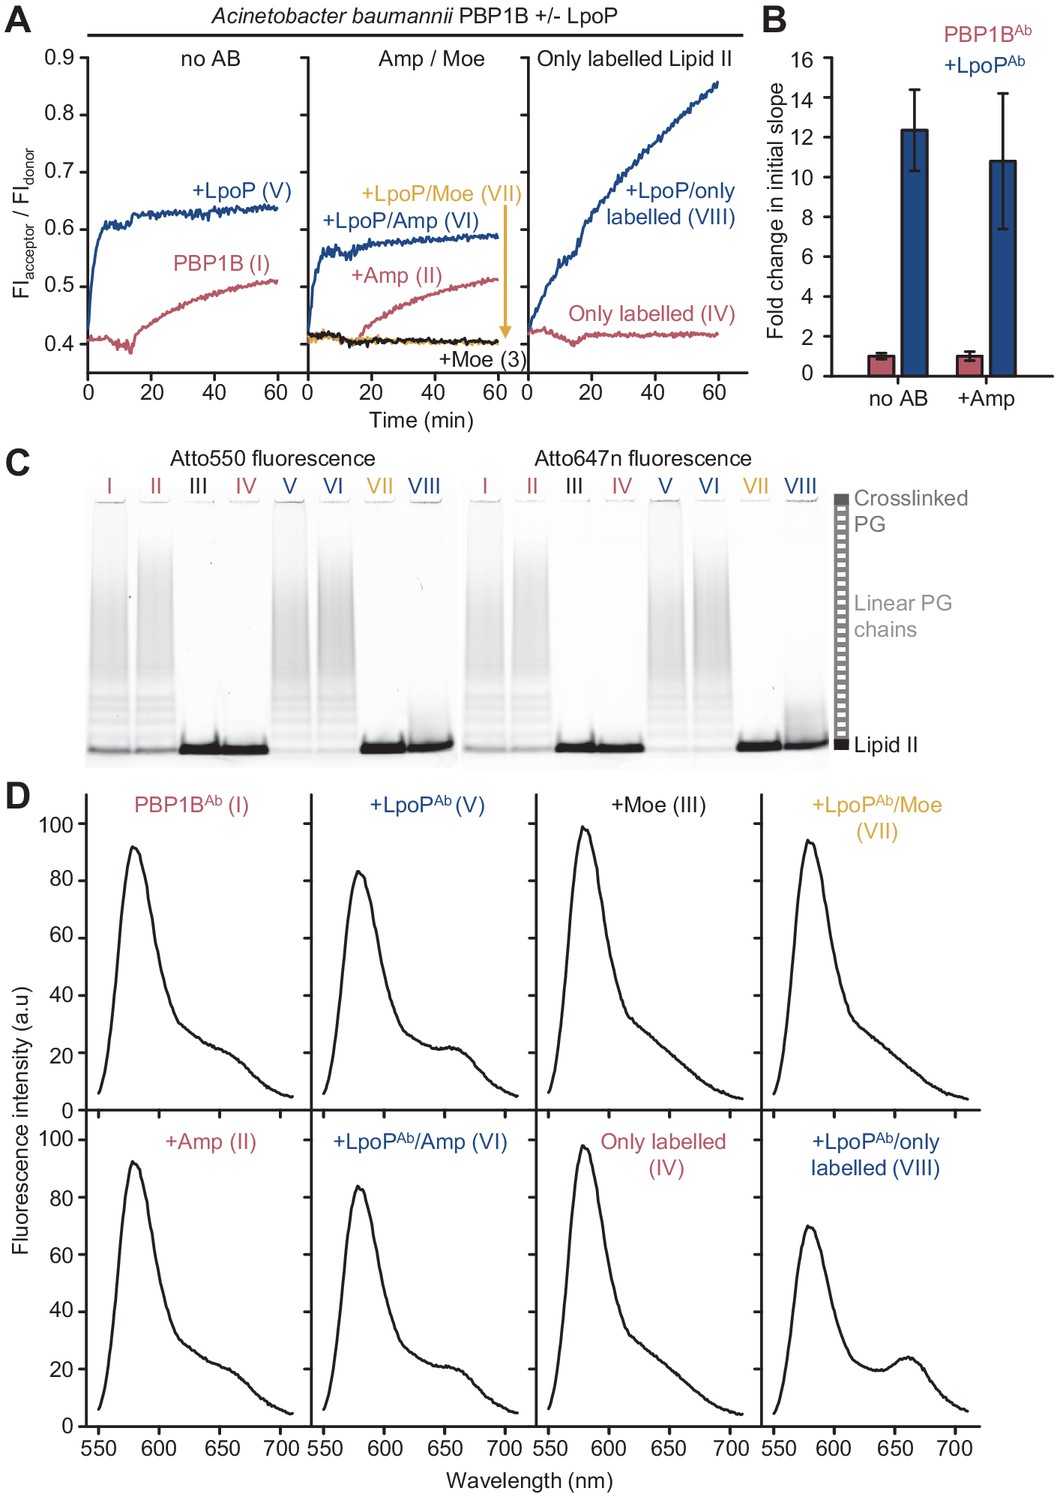
Peptidoglycan synthesis activity of A.baumannii PBP1B in the presence of Triton X-100 followed by Förster resonance energy transfer (FRET).
(A) Representative FRET curves for activity assays using detergent-solubilized A. baumannii PBP1B (PBP1BAb). PBP1BAb (0.5 µM) was mixed with unlabelled lipid II, Atto550-labelled lipid II, and Atto647n-labelled lipid II at a 1:1:1 molar ratio (5 µM of each) in the presence or absence of 2 µM soluble A. baumannii LpoP (LpoPAb(sol)). Controls were performed by adding 50 µM moenomycin in the absence (black) or presence (yellow) of LpoPAb(sol). Reactions were performed without antibiotic (left), with 1 mM ampicillin (middle), or in the absence of unlabelled lipid II (right). The numbers indicate the corresponding lane of the gel in C. Samples were incubated for 60 min at 30°C. (B) Averaged initial slopes from reaction curves obtained by the FRET assay for detergent-solubilized PBP1BAb in the presence (blue) or absence (red) of LpoP and in the presence or absence of ampicillin. Values are normalized relative to the slope in the absence of activator for each condition and are mean ± SD of two independent experiments. (C) Aliquots after reactions in A were boiled and analysed by SDS-PAGE followed by fluorescence detection. (D) Fluorescence emission spectra taken after reactions in A (t = 60 min).
-
Figure 3—figure supplement 7—source data 1
Numerical data to support graphs in Figure 3—figure supplement 7 and original gel images for gels in Figure 3—figure supplement 7C.
- https://cdn.elifesciences.org/articles/61525/elife-61525-fig3-figsupp7-data1-v2.zip
Figure 3—figure supplement 8
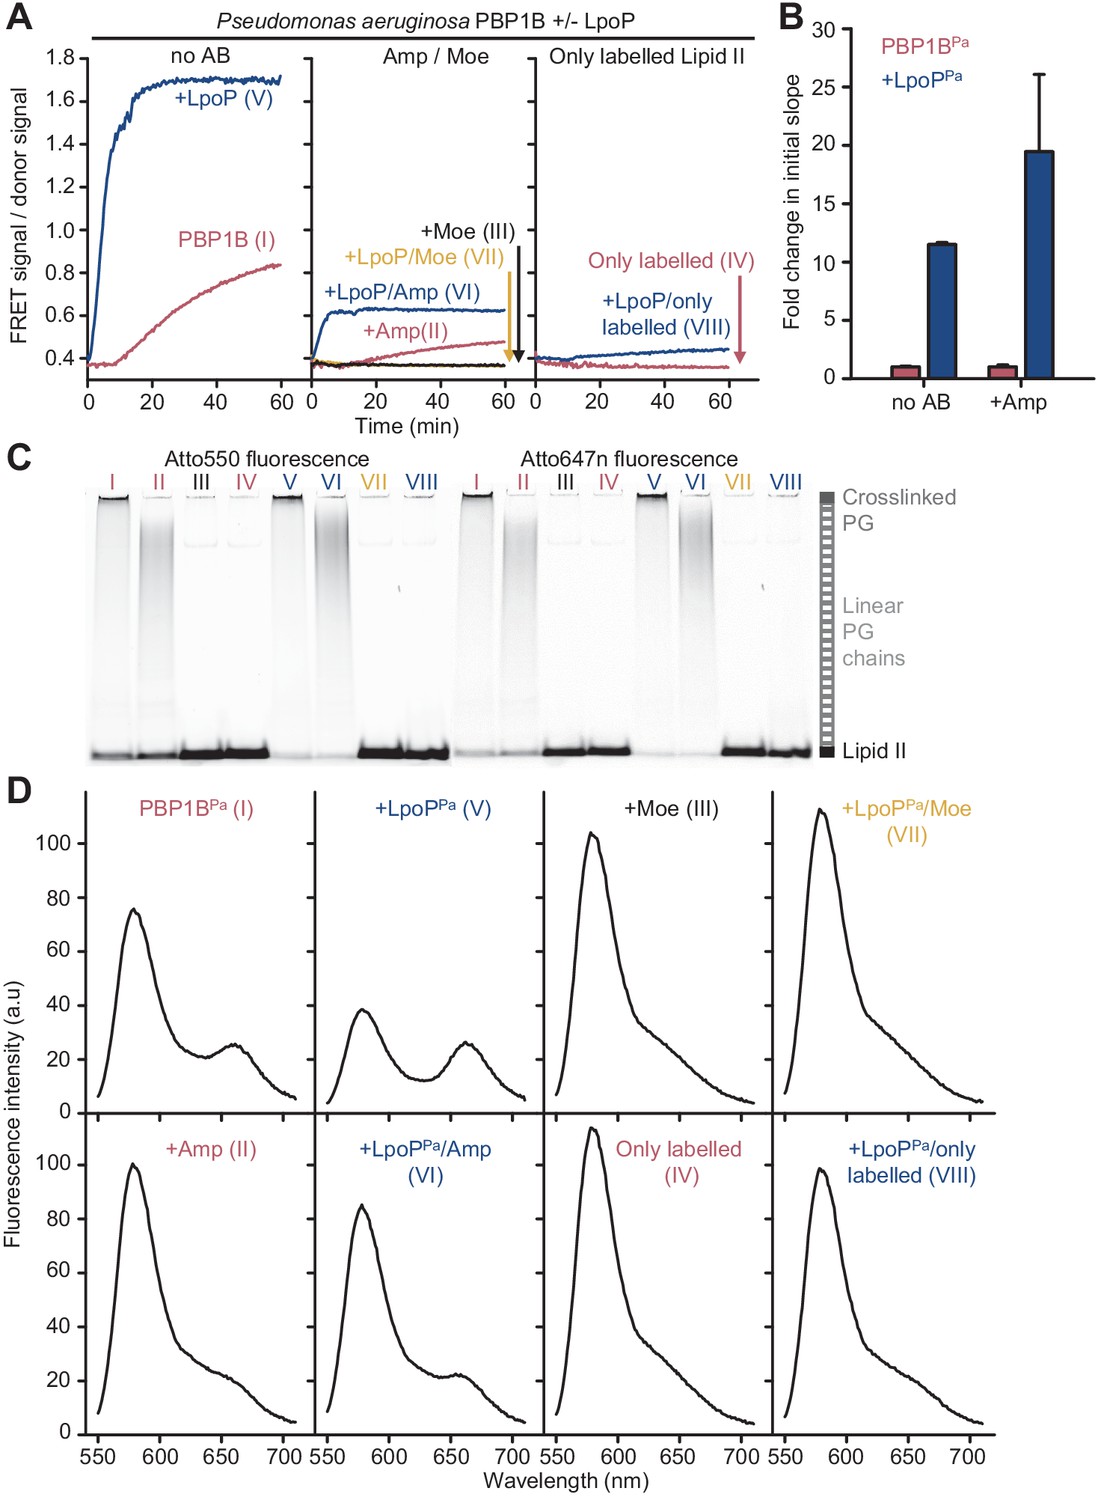
Peptidoglycan synthesis activity of P. aeruginosa PBP1B in the presence of Triton X-100 followed by Förster resonance energy transfer (FRET).
(A) Representative FRET curves for activity assays using detergent-solubilized P. aeruginosa PBP1B (PBP1BPa). PBP1BPa (0.5 µM) was mixed with unlabelled lipid II, Atto550-labelled lipid II, and Atto647n-labelled lipid II at a 1:1:1 molar ratio (5 µM of each) in the presence or absence of 2 µM soluble P. aeruginosa LpoP (LpoPPa (sol)). Controls were performed by adding 50 µM moenomycin in the absence (black) or presence (yellow) of LpoPPa(sol). Reactions were performed without antibiotic (left), with 1 mM ampicillin (middle), or in the absence of unlabelled lipid II (right). The numbers indicate the corresponding lane of the gel in C. Samples were incubated for 90 min at 37°C. (B) Averaged initial slopes from reaction curves obtained by the FRET assay for detergent-solubilized PBP1BPa in the presence (blue) or absence (red) of LpoP and in the presence or absence of ampicillin. Values are normalized relative to the slope in the absence of activator for each condition and are mean ± SD of 2–3 independent experiments. (C) Aliquots after reactions in A were boiled and analysed by SDS-PAGE followed by fluorescence detection. (D) Fluorescence emission spectra taken after reactions in A (t = 90 min).
-
Figure 3—figure supplement 8—source data 1
Numerical data to support graphs in Figure 3—figure supplement 8 and original gel images for gels in Figure 3—figure supplement 8C.
- https://cdn.elifesciences.org/articles/61525/elife-61525-fig3-figsupp8-data1-v2.zip
Figure 4 with 2 supplements
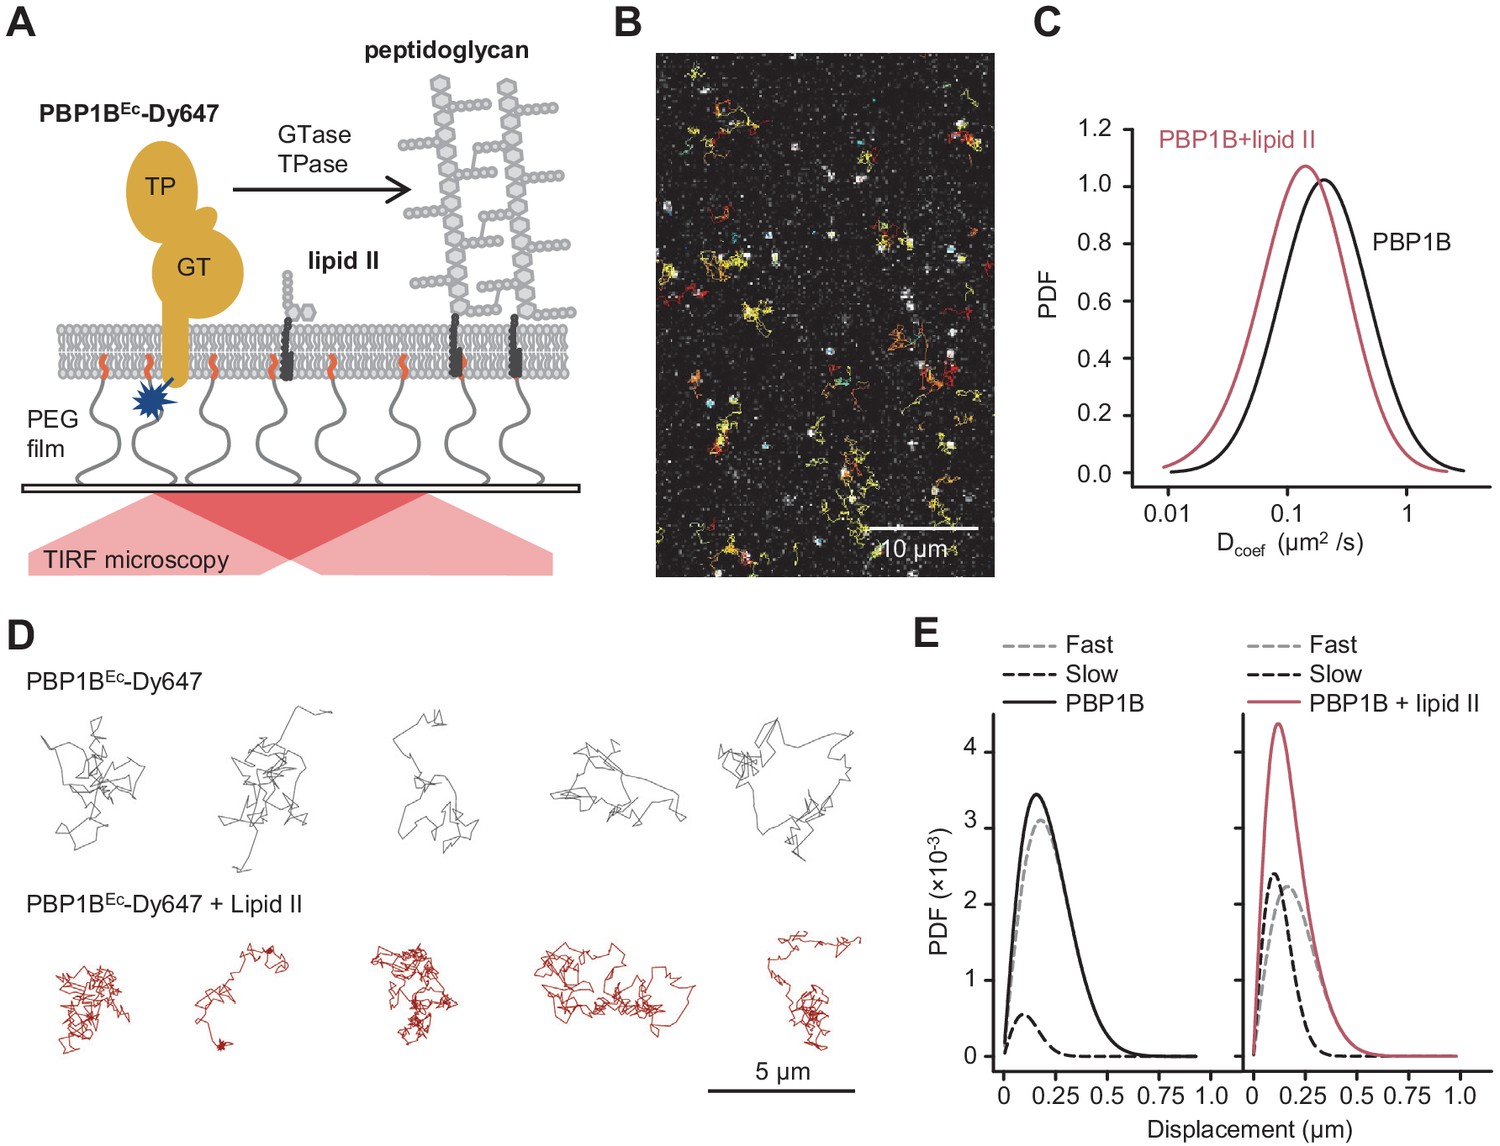
Addition of lipid II slows down diffusion of PBP1B on supported lipid bilayers.
(A) Schematic illustration of the approach (not to scale). A single-cysteine version of PBP1BEc (MGC-64PBP1B-his C777S C795S) labelled with fluorescent probe Dy647 in its single Cys residue (PBP1BEc-Dy647) was reconstituted into a polymer-supported lipid membrane formed with E. coli polar lipids, and its diffusion was monitored using TIRF microscopy in the presence or absence of substrate lipid II. (B) Single-molecule TIRF micrograph of PBP1BEc-Dy647 diffusing in the lipid membrane in the presence of 1.5 µM lipid II (corresponding to Video 1). Calculated particle tracks are overlaid. (C) Histograms of diffusion coefficients (Dcoef) of PBP1BEc-Dy647 particles in the presence (red) or absence (black) of lipid II. The average Dcoef decreased from 0.23 ± 0.06 µm2/s to 0.1 ± 0.04 µm2/s upon addition of lipid II. Values are mean ± SD of tracks from three independent experiments. (D) Representative tracks for diffusing PBP1BEc-Dy647 particles in the absence (black, top) or presence of lipid II (red, bottom), showing the absence of confined motion in the presence of lipid II. (E) Displacement distributions of PBP1BEc-Dy647 particles (solid lines) in the absence (left) or presence (right) of lipid II were analysed using a Rayleigh model incorporating two populations of particles, a fast-diffusing one (grey dashed lines) and a slow-diffusing one (black dashed lines). In the absence of lipid II, only 8 ± 5% of the steps were classified into the slow fraction (121 ± 6 nm average displacement), while the majority of steps were of 257 ± 6 nm (fast fraction). The slow fraction increased upon addition of lipid II to 37 ± 5% of the steps, with an average displacement of 132 ± 16 nm.
-
Figure 4—source data 1
Numerical data to support graphs in Figure 4.
- https://cdn.elifesciences.org/articles/61525/elife-61525-fig4-data1-v2.xlsx
Figure 4—figure supplement 1
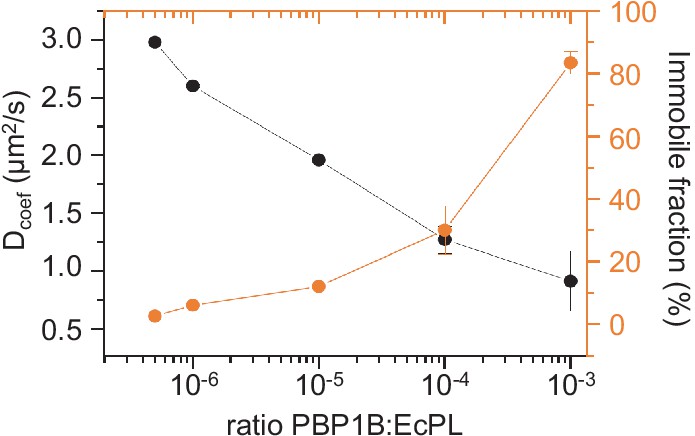
Control of membrane fluidity and integrity upon reconstitution of E. coli PBP1B.
(A) The fluidity of supported lipid bilayers (SLBs) is reduced when increasing PBP1BEc density. The diffusion of phospholipid probe DOPE-rhodamine in the polymer-supported SLB was monitored by fluorescence recovery after photobleaching (FRAP) at different densities of PBP1B. The fluidity of the membrane decreased (black line) while the immobile fraction increased (orange line) with higher protein densities.
Figure 4—figure supplement 2
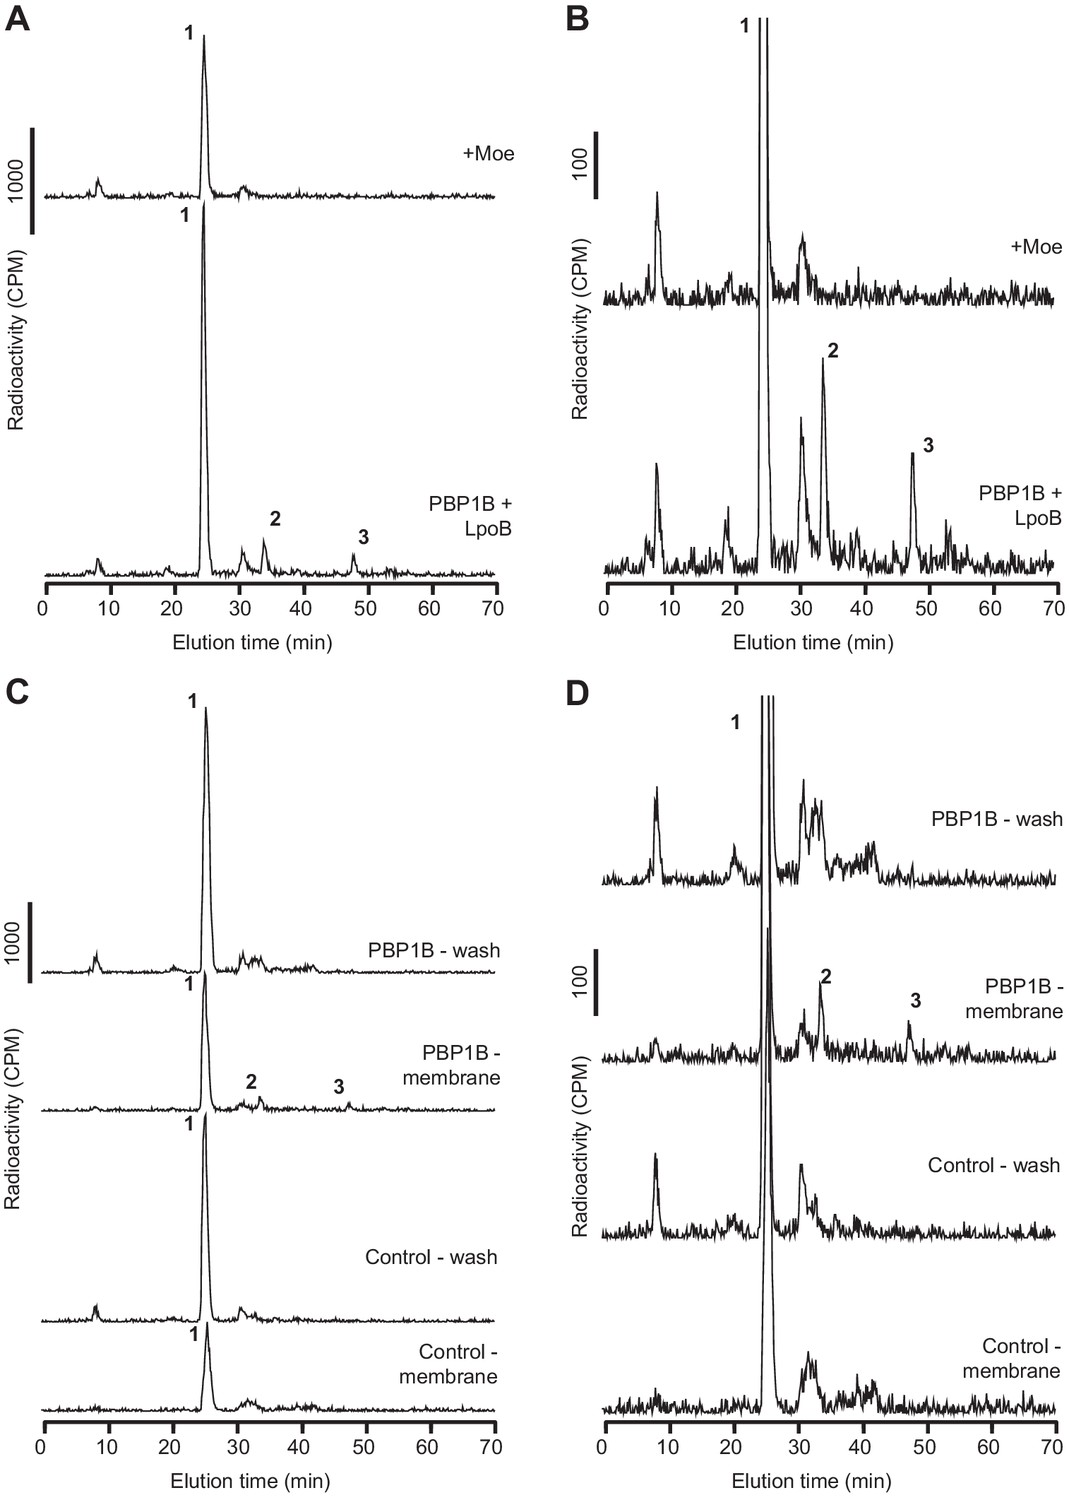
E. coli PBP1B is active after reconstitution in supported lipid bilayers (SLBs).
(A, B) PBP1BEc was reconstituted on supported lipid bilayers prepared with E. coli polar lipid extract in 1.1 cm2 chambers. The protein-to-lipid ratio was 1:105 (mol:mol). Reactions were started by adding 1 nmol of radiolabelled lipid II per chamber in the presence of LpoB(sol) (4 µM) moenomycin (100 µM). Three chambers were prepared for each condition, and samples were combined before the analysis. Chambers were incubated overnight at 37°C, and the reaction was stopped by adding moenomycin. Cellosyl and Triton X-100 were added to solubilize the membranes and digest the peptidoglycan (PG) product. The resulting muropeptide samples were concentrated, reduced with sodium borohydride, and analysed by HPLC. Full chromatograms are shown in A, while zoomed-in chromatograms are shown in B. (C, D) PG synthesis occurs only in the membrane fraction of SLBs. PBP1BEc was reconstituted on SLBs as in A and B. In addition, control chambers were prepared without PBP1B. Chambers were incubated overnight to allow for PG synthesis and then washed with fresh buffer. The washes and chambers (membranes) were treated and analysed as described for A and B. Five chambers were combined for reactions with PBP1BEc and four chambers for control reactions. Full chromatograms are shown in C, while zoomed-in chromatograms are shown in D. The labelled peaks in all chromatograms correspond to the muropeptides shown in Figure 1F.
Figure 5 with 1 supplement

Förster resonance energy transfer (FRET) assay on a planar lipid membrane.
(A) FRET acquisition by TIRF microscopy. PBP1BEc was reconstituted into a polymer-supported lipid membrane to preserve its lateral diffusion. A supported lipid membrane was formed from E. coli polar lipid extract supplemented with 0.5 mol% of labelled lipid II (Atto550 and Atto647n at 1:1 ratio). To initiate peptidoglycan (PG) polymerization, unlabelled lipid II (10 µM) and LpoB(sol) (4 µM) were added from the bulk solution. An increase in FRET efficiency was recorded by dual-colour TIRF microscopy: the acceptor (lipid II-Atto647n) was photobleached, and the concomitant increase in the donor intensity (lipid II-Atto550) was recorded within a delay of 1 s. (B) FRET kinetics of PG polymerization and crosslinking. Inhibition of PBP1BEc TPase activity with 1 mM ampicillin did not produce any changes in the donor intensity, confirming that FRET signal is specific to crosslinked PG. A sigmoid (straight lines) was fitted to the data to visualize the lag in the increase of FRET signal. (C) FRET efficiency was measured after a round of PG synthesis before and after digestion with the muramidase cellosyl. After cellosyl digestion, FRET efficiency decreased by 2.5-fold, resulting in a FRET signal comparable to the one of a control surface with a GTase-defective PBP1BEc(E233Q), performed in parallel. Each dot corresponds to a different surface area within the same sample. (D) Quantification of the diffusion coefficient of lipid II-Atto647n over the time course of PG polymerization (left) from the experiment presented in B, calculated from the dynamics of the recovery of lipid II-Atto647n signal within the photobleached region of interest (ROI). (E) Quantification of the fraction of immobile lipid II-Atto647n from several experiments as the one depicted in B; each dot represents the value from a different experiment. (F) Diffusion of lipid II-Atto647n or a phospholipid bound probe labelled with Alexa 488 (supported lipid bilayer) was recorded in a FRAP assay using a 1 s delay and dual-colour imaging, 30 min after initiation of PG synthesis by addition of lipid II and LpoB(sol). Only the diffusion of lipid II, but not of a fluorescently labelled, His6-tagged peptide attached to dioctadecylamine-tris-Ni2+-NTA, was affected by the presence of ampicillin during the PG synthesis reaction.
-
Figure 5—source data 1
Numerical data to support graphs in Figure 5.
- https://cdn.elifesciences.org/articles/61525/elife-61525-fig5-data1-v2.xlsx
Figure 5—figure supplement 1

Control of membrane fluidity and integrity during the Förster resonance energy transfer assay.
(A) Fluorescence intensity profiles 1 s after photobleaching taken from the images depicted in Figure 4B. (B) Montage comparing the recovery of fluorescence after photobleaching of a tracer (DODA-tris-Ni-NTA plus a His6-tagged peptide labelled with Alexa Fluor 488) with the one of lipid II-Atto647n on a supported lipid bilayer containing PBP1B at a 1:105 protein:lipid (mol:mol) ratio. The assay was performed after a peptidoglycan synthesis reaction was carried out for 1.5 hr. The fact that fluorescence is recovered for both indicates that the membrane remains fluid while lipid II stays diffusive after the synthesis reaction.
Figure 6
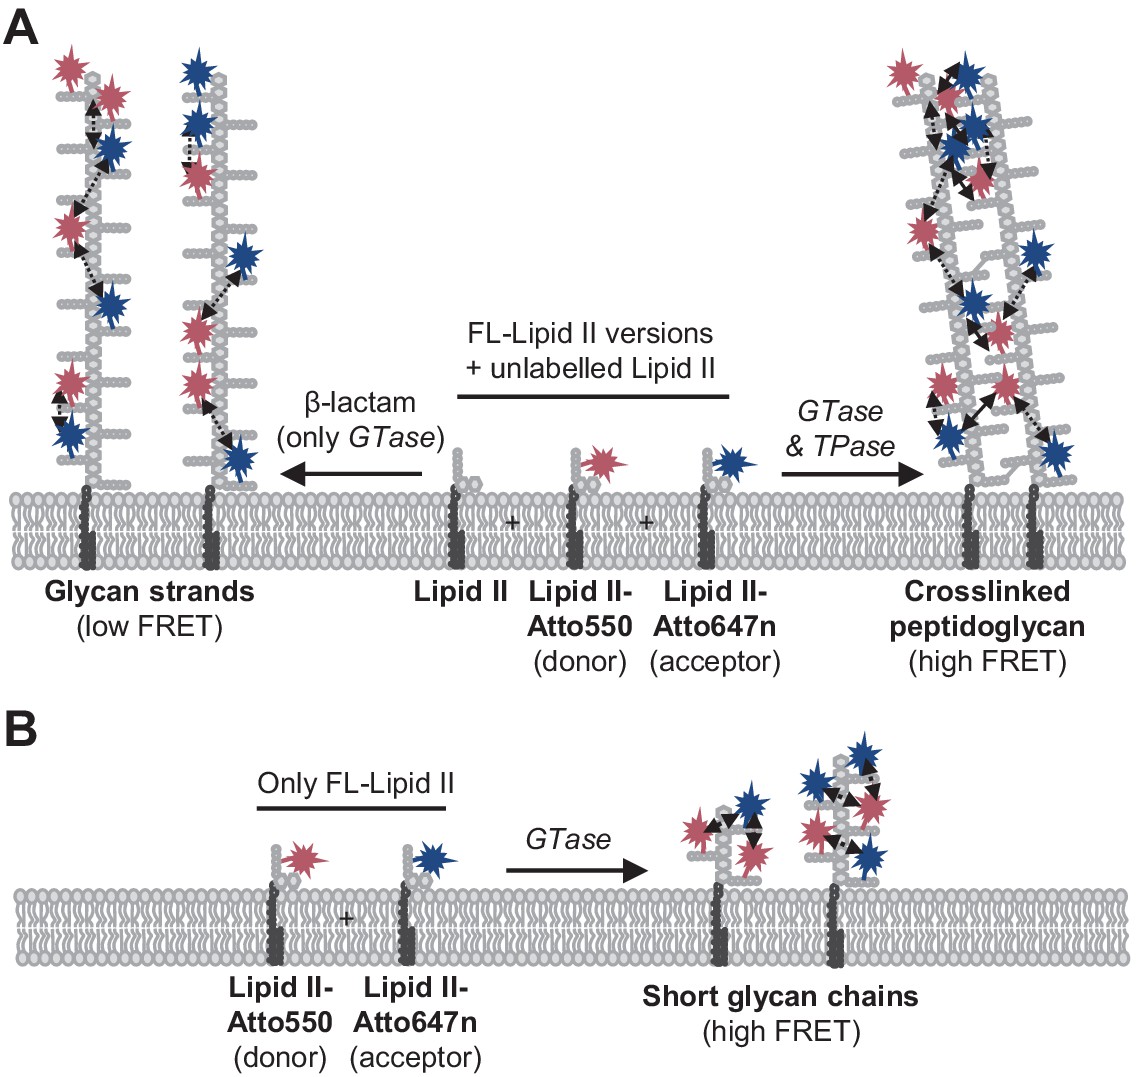
Peptidoglycan (PG) synthesis with labelled lipid II versions and detection of Förster resonance energy transfer (FRET).
(A) A mixture of Atto550-lipid II, Atto647n-lipid II, and unlabelled lipid II is utilized by a class A penicillin-binding protein (PBP) with or without inhibition of the TPase activity by a β-lactam. FRET can only occur between fluorophores within the same glycan strand in linear glycan chains produced in the presence of a β-lactam (left reaction, dashed arrows). When the TPase is active (right reaction), FRET can occur either between probes within the same strand (dashed arrows) or between probes on different strands of the crosslinked PG product (solid arrows). We hypothesize that at any time only one labelled lipid II molecule occupies the two binding sites in the GTase domain and that therefore two probes within the same strand are separated by at least one subunit. As a result, average distances between probes in different strands may be shorter than between probes within the same strand, and thus inter-chain FRET contributes stronger to the total FRET signal than intra-chain FRET. (B) Lipoprotein-stimulated PBPs produced short chains when labelled lipid II versions were incubated in the absence of unlabelled lipid II (e.g., Figure 1B, Figure 1—figure supplement 1C). In this situation, crosslinking does not occur due to the attachment of the probe to the mDAP residue in the pentapeptide. Within these short strands, intra-chain FRET is stronger than within the long glycan strands depicted in (A) due to a shorter average distance between the probes.
Author response image 1

Only Lipid II-Atto647N and Lipid-Atto550 were present in the membrane.
After photobleaching of the acceptor dye (Att647N), we did not observe an donor increase in intensity in the bleached area.
Videos
Video 1
Single-molecule imaging of PBP1B on supported lipid bilayers (SLBs).
PBP1BEc-Dy647 was reconstituted in E. coli polar lipids SLBs at a 1:106 (mol:mol) protein-to-lipid ratio and was tracked using single-molecule TIRF before or after the addition of 1.5 µM lipid II. Images were taken with a rate of 62 ms per frame.
Video 2
Förster resonance energy transfer (FRET) assay on supported lipid bilayers (SLBs).
PBP1BEc was reconstituted in E. coli polar lipids SLBs at a 1:105 (mol:mol) protein-to-lipid ratio along lipid II-Atto647 and lipid II-Atto550. Membranes were incubated with 5 µM lipid II in the presence or absence of 1 mM ampicillin. To detect FRET, the fluorescence of the acceptor Atto647n was bleached within a region. In the subsequent frame, the fluorescence of Atto550 increased, indicating the presence of FRET. In the presence of ampicillin, this increase did not happen.
Tables
Key resources table
| Reagent type (species) or resource | Designation | Source or reference | Identifiers | Additional information |
|---|---|---|---|---|
| Strain, strain background (Escherichia coli) | BL21(DE3) | New England Biolabs | C2527 | |
| Recombinant DNA reagent | pDML219 | Bertsche et al., 2006 | Expression of N-terminal His-tagged E. coli PBP1B | |
| Recombinant DNA reagent | pKPWV1B | This paper | Expression of N-terminal His-tagged Acinetobacter baumannii19606 (ATCC) PBP1B | |
| Recombinant DNA reagent | pAJFE52 | Caveney et al., 2020 | Expression of N-terminal His-tagged Pseudomonas aeruginosa PBP1B | |
| Recombinant DNA reagent | pMGCPBP1BCS1CS2 | This paper | Expression of E. coli PBP1B version with a single Cys residue in the N-terminus and C-terminal His-tag | |
| Recombinant DNA reagent | pET28His-LpoB(sol) | Egan et al., 2014 | Expression of soluble version of E. coli LpoB with an N-terminal His-tag | |
| Recombinant DNA reagent | pKPWVLpoP | This paper | Expression of N-terminal His-tagged A. baumannii 19606 (ATCC) LpoP | |
| Recombinant DNA reagent | pAJFE57 | Caveney et al., 2020 | Expression of soluble version of P. aeruginosa LpoP with an N-terminal His-tag | |
| Sequence-based reagent | PBP1B.Acineto-NdeI_f | This paper | PCR cloning primers | AGATATCATATGATGAAGTTTGAACGTGGTATC GGTTTCTTC |
| Sequence-based reagent | PBP1B.Acineto-BamHI_r | This paper | PCR cloning primers | GCGGGATCCTTAGTTGTTATAACTACCACTTGA AATG |
| Sequence-based reagent | Seq1_rev_PBP1B_Acineto | This paper | PCR cloning primers | AGGTTCTAAACGGGCAACTC |
| Sequence-based reagent | Seq2_fwd_PBP1B_Acineto | This paper | PCR cloning primers | TGGTTATGGATTGGCCTCTC |
| Sequence-based reagent | Seq3_fwd_PBP1B_Acineto | This paper | PCR cloning primers | CTGGGCAAGCCAGATTGAAG |
| Sequence-based reagent | Seq4_fwd_PBP1B_Acineto | This paper | PCR cloning primers | ACAATTACGCCAGACACCAG |
| Sequence-based reagent | PBP1B-MGC-F | This paper | PCR cloning primers | CATCATCCATGGGCTGTGGCTGGCTATGGCTACTGCTA |
| Sequence-based reagent | PBP1B-CtermH-R | This paper | PCR cloning primers | CATCATCTCGAGATTACTACCAAACATATCCTT |
| Sequence-based reagent | C777S-D | This paper | PCR mutagenesis primers | AACTTTGTTTCCAGCGGTGGC |
| Sequence-based reagent | C777S-C | This paper | PCR mutagenesis primers | GCCACCGCTGGAAACAAAGTT |
| Sequence-based reagent | C795S-D | This paper | PCR mutagenesis primers | CAATCGCTGTCCCAGCAGAGC |
| Sequence-based reagent | C795S-C | This paper | PCR mutagenesis primers | GCTCTGCTGGGACAGCGATTG |
| Chemical compound | [14C]GlcNAc-labelled lipid II (mDAP) | Breukink et al., 2003 Bertsche et al., 2005 | ||
| Chemical compound | Lipid II (mDAP) | Egan et al., 2015 | ||
| Chemical compound | Lipid II (Lys) | Egan et al., 2015 | ||
| Chemical compound | Lipid II-dansyl | Egan et al., 2015 | ||
| Chemical compound | Lipid II-Atto550 | Mohammadi et al., 2014 Van't Veer, 2016 | ||
| Chemical compound | Lipid II-Atto647n | Mohammadi et al., 2014 Van't Veer, 2016 | ||
| Chemical compound | Polar lipid extract from E. coli (EcPL) | Avanti Polar Lipids | 100600P | |
| Chemical compound | 1,2-Dioleoyl-sn-glycero-3-phosphocholine (DOPC) | Avanti Polar Lipids | 850375P | |
| Chemical compound | 1-Palmitoyl-2-oleoyl-sn-glycero-3-phospho-(1'-rac-glycerol) (POPG) | Avanti Polar Lipids | 840457P | |
| Chemical compound | Tetraoleoyl cardiolipin | Avanti Polar Lipids | 710335P | |
| Chemical compound | Dy647P1-maleimide probe | Dyomics | 647P1-03 | |
| Chemical compound | Alexa Fluor 488 C5 Maleimide | ThermoFisher Scientific | A10254 | |
| Chemical compound | Alexa Fluor 555 C2 maleimide | ThermoFisher Scientific | A20346 | |
| Chemical compound | Triton X-100 | Roche | 10789704001 | |
| Chemical compound | Moenomycin | Sigma | 32404 | |
| Chemical compound | Ampicillin | Sigma | A9518 | |
| Chemical compound | Methyl-β-cyclodextrin | Sigma-Aldrich | 332615 | |
| Chemical compound | Poly(ethylene glycol) Mn8000 | Sigma-Aldrich | 1546605 | |
| Chemical compound | 1,2-dioleoyl-sn-glycero-3-phosphoethanolamine-N-(lissamine rhodamine B sulfonyl) (DOPE-Rhodamine) | Avanti Polar Lipids | 810150C | |
| Chemical compound | Dioctadecylamine (DODA)-tris-Ni-NTA | Beutel et al., 2014 | ||
| Chemical compound | cOmplete, EDTA-freeProtease Inhibitor Cocktail | Roche Molecular Biochemicals | 5056489001 | |
| Chemical compound | Phenylmethylsulfonylfluoride (PMSF) | Sigma-Aldrich | P7626 | |
| Chemical compound | Ni-NTA superflow resin | Qiagen | 1018142 | |
| Chemical compound | Bio-Beads SM-2 resin | Bio-Rad | 1523920 | |
| Commercial assay, kit | Pierce BCA Protein Assay Kit | ThermoFisher Scientific | 23227 | |
| Commercial assay, kit | HiTrap SP HP column, 1 mL | GE biosciences | 17115101 | |
| Commercial assay, kit | HiTrap Desalting column, 5 mL | GE biosciences | 17140801 | |
| Commercial assay, kit | Prontosil 120–3 C18 AQ reversed-phase column | BISCHOFF Chromatography | 1204F184P3 | |
| Peptide, recombinant protein | DNase | ThermoFisher Scientific | 90083 | |
| Peptide, recombinant protein | Cellosyl | Hoechst (Germany) | Mutanolysin from Sigma (M9901) can also be used | |
| Peptide, recombinant protein | MepM | Federico Corona, following protocol in Singh et al., 2012 | ||
| Chemical compound | His6-tagged (on the C-terminus) neutral peptide | BioMatik | CMSQAALNTRNSEEEVSSRRNNGTRHHHHHH | |
| Software, algorithm | Fiji | https://fiji.sc | ||
| Software, algorithm | Matlab | MathWorks | https://www.mathworks.com | |
| Software, algorithm | frap_analysis | Jönsson, 2020 |
Additional files
-
Supplementary file 1
Table of oligonucleotides used in this study.
- https://cdn.elifesciences.org/articles/61525/elife-61525-supp1-v2.docx
-
Transparent reporting form
- https://cdn.elifesciences.org/articles/61525/elife-61525-transrepform-v2.docx
Download links
A two-part list of links to download the article, or parts of the article, in various formats.
Downloads (link to download the article as PDF)
Open citations (links to open the citations from this article in various online reference manager services)
Cite this article (links to download the citations from this article in formats compatible with various reference manager tools)
Real-time monitoring of peptidoglycan synthesis by membrane-reconstituted penicillin-binding proteins
eLife 10:e61525.
https://doi.org/10.7554/eLife.61525


