Songbirds can learn flexible contextual control over syllable sequencing
- Center for Integrative Neuroscience and Howard Hughes Medical Institute, University of California, San Francisco, United States
Figures
Figure 1
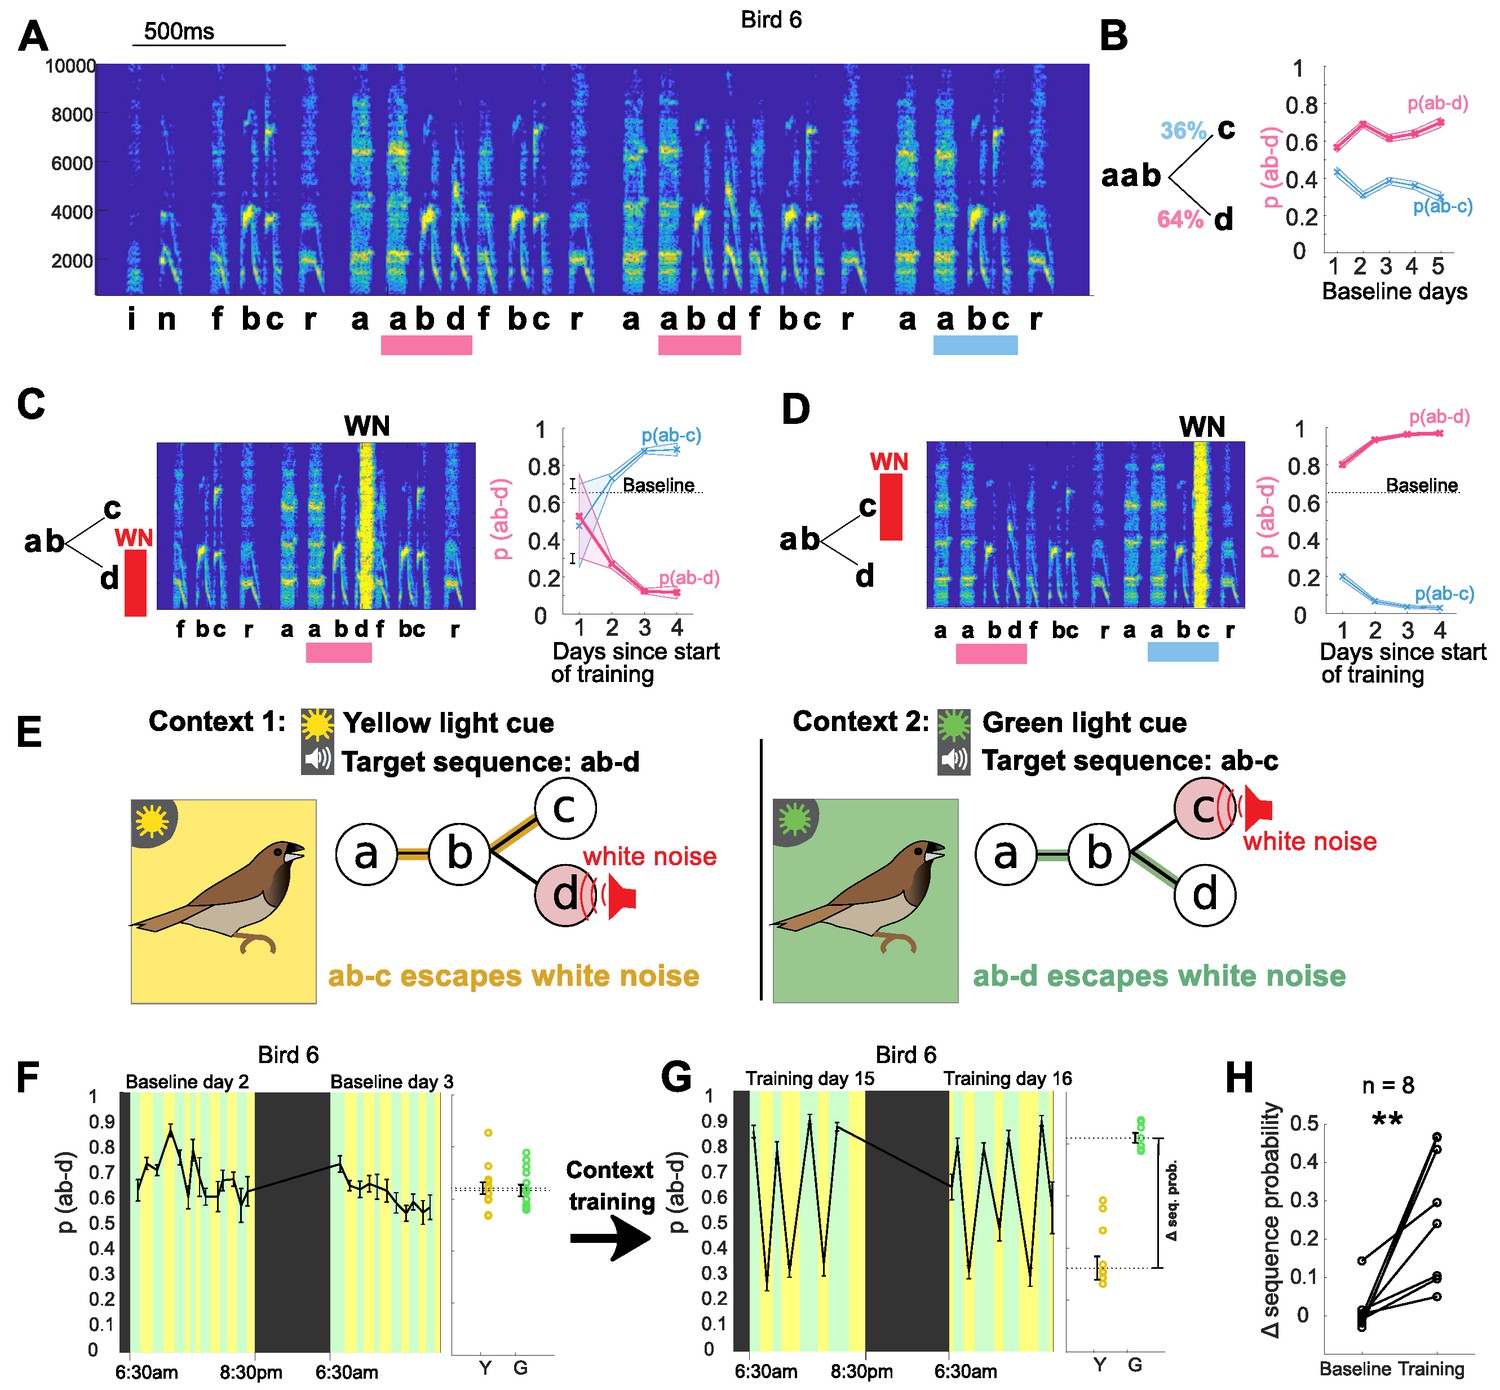
Bengalese finches can learn context-dependent sequencing.
(A) Example spectrogram highlighting points in song with variable sequencing. Syllables are labeled based on their spectral structure, target sequences for the different experiments (ab-c and ab-d) are marked with colored bars. Y-axis shows frequency in Hz. (B) Transition diagram with probabilities for sequences ab-c and ab-d. The sequence probability of ab-d (and complementary probability ab-c) stayed relatively constant over five days. Shaded area shows 95% confidence interval for sequence probability. Source data in Figure 1—source data 3. (C) Aversive reinforcement training. Schematic showing aversive WN after target sequence ab-d; spectrogram shows WN stimulus, covering part of syllable d. WN targeted to sequence ab-d led to a gradual decrease in the probability of that sequence over several days, and a complementary increase in the probability of ab-c. (D) WN targeted to ab-c led to a gradual increase in the sequence probability of ab-d. Source data in Figure 1—source data 2. (E) Schematic of the contextual learning protocol, with target for WN signaled by colored lights. (F) Left: Two example days of baseline without WN but with alternating blocks of green and yellow context. Colors indicate light context (black indicates periods of lights off during the night), error bars indicate SEM across song bouts in each block. Right: Average sequence probability in yellow and green blocks during baseline. Open circles show individual blocks, error bars show SEM across blocks. (G) Left: Two example days after training (WN on). Right: Average sequence probability in yellow and green blocks after training. (H) Contextual difference in sequence probability for eight trained birds before and after training (**p<0.01 signed rank test). Source data in Figure 1—source data 1.
-
Figure 1—source data 1
Switch magnitude during baseline and after training for all birds, to generate Figure 1H, and plots like Figure 1F,G for all birds.
- https://cdn.elifesciences.org/articles/61610/elife-61610-fig1-data1-v1.mat
-
Figure 1—source data 2
Sequence data for the example bird during single-context training, to generate Figure 1C,D.
- https://cdn.elifesciences.org/articles/61610/elife-61610-fig1-data2-v1.mat
-
Figure 1—source data 3
Sequence data for the example bird during baseline, to generate Figure 1B.
- https://cdn.elifesciences.org/articles/61610/elife-61610-fig1-data3-v1.mat
Figure 2

Sequence probabilities shift immediately following a switch in context.
(A, B) Average sequence probability per song for example Bird 1 aligned to switches from green to yellow context (A) and from yellow to green context (B). Error bars indicate SEM across song bouts (n = 35 switches (A), n = 33 switches (B)). (C) Changes in sequence probability from the last song in green context to the first song in yellow context for all eight birds. Example bird in (A, B) highlighted in bold. **p<0.01 signed rank test. (D) Changes in sequence probability from the last song in yellow context to the first song in green context. *p<0.05 signed rank test. (E) Shift magnitudes for all birds, defined as the changes in sequence probability from the last five songs in the green context to the first five songs in the yellow context. Open circles show individual birds, error bars indicate SEM across birds. (F) Same as (E) for switches from yellow to green. Source data in Figure 2—source data 1. (G) Shift magnitudes over training time for the example bird (11 days and 49 context switches; seven of the original 56 context switches are excluded from calculations of shift magnitudes because at least one of the involved blocks contained only one or two song bouts.). (H) Trajectory of switch-aligned sequence probabilities for the example bird early in training (red) and late in training (blue). Probabilities are normalized by the sequence probability in preceding block, and plotted so that the adaptive direction is positive for both switch directions (i.e. inverting the probabilities for switches to yellow.) (I) Slopes of fits to the sequence probability trajectories over song bouts within block. Units in change of relative sequence probability per song bout. (K) Intercepts of fits to sequence probability trajectories over song bouts within block. Units in relative sequence probability. (L) Changes in slopes and changes in intercepts for five birds over the training process, determined as the slopes of linear fits to curves as in (I and K) for each bird. Source data in Figure 2—source data 2.
-
Figure 2—source data 1
Switch magnitude between all contexts after training, to generate Figures 2C–F and 3E–H.
- https://cdn.elifesciences.org/articles/61610/elife-61610-fig2-data1-v1.mat
-
Figure 2—source data 2
Summary of training data, to generate Figure 2L.
- https://cdn.elifesciences.org/articles/61610/elife-61610-fig2-data2-v1.mat
Figure 3 with 1 supplement
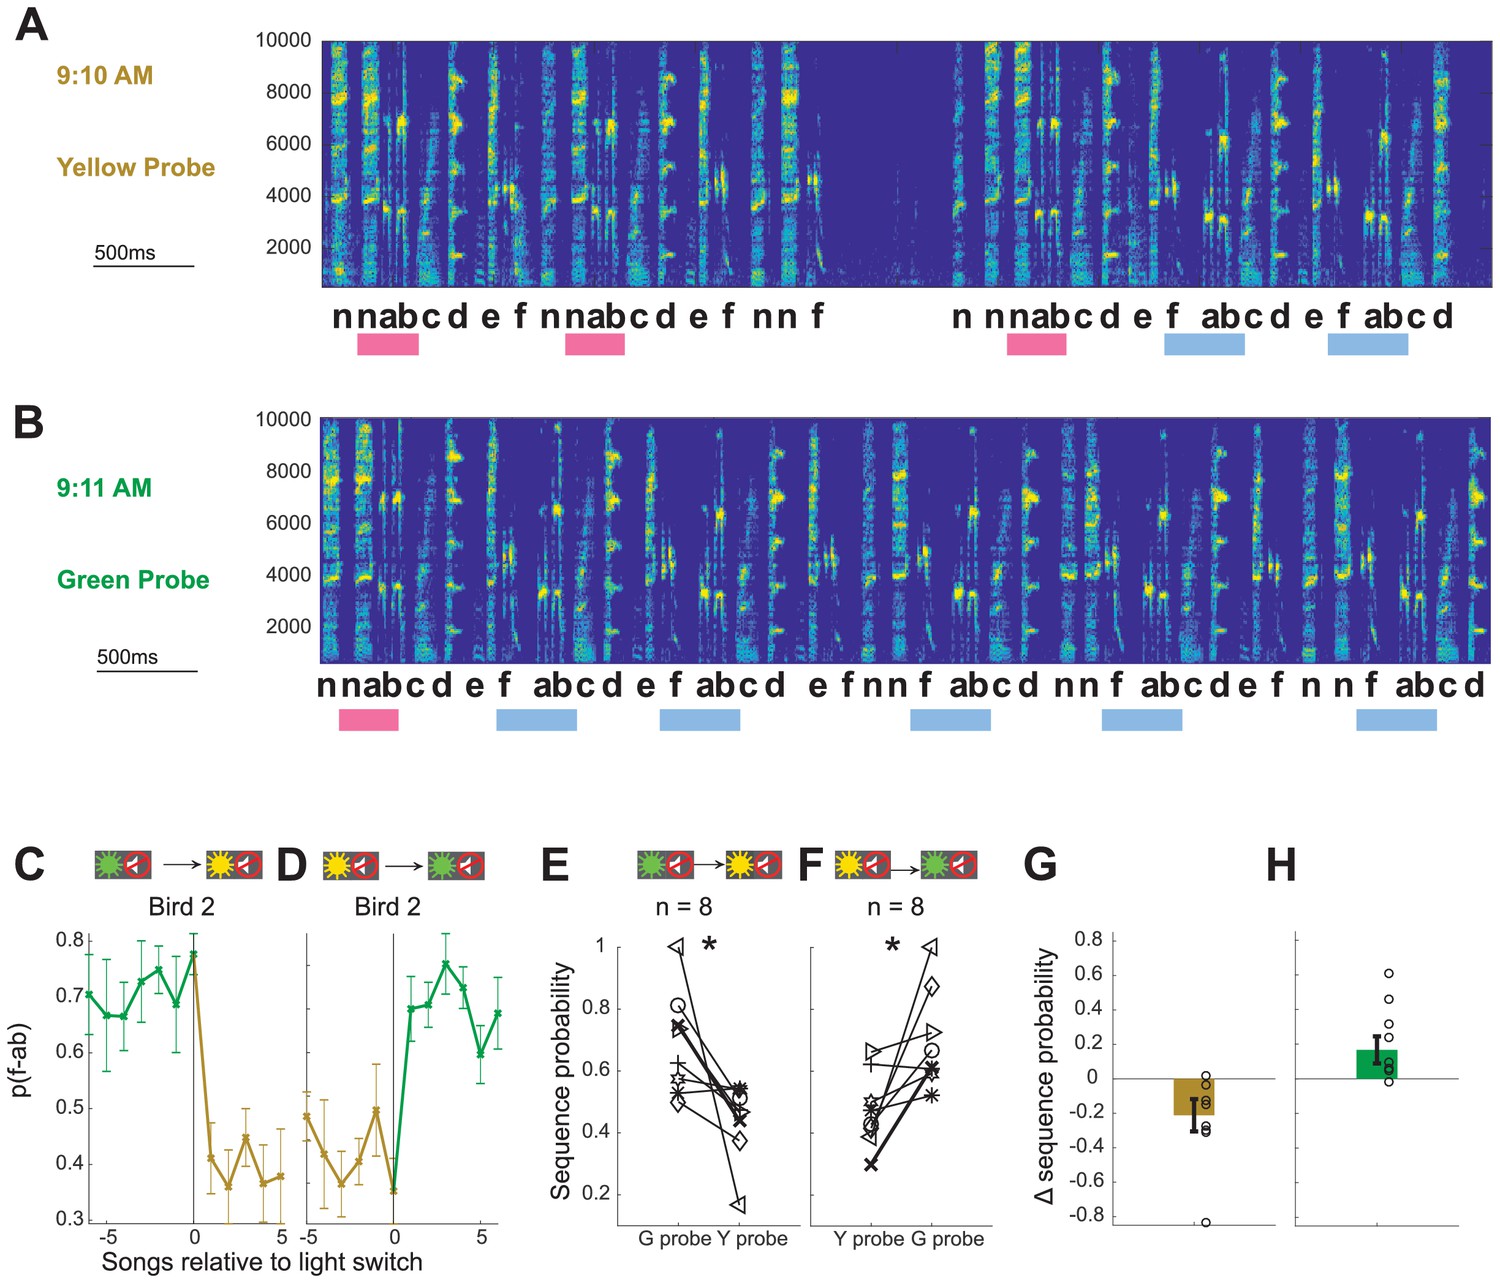
Contextual cues alone are sufficient to enable immediate shifts in syllable sequencing.
(A,B) Examples of songs sung by Bird 2 immediately before (A) and after (B) a switch from a yellow probe block to a green probe block (full song bouts in Figure 3—figure supplement 1). Scale for x-axis is 500 ms; y-axis shows frequency in Hz. (C, D) Average sequence probability per song for Bird 2 aligned to switches from green probe to yellow probe blocks (C) and from yellow probe to green probe blocks (D). Error bars indicate SEM across song bouts (n = 14 switches (C), 11 switches (D)). (E, F) Average sequence probabilities for all eight birds at the switch from the last song in green probe context and the first song in yellow probe context, and vice versa. Example Bird 2 is shown in bold. *p<0.05 signed rank test. (G, H) Shift magnitudes for probe–probe switches for all birds. Open circles show individual birds; error bars indicate SEM across birds. Source data in Figure 2—source data 1.
Figure 3—figure supplement 1
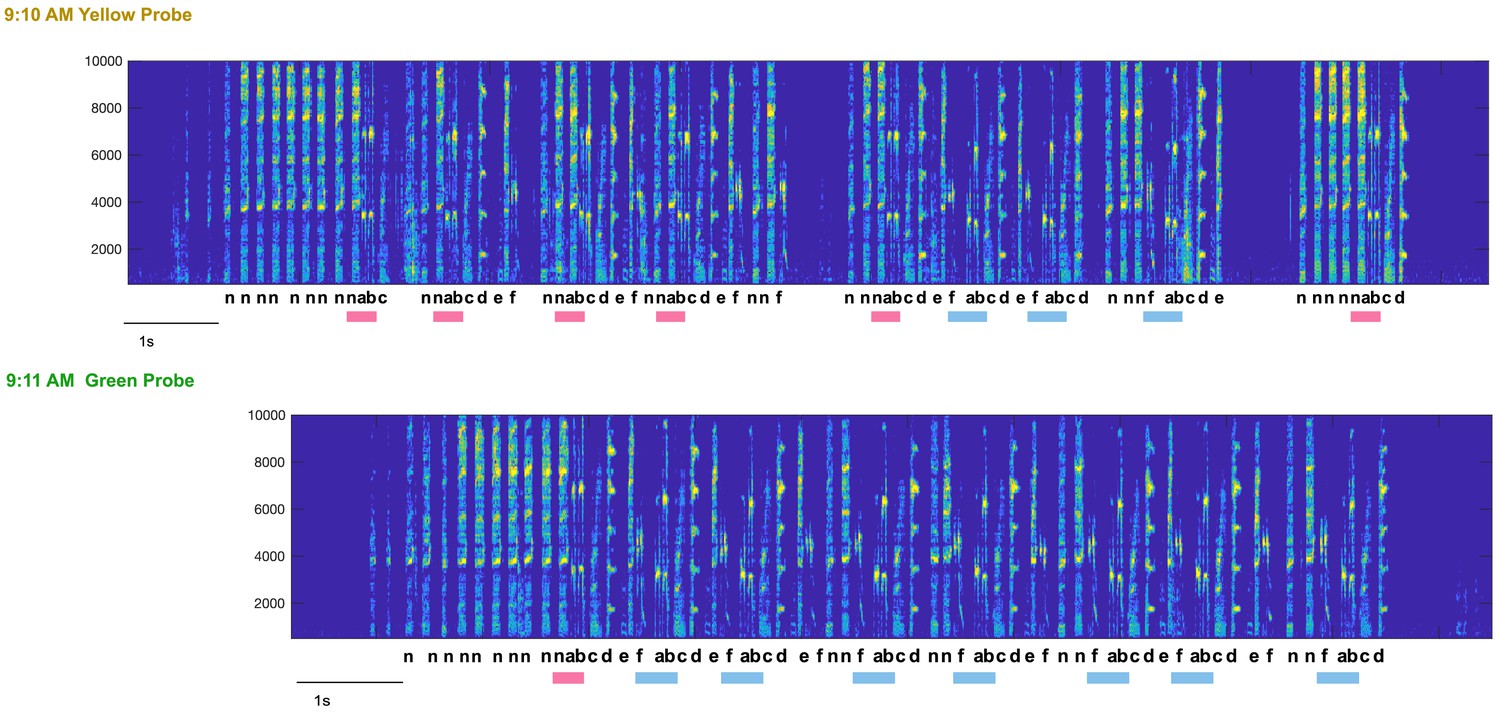
Example song bouts surrounding a probe–probe context switch.
Full song bouts (same as in Figure 3A,B) sung by Bird 2 immediately before and after a switch from a yellow probe block to a green probe block. Scale for x-axis is 1 s; y-axis shows frequency in Hz. The recording program was set to never switch lights during an ongoing song recording, so the time of light switch in between these two recordings cannot be shown.
Figure 4 with 1 supplement
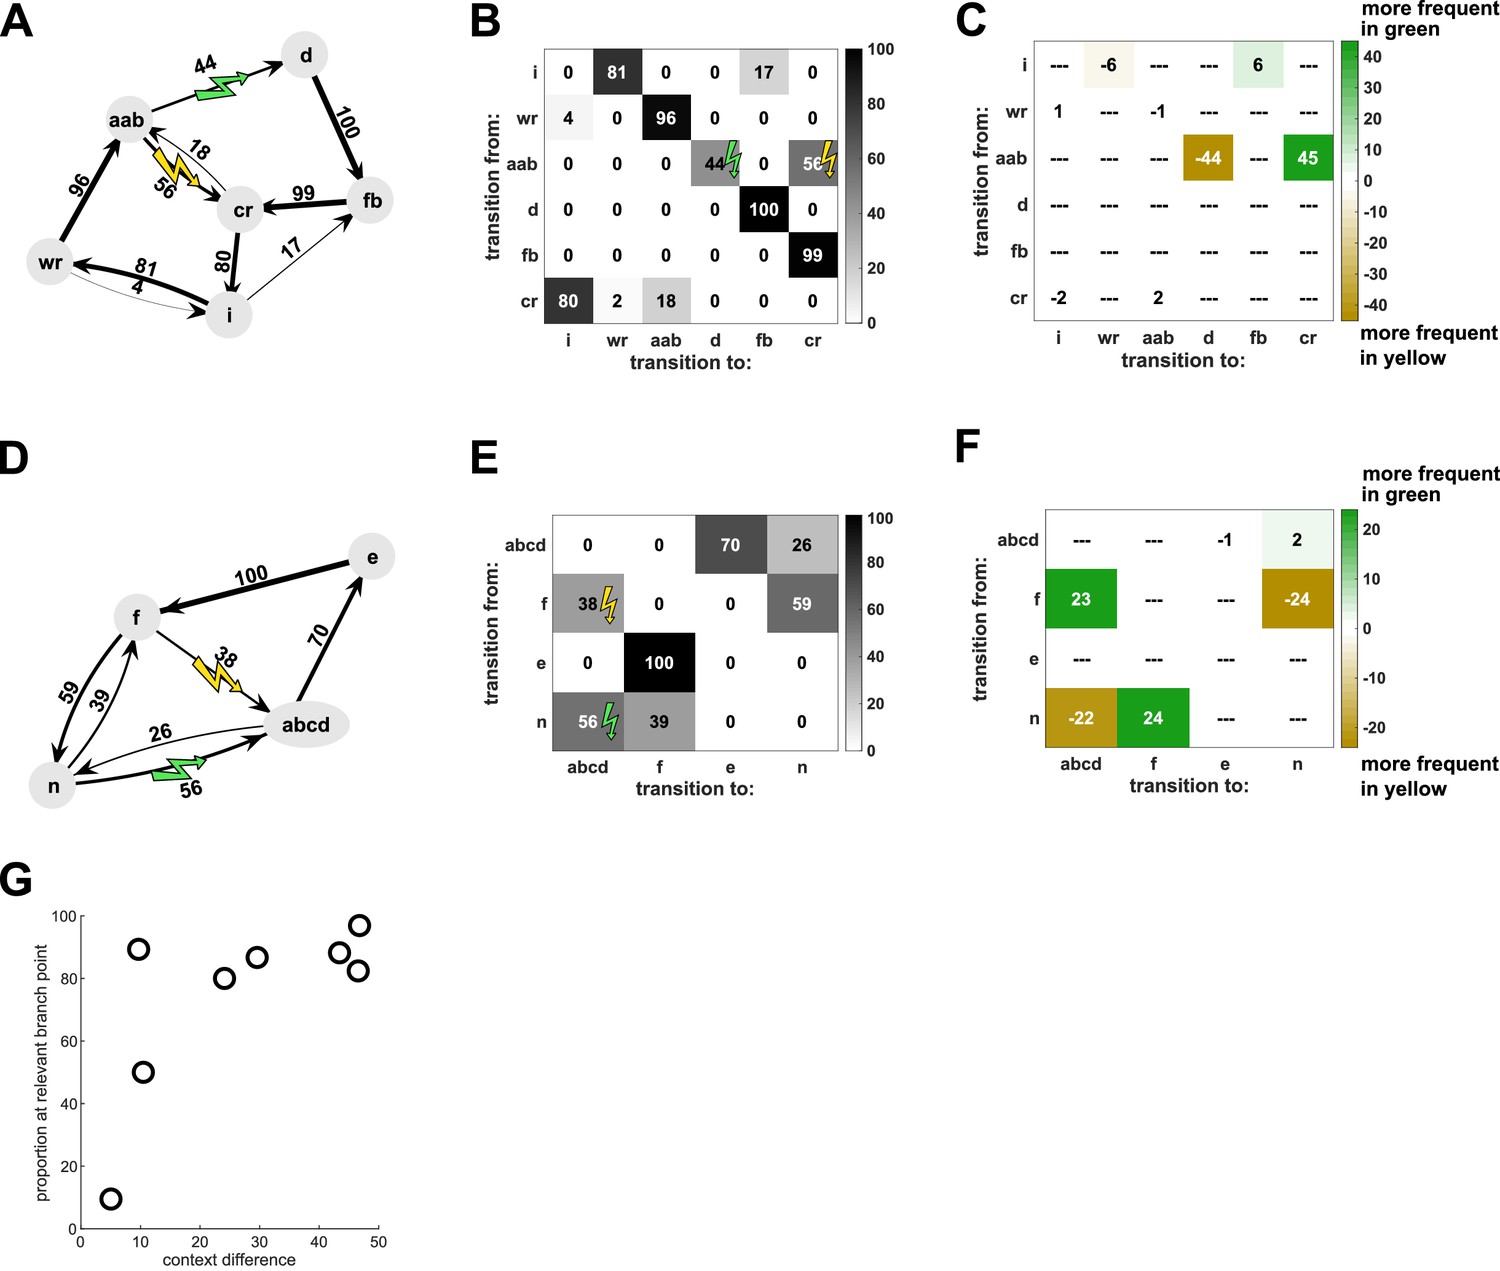
Contextual changes are local to the target sequences.
(A) Transition diagram for the song of Bird 6 (spectrogram in Figure 1) in yellow probe context. Sequences of syllables with fixed transition patterns (e.g. ‘aab’) as well as repeat phrases and introductory notes have been summarized as single states to simplify the diagram. (B) Transition matrix for the same bird, showing same data as in (A). (C) Differences between the two contexts are illustrated by subtracting the transition matrix in the yellow context from the one in the green context, so that sequence transitions which are more frequent in green context are positive (colored green) and sequence transitions which are more frequent in yellow are negative (colored yellow). For this bird, the majority of contextual differences occurred at the branch point (‘aab’) which most closely preceded the target sequences (‘ab-c’ and ‘ab-d’), while very little contextual difference occurred at the other three branch points (‘i’, ‘wr’, ‘cr’). (D–F) Same for Bird 2 for which two different branch points (‘f’ and ‘n’) preceded the target sequences (‘f-abcd’ and ‘n-abcd’) (spectrogram in Figure 3). (G) Proportion of changes at the branch point(s) most closely preceding the target sequences, relative to the total magnitude of context differences for each bird (see Materials and methods). Most birds exhibited high specificity of contextual changes to the relevant branch points. Source data in Figure 4—source data 1.
-
Figure 4—source data 1
Overview of different experimental parameters and song features for each bird, to generate (Figure 4G, Figure 4—figure supplement 1).
- https://cdn.elifesciences.org/articles/61610/elife-61610-fig4-data1-v1.mat
Figure 4—figure supplement 1
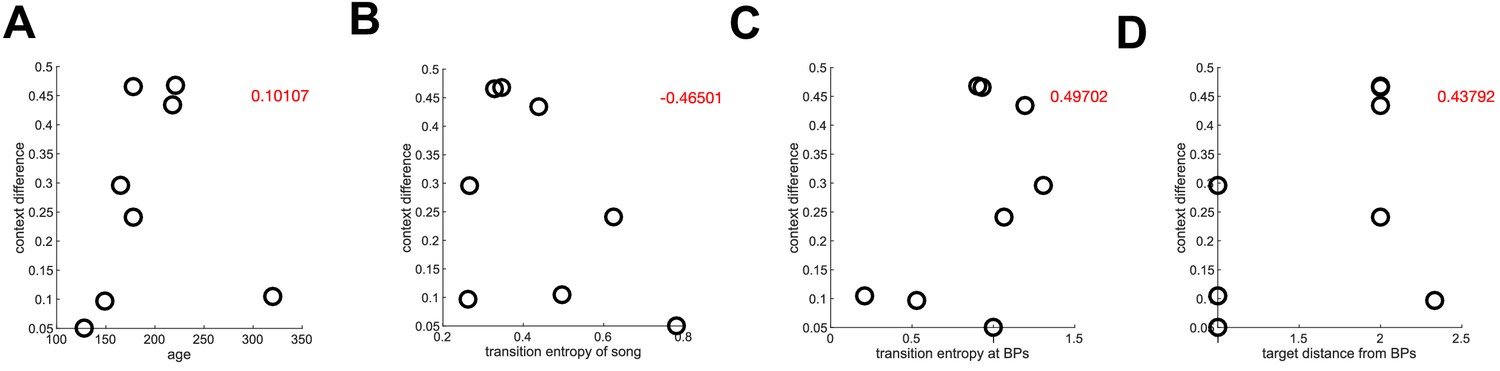
Possible explanations for differences in contextual learning.
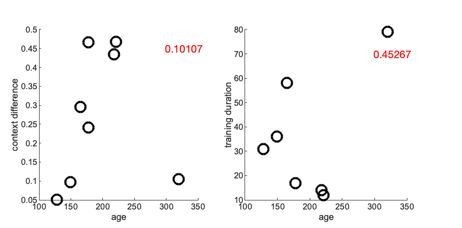
Correlations of the magnitude of contextual differences with the birds’ age (A), transition entropy of the entire song (B), transition entropy at the branch points preceding the target sequences (C), and distance of the target sequence from the immediately preceding branch points (D). None of these variables were significantly correlated with the degree of contextual learning that birds expressed, p=0.81 (A), p=0.24 (B), p=0.21 (C), p=0.28 (D). Red numbers indicate correlation coefficients. Source data in Figure 4—source data 1.
Figure 5
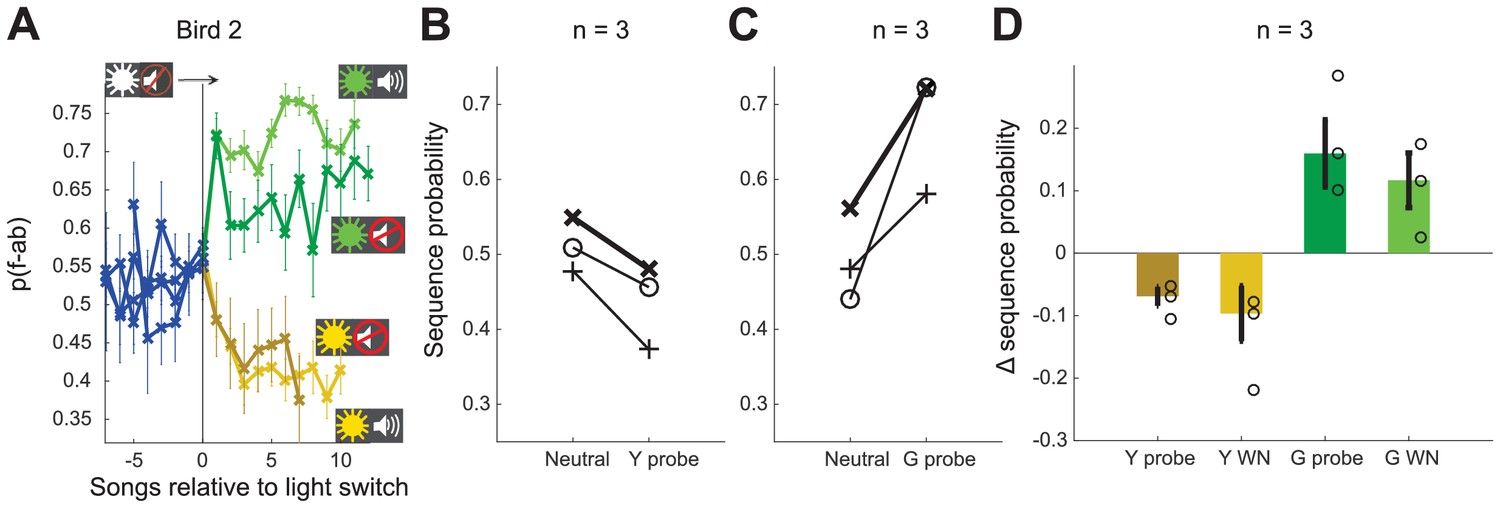
Contextual cues allow shifts in both directions.
(A) Sequence probability for Bird 2 at the switch from neutral context to yellow and green WN contexts, as well as yellow and green probe contexts (no WN). Error bars indicate SEM across song bouts (n = 68 switches [green WN], 78 switches [yellow WN], 27 switches [green probe], 24 switches [yellow probe]). (B, C) Sequence probabilities for three birds for the last song in neutral context and the first song in the following probe context. Example bird in (A) highlighted in bold. (D) Shift magnitude for three birds at the switch from neutral context to all other contexts. Open circles show individual birds; error bars indicate SEM across birds. Source data in Figure 5—source data 1.
-
Figure 5—source data 1
Switch magnitude during third context experiment, to generate Figure 5B–D.
- https://cdn.elifesciences.org/articles/61610/elife-61610-fig5-data1-v1.mat
Author response image 1
Author response image 2
Additional files
-
Source code 1
Matlab code to generate Figure 1.
- https://cdn.elifesciences.org/articles/61610/elife-61610-code1-v1.m.zip
-
Source code 2
Matlab code to generate Figures 2C–F and 3E–H.
- https://cdn.elifesciences.org/articles/61610/elife-61610-code2-v1.m.zip
-
Source code 3
Matlab code to generate Figure 2L.
- https://cdn.elifesciences.org/articles/61610/elife-61610-code3-v1.m.zip
-
Source code 4
Matlab code to generate Figure 4G, Figure 4—figure supplement 1.
- https://cdn.elifesciences.org/articles/61610/elife-61610-code4-v1.m.zip
-
Source code 5
Matlab code to generate Figure 5B–D.
- https://cdn.elifesciences.org/articles/61610/elife-61610-code5-v1.m.zip
-
Transparent reporting form
- https://cdn.elifesciences.org/articles/61610/elife-61610-transrepform-v1.docx
Download links
A two-part list of links to download the article, or parts of the article, in various formats.
Downloads (link to download the article as PDF)
Open citations (links to open the citations from this article in various online reference manager services)
Cite this article (links to download the citations from this article in formats compatible with various reference manager tools)
Songbirds can learn flexible contextual control over syllable sequencing
eLife 10:e61610.
https://doi.org/10.7554/eLife.61610


