DRAXIN regulates interhemispheric fissure remodelling to influence the extent of corpus callosum formation
- The University of Queensland, Queensland Brain Institute, Australia
- Faculty of Medicine, Australia
- Departments of Neurology and Pediatrics, Institute of Human Genetics and Weill Institute of Neurosciences, University of California, San Francisco, United States
- Department of Radiology, University of Melbourne, Royal Children’s Hospital, Australia
- School of Biomedical Sciences, Australia
Figures
Figure 1
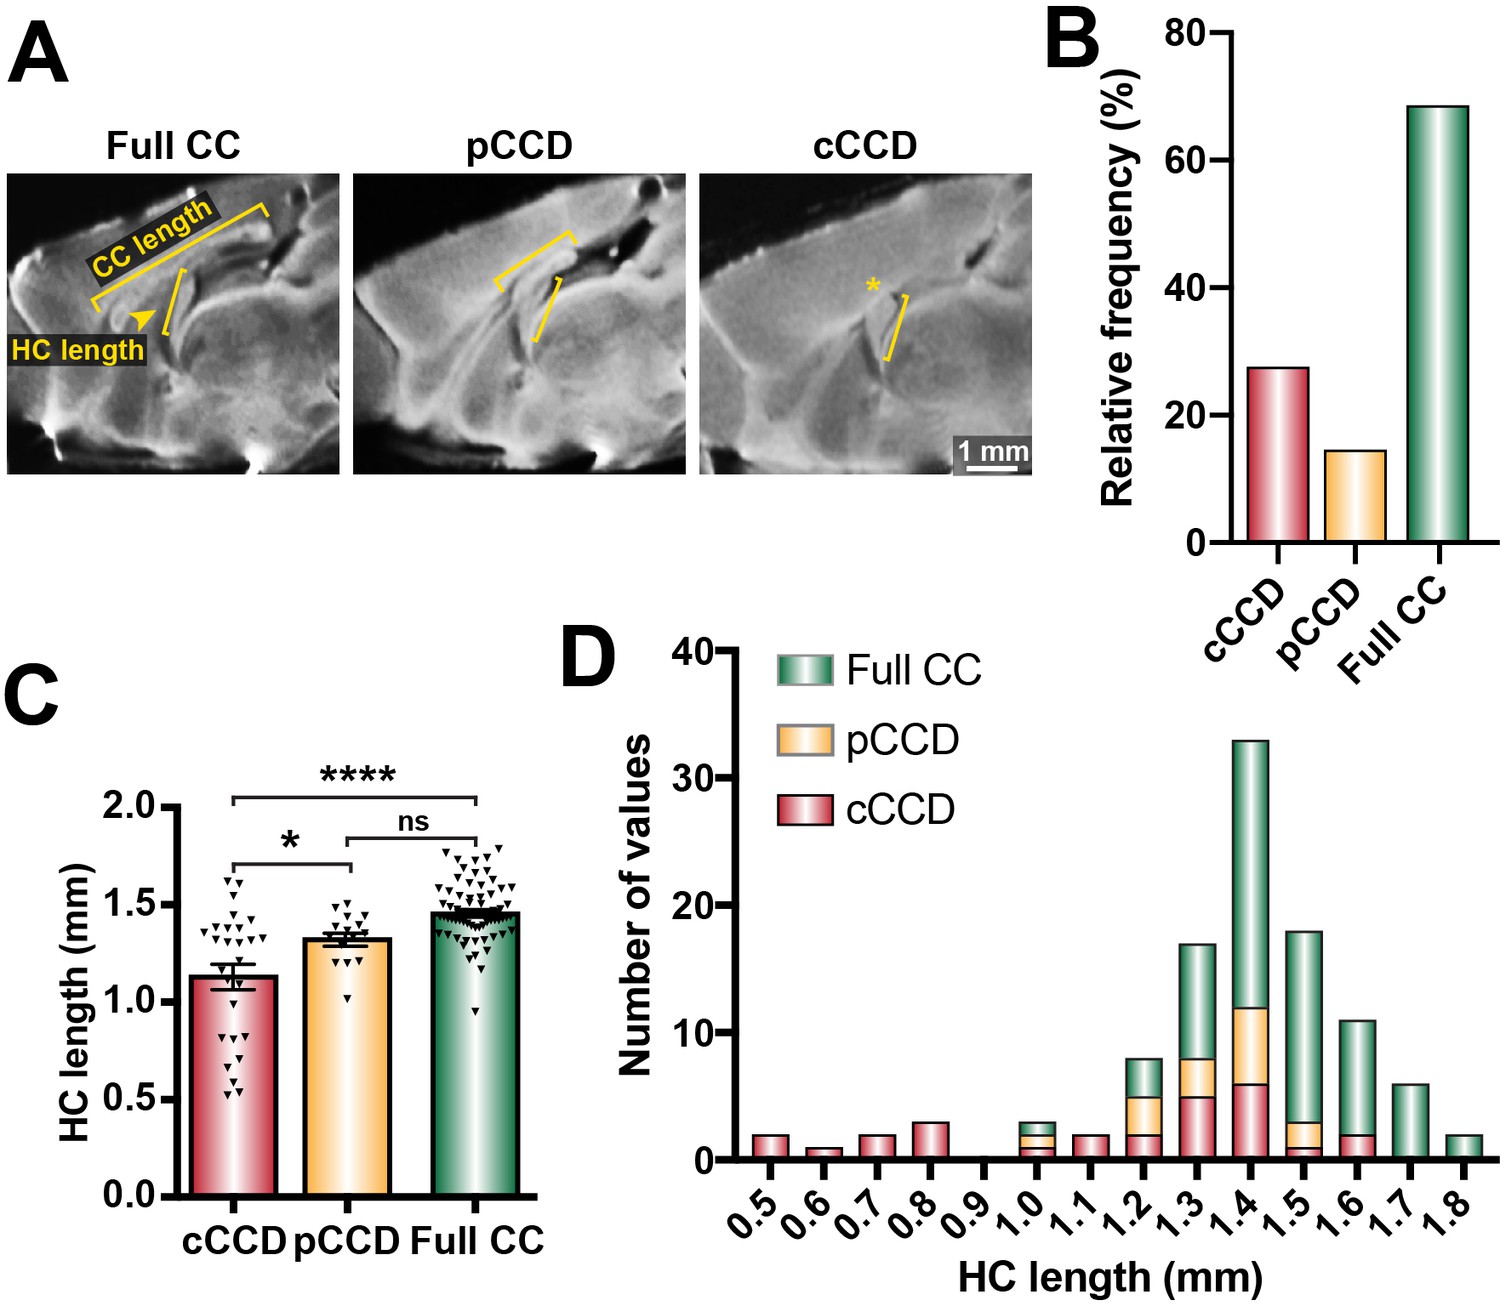
Distribution of commissural size in BTBR × C57 N2 mice.
(A) Corpus callosum (CC) length and hippocampal commissure (HC) length were measured on single-diffusion direction MRI scans for n = 112 adult BTBR × C57 N2 mice. (B) The relative frequency of three distinct subsets of CC phenotypes based on CC length: complete corpus callosum dysgenesis (cCCD; red), partial CCD (pCCD; yellow), and normal CC length (Full CC; green). (C) Group-wise comparison between callosal phenotypes for HC length. (D) Stacked histogram of HC length for each callosal phenotype. Data represented as mean ± SEM. *p<0.05; ****p<0.0001, ns = not significant, as determined by one-way ANOVA with post Tukey’s multiple comparisons test.
-
Figure 1—source data 1
Distribution of commissural size in BTBR × C57 N2 mice.
- https://cdn.elifesciences.org/articles/61618/elife-61618-fig1-data1-v2.xlsx
Figure 2

Axial structural MRI slices and insets (white rectangles) of telencephalic midline anatomy in adult wildtype.
C57 (A) and acallosal BTBR parental mice (B), as well as adult BTBR × C57 N2 mice with distinct commissural phenotypes (C–E). The interhemispheric fissure (IHF) is indicated with yellow brackets, the corpus callosum (CC) and hippocampal commissure are indicated with white brackets, and the septum is indicated with red arrowheads. n = 3 for C57 and BTBR parental strains, n = 10 for each callosal condition for the BTBR × C57 N2 cross. cCCD: complete corpus callosum dysgenesis; pCCD: partial corpus callosum dysgenesis.
Figure 3 with 1 supplement
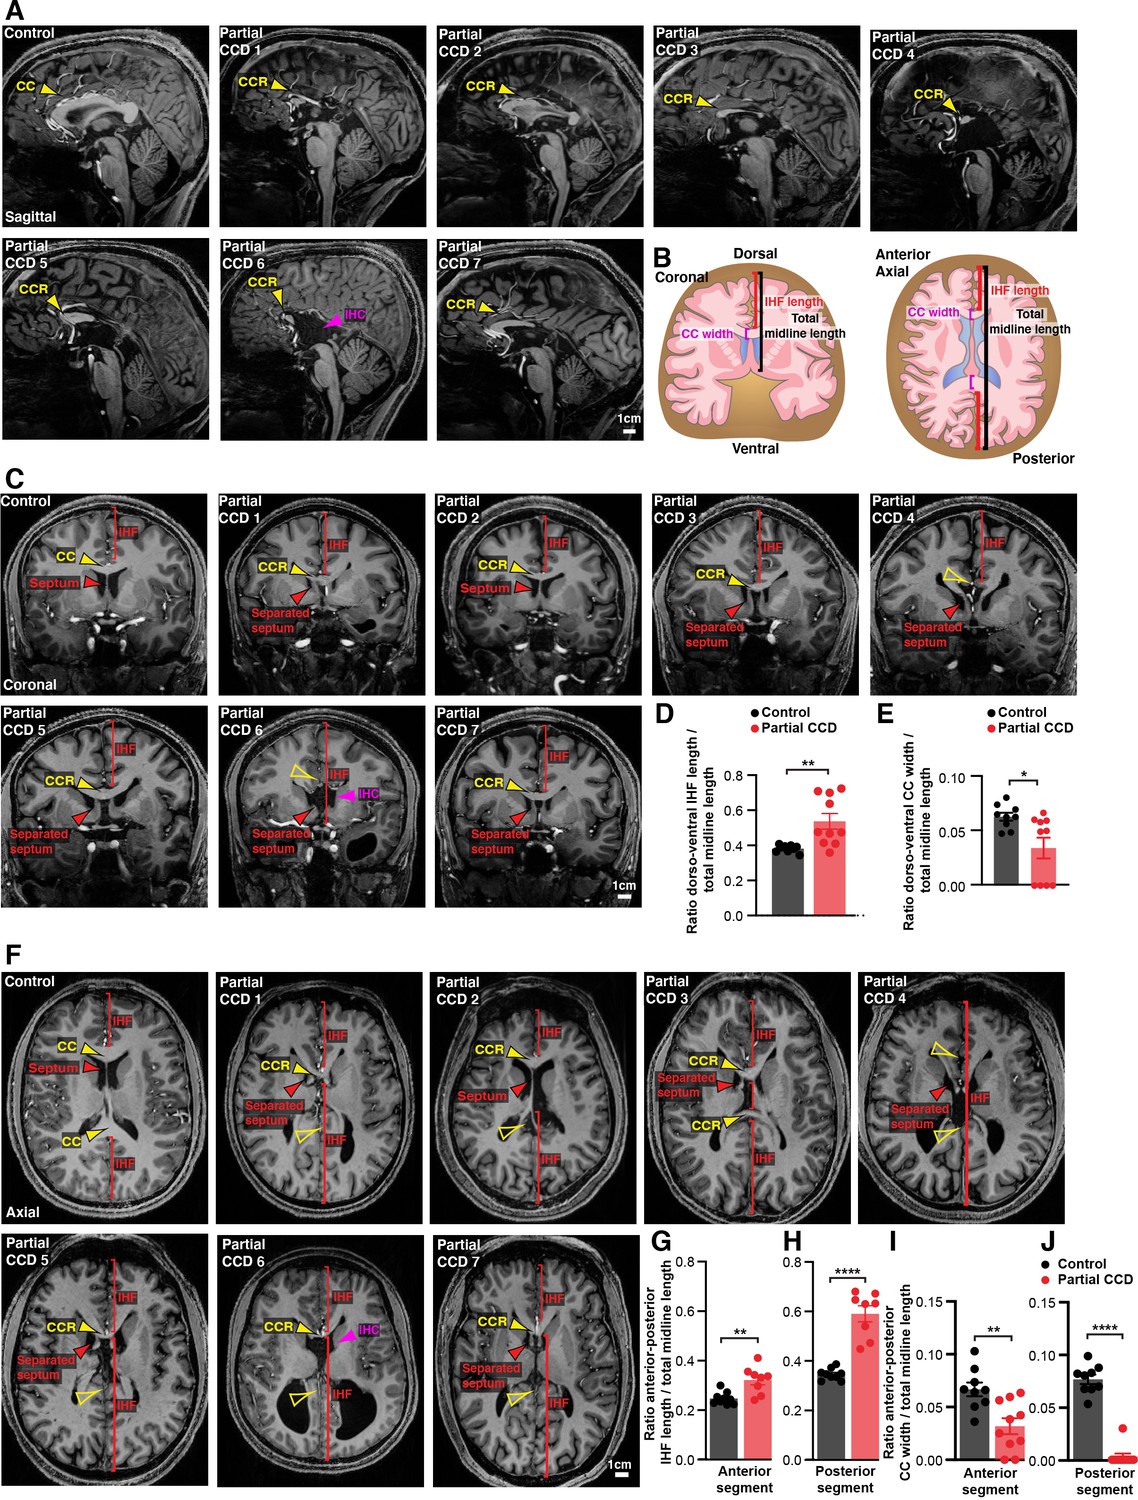
Structural MRI study of interhemispheric fissure (IHF) and septal defects associated with partial corpus callosum dysgenesis (CCD) in humans.
Representative sagittal (A), coronal (C), and axial (F) slices from T1-weighted structural scans on 9 neurotypical (control) individuals and 10 individuals with partial CCD. The CC or the CC remnant (CCR) is indicated with yellow arrowheads, interhemispheric cysts (IHC) are indicated with magenta arrowheads, the IHF extent is indicated with red brackets, and the septum is indicated with red arrowheads. The IHF length and CC width were measured from coronal and axial images and normalised to the length of the midline, as quantified in (D), (E), (G), (H), (I), (J) and schematised in (B). Data is represented as mean ± SEM. *p<0.05; **p<0.01, ****p<0.0001 as determined with unpaired t tests or Mann–Whitney tests. See Figure 3—figure supplement 1 for further subjects and quantification.
-
Figure 3—source data 1
Ratio of anterior-posterior interhemispheric fissure (IHF) length over total midline length in control and partial corpus callosum dysgenesis (pCCD) humans.
- https://cdn.elifesciences.org/articles/61618/elife-61618-fig3-data1-v2.xlsx
Figure 3—figure supplement 1
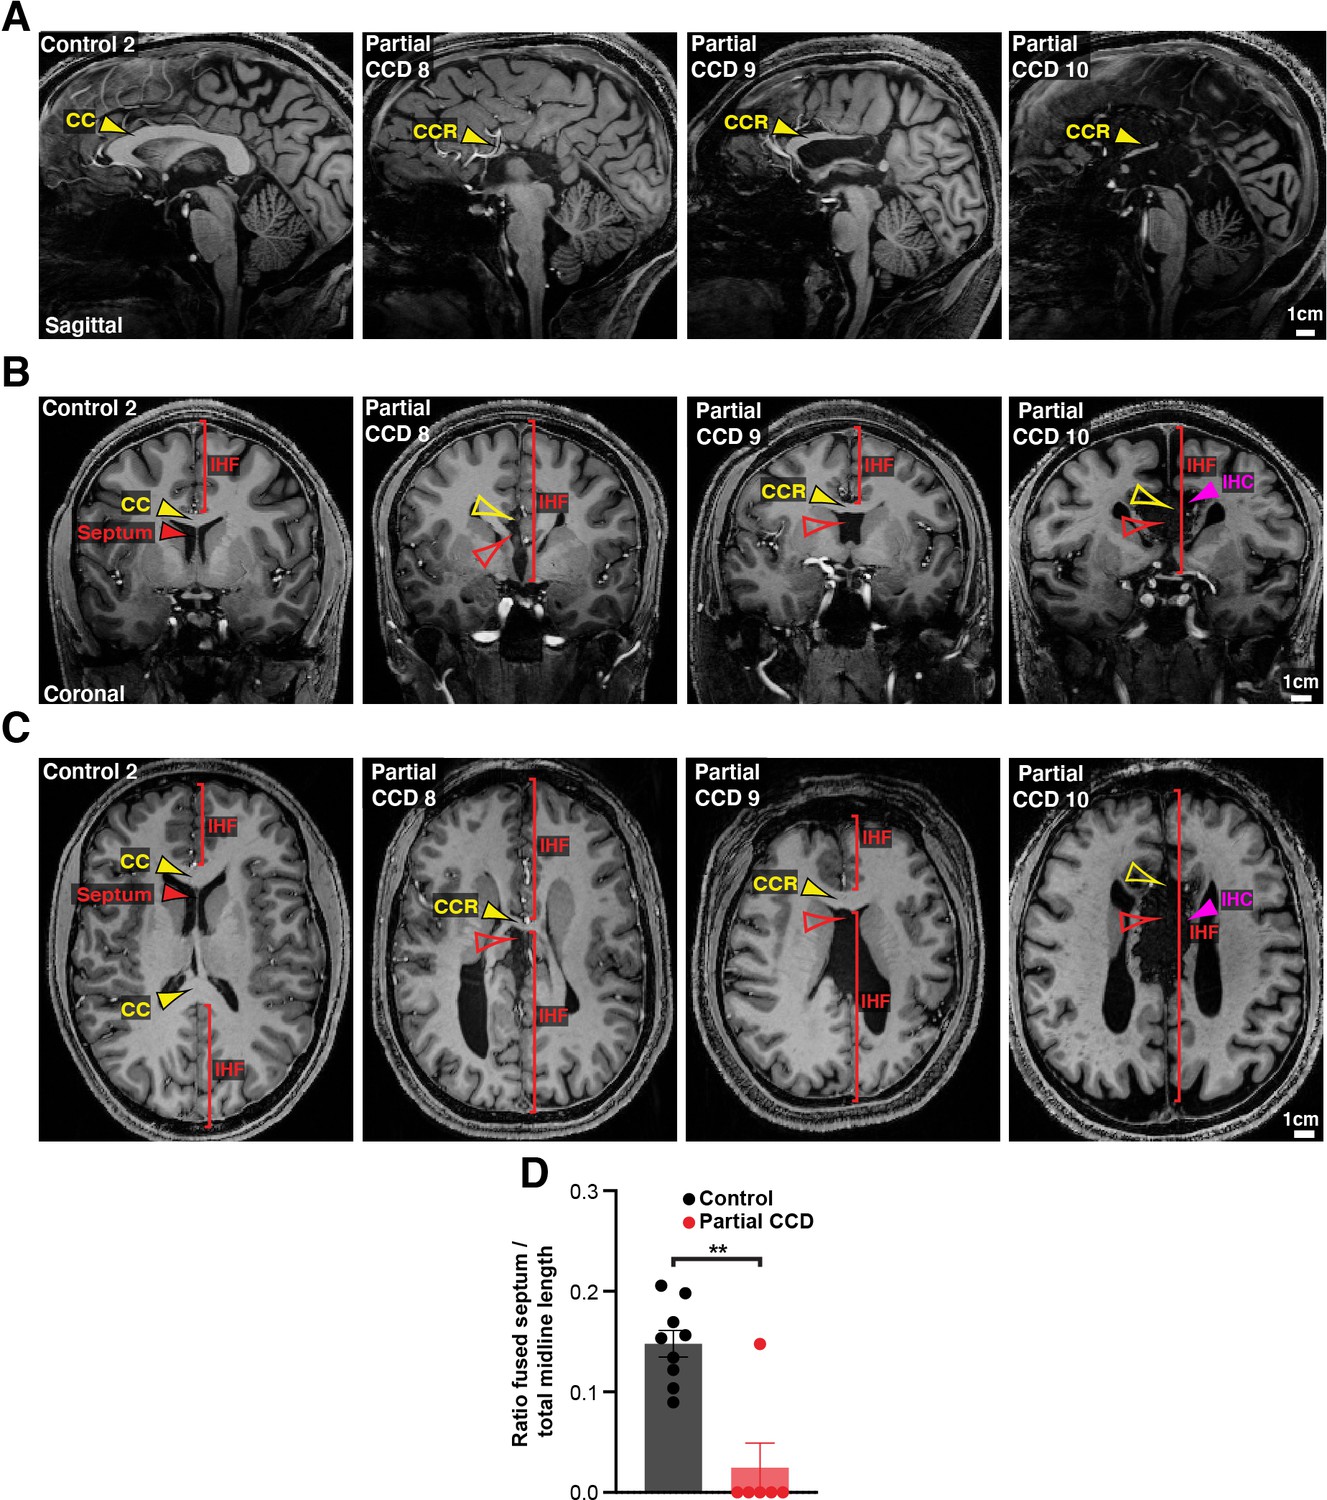
Structural MRI study of interhemispheric fissure (IHF) and septal defects associated with partial corpus callosum dysgenesis (CCD) in humans.
Sagittal (A), coronal (B), and axial (C) slices from T1-weighted structural scans from remaining partial CCD individuals (4/10) and another neurotypical (control) individual (1/9). The CC or the CC remnant (CCR) is indicated with yellow arrowheads, presence of an interhemispheric cyst (IHC) is indicated with magenta arrowheads, the IHF extent is indicated with red brackets, and the septum, septal leaves, or absence of the septal substrate is indicated with red arrowheads. (D) The ratio of fused septum was measured from axial images in (C) (and Figure 3C) and normalised to the total midline length. Data is represented as mean ± SEM. **p<0.01, as determined with an unpaired t test. See related Figure 3 for further subjects and quantification.
-
Figure 3—figure supplement 1—source data 1
Ratio of fused septum length over total midline length in control and partial corpus callosum dysgenesis (pCCD) humans.
- https://cdn.elifesciences.org/articles/61618/elife-61618-fig3-figsupp1-data1-v2.xlsx
Figure 4
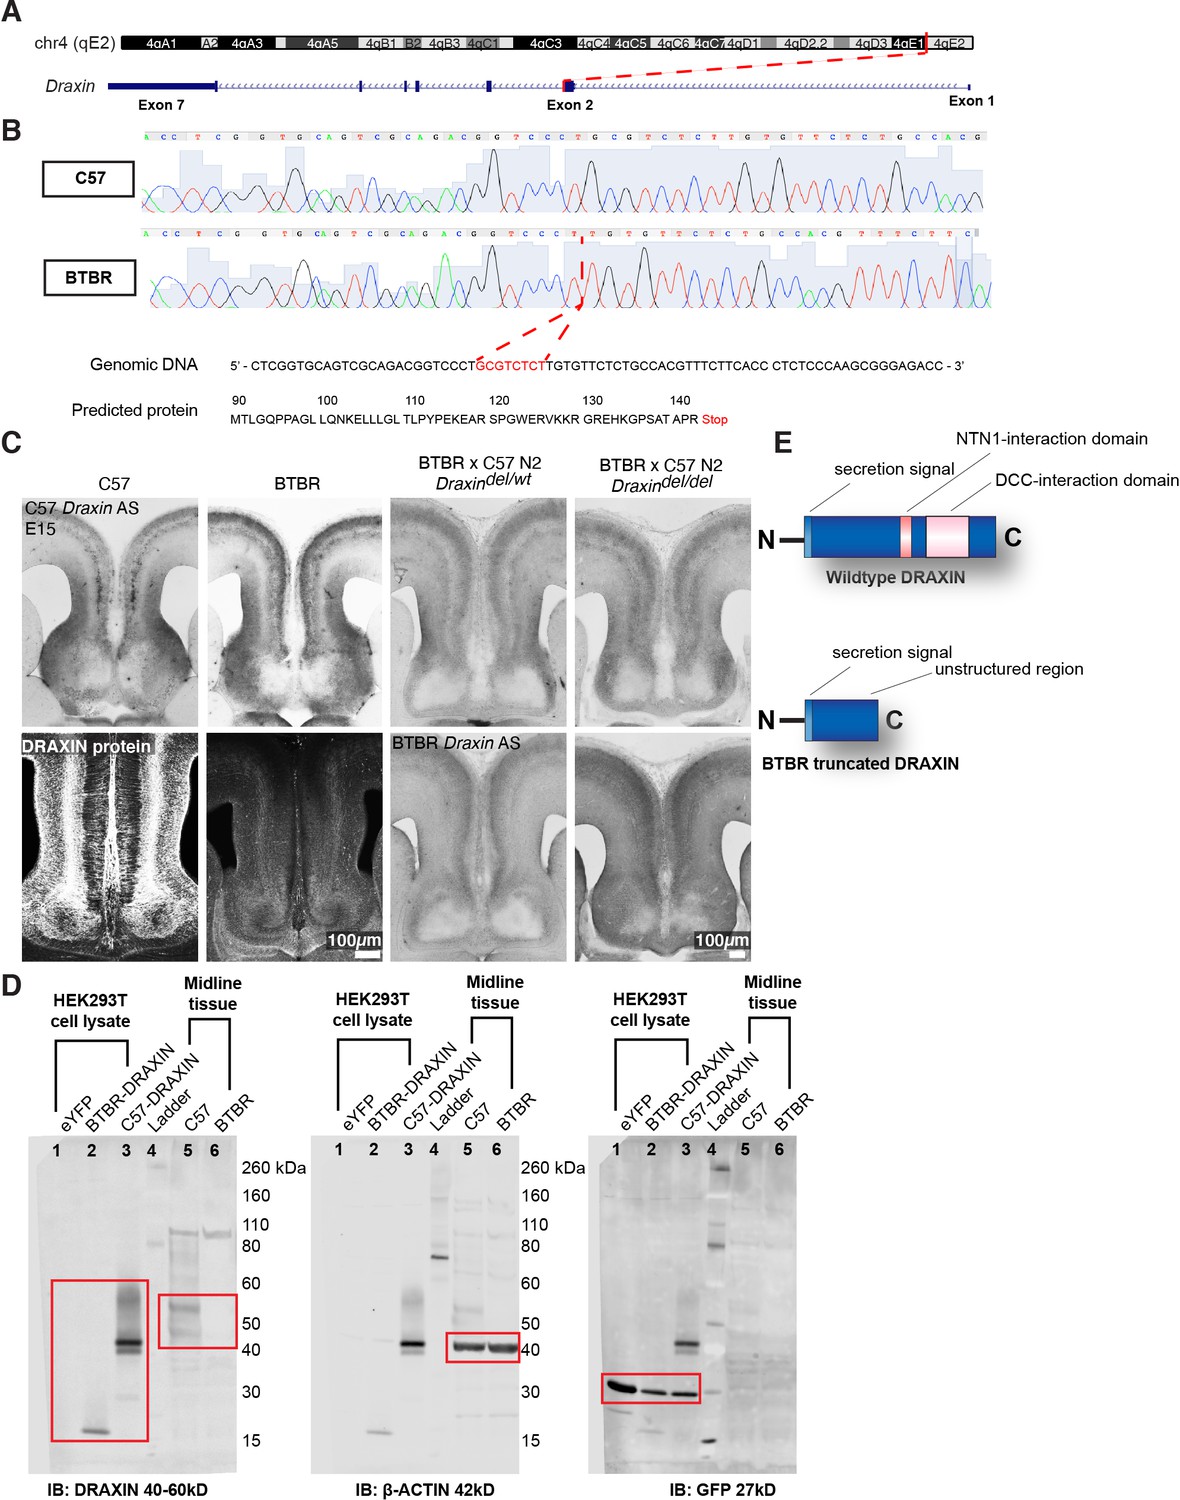
An eight base-pair deletion in Draxin in BTBR strains truncates and reduces DRAXIN protein expression.
Exome sequencing of a candidate region on mouse chromosome 4 (A) and confirmatory Sanger sequencing found an eight base-pair deletion in Draxin, which introduces a premature stop codon (B), predicted to truncate DRAXIN protein (B, E). (C) In situ hybridisation against 3′ C57 or BTBR Draxin demonstrates a similar pattern of Draxin mRNA expression in C57 and BTBR parental strains and in the BTBR × C57 N2 mice. Fluorescent immunohistochemistry for DRAXIN protein (bottom-left panels) demonstrates that DRAXIN is highly expressed in C57 mice at E15 but not in BTBR mice. (D) Cell lysates derived from HEK293T cells expressing pCag-eYFP or pCag-iresGFP with either BTBR or C57 Draxin coding sequences were incubated with anti-DRAXIN, anti- β-ACTIN, and anti-GFP antibodies. Specific bands at ~18 kD and ~40–45 kD are shown for DRAXIN (red boxes) and demonstrate that BTBR Draxin produces a protein of reduced molecular weight, indicating truncation. Midline tissue lysates from E15 C57 and BTBR mice incubated with anti-DRAXIN and anti-β-ACTIN antibodies reveal (red boxes) specific bands at ~40–60 kD and ~42 kD, respectively, indicating that DRAXIN expression is severely reduced in BTBR mice.
Figure 5
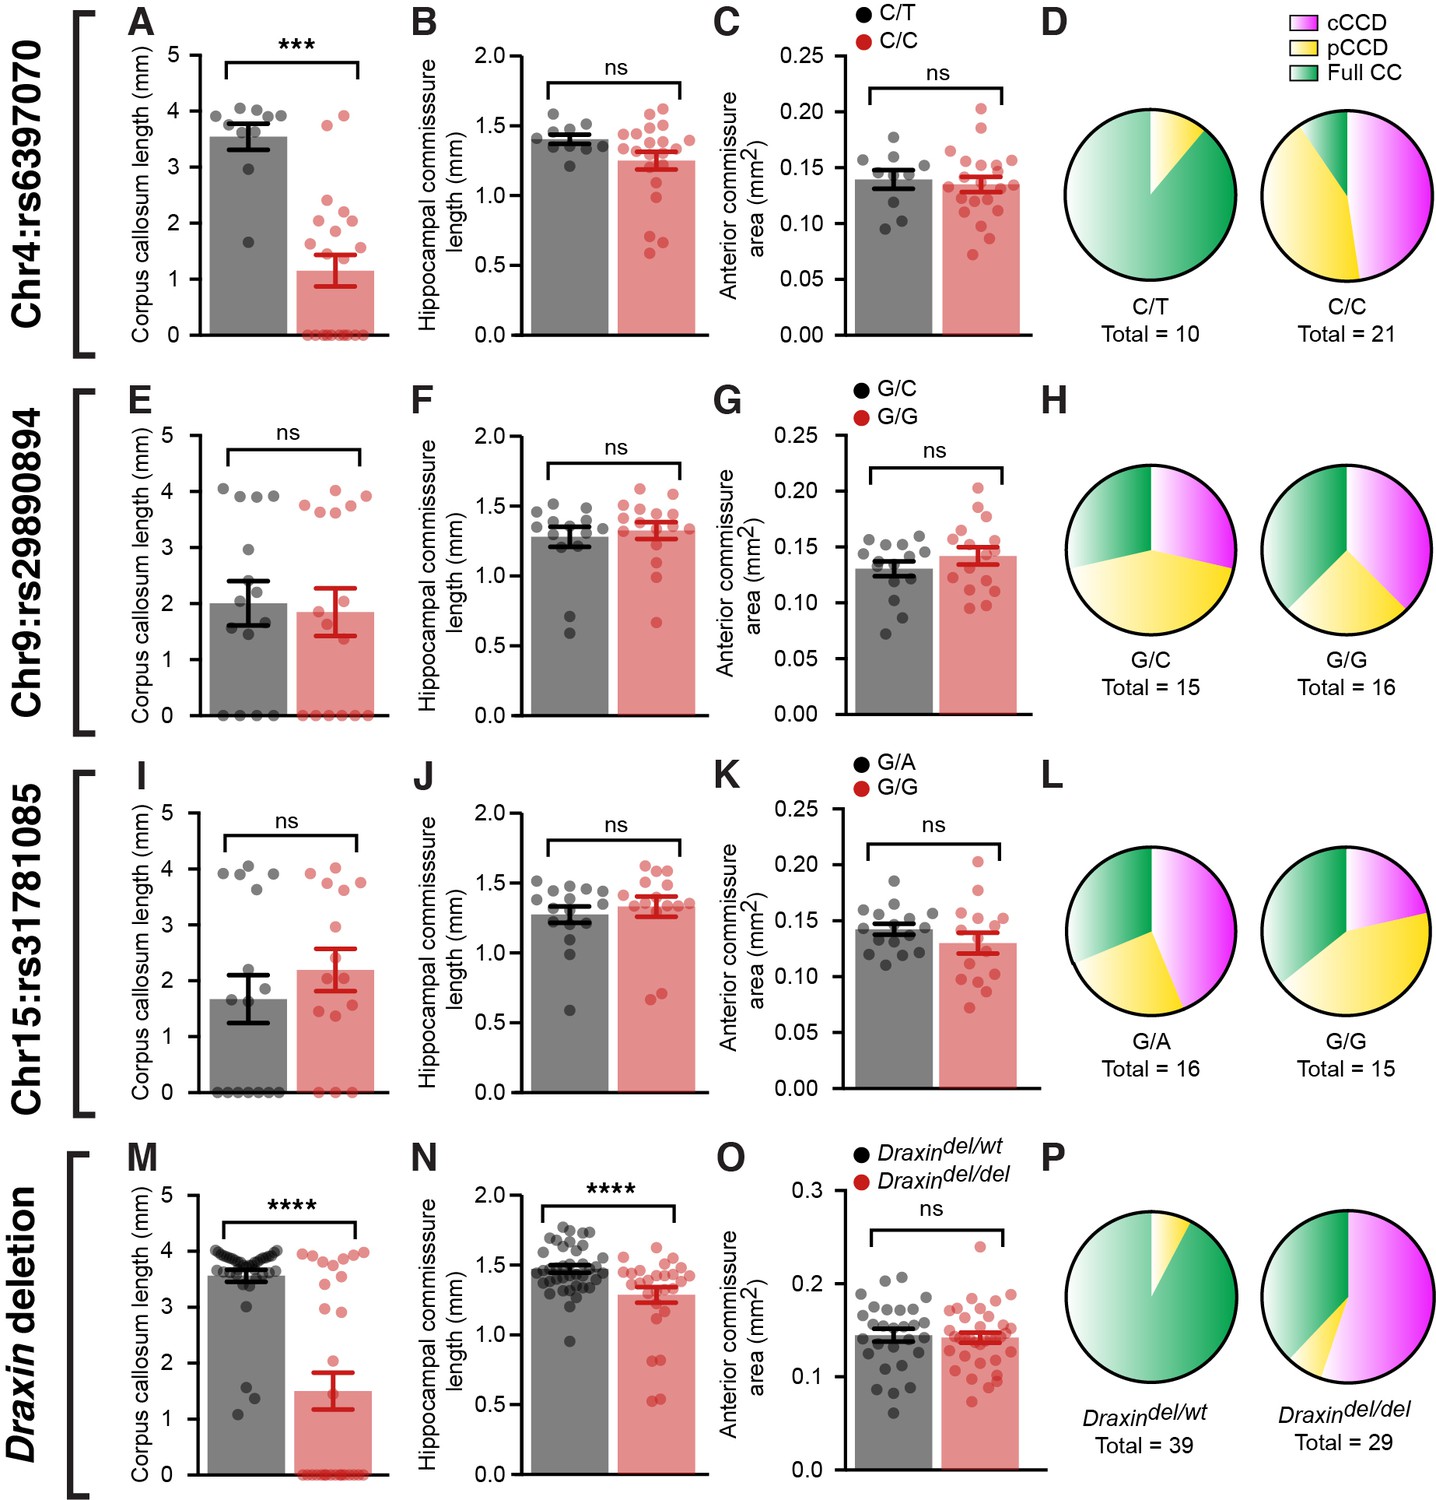
BTBR allele on chromosome 4 and a deletion in Draxin are associated with corpus callosum dysgenesis (CCD) in BTBR × C57 N2 mice.
Group-wise comparison for marker single-nucleotide polymorphisms (SNPs) at candidate genetic loci compared with CC length (A, E, I), hippocampal commissure (HC) length (B, F, J), anterior commissure (AC) area (C, G, K), or frequency of CC phenotypes (D, H, L) in BTBR × C57 N2 mice. Genotyping for the eight base-pair deletion in Draxin in BTBR × C57 N2 mice compared with CC length (M), HC length (N), AC area (O), or frequency of CC phenotypes (P). Mice homozygous for the BTBR allele (C/C at SNP rs6397070 on chromosome [Chr] 4) or the Draxin deletion have significantly reduced CC length and HC length compared to heterozygous littermates. Data is represented as mean ± SEM. ***p<0.001, ****p<0.0001, ns = not significant, as determined by Kruskal–Wallis ANOVA tests.
-
Figure 5—source data 1
Commissure size in BTBR N2 mice based on Draxin mutant allele genotype.
- https://cdn.elifesciences.org/articles/61618/elife-61618-fig5-data1-v2.xlsx
Figure 6
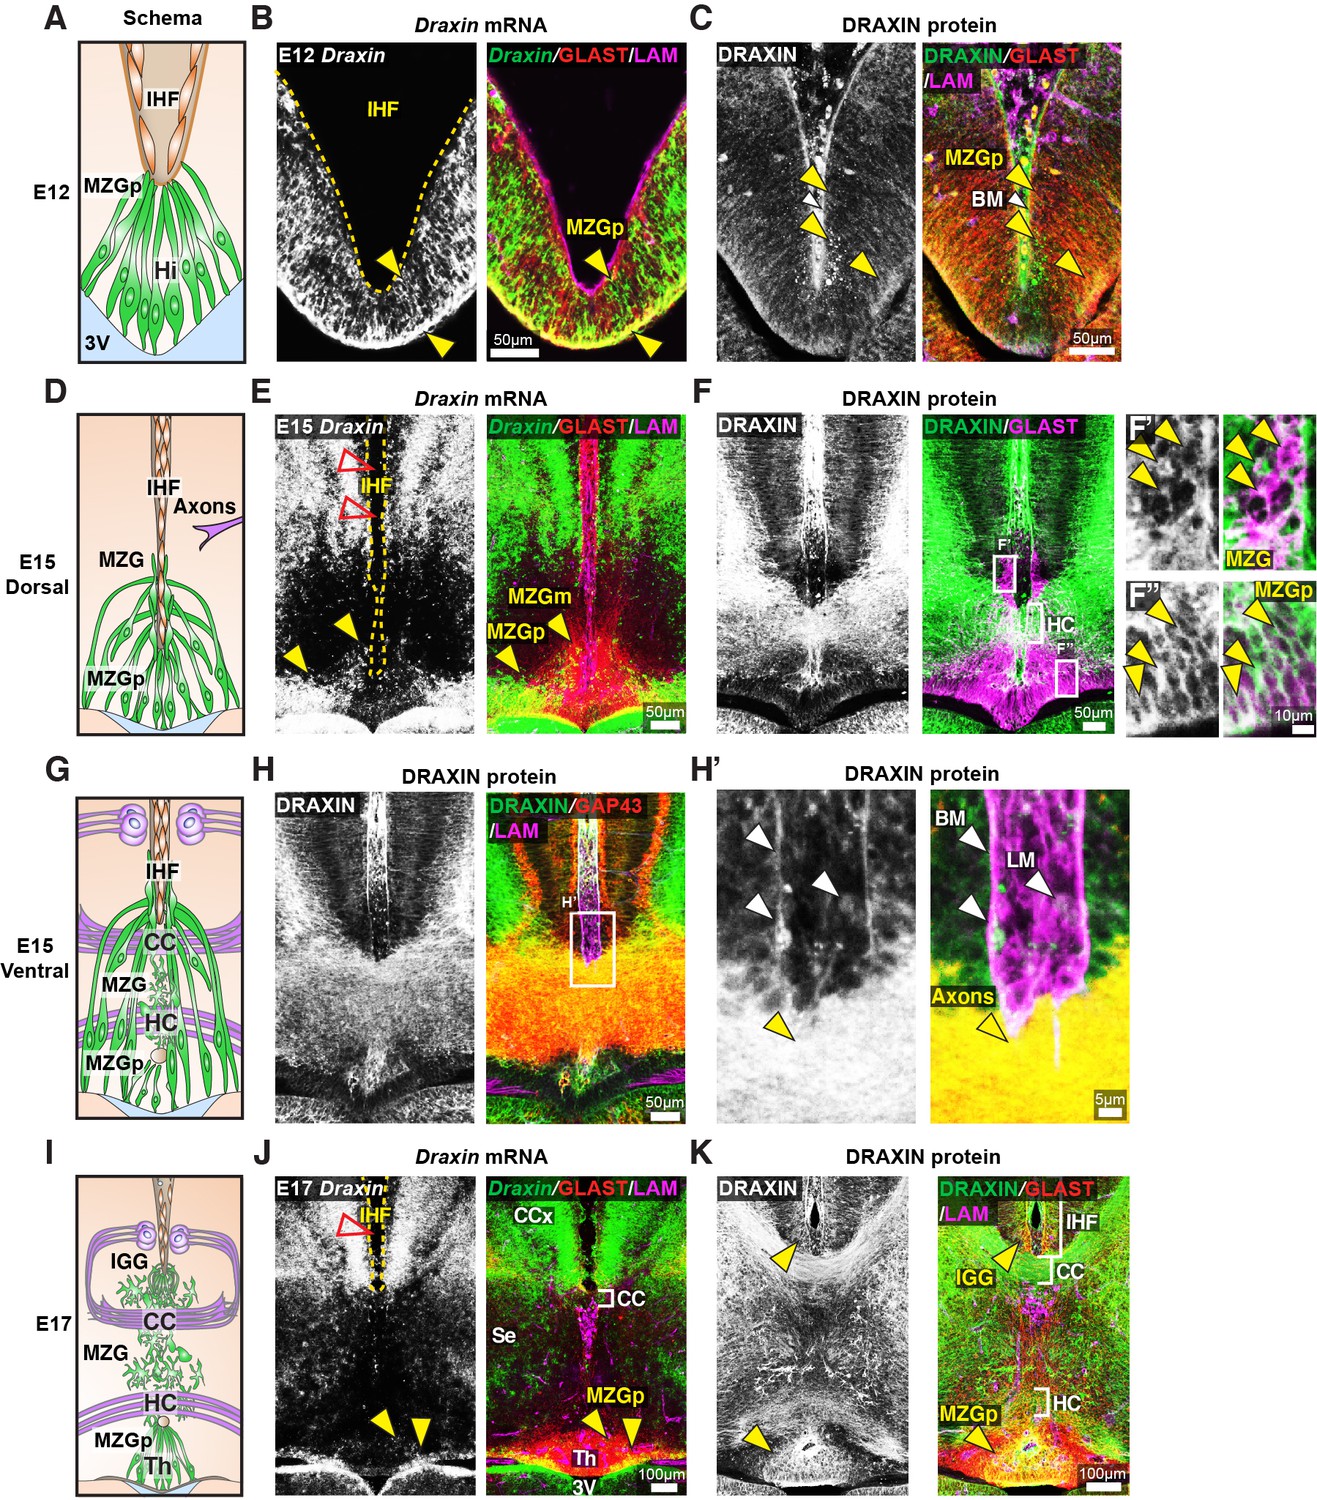
Draxin is expressed in midline zipper glia (MZG) and their progenitors, and associates with MZG membranes, leptomeninges, and the pial surface of the interhemispheric fissure (IHF).
Schema of interhemispheric midline at E12 (A), E15 (D dorsal; G ventral) and E17 (I). In situ hybridisation for Draxin mRNA (white or green), with immunohistochemistry for astroglial marker, GLAST (red), and leptomeninges and IHF marker, Laminin (LAM; magenta) in E12 (B), E15 (E), and E17 (J) wildtype CD1 mid-horizontal telencephalic midline tissue sections. Yellow arrowheads indicate Draxin-positive/GLAST-positive glia. Open red arrowheads indicate lack of Draxin mRNA within the IHF (yellow outlined). Immunohistochemistry for DRAXIN (white or green), GLAST (red or magenta), and LAM (magenta) in E12 (C), E15 (F), and E17 (K) wildtype CD1 mid-horizontal telencephalic midline tissue sections. (H) DRAXIN (white or green), axonal marker GAP43 (red), and LAM (magenta) in E15 ventral telencephalic midline tissue sections. Yellow arrowheads indicate regions of DRAXIN protein on GLAST-positive glial fibres (C, F, K) or DRAXIN protein on GAP43-positive axons (H’). White arrowheads indicate DRAXIN protein within the IHF and on the basement membrane of the IHF. BM: basement membrane; CCx: cingulate cortex; IGG: indusium griseum glia; LM: leptomeninges; MZGp: midline zipper glia progenitors; Se: septum; Th: telencephalic hinge; 3V: third ventricle.
Figure 7
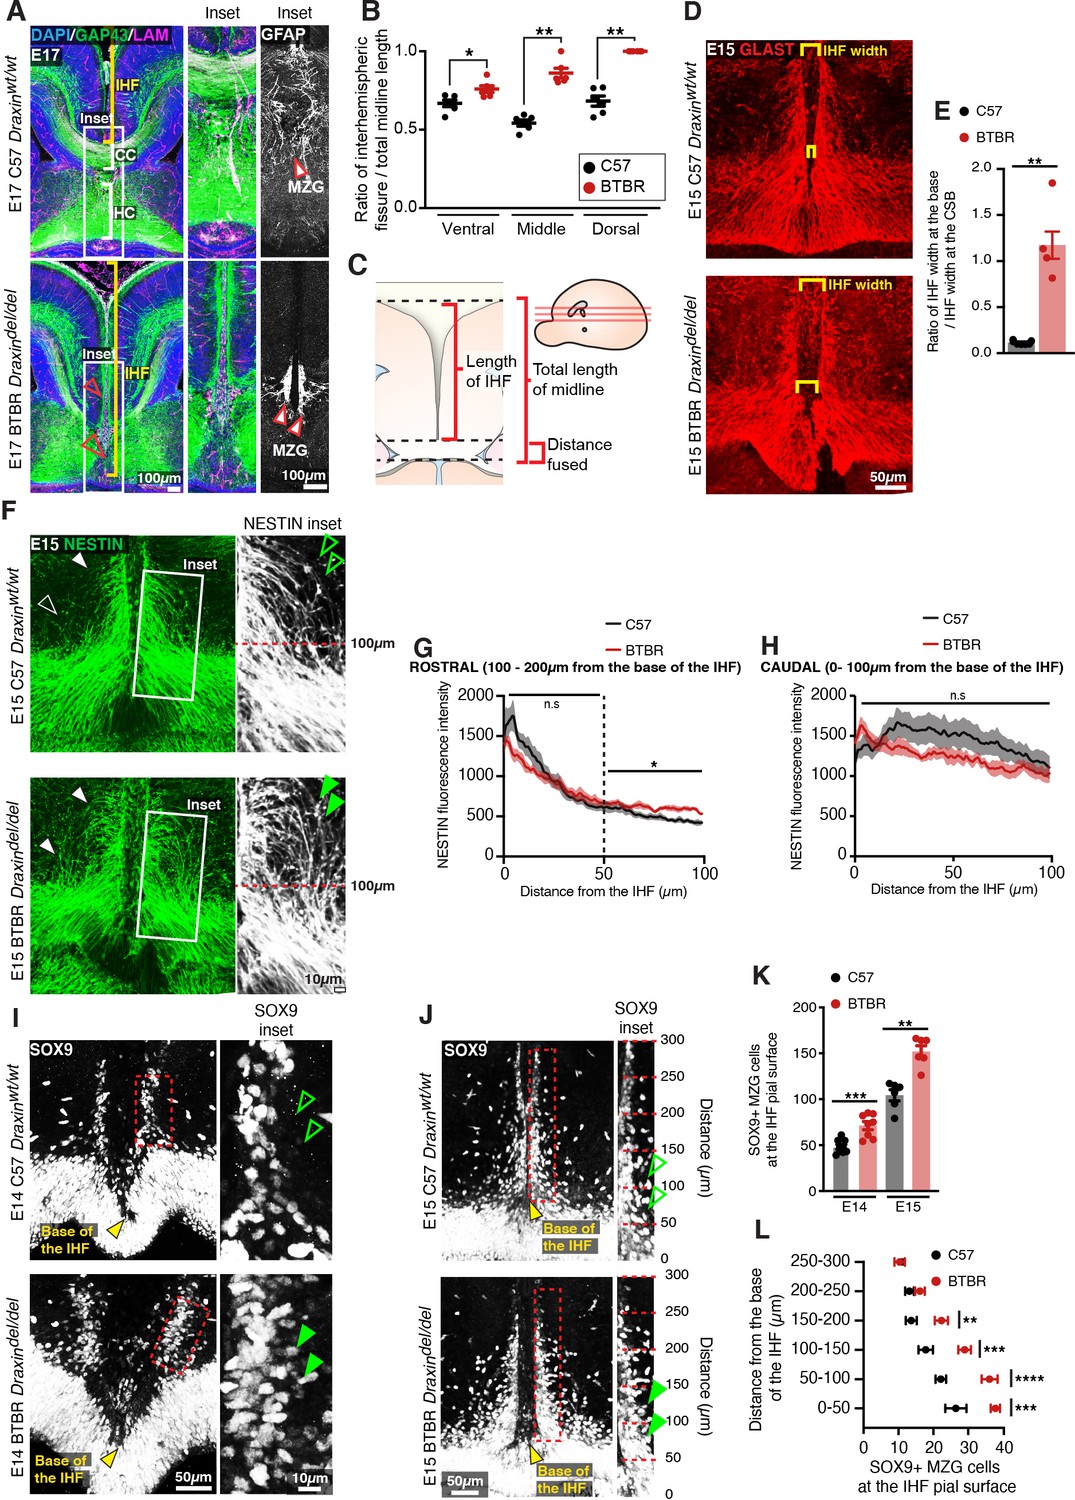
BTBR midline zipper glia (MZG) undergo precocious somal translocation to the interhemispheric fissure (IHF) and fail to intercalate for IHF remodelling.
(A) Mid-horizontal sections of E17 wildtype C57 and BTBR mice immunolabelled with growing axon marker, GAP43 (green), astrocyte marker, GFAP (white; inset only), and leptomeninges marker, pan-LAMININ (magenta), and counterstained with DAPI (blue). The corpus callosum (CC) and hippocampal commissure (HC) are indicated with white brackets in C57 mice, and their absence in BTBR mice is indicated with red arrowheads. The IHF is indicated with yellow brackets, and white boxes indicate the region where insets of GFAP-positive MZG were taken (right). (C) The ratio of IHF length over total telencephalic midline length was measured (B) from representative ventral, middle (shown in A), and dorsal horizontal sections. Immunohistochemistry on E15 wildtype C57 and BTBR horizontal brain sections labelling GLAST-positive MZG (D) and NESTIN-positive radial glia (F) at the ventral midline. IHF width is indicated with yellow brackets in (D), and the ratio of IHF length close to the base of the IHF compared with at the corticoseptal boundary (CSB) is quantified in (E). White arrowheads in (F) show radial MZG undergoing somal translocation to the IHF surface, and green arrowheads in insets demonstrate an increase in radial MZG fibres lateral to the base of the IHF in BTBR mice; the fluorescence intensity of these NESTIN fibres is quantified in (G) (rostral to the base of the IHF) and (H) (caudal, close to the base of the IHF). Immunohistochemistry on E14 (I) and E15 (J) wildtype C57 and BTBR horizontal brain sections labelling SOX9-positive glial cell bodies. Green arrowheads indicate increased SOX9-positive cell bodies at the IHF surface in BTBR mice. The base of the IHF is indicated with yellow arrowheads. The number of MZG cell bodies at the pial surface (outlined in red) is quantified in (K) and (L) (binned). Data represent mean ± SEM. *p<0.05, **p<0.01, ***p<0.001, ****p<0.0001 as determined with either an unpaired t test (E14, K), Mann–Whitney test (E15, K), or two-way ANOVA with Sidak’s multiple comparison test (L).
-
Figure 7—source data 1
Ratio of interhemispheric fissure (IHF) over total midline length in E17 BTBR and C57 mice.
- https://cdn.elifesciences.org/articles/61618/elife-61618-fig7-data1-v2.xlsx
Figure 8 with 1 supplement
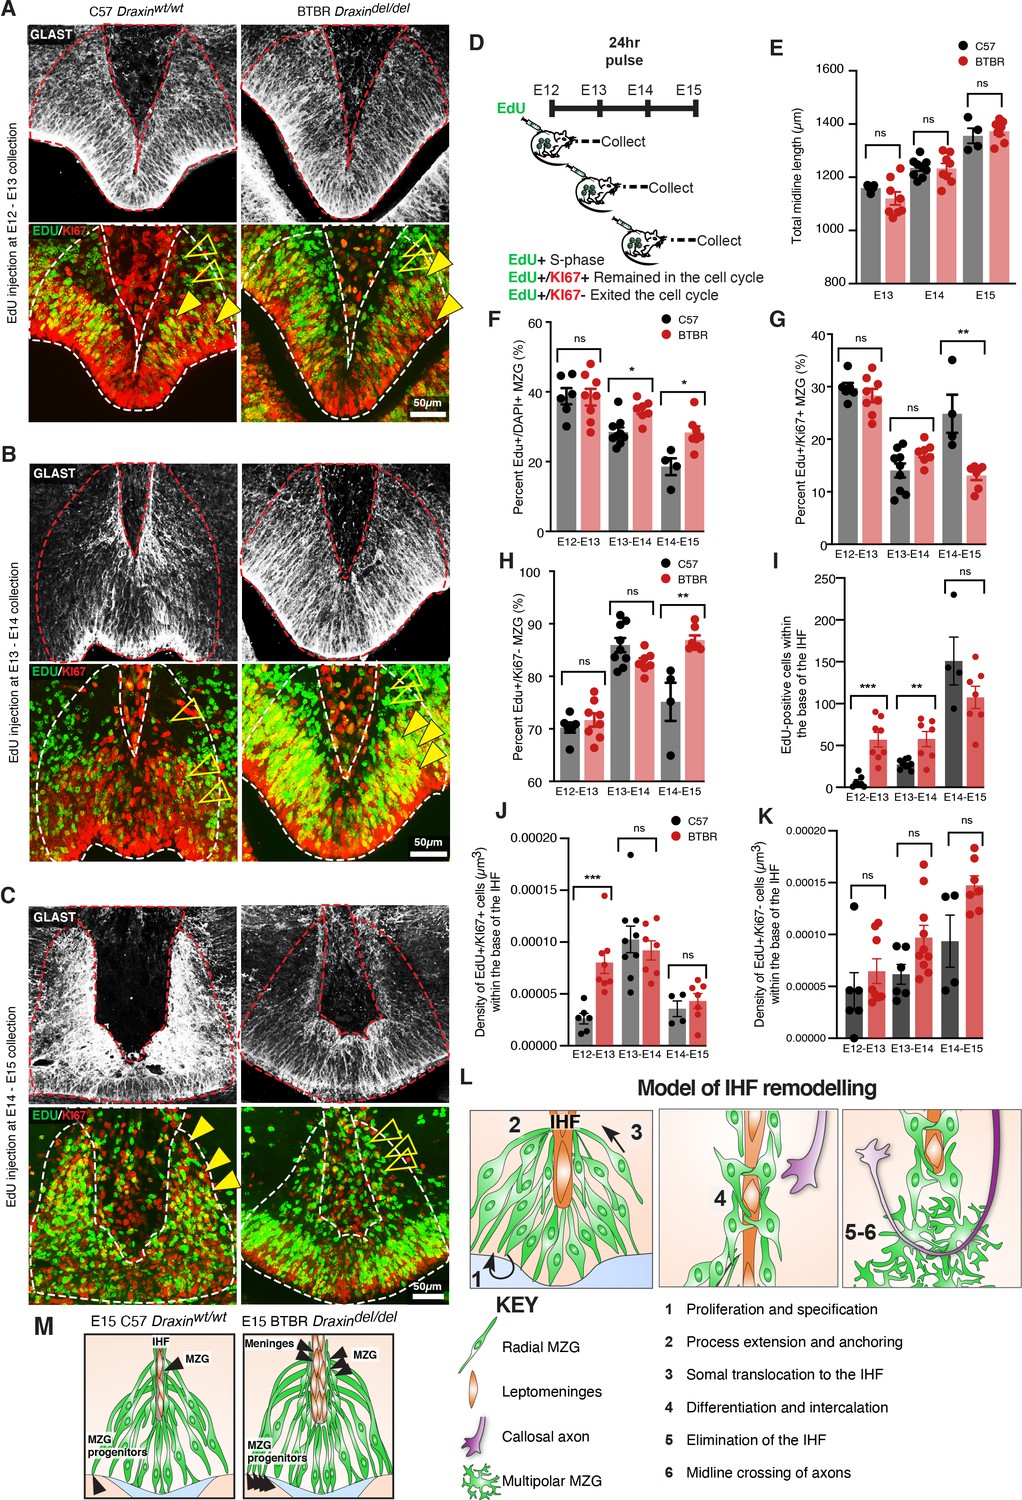
Elevated midline zipper glia (MZG) progenitor and leptomeningeal proliferation in BTBR mice.
Wildtype C57 and BTBR pregnant mice were injected with ethynyl deoxyuridine (EdU) every 24 hr from E12 and collected 24 hr later (D). Immunohistochemistry for GLAST (white), EdU (green), and cell cycle marker, KI67 (red) on E13 (A), E14 (B), and E15 (C) wildtype C57 and BTBR horizontal brain sections of the telencephalic hinge and interhemispheric fissure (IHF) base. (E) To determine whether the litters were age-matched, the total length of the midline was compared between groups. The percentage of EdU-positive/DAPI-positive, EdU-positive/KI67-positive, and EdU-positive/KI67-negative MZG from the telencephalic hinge (white dotted outline) is quantified in (F), (G), and (H), respectively. EdU-positive cells within the base of the IHF is quantified in (I). EdU-positive/KI67-positive cells or EdU-positive/KI67-negative cells within the IHF were normalised to the total volume of the IHF as quantified in (J) and (K), respectively. Data represent mean ± SEM, *p<0.05, **p<0.01, ***p<0.001, ns = not significant, as determined with Mann–Whitney tests. (L) Schema of major steps involved in IHF remodelling. (M) Schema of BTBR phenotype at E15 compared with wildtype C57: BTBR mice display increased proliferation of MZG progenitors and precocious migration to the IHF surface as well as proliferation of the leptomeninges and expansion of the IHF, which may underlie failed IHF remodelling in these mice. See related Figure 8—figure supplement 1.
-
Figure 8—source data 1
Measurements of IHF length and cells expressing EdU or KI67 within the telencephalic midline of E13-E15 BTBR and C57 mice.
- https://cdn.elifesciences.org/articles/61618/elife-61618-fig8-data1-v2.xlsx
Figure 8—figure supplement 1
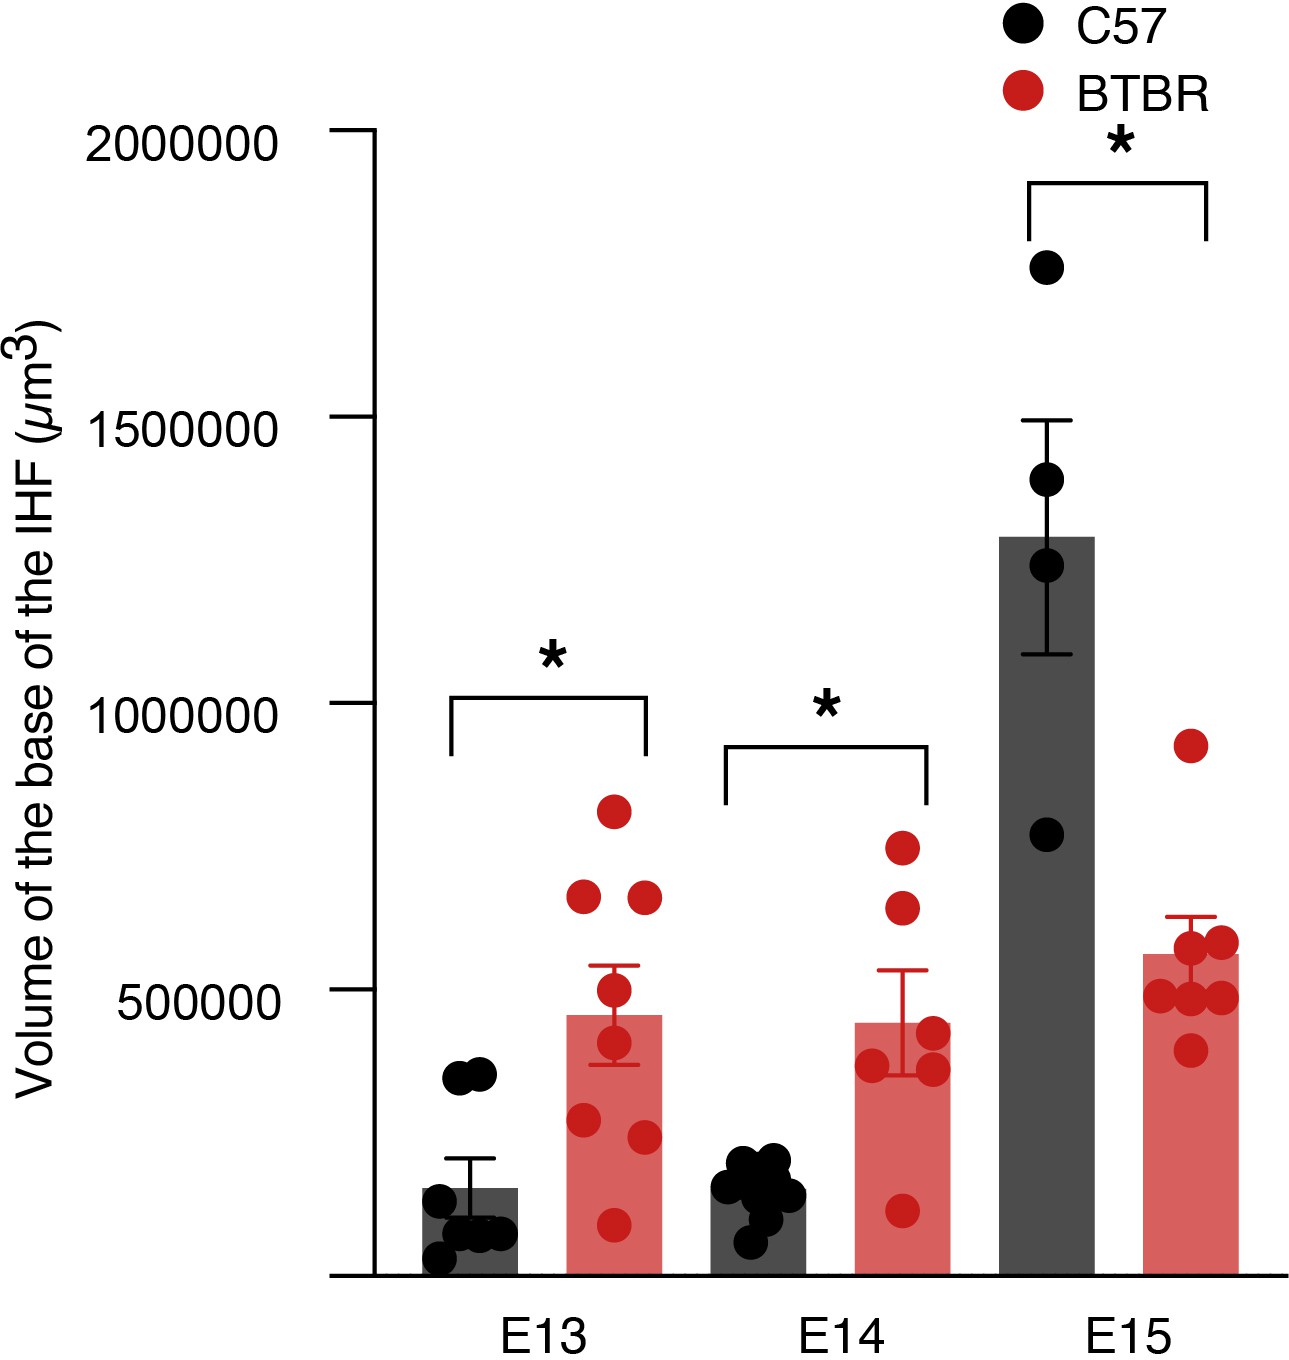
Volume of the interhemispheric fissure (IHF) base in BTBR mice.
Volume of the IHF base analysed in C57 and BTBR mice that was used to quantify ethynyl deoxyuridine (EdU)-positive cells in Figure 8I–K. *p<0.05, as determined by Mann–Whitney tests. See related Figure 8.
-
Figure 8—figure supplement 1—source data 1
Volume of the base of the IHF in E13-E15 BTBR and C57 mice.
- https://cdn.elifesciences.org/articles/61618/elife-61618-fig8-figsupp1-data1-v2.xlsx
Tables
Key resources table
| Reagent type (species) or resource | Designation | Source or reference | Identifiers | Additional information |
|---|---|---|---|---|
| Gene (Mus musculus) | Draxin | Mus musculus genome resource | 70433 | |
| Strain, strain background (Mus musculus) | BTBR T + Itpr3tf/J | The Jackson Laboratory | 002282 | |
| Strain, strain background (Mus musculus) | C57Bl/6J | The Jackson Laboratory | 000664 | |
| Cell line (Homo sapiens) | Human embryonic kidney (HEK) 293T | ATCC | RRID:CVCL_0045 | ATCC Cat# CRL-1573, obtained via the University of Queensland |
| Antibody | Sheep polyclonal anti-DRAXIN | R&D Systems | AF6149, RRID:AB_10640005 | ‘(1:250)’ |
| Antibody | Mouse monoclonal anti-human KI67 | BD Pharmingen | 550609, RRID:AB_393778 | ‘(1:500)’ |
| Antibody | Mouse monoclonal anti-GAP43 | Millipore | MAB347, RRID:AB_94881 | ‘(1:500)’ |
| Antibody | Rabbit polyclonal anti-GFP | Thermo Fisher Scientific | A-6455, RRID:AB_221570 | ‘(1:1000)’ |
| Antibody | Rabbit polyclonal anti-GFAP | Dako | Z0334, RRID:AB_10013382 | ‘(1:500)’ |
| Antibody | Mouse monoclonal anti-Glast (EAAT1) | Abcam | Ab49643, RRID:AB_869830 | ‘(1:500)’ |
| Antibody | Rabbit polyclonal anti-Glast (EAAT1) | Abcam | Ab416, RRID:AB_304334 | ‘(1:250)’ |
| Antibody | Chicken polyclonal anti-Laminin | LS-Bio | C96142, RRID:AB_2033342 | ‘(1:500)’ |
| Antibody | Rabbit polyclonal anti-Laminin (pan-Laminin) | Sigma | L9393, RRID:AB_477163 | ‘(1:500)’ |
| Antibody | Rat monoclonal anti-Nestin (NES) | Developmental Studies Hybridoma Bank | AB 2235915, RRID:AB_2235915 | ‘(1:50)’ |
| Antibody | Rabbit polyclonal anti-SOX9 | Merck | AB5535, RRID:AB_2239761 | ‘(1:500)’ |
| Antibody | Goat anti-β-ACTIN | SCIGEN | AB0145-200, N/A | ‘(1:1000)’ |
| Recombinant DNA reagent | pPBCAG-IRES-GFP | Chen et al., 2020 | ||
| Recombinant DNA reagent | pGEMT | Promega | A1360 | |
| Sequence-based reagent | Draxin_riboprobe_F | Allen Brain Atlas | CAGGGAGGTTTAGGACAAACAG | |
| Sequence-based reagent | Draxin_riboprobe_R | Allen Brain Atlas | TGTAGGAGCTGAGGGAAAGAAG | |
| Sequence-based reagent | Draxin_CDS_F | This paper | GAATTCGACAGGGAGAGCCAATG | |
| Sequence-based reagent | Draxin_CDS_R | This paper | GCGGCCGCGTACTGGGCGTACACCTGCT | |
| Sequence-based reagent | Chromosome 4, SNP rs6397070 forward | This paper | TTTATGGCTGGGGACTTCAG | |
| Sequence-based reagent | Chromosome 4, SNP rs6397070 reverse | This paper | CGAATCCAAAGCTCTCTTGC | |
| Sequence-based reagent | Chromosome 9, SNP rs29890894, forward | This paper | AGCTTGGTGGCATCCATATC | |
| Sequence-based reagent | Chromosome 9, SNP rs29890894, reverse | This paper | GCACTCTCCCTACTGCTTGG | |
| Sequence-based reagent | Chromosome 15, SNP rs31781085 forward | This paper | GATCGTTGCAGTGACCACAC | |
| Sequence-based reagent | Chromosome 15, SNP rs31781085 reverse | This paper | GCTGATTGGCAGGTTCTGAT | |
| Sequence-based reagent | Draxin allele genotyping, wildtype forward | This paper | AGACGGTCCCTGCGTCTC | |
| Sequence-based reagent | Draxin allele genotyping, mutant forward | This paper | GTCGCAGACGGTCCCTTG | |
| Sequence-based reagent | Draxin allele genotyping, common reverse | This paper | AGGCTTCCCAGATGACACTC | |
| Commercial assay, kit | Click-iT EdU Cell Proliferation Kit for Imaging, Alexa Fluor 488 dye | Invitrogen | C10337 | |
| Commercial assay, kit | Click-iT EdU Cell Proliferation Kit for Imaging, Alexa Fluor 555 dye | Invitrogen | C10338 | |
| Software, algorithm | Fiji | Fiji | RRID:SCR_002285 | |
| Software, algorithm | Prism | GraphPad | RRID:SCR_002798 | |
| Software, algorithm | Imaris | Bitplane | N/A | |
| Other | 4′,6-Diamidino-2-phenylindole dihydrochloride (DAPI) | Invitrogen | D1306 | ‘(1:750)’ |
Additional files
-
Supplementary file 1
Statistics.
- https://cdn.elifesciences.org/articles/61618/elife-61618-supp1-v2.docx
-
Transparent reporting form
- https://cdn.elifesciences.org/articles/61618/elife-61618-transrepform-v2.docx
Download links
A two-part list of links to download the article, or parts of the article, in various formats.
Downloads (link to download the article as PDF)
Open citations (links to open the citations from this article in various online reference manager services)
Cite this article (links to download the citations from this article in formats compatible with various reference manager tools)
DRAXIN regulates interhemispheric fissure remodelling to influence the extent of corpus callosum formation
eLife 10:e61618.
https://doi.org/10.7554/eLife.61618


