The diversity and function of sourdough starter microbiomes
- Department of Biology, Tufts University, United States
- Department of Ecology and Evolutionary Biology, University of Colorado, United States
- Cooperative Institute for Research in Environmental Sciences, University of Colorado, United States
- Department of Applied Ecology, North Carolina State University, United States
- North Carolina Museum of Natural Sciences, United States
- Department of Chemistry, Tufts University, United States
- Department of History, North Carolina State University, United States
- Danish Natural History Museum, University of Copenhagen, Denmark
Figures
Figure 1
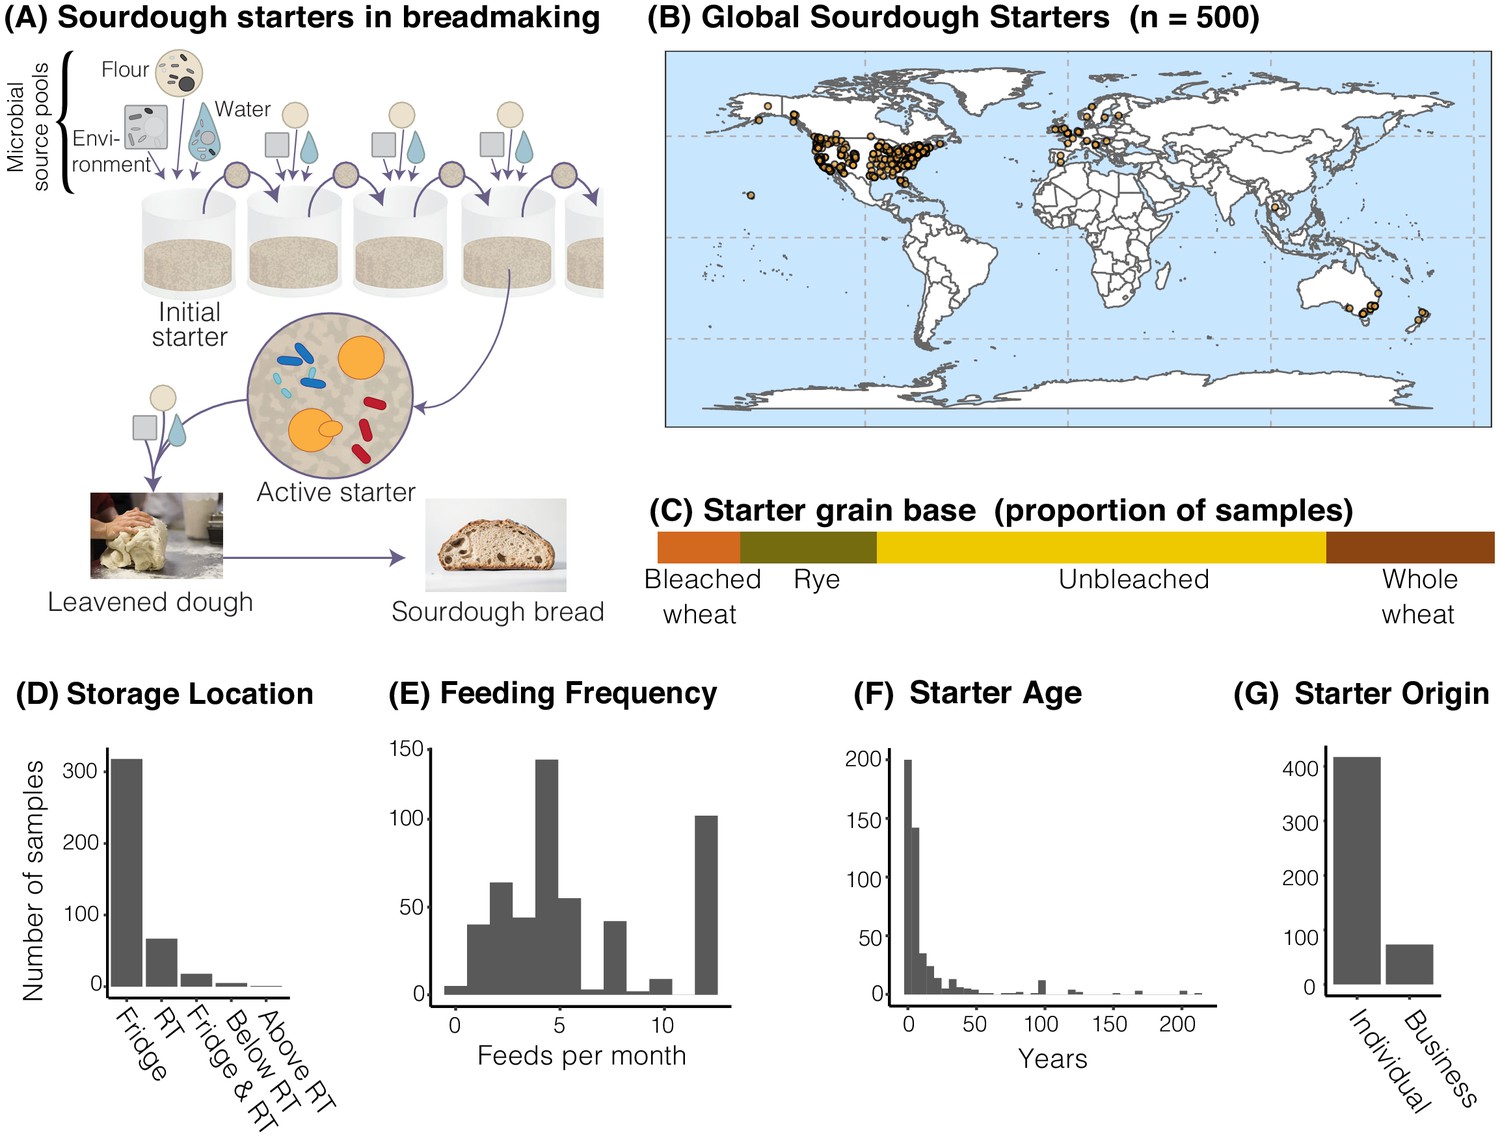
The distribution of sourdough starters sampled in this study.
(A) Overview of the process of serial transfer of a sourdough starter. (B) Locations of the 500 sourdough starters analyzed in this study. Each dot represents one sourdough starter. (C-G) Characteristics of collected sourdough starters. In (D), RT = room temperature. In (G), ‘Individual’ = participant reported acquiring their starter from another individual (not a commercial source); ‘Business’ = participant reported acquiring their starter from a commercial source.
Figure 2 with 4 supplements
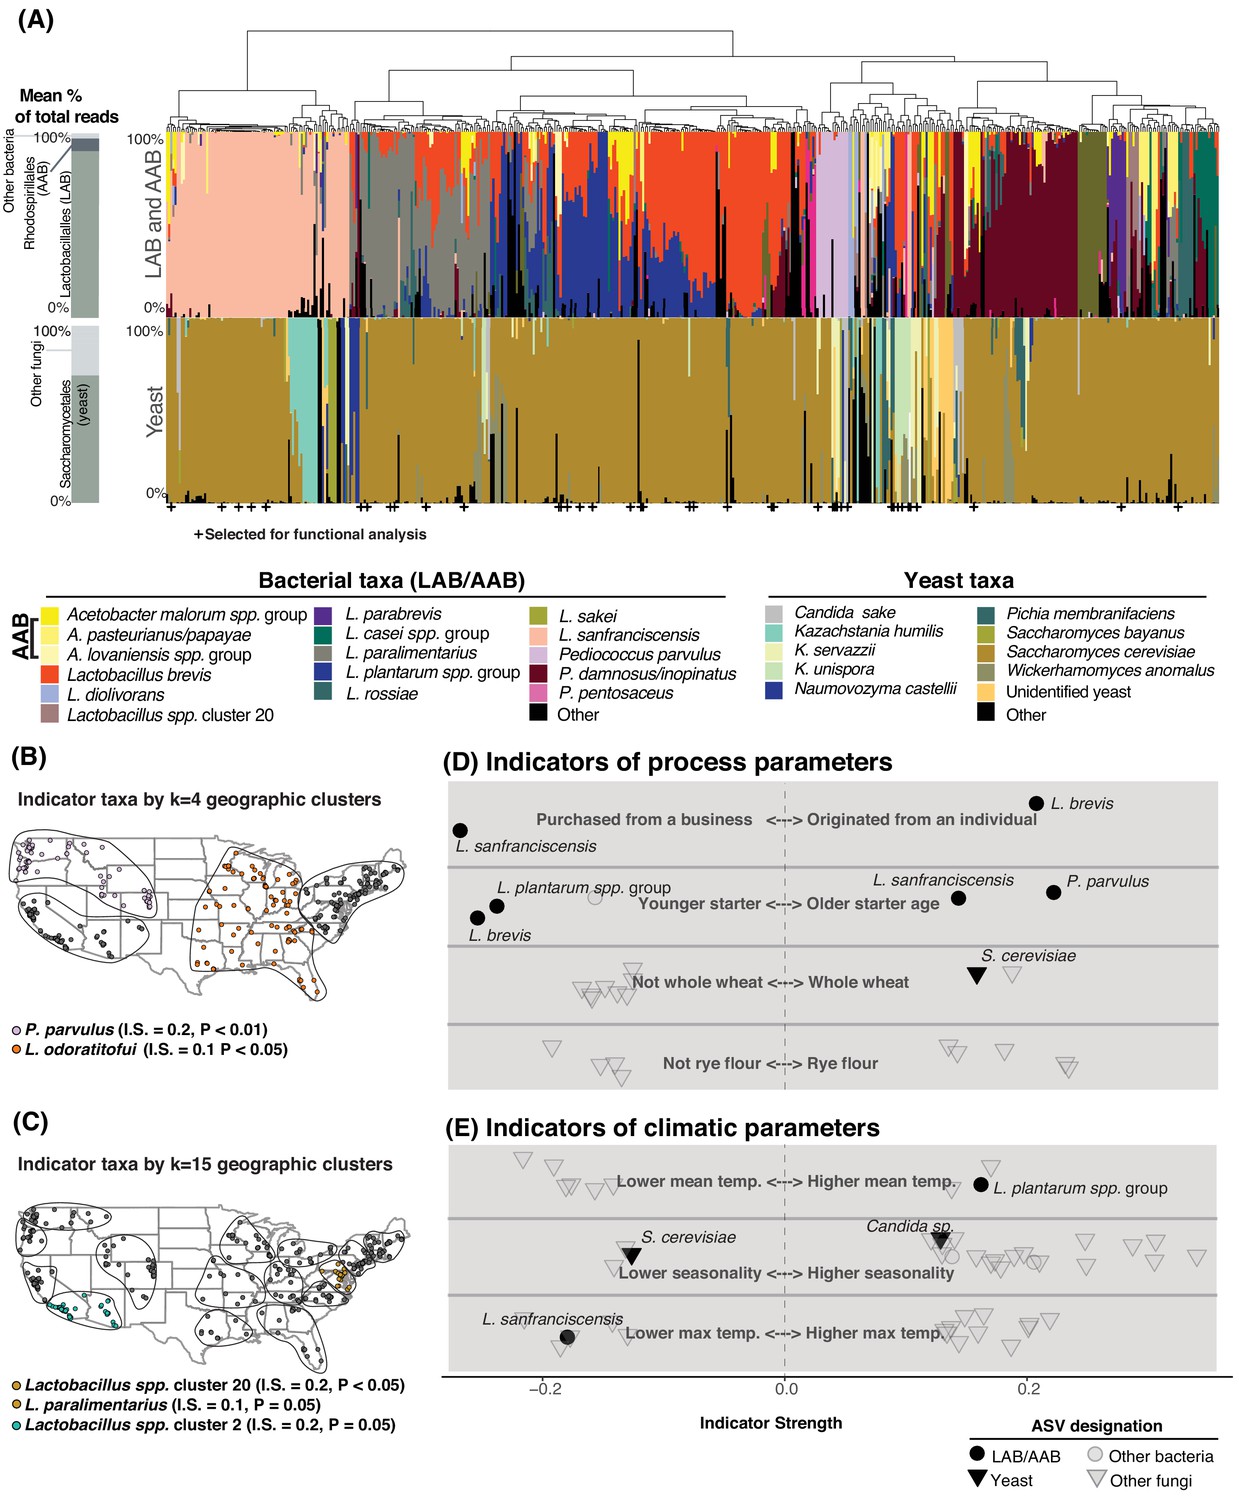
Process parameters and geography weakly predict the diversity of sourdough starters.
(A) Starters (n = 500) hierarchically clustered by Bray-Curtis dissimilarities. The stacked bar chart on the left shows the proportion of total reads across all samples belonging to the orders Rhodospirillales (AAB), Lactobacillales (LAB), and Saccharomycetales (yeast) (see Figure 2—source data 1, 2 for a complete list of these taxa). On the right, each column represents an individual sourdough starter. See Figure 2—source data 3 for co-occurrence analysis results. Below the barchart, + indicates samples selected for functional analysis (Figure 4). Continental U.S. geographic regions were clustered at two scales: k = 4 (B) and k = 15 (C). Dots represent individual samples. Each geographic cluster is encircled. Colored dots represent clusters where indicator taxa were significantly (p<0.05) associated with geographic clusters according to indicator species analysis. In (D) and (E), indicator strengths (Figure 2—source data 6) illustrate individual ASVs that are significantly associated with (D) process parameters including starter maintenance techniques and (E) climatic parameters. Each individual dot or triangle represents an individual ASV of bacterium or fungus, respectively.
-
Figure 2—source data 1
The most abundant bacterial and fungal taxa across the 500 sourdough starter samples that are not typically considered an active part of starter communities (e.g. excluding yeasts, lactic acid bacteria, and acetic acid bacteria).
- https://cdn.elifesciences.org/articles/61644/elife-61644-fig2-data1-v1.xlsx
-
Figure 2—source data 2
The most abundant yeast, lactic acid bacteria, and acetic acid bacteria species across the 500 sourdough starter samples.
- https://cdn.elifesciences.org/articles/61644/elife-61644-fig2-data2-v1.xlsx
-
Figure 2—source data 3
Co-occurrence statistics of sourdough yeasts and bacteria calculated with the R package ‘cooccur’.
- https://cdn.elifesciences.org/articles/61644/elife-61644-fig2-data3-v1.xlsx
-
Figure 2—source data 4
Predictors (n=33) included in PERMANOVA tests on bacterial and fungal dissimilarities.
- https://cdn.elifesciences.org/articles/61644/elife-61644-fig2-data4-v1.xlsx
-
Figure 2—source data 5
Abiotic properties are poor predictors of overall variation in both bacterial and fungal community composition across sourdough starters.
- https://cdn.elifesciences.org/articles/61644/elife-61644-fig2-data5-v1.xlsx
-
Figure 2—source data 6
Complete list of indicator taxa and summary statistics, as described in Figure 2.
- https://cdn.elifesciences.org/articles/61644/elife-61644-fig2-data6-v1.xlsx
Figure 2—figure supplement 1
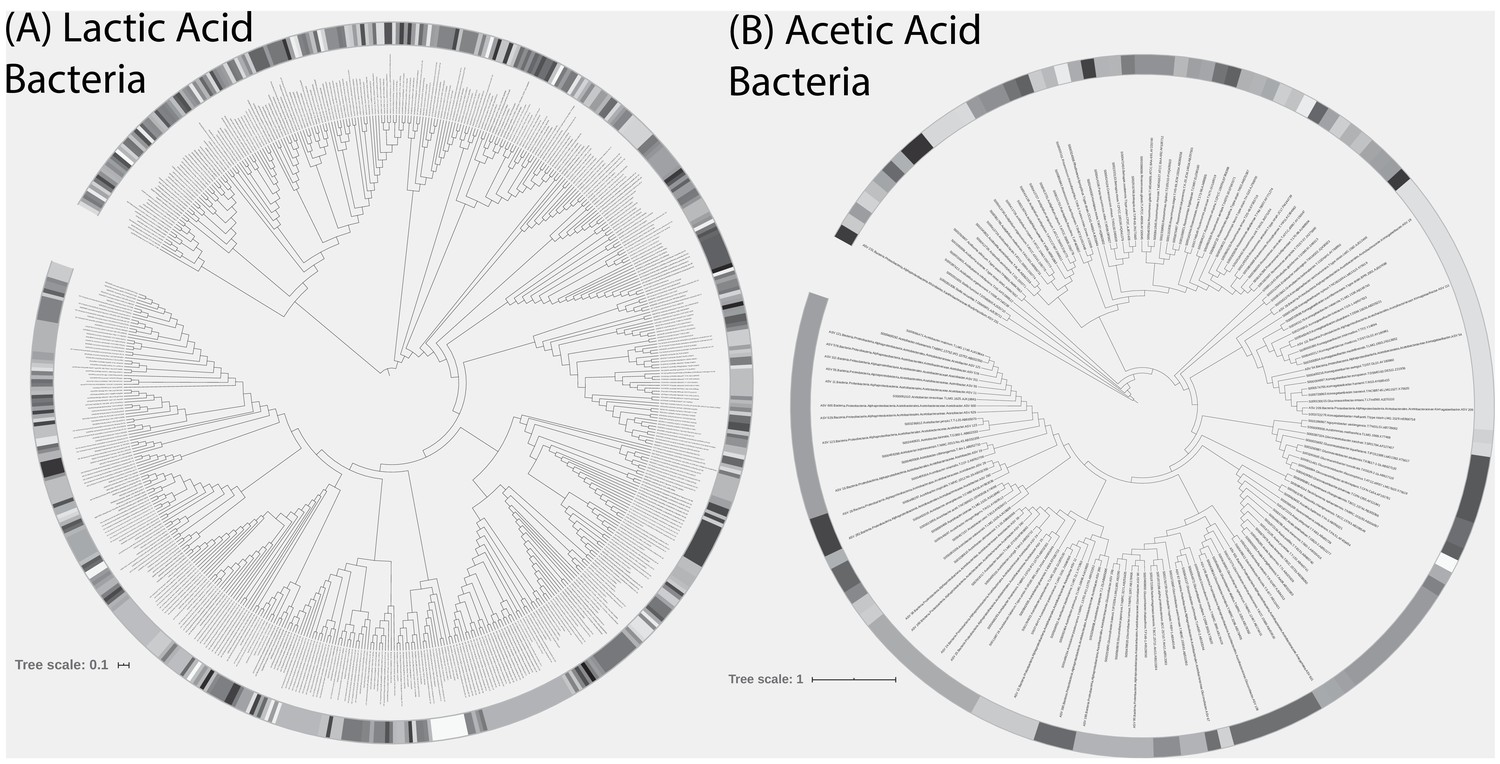
Phylogenetic trees of (A) lactic acid bacteria (LAB) and (B) acetic acid bacteria (AAB) detected in the 500 sourdough starters.
Also included in trees are LAB isolate strains (n = 4) used in pairwise competition experiments and reference strains of LAB and AAB from RDP. Shading indicates unique clades at ≥97% patristic similarity.
Figure 2—figure supplement 2
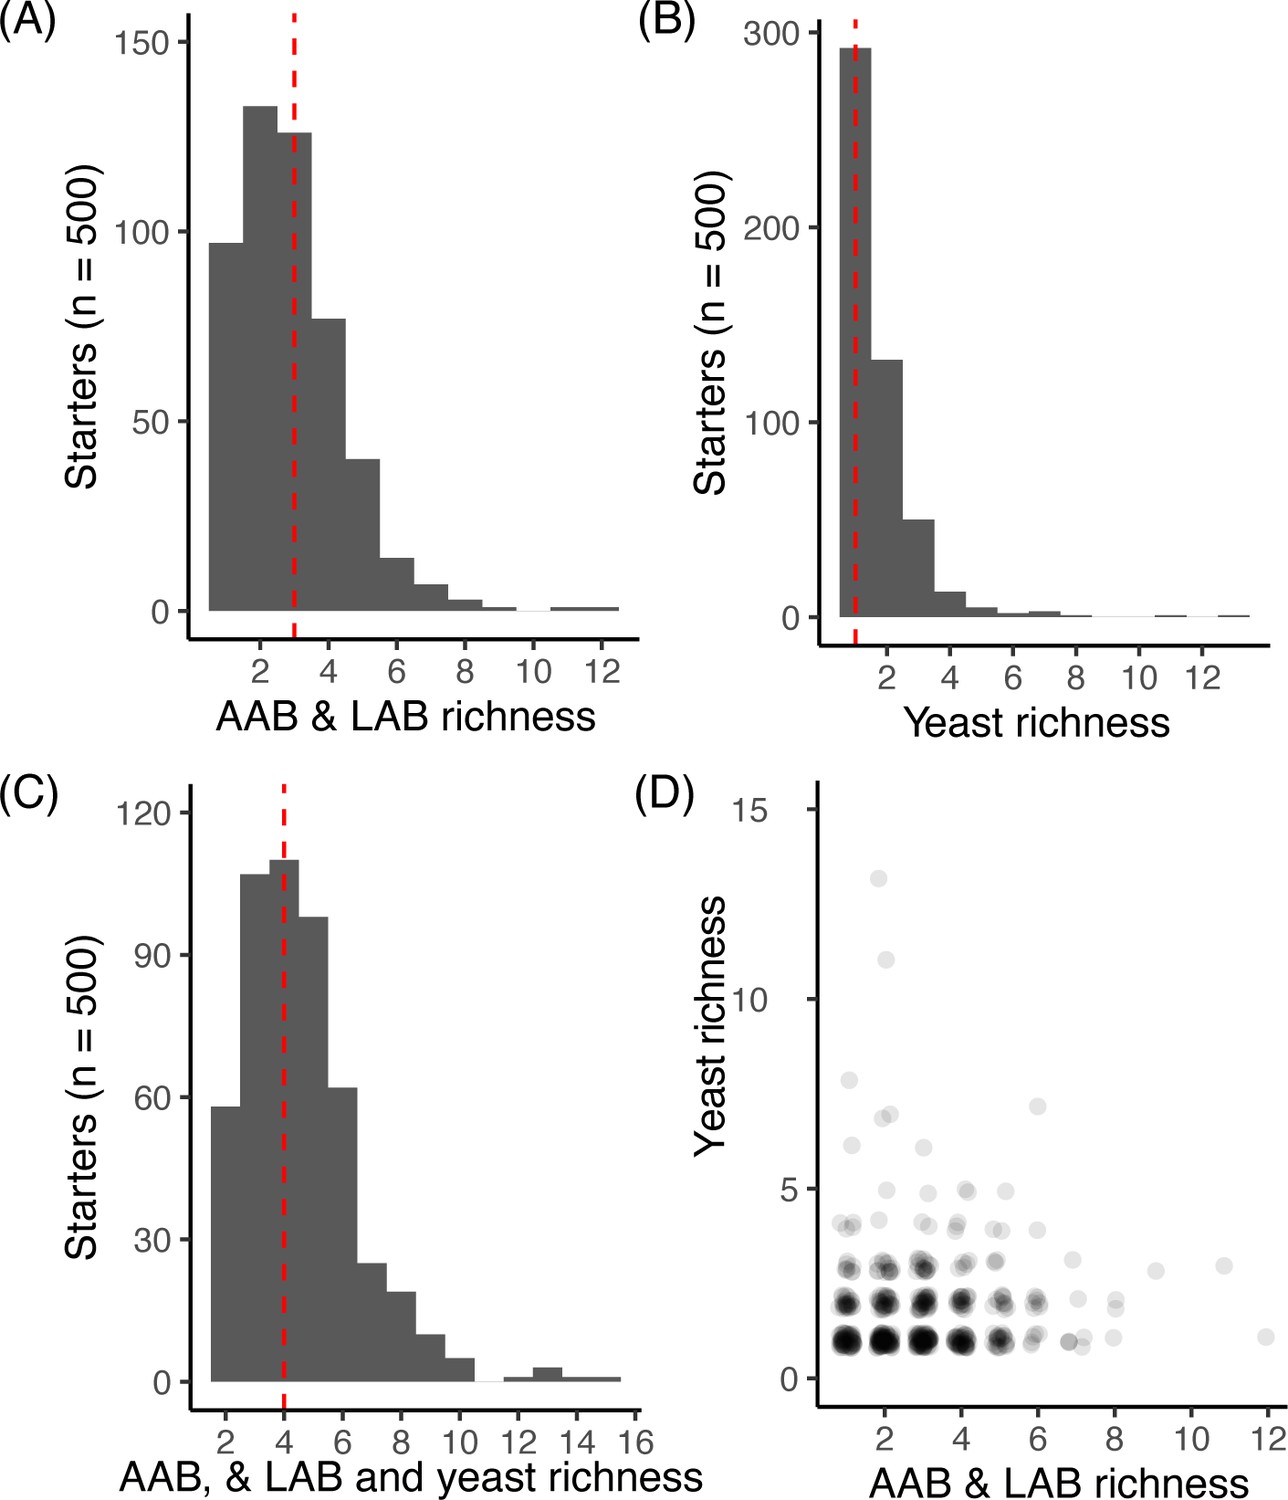
Richness across starter microbial communities.
For each starter (n = 500) the total number of ASVs for (A) bacteria including both LAB and AAB, (B) yeast, and (C) yeast, LAB, and AAB combined. For A-C, the dashed red line denotes the median richness. For each starter sample, (D) shows the number of LAB and AAB versus yeast detected. We did not detect a correlation between LAB/AAB and yeast richness across starters (Spearman’s rho = 0.04, p>0.05).
Figure 2—figure supplement 3
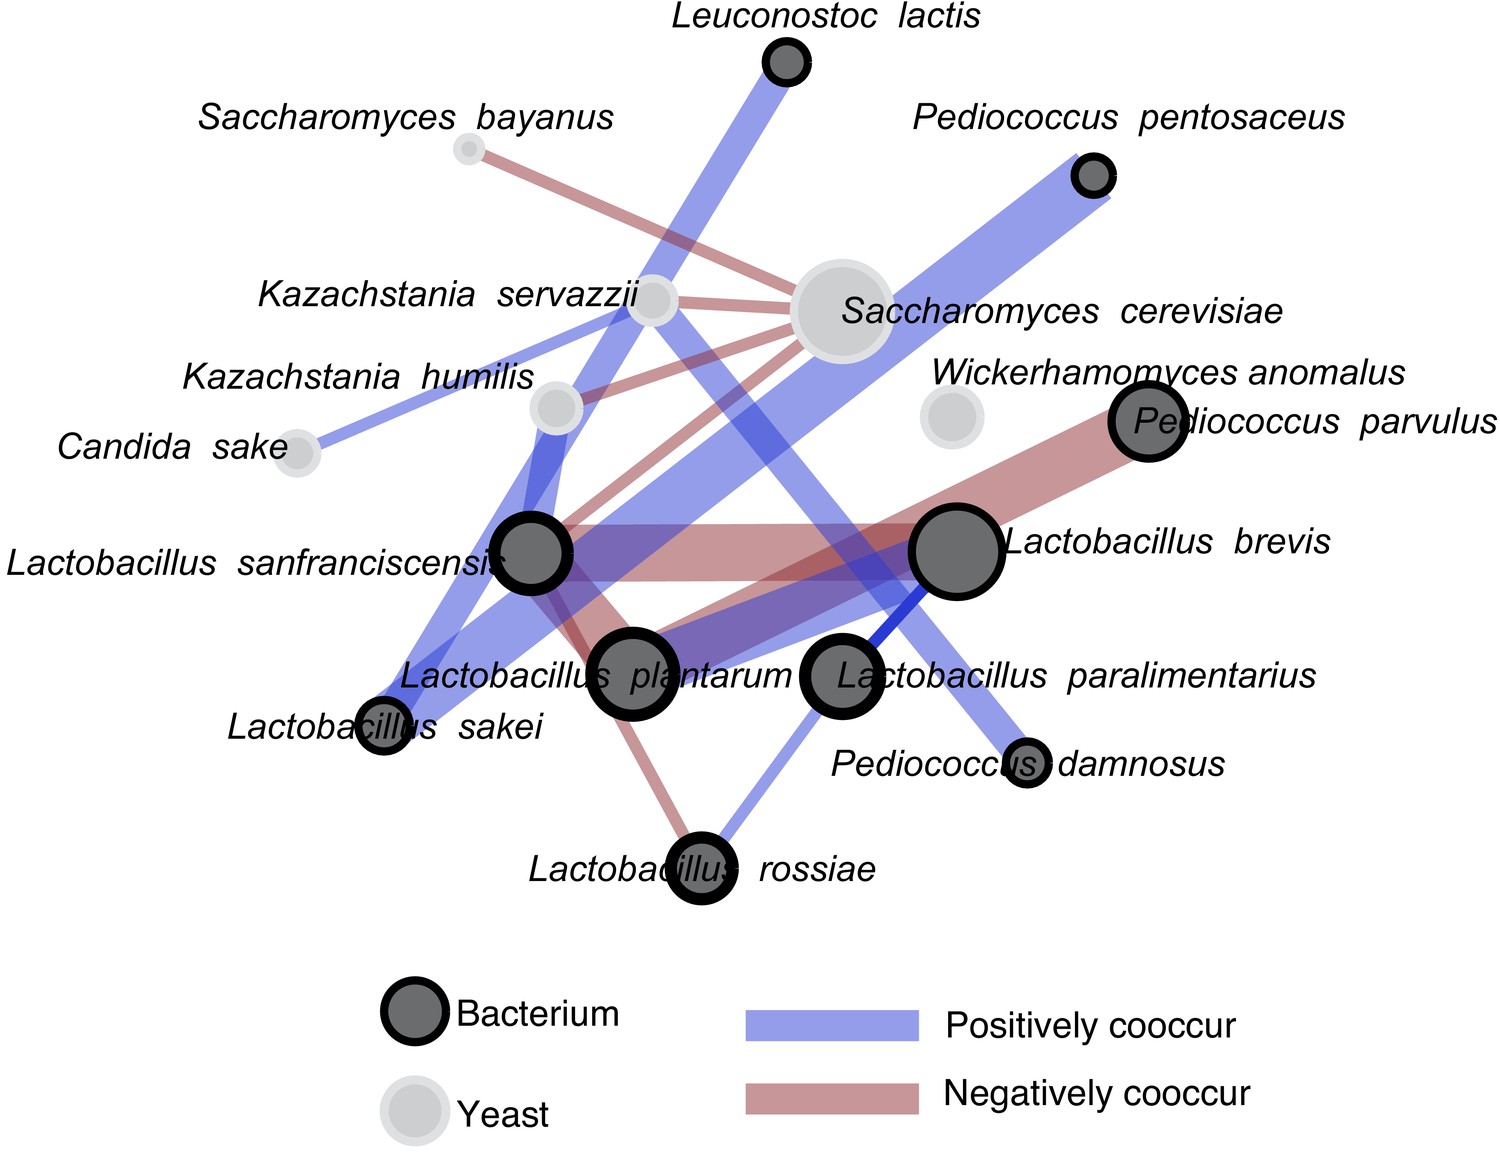
A co-occurrence analysis showing all significant associations.
Isolates used in synthetic pairwise interaction experiments are in the inner circle, and relative abundance (within yeast and within bacteria) is indicated by the splined size of circles. The Bonferroni-corrected significance of these associations is indicated by the edge (line) thickness. The thickest lines represent associations where p values are < 0.001. Lines of medium thickness indicate p<0.01, and the thinnest lines represent p<0.05. The species are organized by kingdom, with yeast on the top part of the figure and bacteria on the bottom. Of the 16 significant interactions we detected, 14 were within-kingdom and two are cross-kingdom interactions. All associations were calculated with the R package Cooccur.
Figure 2—figure supplement 4
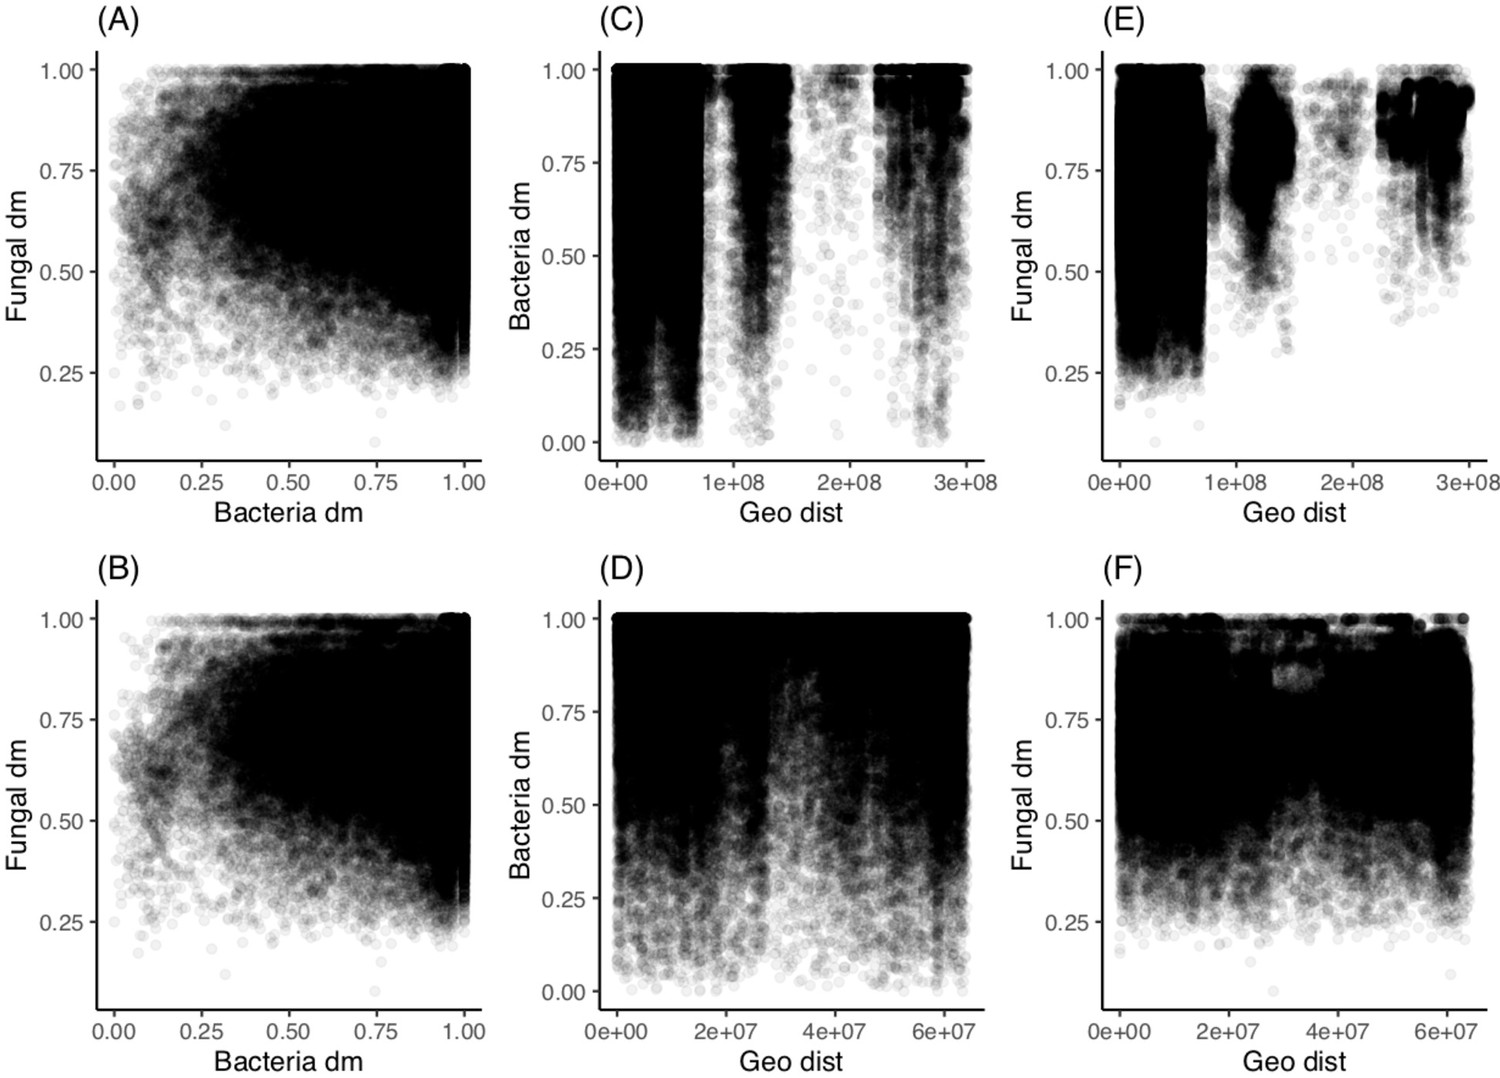
Geographic location is a weak predictor of fungal sourdough starter community and not a significant predictor of bacteria.
Pairwise comparisons of community dissimilarity (Bray-Curtis) and geographic distances with Mantel tests (Spearman rank correlations with 999 permutations). For each comparison, we compared both the whole dataset (n = 500) and the continental US only (n = 424). (A) Fungal versus bacterial community dissimilarity across all samples (rM = 0.04, p<0.05) and (B) across US (rM = 0.05, p<0.01). (C) Bacteria versus geographic distance with the whole dataset (rM 0.01, p>0.05) and (D) US only (rM = 0.01, p>0.05). (E) Fungi versus geographic distance with all data (rM = 0.23, p≤0.001) and (F) US only (rM 0.04, p≤0.001).
Figure 3 with 1 supplement
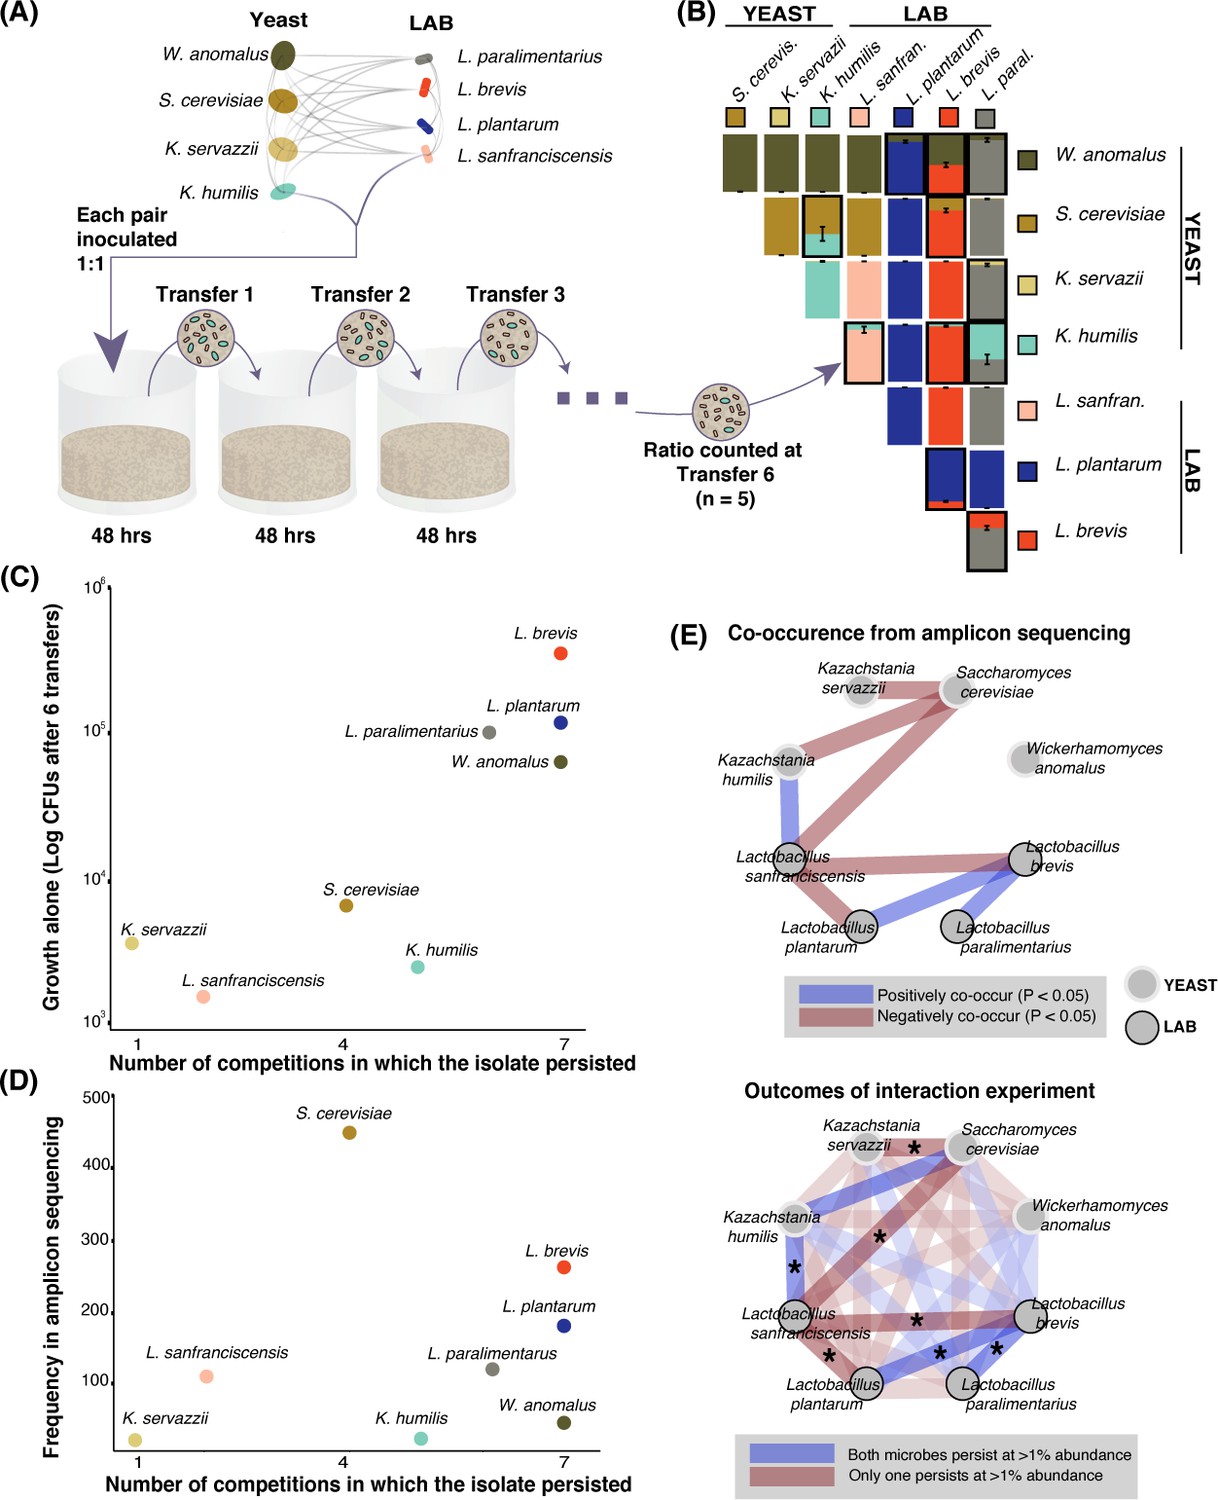
Growth rate and competitiveness fail to explain abundance patterns, but co-occurrence patterns in situ are recovered in pairwise coexistence experiments.
(A) All possible species 1:1 pairs were grown in 200 µL liquid flour media (n = 5) and 10 µL was serially transferred every 48 hr. This conceptual schematic follows one pairing, K. humilis and L. sanfranciscensis, to illustrate the experimental approach. (B) Mean relative abundance of pairs at the end of transfer six. Pairs where both isolates persisted (>1% relative abundance) at the end of the experiment are outlined; error bars are ± SE. For all replicates at transfers one, three, and six, see Figure 3—figure supplement 1. (C) Correlation between growth of individual isolates alone (CFUs of each isolate after six transfers) and a simple persistence index (the number of competitions where the isolate persisted) found a positive and significant relationship (detection limit of mean one percent abundance across replicates; Spearman’s ρ = 0.81, p=0.02). (D) Frequency of each taxon in the amplicon sequencing dataset and the number of competitions where that isolate persisted was positively associated, but not significant (Spearman’s ρ = 0.39, p=0.34). (E) Significant (Bonferroni-corrected p<0.05) patterns of co-occurrence between taxa in our amplicon sequencing (top) were replicated 7 of 8 times in our experimental manipulation (bottom). All pairwise experimental outcomes from transfer six are represented in the bottom part of the figure; the eight pairs that have significant co-occurrence associations are highlighted and the experimental outcomes that matched the co-occurrence data have an asterisk. Refer to Figure 2—figure supplement 3- Figure 2—source data 3 for all amplicon co-occurrence data.
-
Figure 3—source data 1
CFU counts and relative abundance data from competitions, transfers one, three, and six.
- https://cdn.elifesciences.org/articles/61644/elife-61644-fig3-data1-v1.xlsx
Figure 3—figure supplement 1
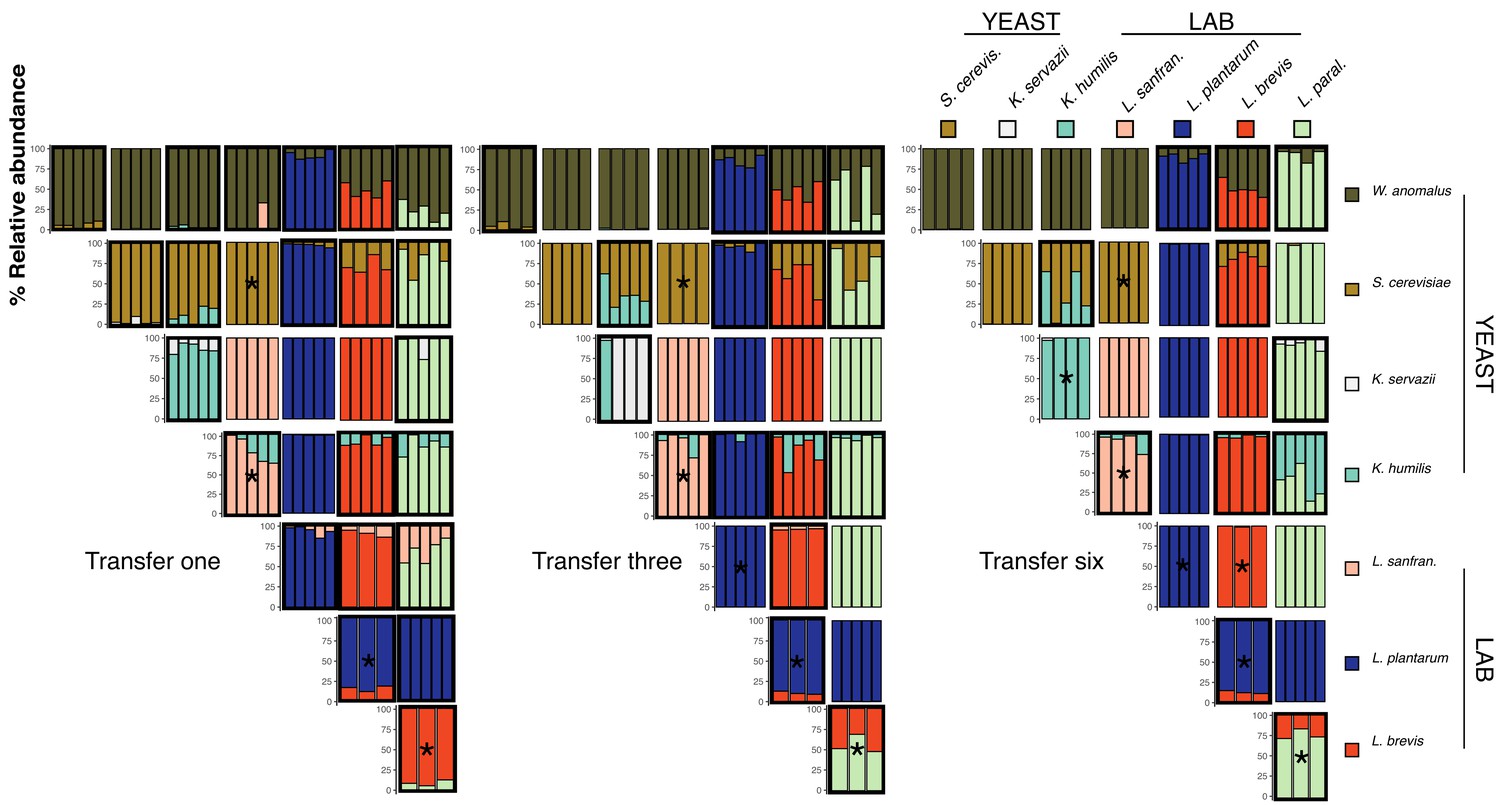
Pairwise competition experimental outcomes at transfers one, three, and six.
Pairs were inoculated at approximately equal densities and transferred every 48 hr. Percent relative abundance of all experimental pairs after each transfer are shown in each column. All replicates are represented. Pairs where both species persist (1% relative abundance detection limit) are outlined in black. Outcomes that were predicted by co-occurrence analysis in the amplicon sequencing (see Figure 2—figure supplement 3) have an asterisk.
Figure 4 with 3 supplements
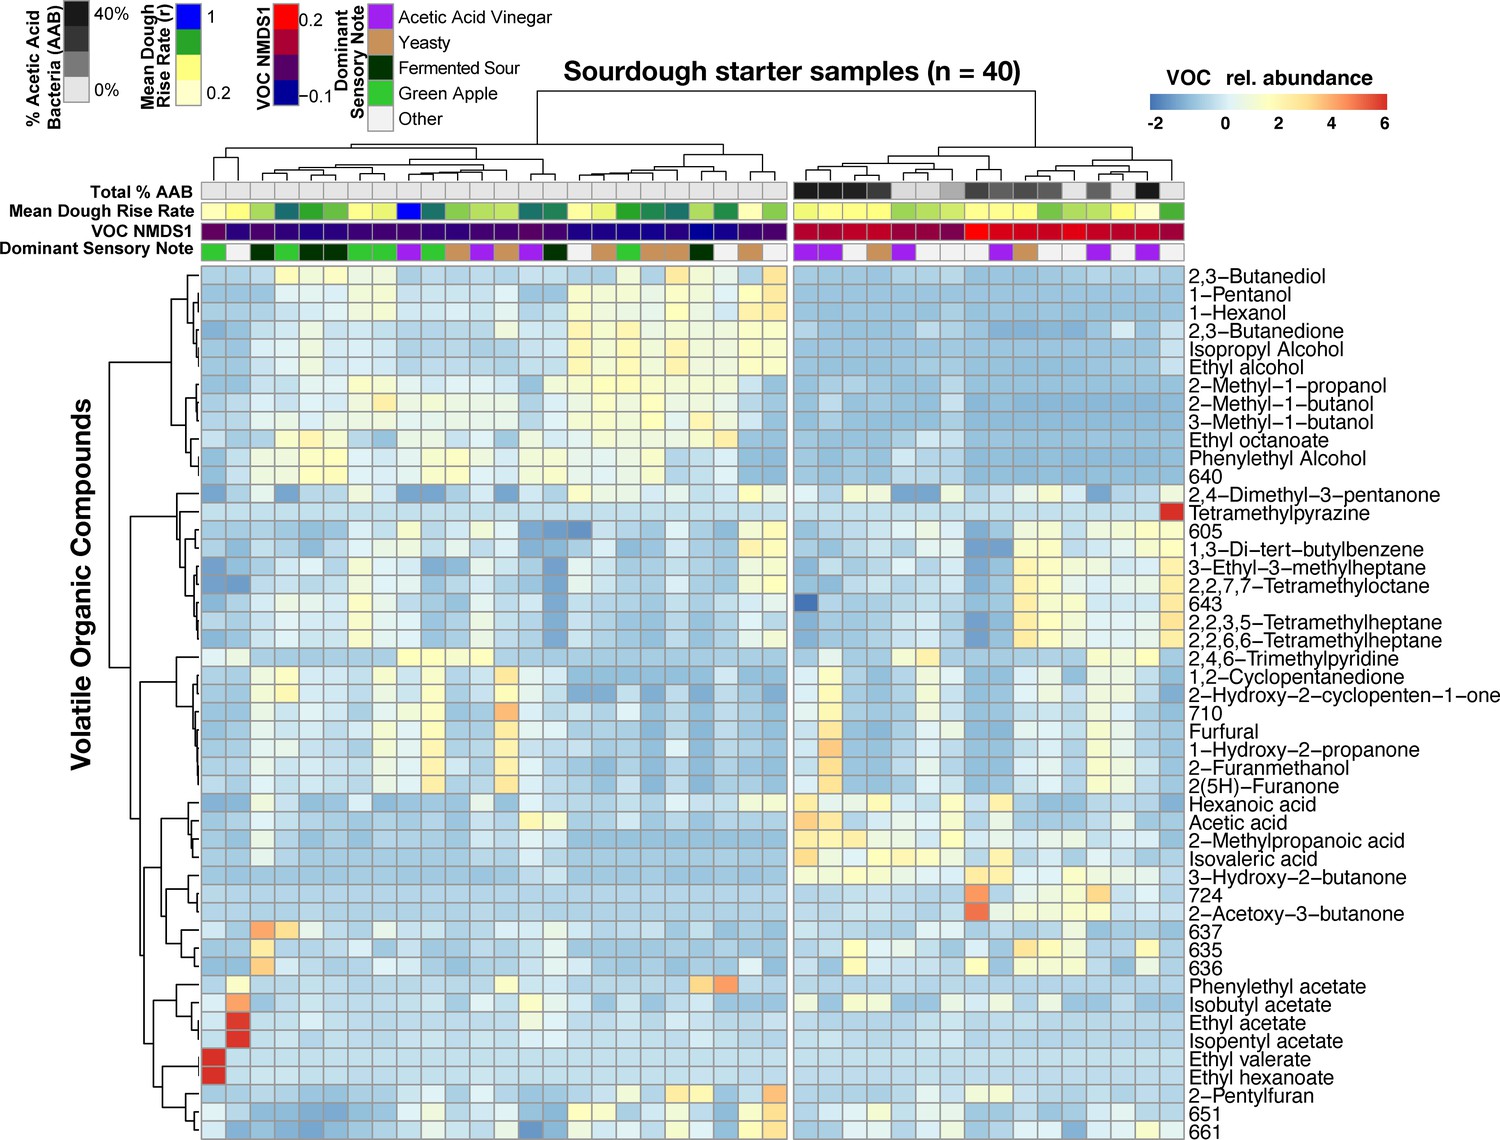
Acetic acid bacteria are drivers of sourdough starter functional diversity.
Heatmap shows the relative abundances of VOCs (z-scores) across samples. Columns represent the 40 starter samples clustered with Bray-Curtis dissimilarities of VOC profiles, resulting in two main clusters. Rows show the top 48 VOCs clustered by correlation similarity. Numbered VOCs are unknown compounds. Top rows indicate the total percentage of AAB and the three measured functional outputs. Functional outputs were all predicted by % AAB including: (1) mean dough rise rate (ρ = −0.51, p<0.001), (2) the overall VOC composition represented by the first NMDS axis (see Figure 4—figure supplement 1; Mantel ρ = 0.73, p<0.001) and (3) the dominant sensory note (adj. R2 = 37%, p<0.01, see Figure 4—source data 2 for all sensory notes).
-
Figure 4—source data 1
The relationships between microbial taxa (lactic acid bacteria, acetic acid bacteria, and yeast) and functional outputs.
- https://cdn.elifesciences.org/articles/61644/elife-61644-fig4-data1-v1.xlsx
-
Figure 4—source data 2
Complete list of sensory panel notes.
- https://cdn.elifesciences.org/articles/61644/elife-61644-fig4-data2-v1.xlsx
-
Figure 4—source data 3
Dough rise data over the course of 36 hours of rise.
- https://cdn.elifesciences.org/articles/61644/elife-61644-fig4-data3-v1.xlsx
-
Figure 4—source data 4
Volatile organic compound profiles collected for a subset of 40 starters.
- https://cdn.elifesciences.org/articles/61644/elife-61644-fig4-data4-v1.xlsx
Figure 4—figure supplement 1
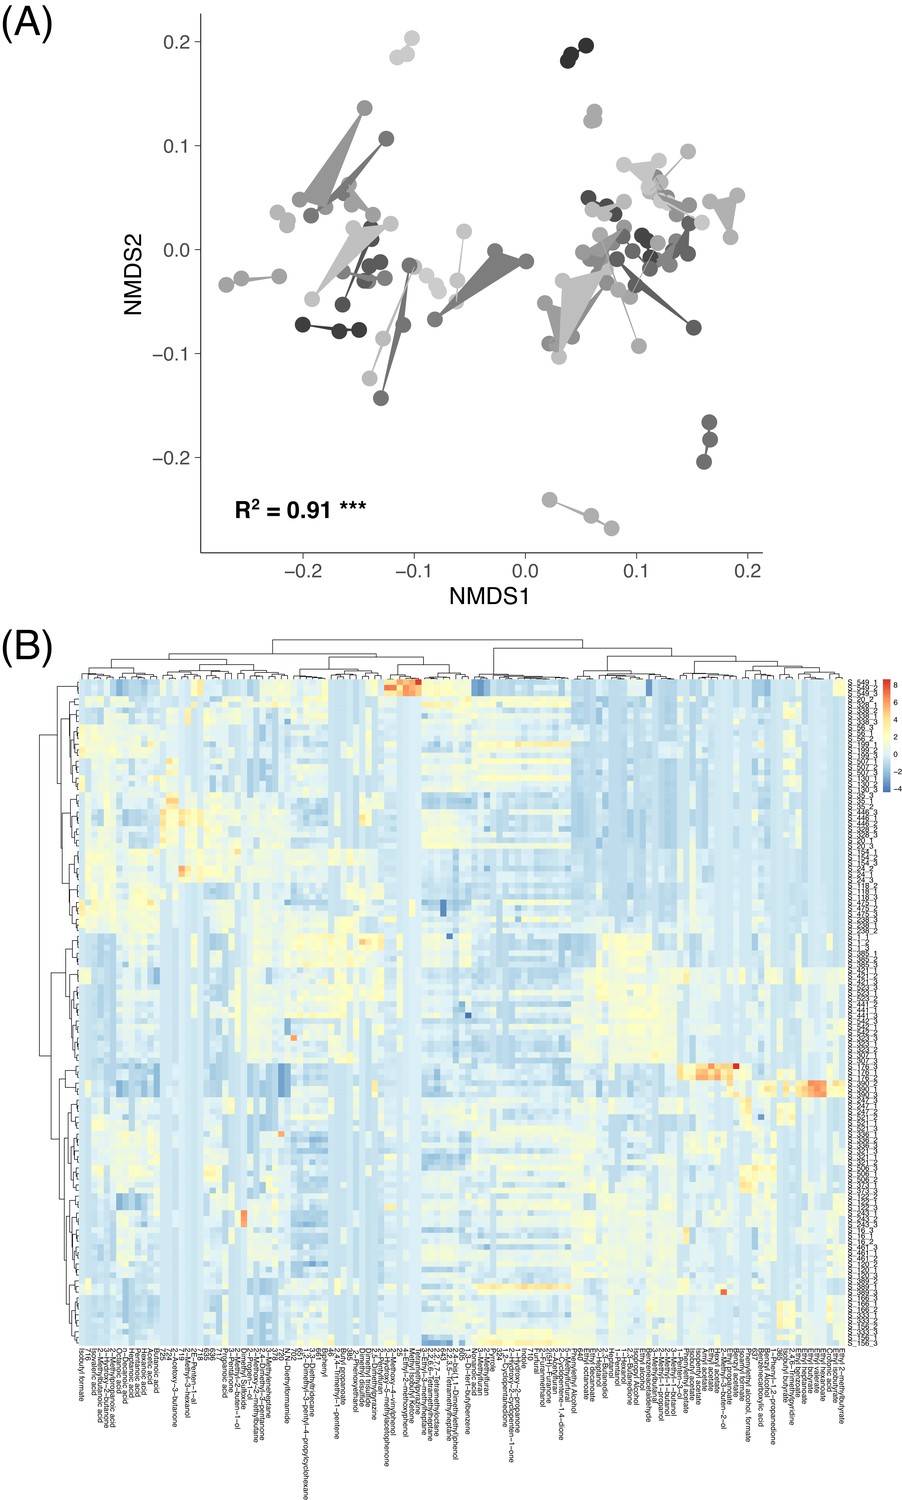
VOC data across replicate sourdough starters.
(A) The relationships between volatile organic compound (VOC) profiles represented by a non-metric multidimensional scaling ordination (NMDS). Shading and hulls indicate VOC community profiles from the same initial microbial inoculum. Starter inoculum explained most of the variation in VOC profiles (PERMANOVA R2 = 0.91 and p≤0.001). (B) A heatmap of all volatile organic compound (VOC) community profiles (n = 118) and compounds detected (n = 123 at≥0.0001 mean abundance). Colors indicate z scores. Rows represent individual sample replicates, and columns represent VOCs. Both rows and columns are clustered hierarchically with Bray-Curtis dissimilarities.
Figure 4—figure supplement 2
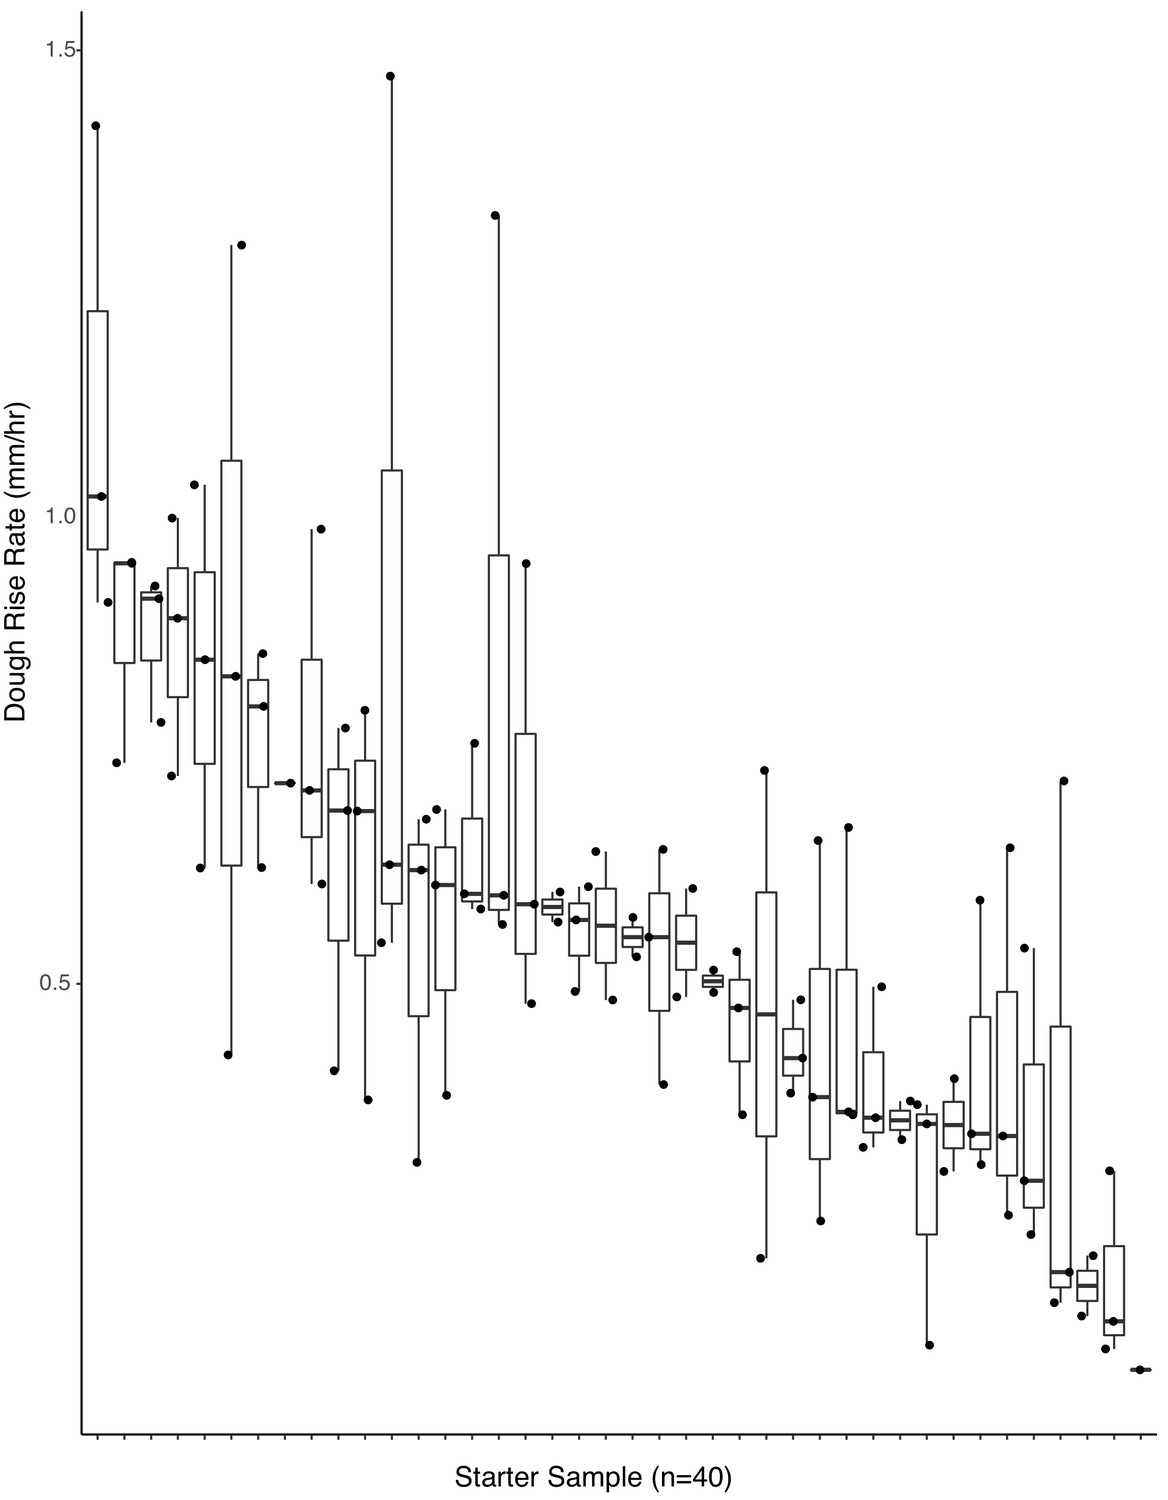
Dough rise rates are predicted by starting microbial inoculum (adj. R2 = 0.42, p<0.001).
Boxplots of starter inoculum (the 40 samples selected for functional analyses) by rate of dough rise (n = 107 samples included after quality filtering).
Figure 4—figure supplement 3
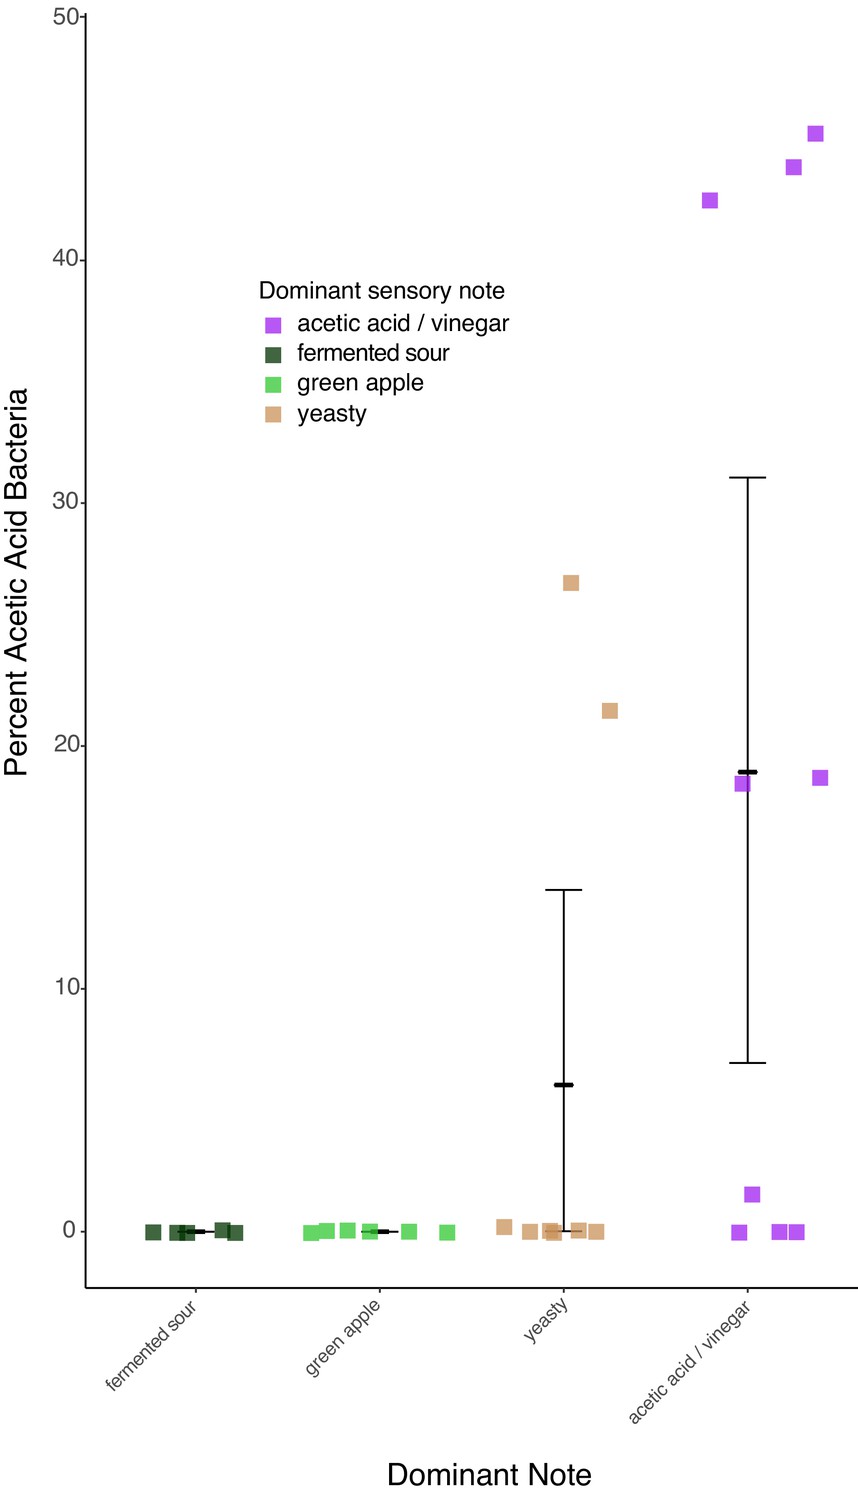
The four most frequently reported sensory notes from the 40 samples analyzed by an expert sensory panel.
Only notes that were reported more than five times are included in the analysis. Percent acetic acid bacteria correlated with differences in sensory notes, with acetic acid/vinegar versus fermented sour and green apple showing the strongest differences (Dunn test p=0.04 and 0.06 respectively).
Videos
Video 1
Dough rise analysis using a common garden sourdough starter approach.
Video shows the first of three batches of sterilized flour and water (n = 40, three replicates of each) that were inoculated with sourdough starters. Dough rise was measured by tracking the tops of each dough using video tracking software over the course of 36 hrs. Changes from the starting position were fitted with logistic growth curves using the R package GrowthCurver. Videos for each tube were trimmed if they fell to more than 5% of their maximum rise value. Dough rise rates ranged from 0.1 to 1.5 mm/hr. For scale, tubes are 103 mm tall with their caps. Doughs were removed part way through for placement of volatile organic compound collection bars which were present during hours 12–36. Video also available at: https://youtu.be/iK4lyRw2acA.
Tables
Key resources table
| Reagent type (species) or resource | Designation | Source or reference | Identifiers | Additional information |
|---|---|---|---|---|
| Commercial assay or kit | Powersoil | Qiagen | Cat No./ID: 47014 | |
| Sequence-based reagent | 515 f | Caporaso et al., 2011 | PCR primer | Forward primer used for amplifying bacterial DNA for amplicon sequencing |
| Sequence-based reagent | 806 r | Caporaso et al., 2011 | PCR primer | Reverse primer used for amplifying bacterial DNA for amplicon sequencing |
| Sequence-based reagent | ITS1f | Gardes and Bruns, 1993 | PCR primer | Forward primer used for amplifying fungal DNA for amplicon sequencing and Sanger sequencing |
| Sequence-based reagent | ITS2 | White et al., 1990 | PCR primer | Reverse primer used for amplifying fungal DNA for amplicon sequencing |
| Sequence-based reagent | ITS4 | White et al., 1990 | PCR primer | Reverse primer used for amplifying fungal DNA for Sanger sequencing |
| Sequence-based reagent | 27 f | Lane, 1991 | PCR primer | Forward primer used for amplifying bacterial DNA for amplicon sequencing and Sanger sequencing |
| Sequence-based reagent | 1492 r | Turner et al., 1999 | PCR primer | Reverse primer used for amplifying bacterial DNA for amplicon sequencing and Sanger sequencing |
| Software, algorithm | Dada2 | Callahan et al., 2016 | Software package for identifying amplicon sequence variants (ASVs) | |
| Software, algorithm | raxml-HPC | Stamatakis, 2014 | Phylogenetic tree builder for taxonomic assignments of ASVs | |
| Software, algorithm | Kaiju | Menzel et al., 2016 | Metagenomic taxonomy assignment software using unassembled reads | |
| Database | Refseq | https://www.ncbi.nlm.nih.gov/refseq/ | RRID:SCR_003496 | Database used with Kaiju for bacterial species assignments of metagenomic reads |
| Software, algorithm | R | R Core Team, 2019 | RRID:SCR_001905 | Used for statistical analyses |
| Software, algorithm | Matlab-based DLTdv-5 | Hedrick, 2008 | Used for video tracking of sourdough height for dough rise profiles | |
| Other | Twister PDMS stir bar | Gerstel | Collection medium for volatile organic compounds in functional assays | |
| Other | Lactobacilli MRS agar | Criterion | C5930 | Growth medium for the cultivation of lactic acid bacteria |
| Other | CHROMagar Candida | CHROMagar | CA222 | Differential growth medium; creates differential pigmentation and growth phenotypes for distinguishing yeast |
| Strain | Lactobacillus sanfranciscensis 17B2 | This paper | MW218985 | |
| Strain | Lactobacillus brevis 0092a | This paper | MW218986 | |
| Strain | Lactobacillus paralimentarius 0316d | This paper | MW218987 | |
| Strain | Lactobacillus plantarum 232 | This paper | MW218988 | |
| Strain | Saccharomyces cerevisiae 253 | This paper | MW219042 | |
| Strain | Wickerhamomyces anomalus 163 | This paper | MW219039 | |
| Strain | Kazachstania humilis 228 | This paper | MW219040 | |
| Strain | Kazachstania servazzii 177 | This paper | MW219041 |
Additional files
Download links
A two-part list of links to download the article, or parts of the article, in various formats.
Downloads (link to download the article as PDF)
Open citations (links to open the citations from this article in various online reference manager services)
Cite this article (links to download the citations from this article in formats compatible with various reference manager tools)
The diversity and function of sourdough starter microbiomes
eLife 10:e61644.
https://doi.org/10.7554/eLife.61644


