Cerebellar and vestibular nuclear synapses in the inferior olive have distinct release kinetics and neurotransmitters
- Department of Neurobiology, Harvard Medical School, United States
Figures
Figure 1 with 2 supplements

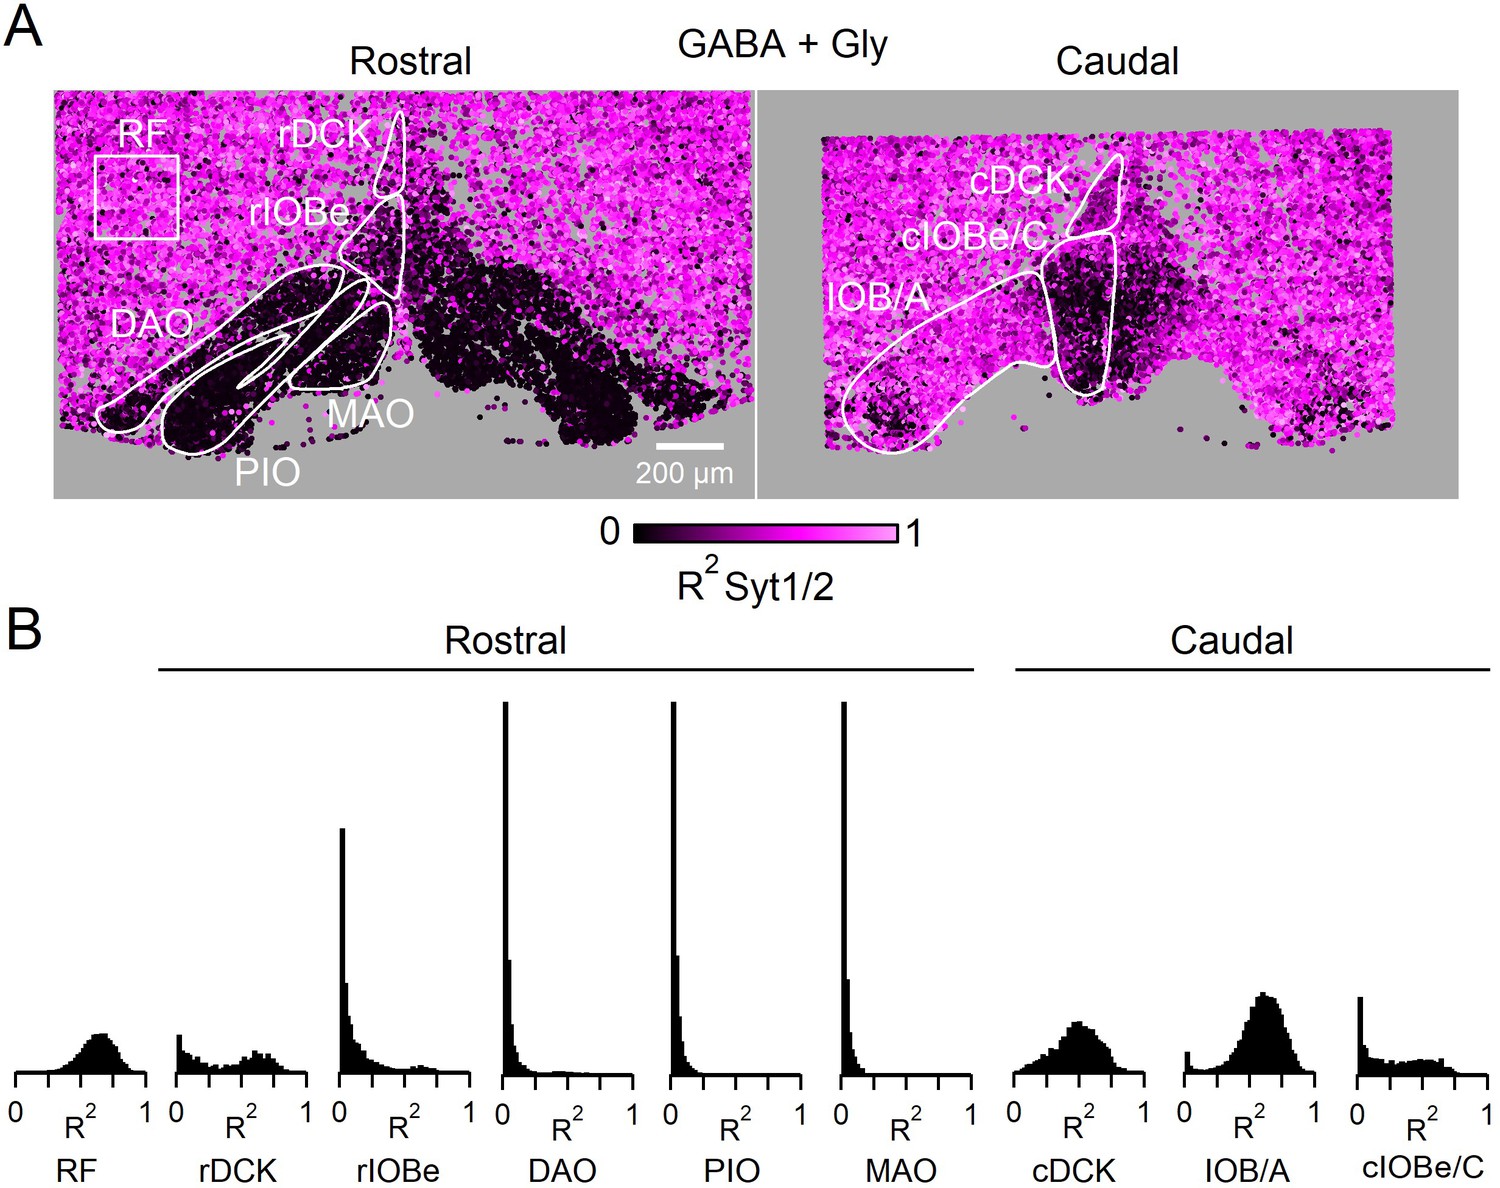
Syt1/2 is expressed at glycinergic synapses and absent from exclusively GABAergic inputs to the IO.
(A) Summary of time course of the IPSC decay for the GABAergic component for different regions of the IO (from Turecek and Regehr, 2019). Abbreviations are defined in Figure 7. (B) Low-magnification of coronal sections of the IO immunolabeled for Vgat (green, left) to mark GABAergic and glycinergic inputs in a GlyT2Cre; R26LSL-synaptophysin-TdT (Ai34) mouse, Synaptophysin TdT labeled glycinergic boutons (cyan, middle), and immunostaining labeled Syt1/2 (magenta, right). Images are of the rostral (top) and caudal (bottom) IO. Scale bar is 200 µm. (C) High-magnification single plane images of inhibitory boutons from each subnucleus of the IO and the surrounding reticular formation (RF). From top to bottom: Vgat (green), Synaptophysin TdT in glycinergic boutons (cyan), Syt1/2 (purple), and a combined image of Vgat and Syt1/2. The lower three panels show analysis of each identified bouton. Boutons are color-coded for the degree of signal correlation of Vgat and Syt1/2 (R2). Boutons are separated into Vgat-positive (top), glycinergic boutons (GlyT2+, middle), and non-glycinergic Vgat-positive boutons (GlyT2-, bottom). Scale bar is 1 µm. (D) Distribution of R2 for all boutons in identified regions of the IO for glycinergic (top) and GABAergic synapses (bottom). (E) Signal correlation (R2) of Vgat and Syt1/2 for all identified Vgat-positive boutons (left), for glycinergic boutons expressing TdT and Vgat (middle), and for exclusively GABAergic synapses expressing Vgat but not TdT (right).
-
Figure 1—source data 1
Syt1/2 is expressed at glycinergic synapses and absent from exclusively GABAergic inputs to the IO.
- https://cdn.elifesciences.org/articles/61672/elife-61672-fig1-data1-v1.xlsx
Figure 1—figure supplement 1
The presence of Syt1/2 at all Vgat-positive boutons (TdT+ and TdT−) in the ventral brainstem.
(A) Coronal view of the ventral brainstem showing Syt1/2 expression at all inhibitory boutons. Each marker is a Vgat-positive bouton color coded for signal correlation between Vgat and Syt1/2 (R2). Outlines of IO subnuclei and a sample region of the surrounding reticular formation were used for analysis. (B) Distribution of R2 for all subnuclei of the IO for all Vgat-positive boutons (TdT+ and TdT−), and for the RF.
Figure 1—figure supplement 2
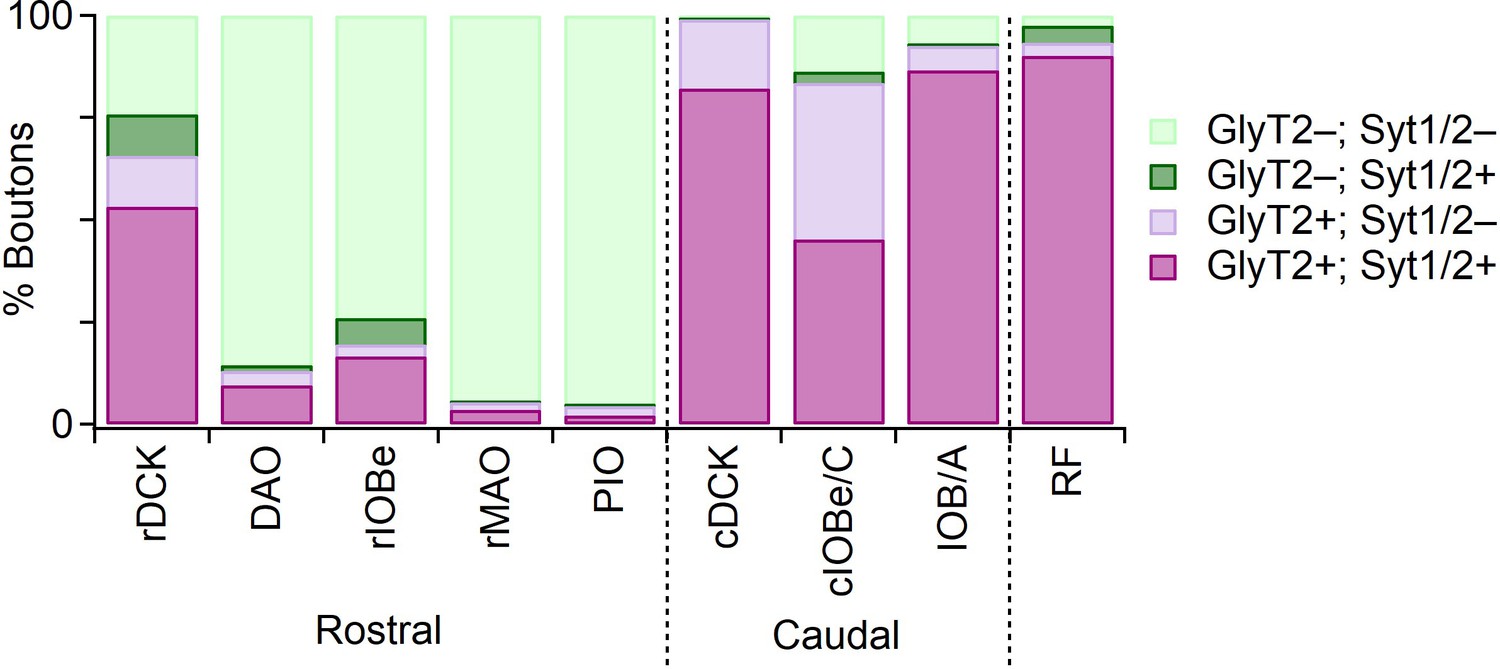
Distribution of GlyT2 and Syt1/2 in Vgat-positive boutons in IO subnuclei.
Figure 2 with 1 supplement
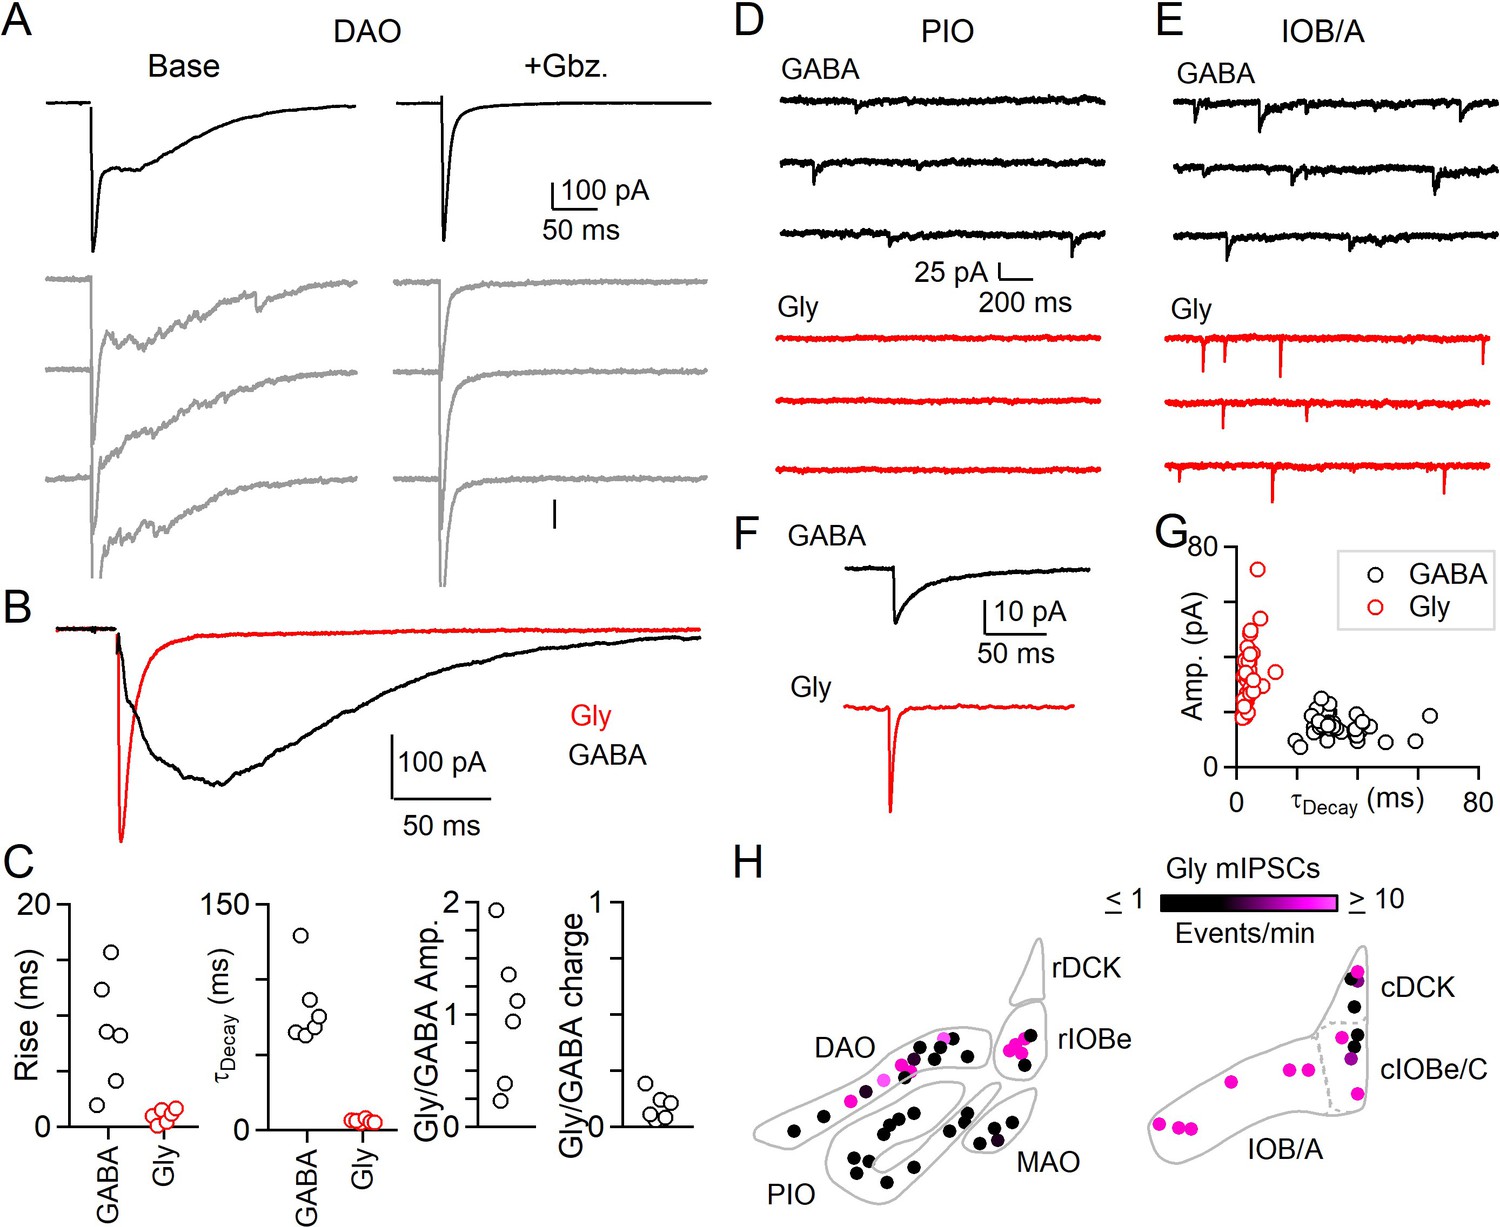
Evoked and spontaneous glycinergic input to the IO.
(A) Electrically evoked IPSCs in the DAO with average (top, black) and individual trials (gray), before (left) and after washing of Gbz. (right). (B) Average Gbz.-sensitive IPSC (GABA, black) and strychnine-sensitive IPSC (Gly, red) for cell in A. (C) Properties of GABA and glycine components of evoked release in the DAO, showing the rise and decay kinetics (left) and ratios of glycine and GABA evoked amplitude and charge (right). Markers are individual cells. (D) Top: Example of mIPSCs in a PIO neuron recorded in the presence of strychnine (left). Bottom: Same as in top, but for a different PIO neuron recorded in the presence of Gbz. No events were detected over the course of 10 min. (E) Same as in D, but for two cells in the IOB/A subnuclei. F: Average mIPSCs for cells in E. (G) Plot of amplitude vs. decay time for averaged mIPSCs of all cells across the IO. Each marker is a cell. (H) Color-coded map of glycinergic mIPSC frequencies for all recorded cells in the rostral (left) and caudal (right) IO. Markers are individual cells.
-
Figure 2—source data 1
Evoked and spontaneous glycinergic input to the IO.
- https://cdn.elifesciences.org/articles/61672/elife-61672-fig2-data1-v1.xlsx
Figure 2—figure supplement 1
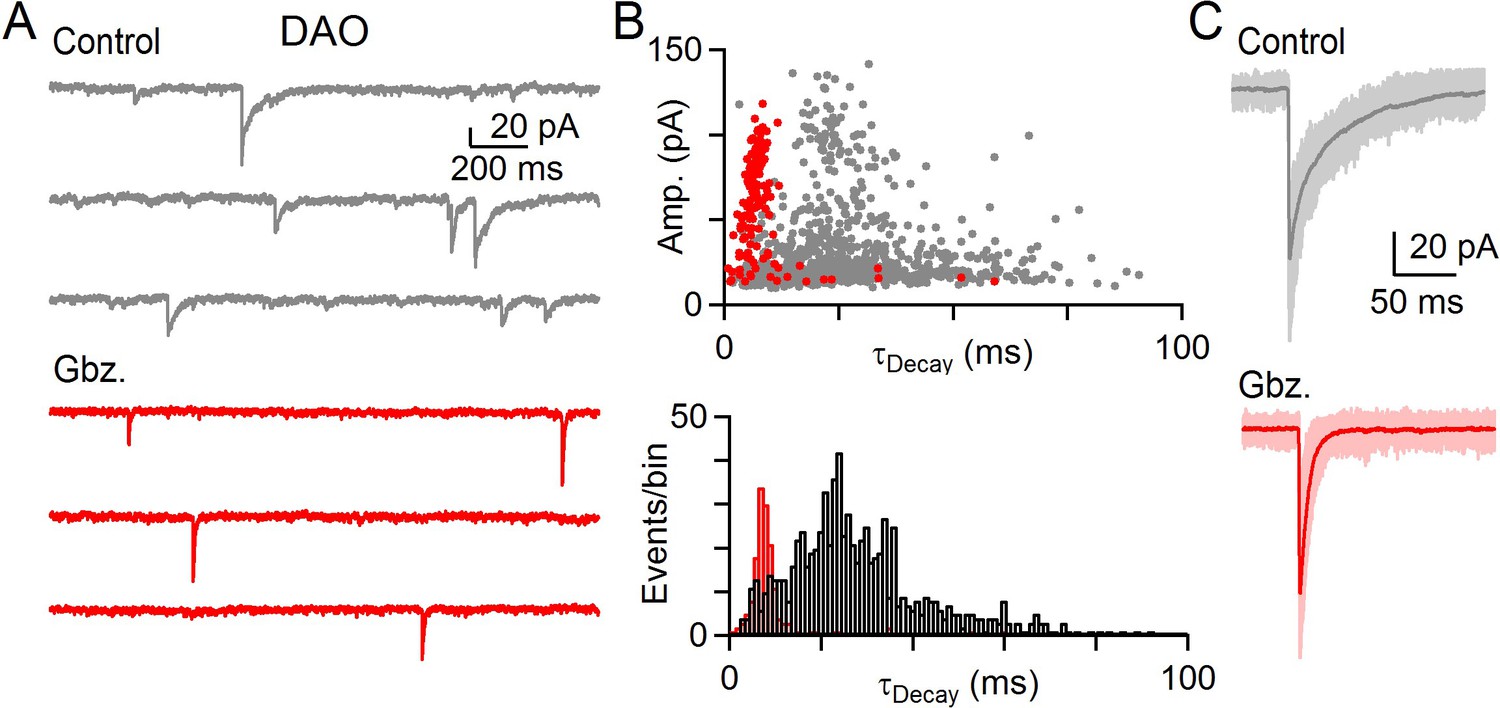
GABA and glycine can be co-released in the IO.
(A) Example of mIPSCs in a DAO cell before (gray) and after washing of Gbz. (red). (B) Top: Amplitude of all events in baseline (gray) and in the presence of Gbz. (red) plotted against their decay time for ten minutes of recording in each condition for cell shown in A. Bottom: Histogram of mIPSC decay time for all events in baseline (black) and in the presence of Gbz. (red). (C) Large amplitude mIPSCs with individual events (light) and average event (dark) before (gray, top) and after wash in of Gbz. (bottom, red) for the cell shown in A and B.
Figure 3
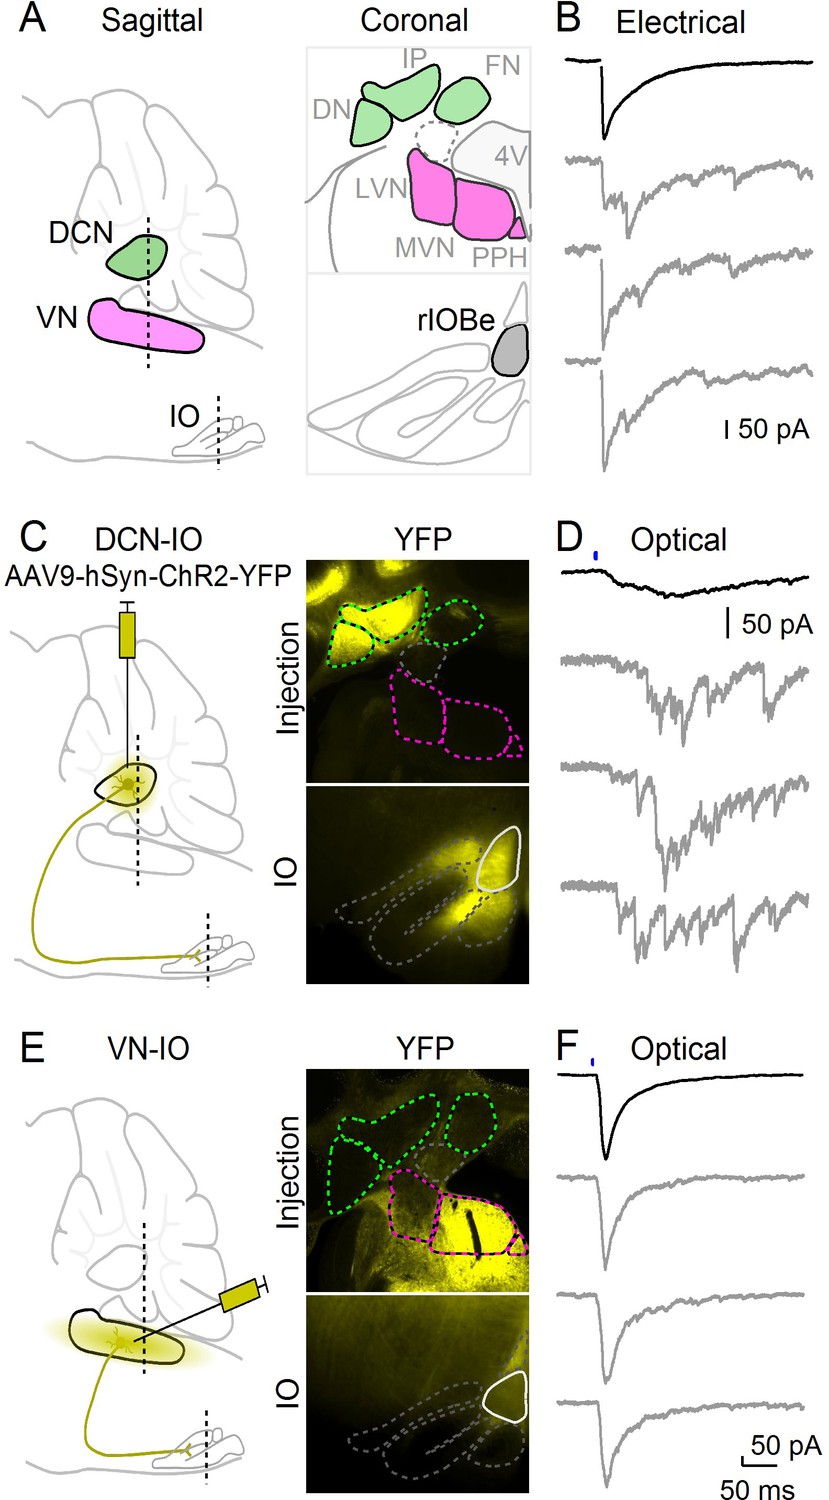
Optical isolation of cerebellar and vestibular sources of inhibition to the IO.
(A) Sagittal view of the cerebellum and brainstem showing the locations of the DCN, VN and IO (left). Dashed lines indicate the coronal planes of insets showing the DCN and VN (top right) and IO (bottom right). Abbreviations are defined in Figure 7. (B) Electrically evoked IPSCs showing mixed synchronous and asynchronous release from a cell in the rIOBe, with average IPSC (black, top) and individual trials (gray, bottom). (C) Sagittal view of strategy for expressing ChR2-YFP in the DCN (left), with example injection site expressing ChR2-YFP in the DCN but not VN in coronal sections (top right). YFP-labeled projections are visible in the IO. (D) Optically-evoked IPSCs in the rIOBe from DCN injection shown in C. (E) Injection strategy for labeling of the VN (left). The injection pipette was angled to avoid the DCN. Example injection of the VN (top right) produced labeling in the IO and surrounding brainstem (bottom right). F: Optically-evoked IPSCs in the rIOBe from VN injection shown in E.
Figure 4 with 1 supplement
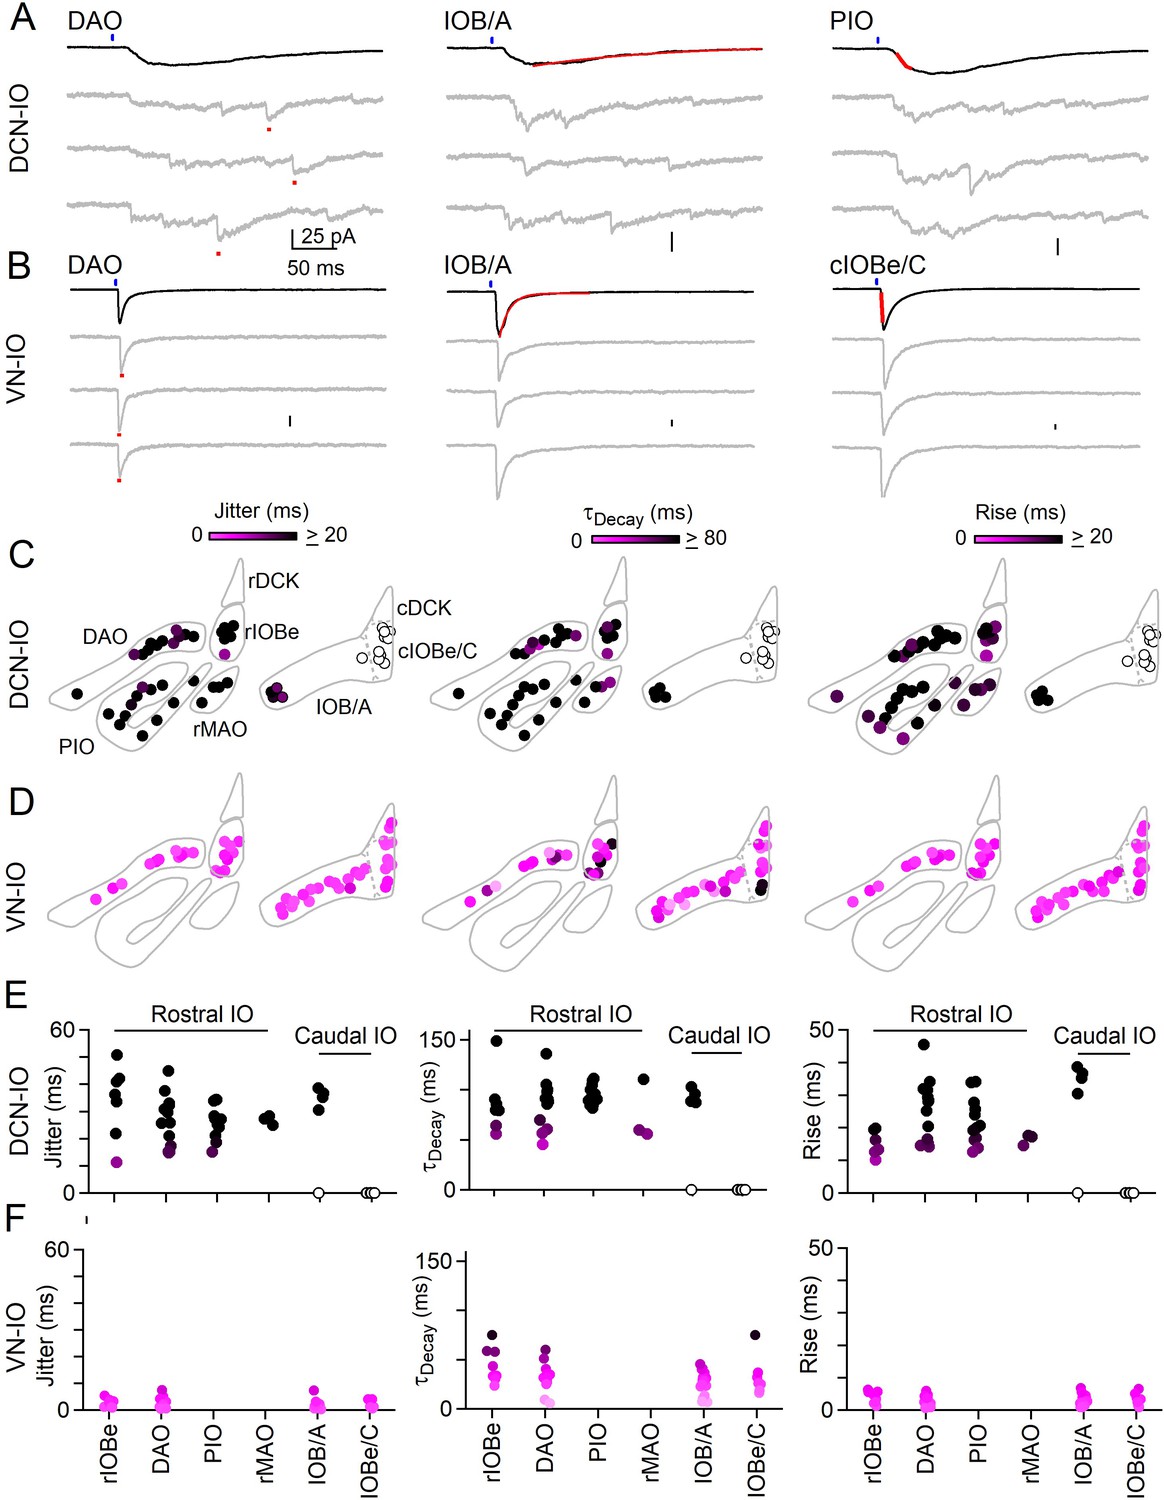
Synchronous and asynchronous inhibition arise from distinct presynaptic sources.
(A) Light-evoked response for DCN inputs to the indicated regions with average responses (black) and individual trials (gray). Measurements of jitter, decay and rise time shown in red. (B) Same as A but for VN inputs. (C) Spatial plots of the jitter (left), decay time (middle) and rise time (right) of optically-evoked inhibitory input from the DCN for all recorded IO neurons. (D) Same as C but for inputs from VN. (E) Summary of jitter (left), decay time (middle) and rise time (right) for each region for inputs from the DCN. (F) Same as E but for inputs from the VN.
-
Figure 4—source data 1
Synchronous and asynchronous inhibition arise from distinct presynaptic sources.
- https://cdn.elifesciences.org/articles/61672/elife-61672-fig4-data1-v1.xlsx
Figure 4—figure supplement 1
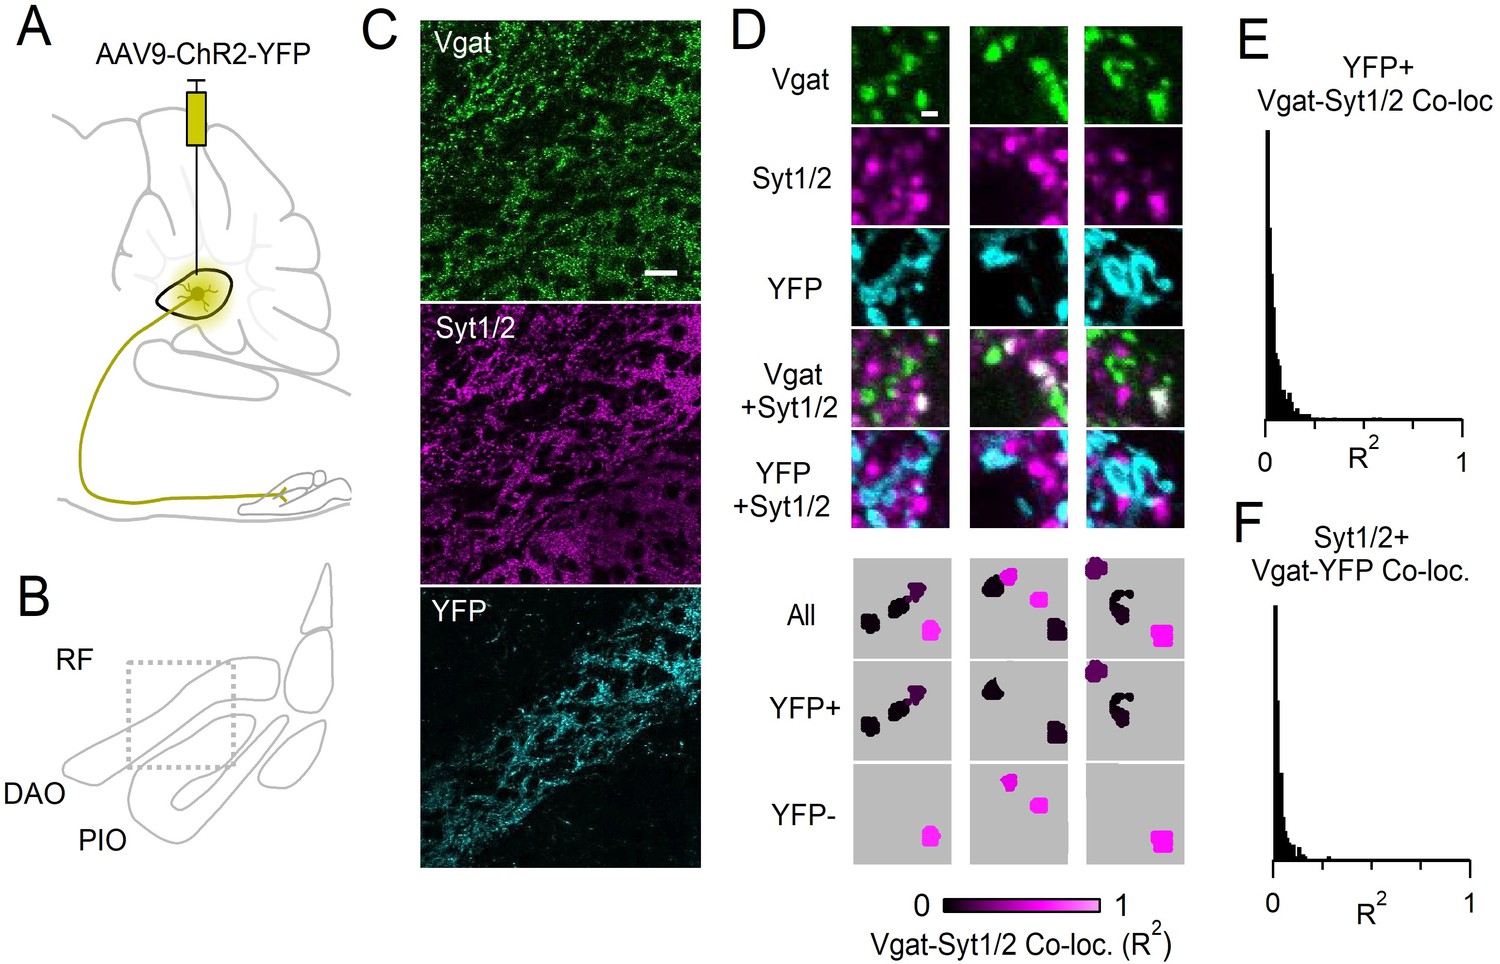
Boutons originating from the DCN lack Syt1/2.
(A) Sagittal view of the brainstem and cerebellum. AAV9-hSyn-ChR2-YFP was injected into the interposed nuclei of the DCN. (B) Coronal view of the IO showing locations of DAO, PIO and surrounding RF. Box indicates anatomical location of data shown in C. (C) Immunostaining of Vgat (top, green), Syt1/2 (middle, magenta), and YFP (bottom, cyan). Terminals originating in the DCN terminated in the DAO and were labeled with YFP. Scale bar is 20 µm. (D) High magnification single-plane images of boutons immunostained for Vgat (green), or Syt1/2 (magenta), and fluorescence of YFP (cyan). Bottom panels show analyzed images with identified Vgat-positive boutons that are color-coded for their degree of co-localization with Syt1/2 (R2). Scale bar is 1 µm. (E) Distribution of co-localization values (R2) between Vgat and Syt1/2 for all YFP-positive boutons identified in the DAO in the field of view shown in C. 98% of YFP-positive Vgat boutons were not co-localized with Syt1/2 (R2 <0.2). (F) Distribution of co-localization values (R2) between Vgat and YFP for all Syt1/2-positive boutons in the DAO from the field of view in C. 97% of Syt1/2-positive Vgat boutons were not co-localized with YFP.
-
Figure 4—figure supplement 1—source data 1
- https://cdn.elifesciences.org/articles/61672/elife-61672-fig4-figsupp1-data1-v1.xlsx
Figure 5
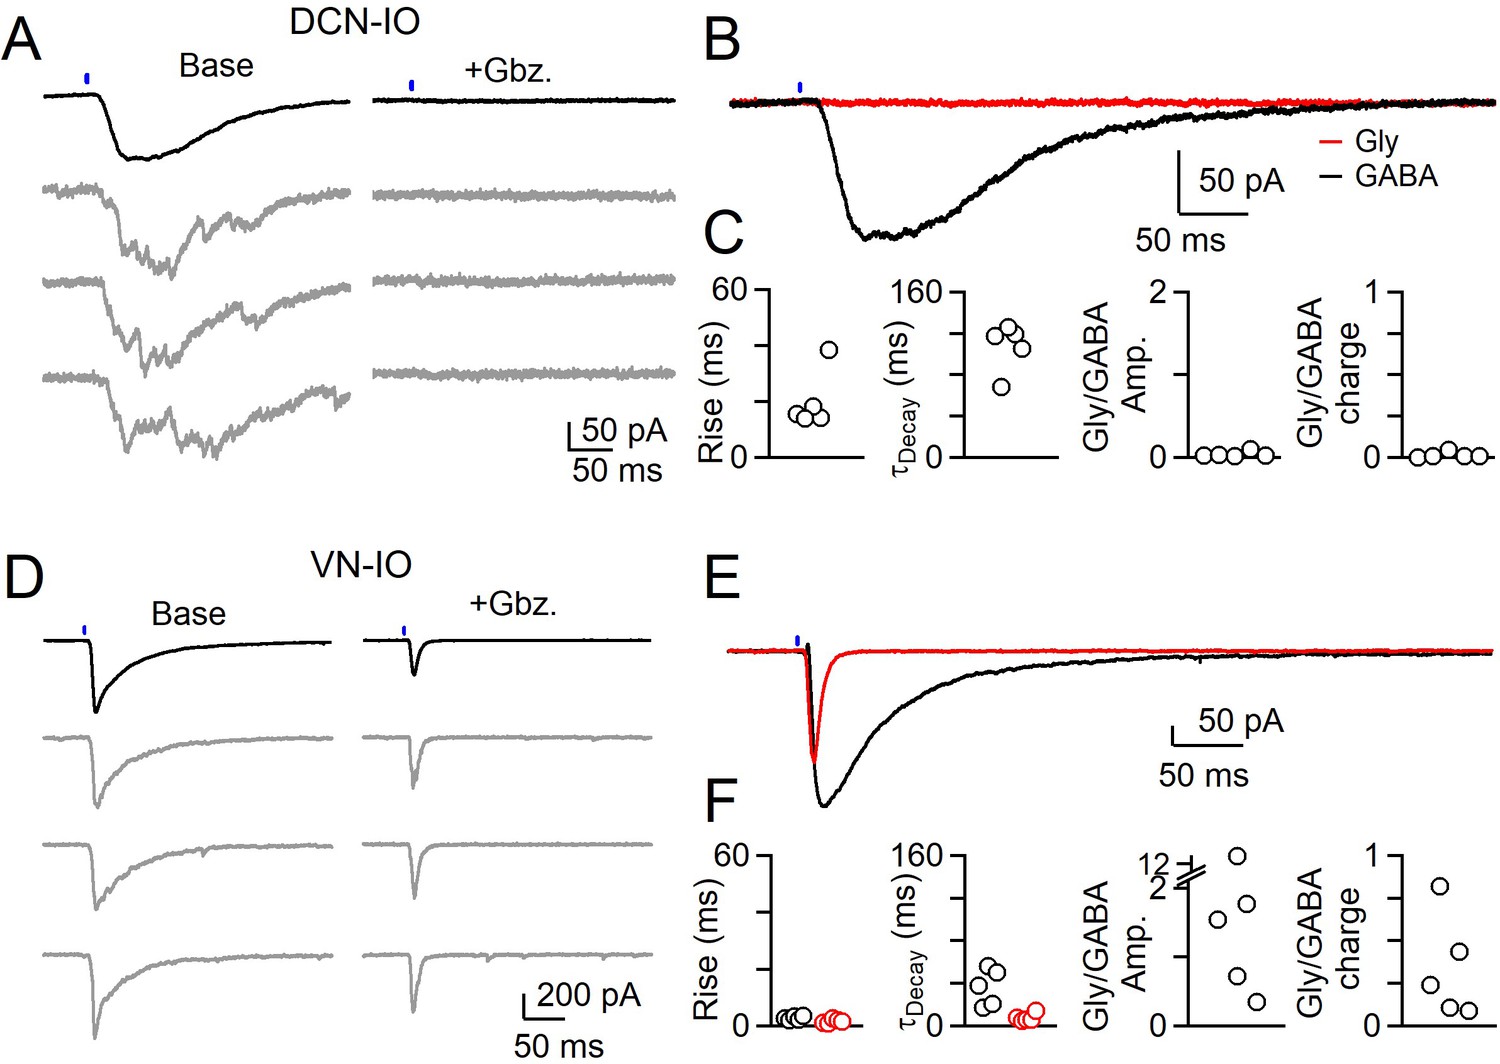
Different sources of inhibition to the IO use different neurotransmitters.
(A) IPSCs evoked by optical stimulation of DCN inputs to a DAO neuron with average (black) and individual trials (gray) before (left) and after washing of Gabazine (left). (B) Average overlaid Gabazine-sensitive (black, GABA) and strychnine-sensitive (red, Gly) IPSCs for cell shown in A. (C) Properties of averaged GABA (black) and Glycine (red) components of release originating from the DCN for each cell, with rise (left), decay (middle) times and ratio of Glycine and GABA IPSC charge. No Glycine component was detected in any cell. (D) Same as in A, but for optically-evoked vestibular input to a cell in the IOB/A. (E) Overlaid averaged Gabazine-sensitive (black, GABA) and strychnine-sensitive (red, Gly) IPSCs for cell shown in D. (F) Same as C, but for properties of vestibular inputs to IO neurons.
-
Figure 5—source data 1
Different sources of inhibition to the IO use different neurotransmitters.
- https://cdn.elifesciences.org/articles/61672/elife-61672-fig5-data1-v1.xlsx
Figure 6 with 1 supplement
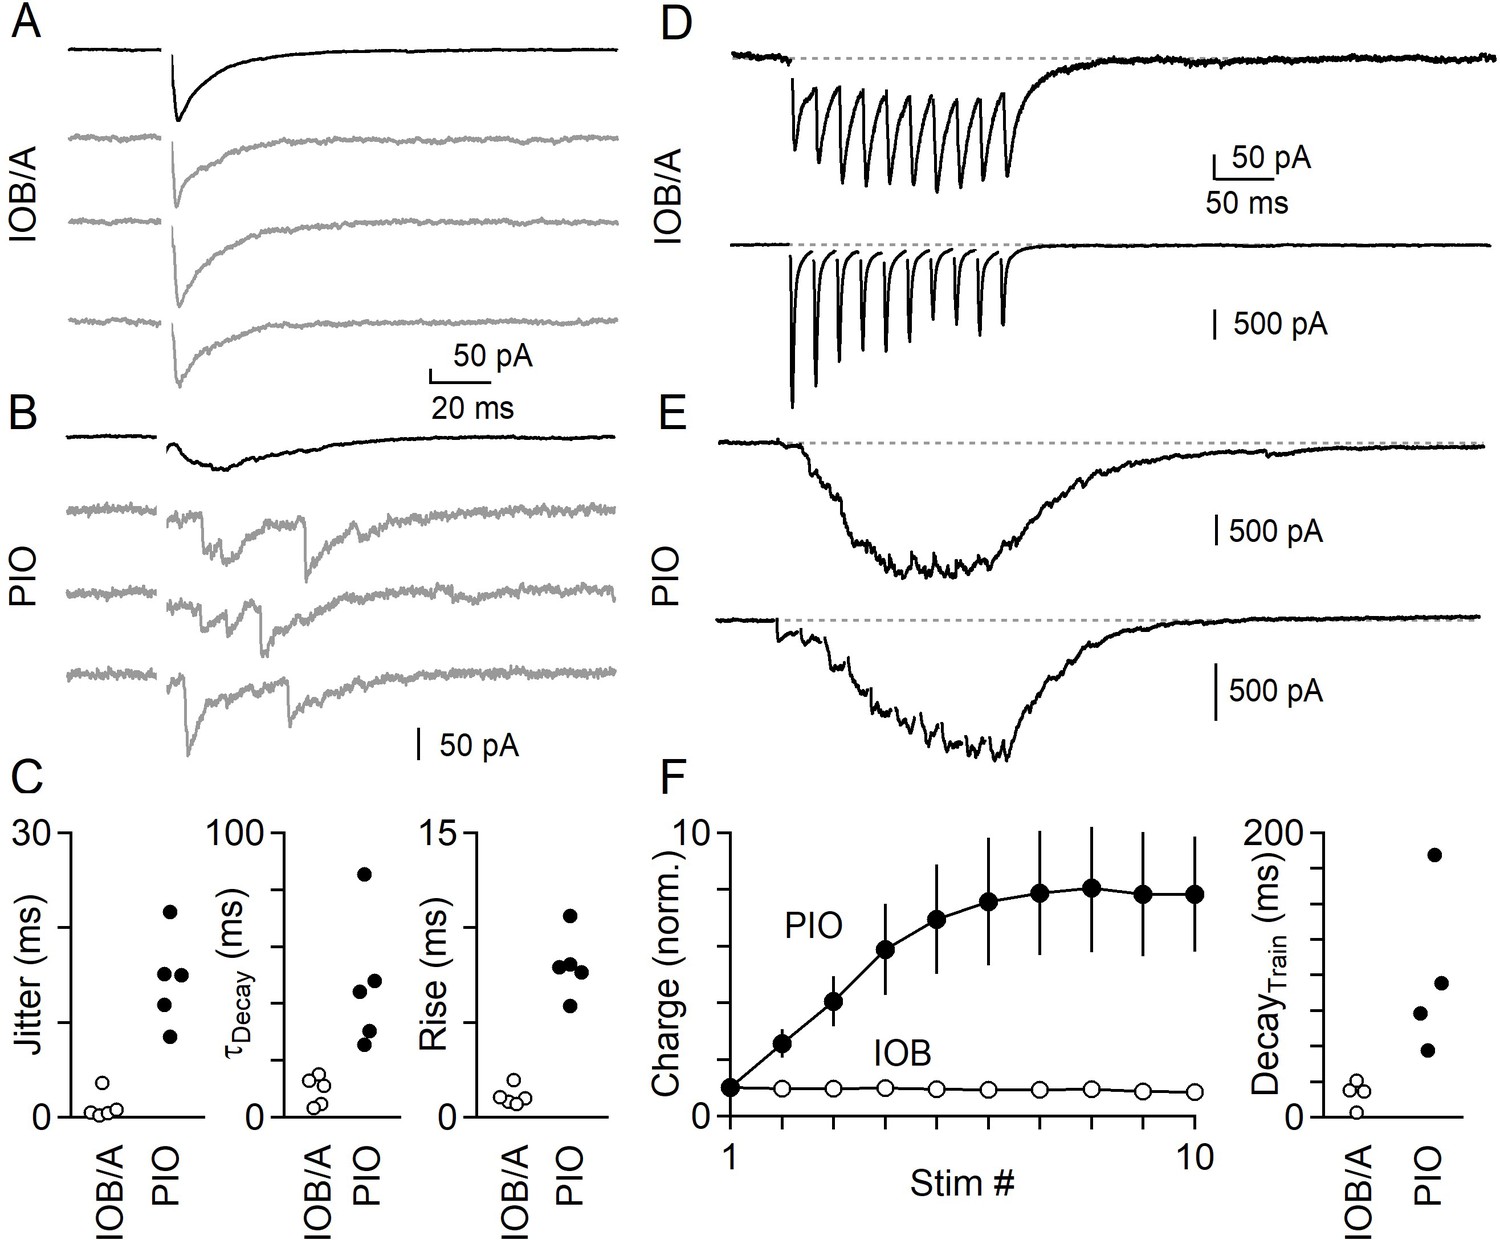
Synchronous and asynchronous release in the IO under near-physiological conditions (35°C in 1.5 mM Ca2+/1.0 mM Mg2+).
(A) IPSCs evoked by single electrical stimuli in the IOB/A showing individual trials (gray) and average across trials (black). (B) Same as in A, but for the PIO. (C) Jitter (Left), decay time (middle) and rise time (right) of IPSCs in the IOB/A (empty markers) and PIO (filled markers) evoked by single stimuli in near-physiological conditions. (D) Averaged IPSCs evoked by trains of electrical stimuli (50 Hz x 10 stimuli) for two different IO neurons in the IOB/A. (E) Same as in D, but for two IO neurons in the PIO. (F) Average normalized charge transfer during a 50 Hz train (left) and average decay time of the last IPSC in the 50 Hz train (right) for neurons in the IOB/A (empty markers) and PIO (filled markers). Data is represented as mean ± SEM for charge, and individual cells for decay time.
-
Figure 6—source data 1
Synchronous and asynchronous release in the IO under near-physiological conditions.
- https://cdn.elifesciences.org/articles/61672/elife-61672-fig6-data1-v1.xlsx
Figure 6—figure supplement 1

bursting and oscillation of electrically-coupled neurons in the IO can obscure synaptic responses.
(A) Neurons in the IO are electrically-coupled and as a result fire and oscillate synchronously and spontaneously. Oscillations and bursting are more common at near-physiological temperature (35°C). Bursting from neighboring IO neurons can be seen in a neuron in the PIO held at −60 mV despite the presence of intracellular blockers of Na+, K+, and Ca2+ currents (by QX-314, TEA, and D-600, respectively). Bursts have waveforms distinguished by large inward currents followed by a slow outward component (middle) that reflects low-pass filtered synchronous firing of neighboring coupled neurons. Small inward synaptic events can be seen between bursts (right). Recordings were obtained at near-physiological conditions (35°C in 1.5 mM Ca2+ / 1.0 mM Mg2+). (B) Same cell as in A, but held at +60 mV. Currents generated by spontaneous electrically-coupled bursts are attenuated (Left, middle), but do not reverse. Small events between bursts mediated by chemical synapses reverse (right). (C) Current evoked by a single stimulus in a PIO neuron held at −60 mV in the presence of blockers of excitatory (NBQX, CPP) and inhibitory transmission (Gabazine, Strychnine). Evoked currents did not reverse, even when held at +60 mV (not shown). (D) Current evoked by a 50 Hz train of 10 stimuli in a PIO neuron held at −60 mV in the presence of synaptic blockers as shown in C. The train consistently initiated a burst from neighboring IO neurons, followed by a subthreshold sinusoidal oscillation that is truncated after a single phase. Evoked currents did not reverse and were not eliminated when the cell was held at +60 mV (not shown).
Figure 7
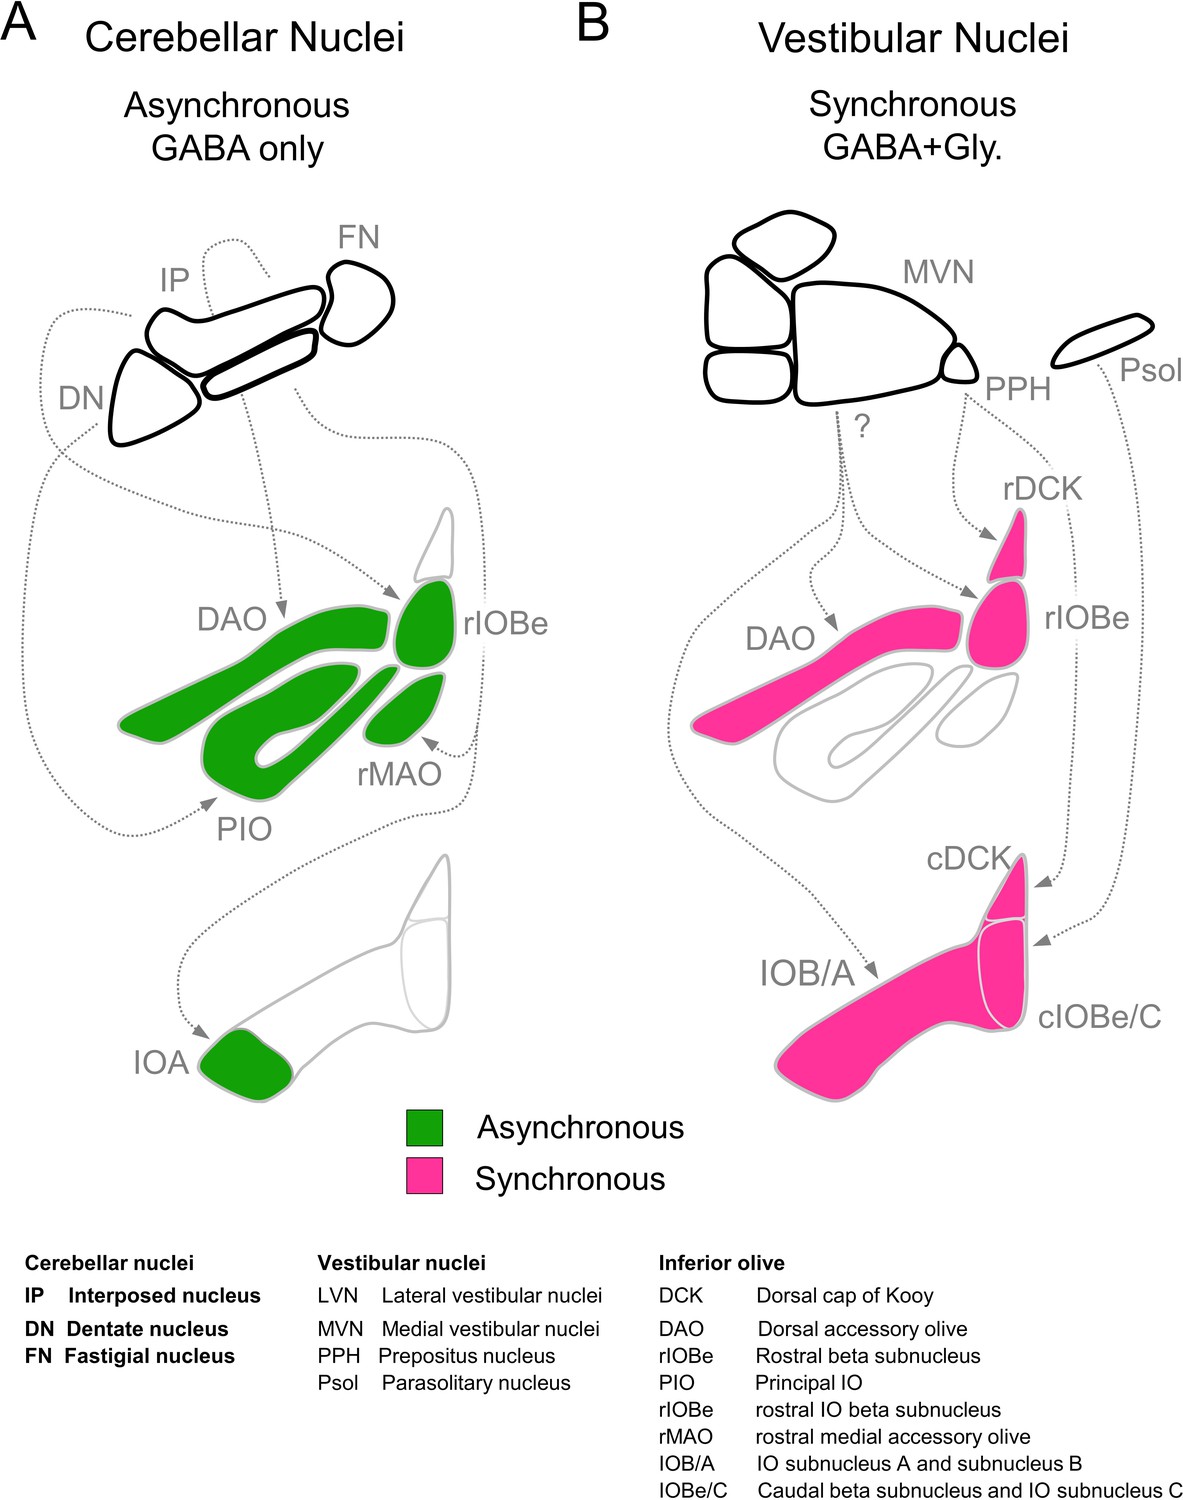
Summary of inhibitory projections to the IO.
(A) Schematic of inhibitory input from the DCN (top) to the IO (middle, bottom). The DCN supplies asynchronous (green) GABAergic inhibition, primarily targeting the rostral IO. Dashed arrows show putative connections between specific subregions of the DCN and IO. White regions of the IO did not receive detectable input from the DCN. (B) Inhibitory input from vestibular origins (top) to the IO (middle, bottom) provide primarily synchronous (magenta) inhibition that typically has both GABAergic and Glycinergic components. White regions of the IO did not receive detectable input from the vestibular nuclei. Contralateral/ipsilateral specificity is not shown. Sources and properties of inhibition in the rDCK are based on previous studies, which have shown that they have fast kinetics (Best and Regehr, 2009), and originate in the vestibular nuclei but not the cerebellar nuclei (Balaban and Beryozkin, 1994; De Zeeuw et al., 1994; De Zeeuw et al., 1993).
Tables
Key resources table
| Reagent type (species) or resource | Designation | Source or reference | Identifiers | Additional information |
|---|---|---|---|---|
| Strain, strain background | C57BL/6, Mus musculus | Charles River | ||
| Strain, strain background Mus musculus | GlyT2Cre (C57BL/6-Slc6a5 < tm1.1(cre)Ksak>), C57BL/6, | Obtained from the RIKEN BioResource Research center; Kakizaki et al., 2017 | BRC No: RBRC10109 | |
| Strain, strain background Mus musculus | Ai34 (B6;129S-Gt(ROSA)26Sortm34.1(CAG-Syp/tdTomato)Hze/J) | Jackson Laboratories | Stock: 012570 | |
| Recombinant DNA reagent | AAV9-hSyn-hChR2(H134R)-EYFP | UNC Viral Vector Core/Addgene | 26973-AAV9 | |
| Software, algorithm | Matlab | Mathworks (https://www.mathworks.com/downloads/) | RRID:SCR_001622 | Version R2019a |
| Software, algorithm | IgorPro | Wavemetrics (https://www.wavemetrics.com/order/order_igordownloads6.htm) | RRID:SCR_000325 | Version 6.22 |
| Software, algorithm | ImageJ/Fiji software | Fiji (http://fiji.sc/) | RRID:SCR_002285 | Version 1.52N |
| Software, algorithm | ZEN software | Zeiss (https://www.zeiss.com/microscopy/us/products/microscope-software/zen.html) | RRID:SCR_013672 | Version 2.3 SP1 FP3 |
| Chemical compound, drug | Tetrodotoxin citrate | Abcam | Ab120055 | |
| Chemical compound, drug | NBQX disodium salt | Abcam | Ab120046 | |
| Chemical compound, drug | (R)-CPP | Abcam | Ab120159 | |
| Chemical compound, drug | Strychnine hydrochloride | Abcam | Ab120416 | |
| Chemical compound, drug | SR95531 (Gabazine) | Abcam | Ab120042 | |
| Chemical compound, drug | TTA-P2 | Alamone Labs | T-155 |
Table 1
Number of electrophysiological experiments.
| Figure | Sub nucleus | Electrical/No stim. (74 Cells/21 Mice) | ChR2; VN (54 Cells/11 Mice) | ChR2; DCN (51 Cells/9 Mice) | Drugs (+NBQX, CPP) |
|---|---|---|---|---|---|
| Figure 2A-C | DAO | 6/2 | Gbz wash, Strych wash | ||
| Figure 2D-H | DAO | 15/5 | TTX, Gbz | ||
| Figure 2D-H | rIOBe | 6/3 | TTX, Gbz | ||
| Figure 2D-H | rMAO | 4/2 | TTX, Gbz | ||
| Figure 2D-H | PIO | 12/5 | TTX, Gbz | ||
| Figure 2D-H | cDCK | 4/2 | TTX, Gbz | ||
| Figure 2D-H | cIOBe/C | 6/3 | TTX, Gbz | ||
| Figure 2D-H | IOB/A | 6/3 | TTX, Gbz | ||
| Figure 2D-G | DAO | Turecek and Regehr, 2019 | TTX, Strych | ||
| Figure 3B | rIOBe | 1/1 | None | ||
| Figure 4 | DAO | 13/5 | 12/4 | None | |
| Figure 3C-F; Figure 4 | rIOBe | 7/7 | 9/3 | None | |
| Figure 4 | rMAO | 3/3 | None | ||
| Figure 4 | PIO | 12/5 | None | ||
| Figure 4 | cDCK | 0/0 | None | ||
| Figure 4 | cIOBe/C | 9/2 | 8/3 | None | |
| Figure 4 | IOB/A | 5/2 | 17/6 | None | |
| Figure 5A-C | PIO | 5/2 | Gbz wash, Strych wash | ||
| Figure 5D-E | IOB/A | 5/2 | Gbz wash, Strych wash | ||
| Figure 6 | PIO | 4/4 | None | ||
| Figure 6 | IOB/A | 4/4 | None | ||
| Figure 6 | PIO | 5/5 | None | ||
| Figure 6 | IOB/A | 5/5 | None |
Additional files
Download links
A two-part list of links to download the article, or parts of the article, in various formats.
Downloads (link to download the article as PDF)
Open citations (links to open the citations from this article in various online reference manager services)
Cite this article (links to download the citations from this article in formats compatible with various reference manager tools)
Cerebellar and vestibular nuclear synapses in the inferior olive have distinct release kinetics and neurotransmitters
eLife 9:e61672.
https://doi.org/10.7554/eLife.61672


