Cannabinoids modulate associative cerebellar learning via alterations in behavioral state
- Champalimaud Neuroscience Program, Champalimaud Center for the Unknown, Portugal
Figures
Figure 1 with 2 supplements
Correcting for differences in locomotor activity accounts for apparent deficits in eyeblink conditioning.
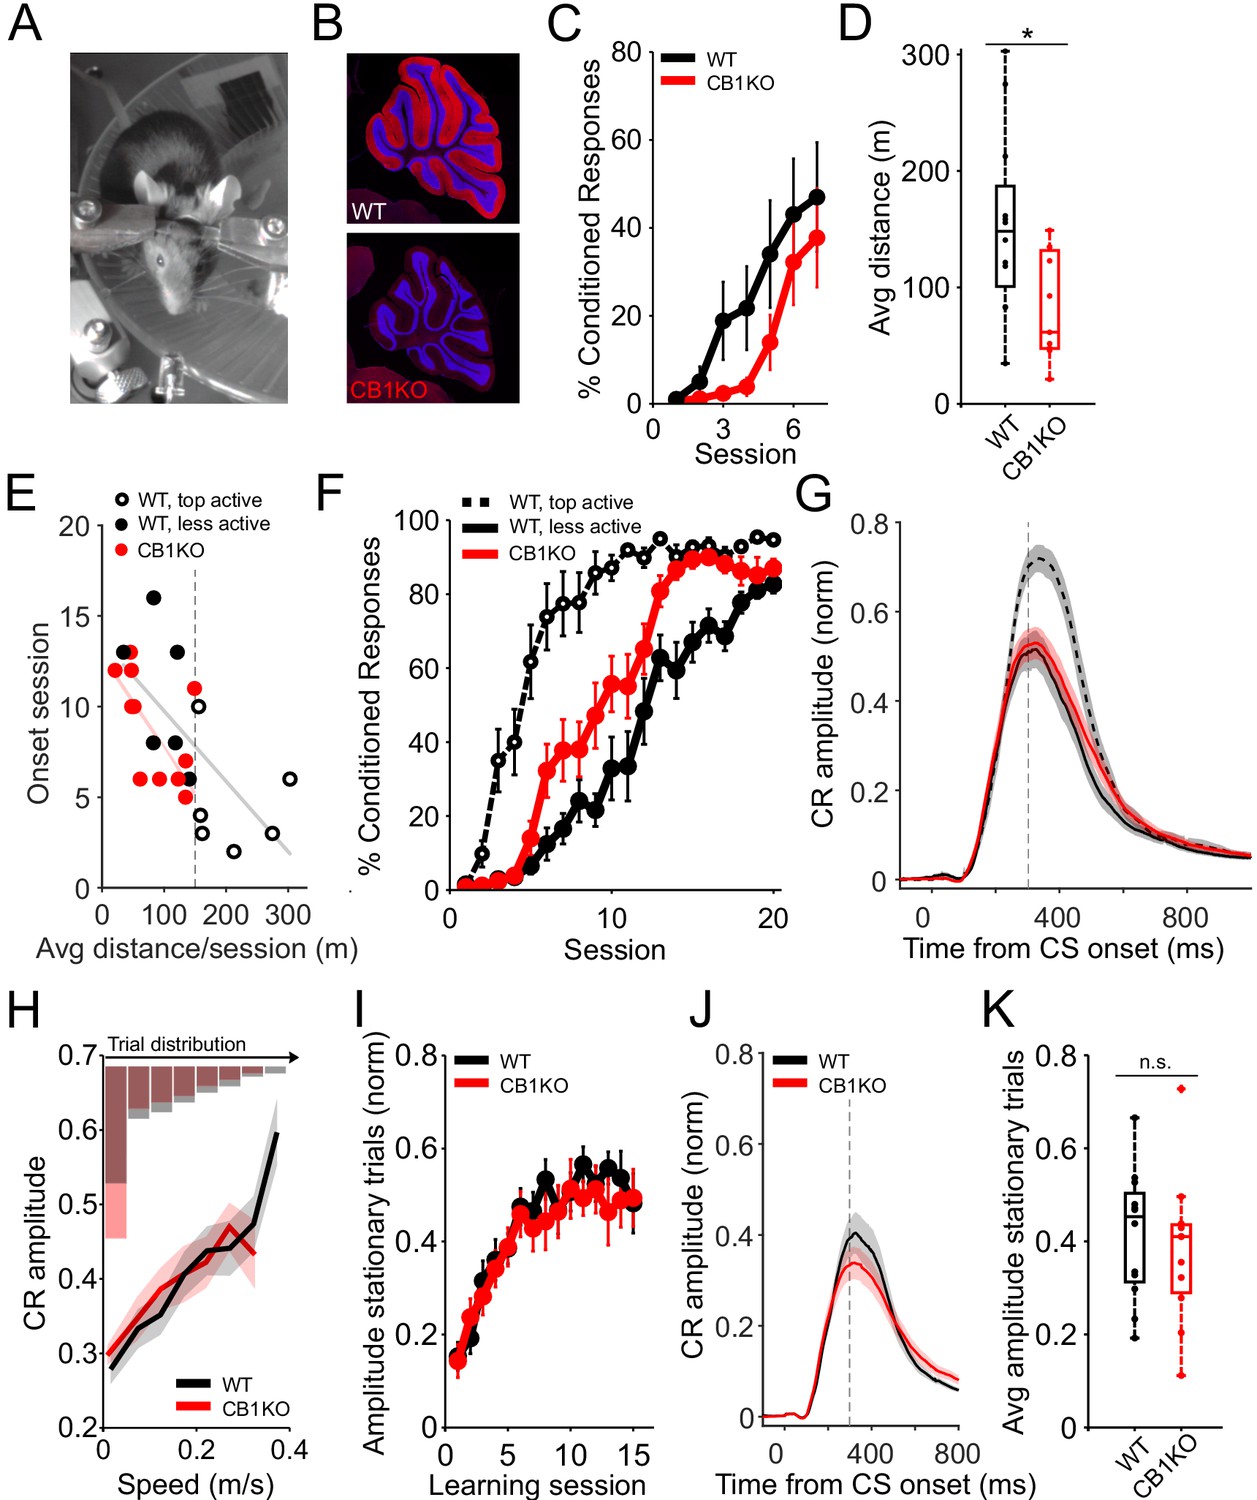
(A) Setup for eyeblink conditioning in head-fixed mice on a running wheel, showing an LED as the CS and an air-puff US. (B) Sagittal sections showing the complete elimination of CB1R (red) in CB1KOs and DAPI staining the granule-cell layer (blue). Images of the cerebellum of a representative control (upper panel) and global CB1 knockout (bottom panel). (C) Average %CR learning curves of global CB1 knockout mice (CB1KO, red, N = 11) and their littermate controls (WT, black, N = 12). Error bars indicate SEM. (D) Average running distance of WT (black, N = 12) and CB1KO (red, N = 11) on a self-paced treadmill across all learning sessions. Global CB1 knockout mice were significantly hypoactive (*p=0.015). Box indicates median and 25th to 75th percentiles, whiskers extend to the most extreme data points. (E) Onset session of learning for CB1KO (red) and littermate controls (black), divided into top and bottom runners (open and filled circles, respectively), plotted against the animals’ mean walking distance, averaged across all 20 training sessions. Vertical dashed line indicates the threshold used for dividing the control animals (150 meters/session, on average). Onset session was defined as the session in which the average CR amplitude exceeded 0.1. Each dot represents an animal. Lines are linear robust fits for CB1KO (red, slope = −0.05, *p=0.02) and controls (gray, slope = −0.04, *p=0.03). (F) Average %CR learning curves of CB1KO (red line, N = 11) compared with wildtype littermates with comparable (solid black line, N = 6) or increased locomotor activity levels (dashed black line, N = 6). Error bars indicate SEM. (G) Average eyelid traces of CS-only trials from the last two training sessions for CB1KO (red line, N = 11), hypoactive wildtype animals (solid black line, N = 6) and littermate controls with increased locomotor activity (dashed black line, N = 6). Vertical dashed line represents the time that the US would have been expected on CS+US trials. Shadows indicate SEM. (H) Trial-to-trial correlation between eyelid response amplitude and walking speed. Amplitudes for all trials from six training sessions following learning onset (defined as in (E)) are plotted with lines representing averages across control (black) and global knockout (red) animals; shadows indicate SEM. There was a linear positive relationship for both controls (N = 12, F(1,65.9) = 34.7, ***p=1.5e-07) and global knockouts (N = 11, F(1,43.5) = 43.4, ***p=4.9e-08). Histograms indicate the relative % of trials (averaged across animals) from each genotype that fell in each speed bin. (I) Average amplitude learning curves including only stationary trials of control (WT, black, N = 12) and CB1KO mice (red, N = 11), aligned for each animal’s onset session (defined as in (E)). Error bars indicate SEM. (J) Average eyelid traces of stationary (<0.05 m/s) CS-only trials for control (black) and CB1KO (red) animals, from same sessions in (I). Shadows indicate SEM. Vertical dashed line represents the time that the US would have been expected on CS+US trials. (K) Mean eyelid amplitudes from stationary trials from same sessions as in (I). There was no significant difference in the average amplitude of control (black, N = 12) vs. CB1KO (red, N = 11) animals (p=0.58). Dots represent individual animals. Box indicates median and 25th to 75th percentiles, whiskers extend to the most extreme data points.
-
Figure 1—source data 1
Source data for Figure 1 and related supplements.
- https://cdn.elifesciences.org/articles/61821/elife-61821-fig1-data1-v1.mat
Figure 1—figure supplement 1
Various measures of altered behavioral state in CB1KO mice and relationship to learning.
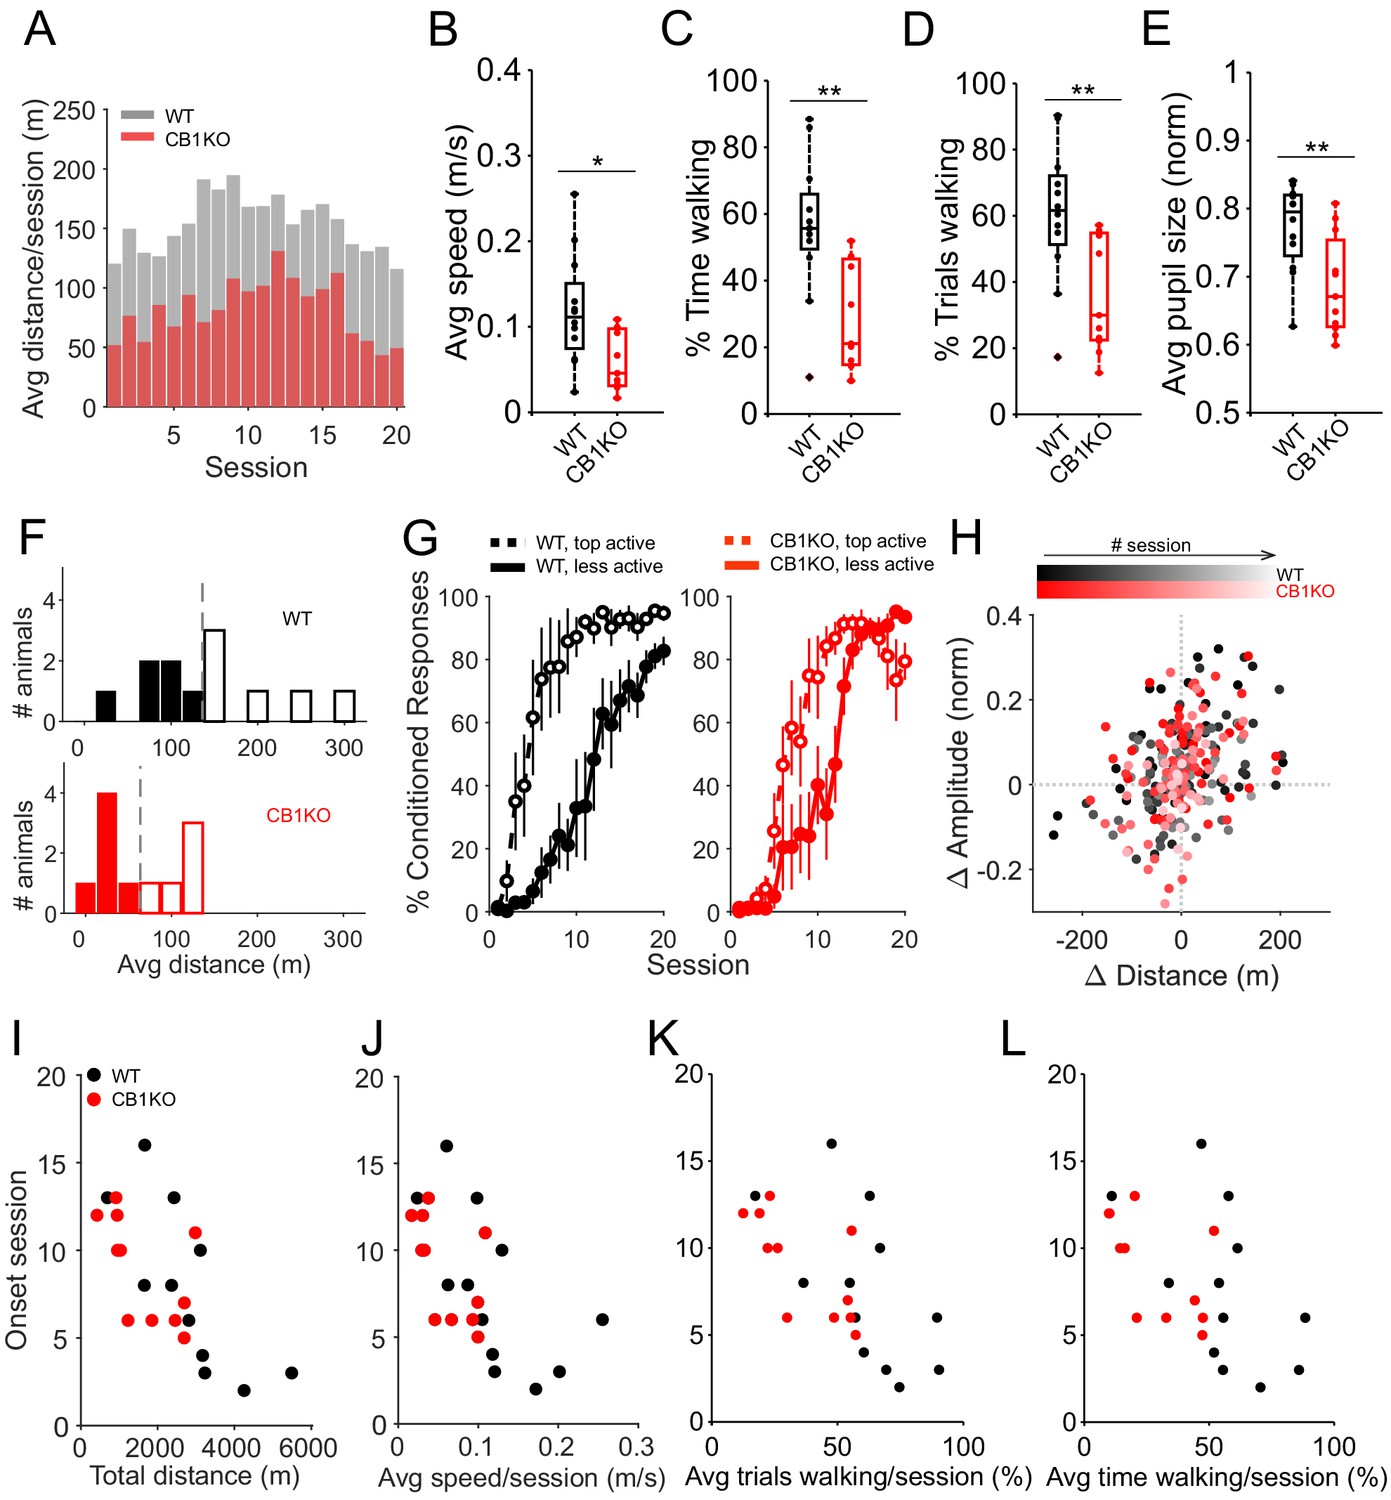
(A) Average distance run on the treadmill in each training session for each (genotype, superimposed). (B – E) Global CB1 knockout animals (red, N = 11) walk overall more slowly than littermate controls (black, N = 12), (B), (*p=0.013), spend on average less time walking during the sessions (C, **p=0.002), have on average across all sessions, a smaller proportion of trials spent walking (D, **p=0.007) and have overall smaller pupils than controls (E, **p=0.008). In all boxplots (B – E), dots represent individual animals. Box indicates median and 25th to 75th percentiles, whiskers extend to the most extreme data points. (F) Count of wildtype (top, black) and CB1KO (bottom, red) animals by average distance walked across all 20 training sessions (25 m bins). Dashed gray lines indicate the threshold used in (G) to separate more active from less active animals. (G) Averaged learning curves of more (dashed lines) and less (solid lines) active animals, divided according to (F). For both controls (left plot, black, N = 6+6) and CB1KO (right plot, red, N = 6+5), more active animals show faster learning. Error bars indicate SEM. (H) Session-to-session changes in average CR amplitude (y-axis) of controls (black) and CB1KO (red) are plotted as a function of session-to-session changes in walked distance (x-axis), for all training sessions following learning onset, color-coded for session number (darker colors correspond to earlier sessions and lighter colors correspond to later sessions). In both genotypes, changes in CR amplitude were positively correlated with changes in locomotor activity (controls: slope = 0.0005, ***p=9.87e-08; CB1KO: slope = 0.0006, ***p=9.93e-05). (I – L) Onset sessions of learning (as defined in Figure 1E) for each animal are plotted CB1KOagainst the animals’ total walking distance (I), animals’ average walking speed (J), animals’ average percentage of trials spent walking (K) and animals’ average percent time spent walking (L). Each dot represents an animal.
Figure 1—figure supplement 2

Learned response timing and short-term, single-trial learning are normal in global CB1KO mice.
(A) Average conditioned responses (CR) for CB1KO (red, N = 8) and littermate controls (black, N = 8) trained to a 500 ms CS-US interstimulus interval. Data are from CS-only trials from two test sessions (50% of the trials are CS-only, randomly interleaved with CS-US trials) following acquisition. Vertical dashed line represents the time that the US would have been expected on CS+US trials. Shadows indicate SEM. (B) Average peak times of CR from control (black) and CB1 knockout (red) mice trained to a 300 ms or a 500 ms ISI. Horizontal dashed lines indicate the time of the US in each condition. There was no significant difference in the average peak timing of CR of controls and CB1KO mice for either interval (300 ms ISI: p=0.12; 500 ms ISI: p=0.24). Dots represent individual animals. Box indicates median and 25th to 75th percentiles, whiskers extend to the most extreme data points. (C–D) Comparison of CR amplitudes on trials during test sessions that were preceded by trials with (CS-US) or without (CS-only) an air-puff US. (C) Averaged eyelid traces from trials that were preceded by a trial with an air-puff US (solid line) or by a CS-only trial (dashed line), for control (black, left plot) and CB1KO (red, right plot) mice. Vertical dashed line represents the time of the US (present on 50% of trials). Shadows indicate SEM. (D) Average peak amplitude of responses from trials preceded by a trial with or without an air-puff US. CRs are larger following a CS-US trial in both genotypes (controls: black, paired t-test, ***p=3.6e-05; CB1KO: red, paired t-test, **p=0.002). Thin lines are individual animals and thick lines correspond to averages for each genotype.
Figure 2 with 2 supplements
Equalizing locomotor activity with a motorized treadmill rescues CB1-related learning deficits.
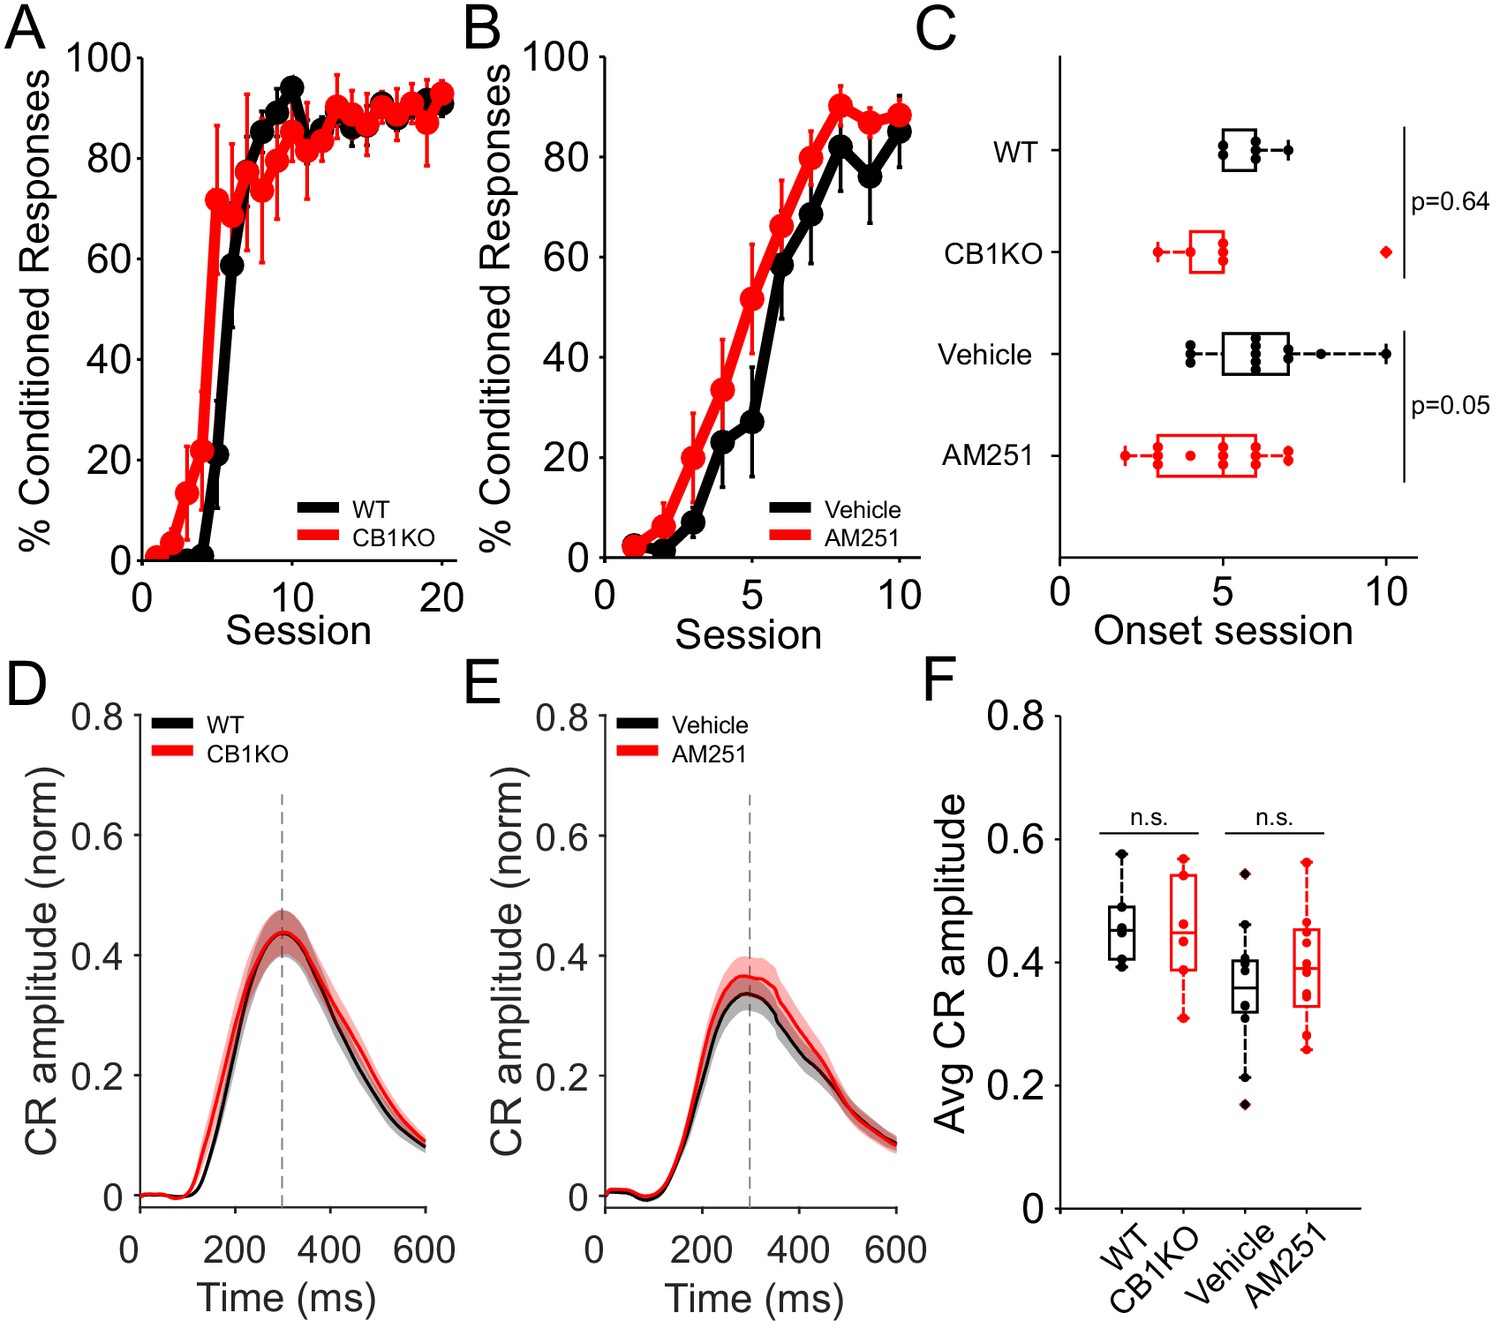
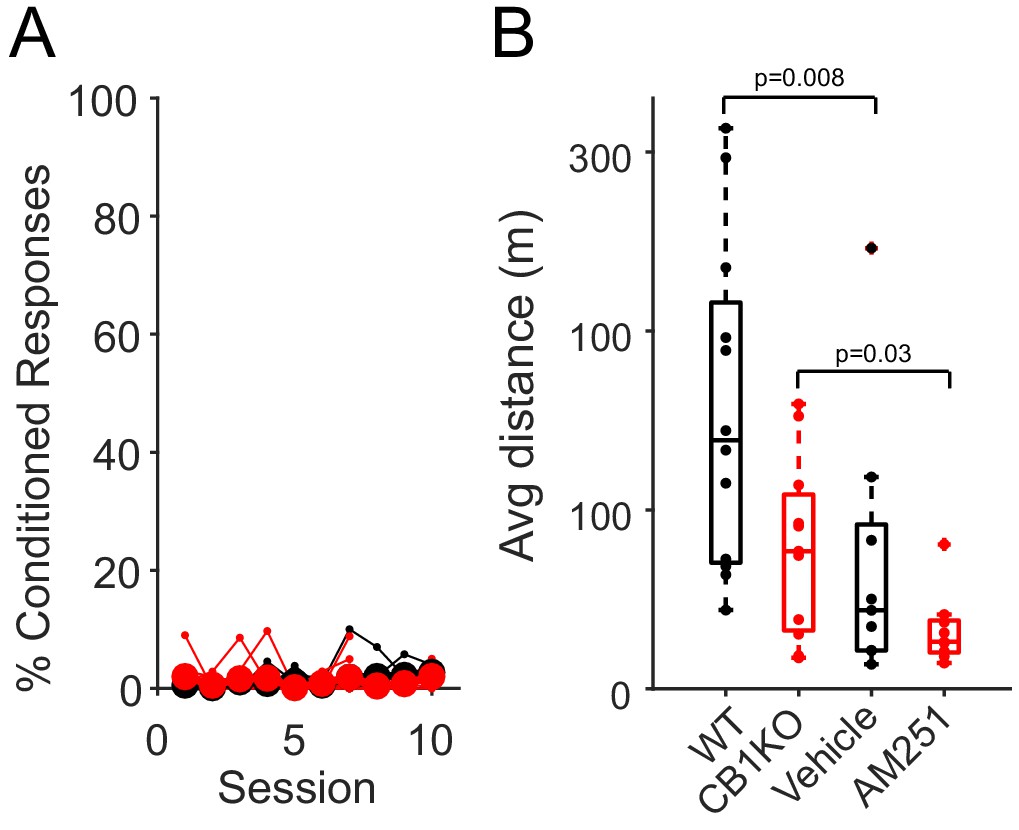
(A) Average %CR learning curves of global CB1 knockout (red, N = 6) mice and littermate controls (black, N = 6), while running at a fixed speed (0.12 m/s) on a motorized treadmill. Error bars indicate SEM. (B) Average %CR learning curves of mice injected with vehicle solution (black, N = 12) or with the CB1R antagonist AM251 (red, N = 13), while running at a fixed speed (0.12 m/s). Error bars indicate SEM. (C) Average onset session of learning for animals in (A), wildtype (WT) and CB1KO mice (top two boxplots) and in (B), mice injected with vehicle or with AM251 (bottom two boxplots). There was no significant difference in learning onset session between WT and CB1KO (p=0.64). Average onset session between animals injected with vehicle or the antagonist AM251 was marginally different (p=0.05). Dots represent individual animals. Box indicates median and 25th to 75th percentiles, whiskers extend to the most extreme data points. (D) Average conditioned response (CR) eyelid traces of CS-only trials from all training sessions of control (black) and CB1 global knockout (red) animals. Shadows indicate SEM. Vertical dashed line represents the time that the US would have been expected on CS+US trials. (E) Average CR eyelid traces of CS-only trials from all training sessions of mice injected with vehicle (black) or AM251 (red). Shadows indicate SEM. Gray vertical line represents time of air-puff US. (F) Mean CR amplitudes from all training sessions of each experimental group: controls, CB1KO, animals injected with vehicle and animals injected with AM251 (from left to right). There was no significant difference in the average amplitude of WT and CB1KO mice (p=0.82, first two boxplots) or in mice injected with vehicle or AM251 (p=0.32, last two boxplots). Dots represent individual animals. Box indicates median and 25th to 75th percentiles, whiskers extend to the most extreme data points.
-
Figure 2—source data 1
Source data for Figure 2 and related supplements.
- https://cdn.elifesciences.org/articles/61821/elife-61821-fig2-data1-v1.mat
Figure 2—figure supplement 1
CB1R antagonist AM251 causes hypoactivity, both across groups and within animals.
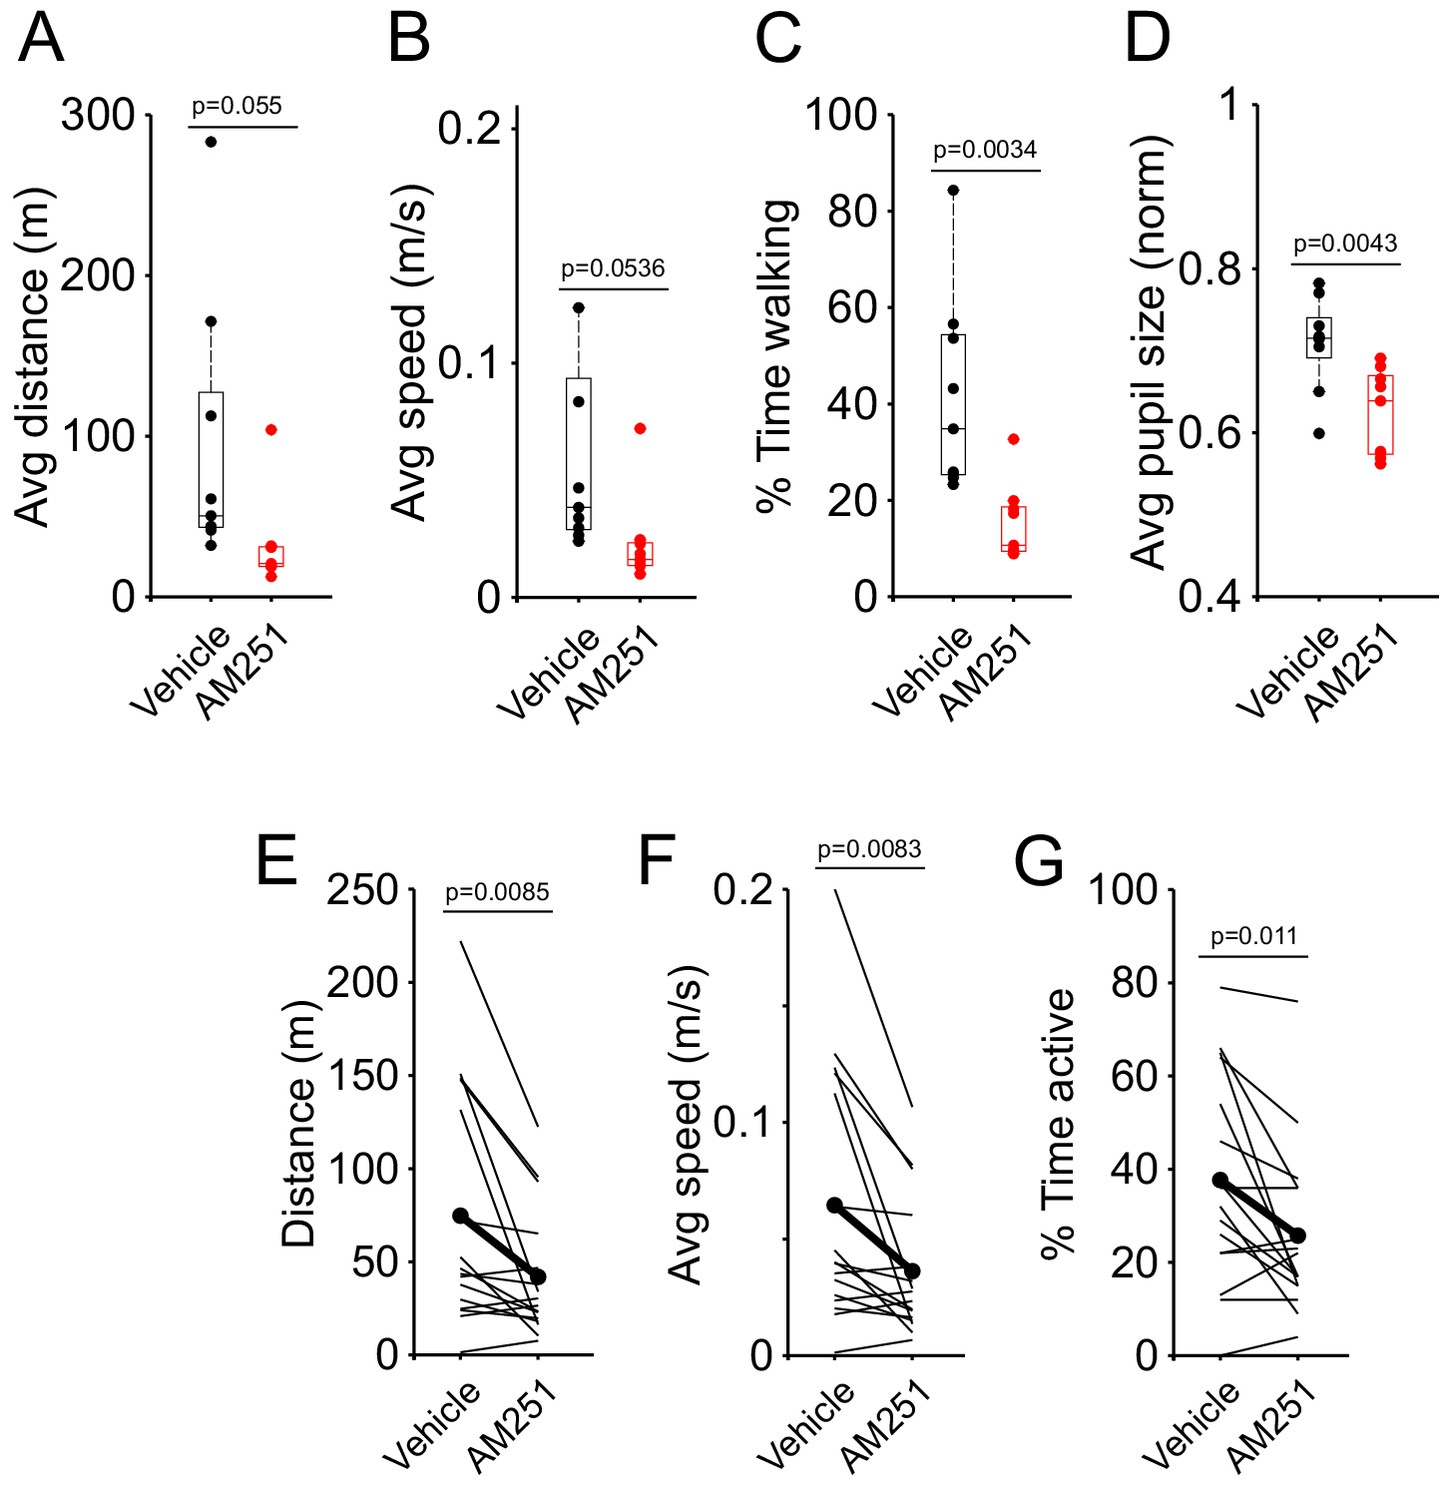
(A – D) Animals were injected with AM251 (N = 9) or with vehicle (N = 9) and different parameters were measured 30 min post-injection, while the animals were head-fixed, but could walk on the self-paced treadmill, for a total of five sessions of ~20 min. Compared to animals injected with vehicle, mice injected with AM251 walk overall less (A, p=0.05), more slowly (B, p=0.05), spend less time walking (C, *p=0.003) and have smaller average pupil size (D, *p=0.004). In all boxplots (A – D), dots represent individual animals. Box indicates median and 25th to 75th percentiles, whiskers extend to the most extreme data points. (E – G) Animals were injected with vehicle and their locomotor activity was recorded on the self-paced treadmill. The same animals were tested on the following day, post-injection of AM251, and comparisons within animals were performed using a Student’s paired t-test. Administration of CB1R antagonist AM251 resulted in decreased locomotor activity (E, *p=0.009), slower speeds (F, *p=0.008) and less time spent walking (G, *p=0.01).
Figure 2—figure supplement 2
Vehicle (DMSO) solution drives hypoactivity in mice, preventing them from learning on the self-paced treadmill.
(A) Average %CR learning curves of mice injected with AM251 (N = 9) or with vehicle (N = 9) 30 min before each training session on the self-paced treadmill, for a total of 10 sessions. Thin lines correspond to individual animals. (B) Average running distance of WT (N = 12), CB1KO (N = 11), WT mice injected with vehicle (N = 9), or with AM251 (N = 9) on a self-paced treadmill across 10 learning sessions. DMSO-containing vehicle alone caused hypoactivity (p=0.0077).
Figure 3 with 1 supplement

Eyeblink conditioning is intact in granule-cell-specific CB1 knockout mice.
(A) Sagittal sections showing the selective elimination of CB1R (red) from cerebellar granule cells in G6KO and DAPI staining the granule-cell layer (blue). Images of the cerebellum of a representative control (upper panel) and granule-cell conditional CB1 knockout (bottom panel). (B) Average running distance of G6KO (cyan, N = 8) mice and their littermate controls (G6CTL, blue, N = 9) and on a self-paced treadmill across 20 learning sessions. The difference in average distance between groups was not significant (p=0.704). Box indicates median and 25th to 75th percentiles, whiskers extend to the most extreme data points. (C) Average %CR learning curves of granule-cell-specific CB1 knockout mice (G6KO, cyan, N = 8) and littermate controls (G6CTL, blue, N = 9), walking on the self-paced treadmill. Error bars indicate SEM. (D) Average conditioned response (CR) traces of CS-only trials from all training sessions on a self-paced treadmill for control (blue) and G6KO (cyan) animals. Shadows indicate SEM. Vertical dashed line represents the time that the US would have been expected on CS+US trials. (E) Average %CR learning curves of G6KO (cyan, N = 7) and G6CTL (blue, N = 6), while running at a fixed speed (0.12 m/s) on a motorized treadmill. Error bars indicate SEM. (F) Average CR eyelid traces of CS-only trials from all training sessions on a motorized treadmill of control (blue) and granule-cell-selective CB1 knockout (cyan) animals, on the motorized treadmill. Shadows indicate SEM. Vertical dashed line represents the time that the US would have been expected on CS+US trials. (G) Mean CR amplitudes from all training sessions. There was no significant difference in the average amplitude (p=0.75) of G6CTL (blue) vs. G6KO (cyan) animals. Dots represent individual animals. Box indicates median and 25th to 75th percentiles, whiskers extend to the most extreme data points..
-
Figure 3—source data 1
Source data for Figure 3 and related supplements.
- https://cdn.elifesciences.org/articles/61821/elife-61821-fig3-data1-v1.mat
Figure 3—figure supplement 1
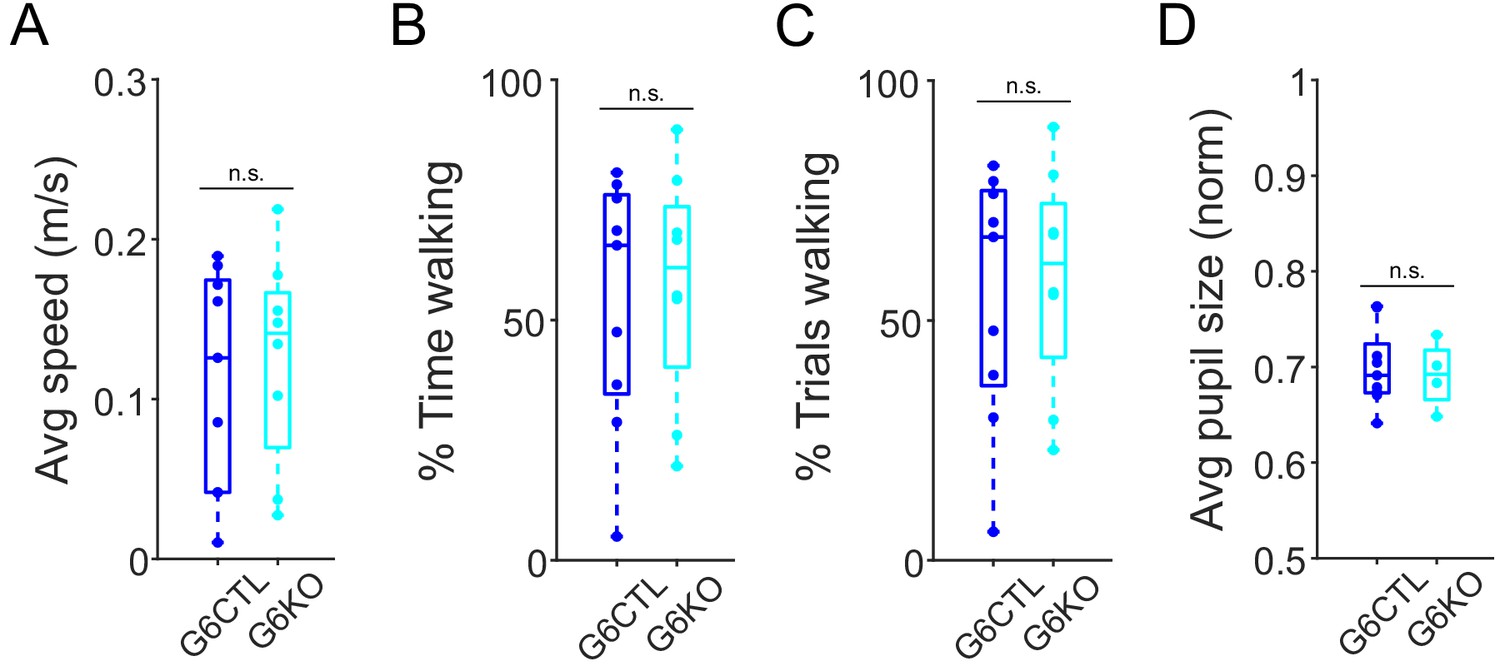
Several measures of behavioral state reveal no differences between granule-cell-specific CB1 knockout mice and controls.
Granule-cell-specific CB1 knockout mice (blue, N = 9) and their littermate controls (cyan, N = 9), show similar levels of average walking speed (A, p=0.70), percent time walking (B, p=0.79), percentage of trials spent walking (C, p=0.78) and similar average pupil size (D, p=0.74), across all 20 training sessions. In all boxplots, dots represent individual animals. Box indicates median and 25th to 75th percentiles, whiskers extend to the most extreme data points.
Figure 4 with 3 supplements
Locomotor learning in global and granule-cell-specific CB1 knockout mice.
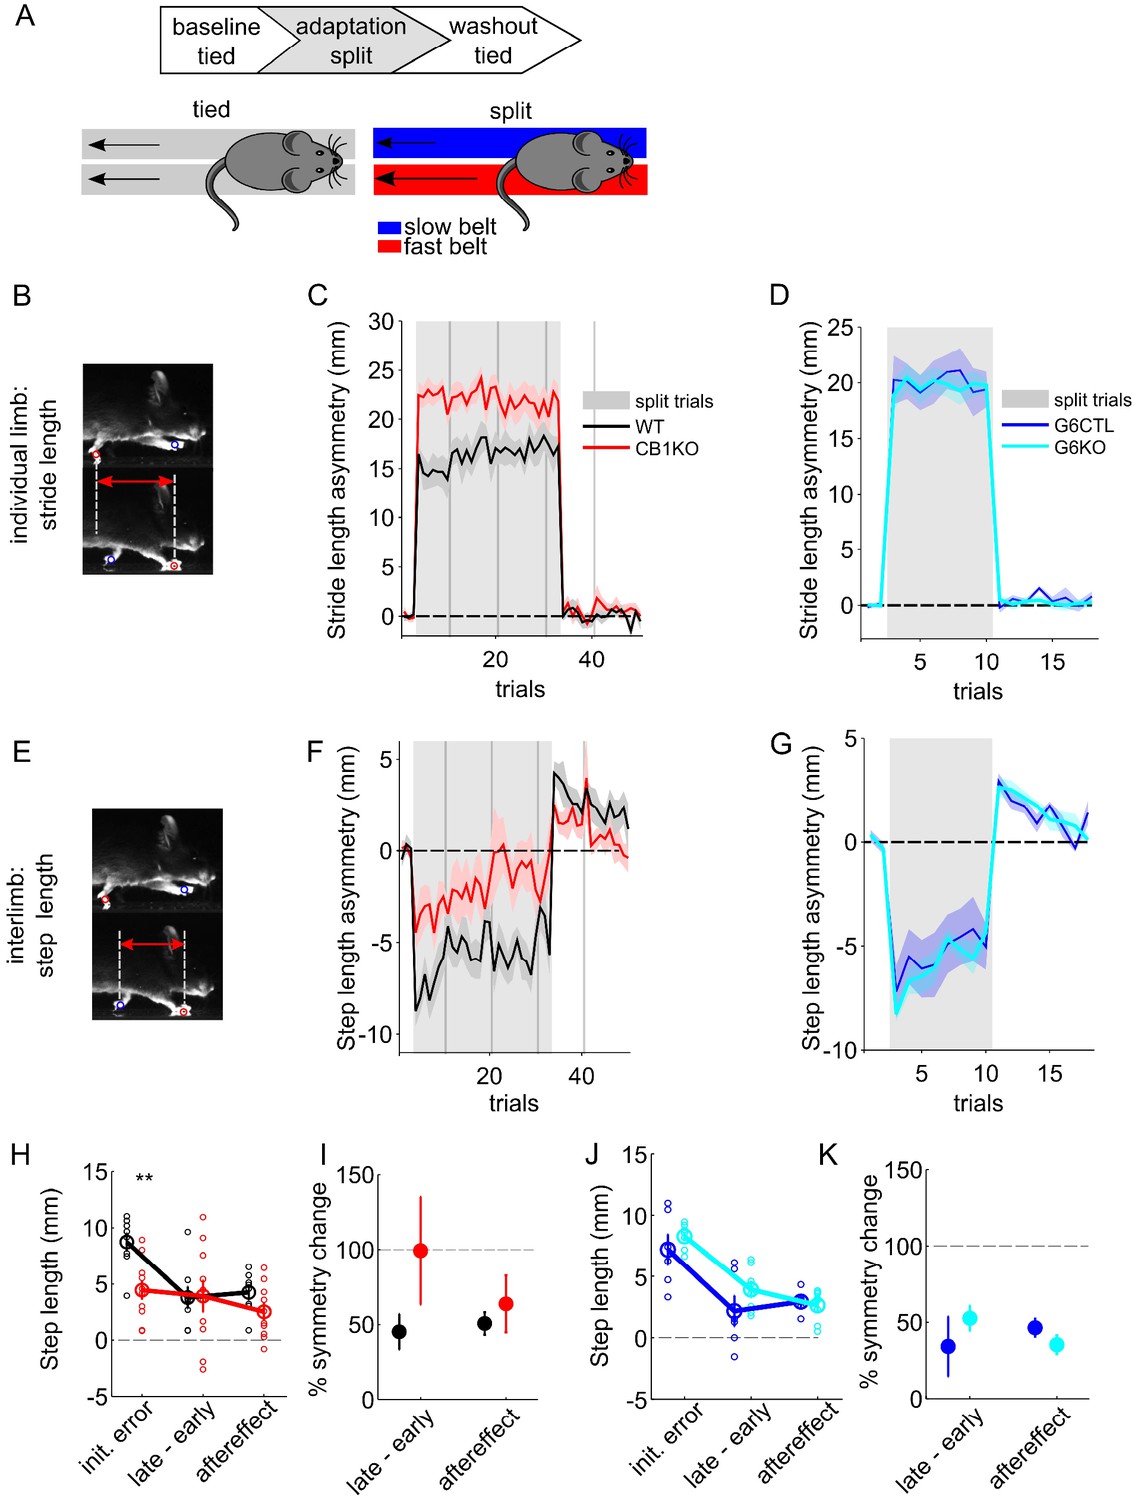
(A) Experimental protocol for split-belt locomotor adaptation. Mice underwent adaptation protocols consisting of baseline, split-belt (adaptation) and washout phases. Belt speeds were equal (‘tied’) in baseline trials and were then abruptly split (2:1 speed ratio) for the adaptation phase, before returning to the original, symmetrical tied-belt speed in the washout phase. (B) The intra-limb parameter ‘stride length’ is the total forward motion of an individual limb from lift-off (swing) to touch-down (stance). (C) Average front limb stride length asymmetry (fast-slow) over trials for global CB1 knockout mice (CB1 KO, N = 10, red) and littermate controls (CB1 WT, N = 8, black). Gray shaded patch indicates split-belt trials. Vertical gray bars indicate session breaks. (D) Same as (C) for granule-cell-specific CB1 knockout mice (G6KO, N = 8, cyan) and their littermate controls (G6CTL, N = 6, blue). (E) The interlimb parameter ‘step length’ is how far forward one paw is relative to its contralateral pair at stance onset. (F) Average front limb step-length asymmetry (fast-slow) over trials for global CB1 knockout mice and littermate controls, plotted as in (B). (G) Same as (F) for granule-cell-specific CB1 knockout mice and their littermate controls. (H) Average step-length asymmetries at three key experimental phases: initial error during the first split-belt trial, the change in step-length asymmetry over the split period (defined as the difference in step-length asymmetries in the last minus the first split-belt trial), and aftereffect (first trial upon returned to tied-belt condition), +/- SEM, for global CB1KOs (red) and littermate controls (black). The signs of the changes over split and aftereffects have been inverted in order to allow direct comparison of magnitudes across the three epochs. Individual animals are shown with smaller, open circles. The change over the split-belt period and the aftereffects, which both reflect learned changes in step symmetry, are comparable in the two genotypes. (I) Average changes in step symmetry (+/- SEM) are plotted as a percent of the average initial error, for global CB1KO mice and littermate controls. Line at 100% shows complete adaptation. There is no deficit in learning in the CB1KOs. (J) Same as (H) for granule-cell-specific CB1 knockouts (cyan) and littermate controls (blue). Individual animals are shown with smaller, open circles. (K) Same as (H) but for granule-cell-specific CB1 knockouts and littermate controls.
-
Figure 4—source data 1
Source data for Figure 4 and related supplements.
- https://cdn.elifesciences.org/articles/61821/elife-61821-fig4-data1-v1.mat
Figure 4—figure supplement 1
Analysis of overground locomotion in global and granule-cell-specific CB1KO mice.
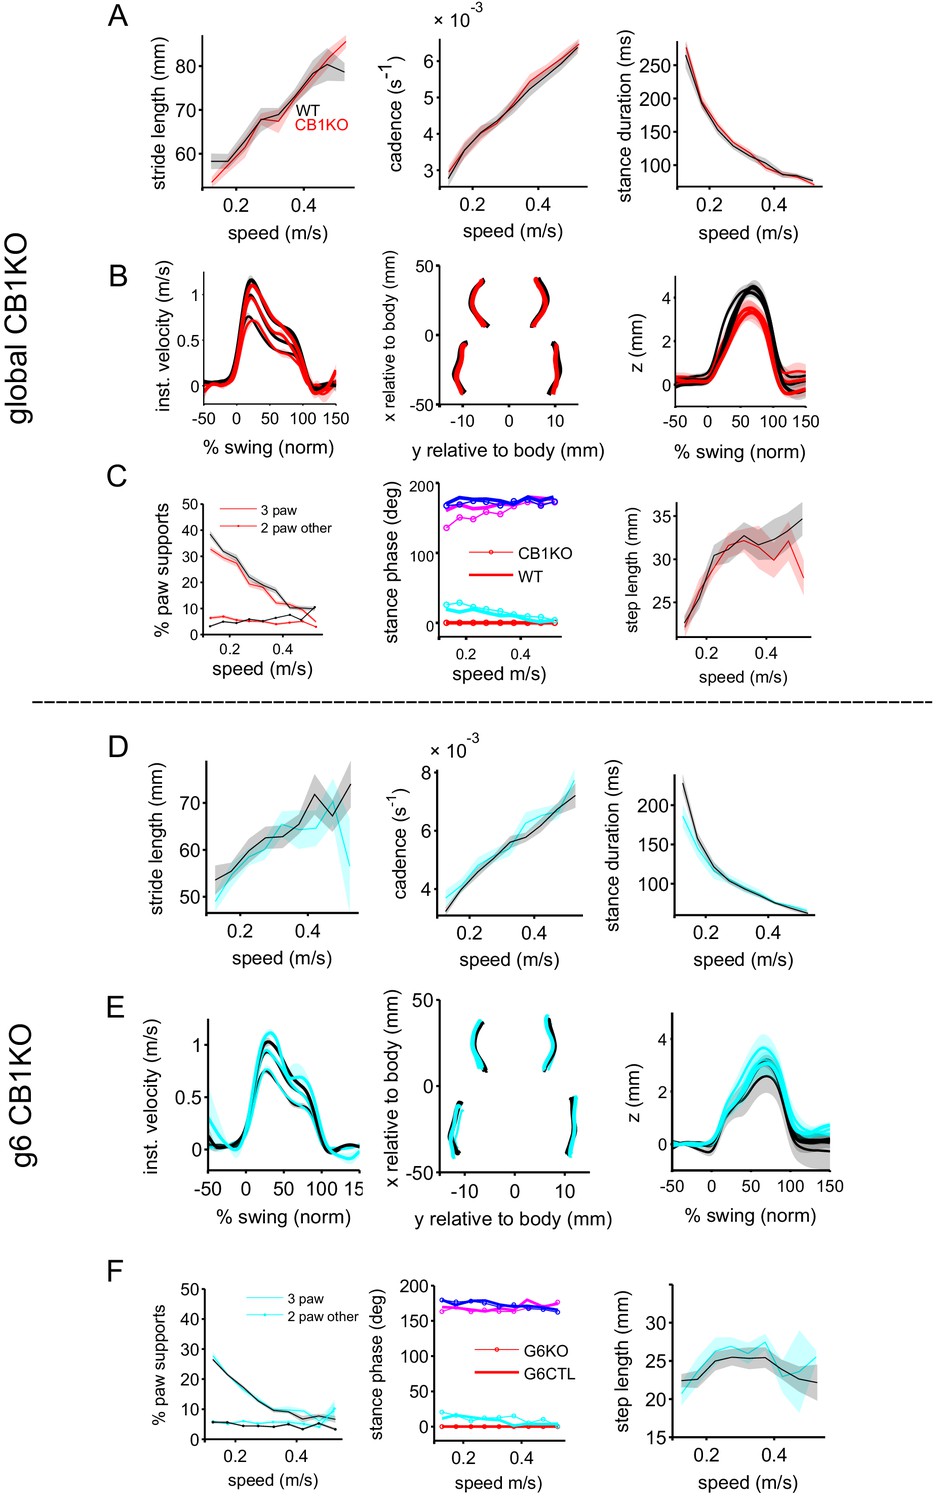
(A) Mean (+/- SEM) individual limb parameters stride length (left), cadence (middle) and stance duration as a function of walking speed for global CB1KO mice (N = 7) and their littermate controls (N = 7). (B) Average front limb paw trajectories during swing phases are plotted for forward (x) instantaneous velocity (left), side-to-side (y) movements relative to the body (center), and vertical (z) position (right). Thicker lines indicate faster walking speeds. (C) Measures of interlimb coordination. Left: Suppport patterns (the configuration of paws on the ground simultaneously) are typically dominated by 2-paw diagonal support configurations in mice. Here we plot the % of irregular paw supports, in which three paws and two non-diagonal (other) paws provide support, as a function of walking speed. Center: Relative phasing of foot touch-down for each paw (color-coded according to the inset), relative to the front, right reference limb (red). Thin lines and open circles represent CB1KO data. Right: step length (as in Figure 4E). (D–F) Same as (A–C) but for granule-cell-specific CB1KO mice (N = 4; cyan) and their littermate controls (N = 6; black/gray). See Methods and (Machado et al., 2015; Machado et al., 2020) for detailed gait parameter descriptions.
Figure 4—figure supplement 2
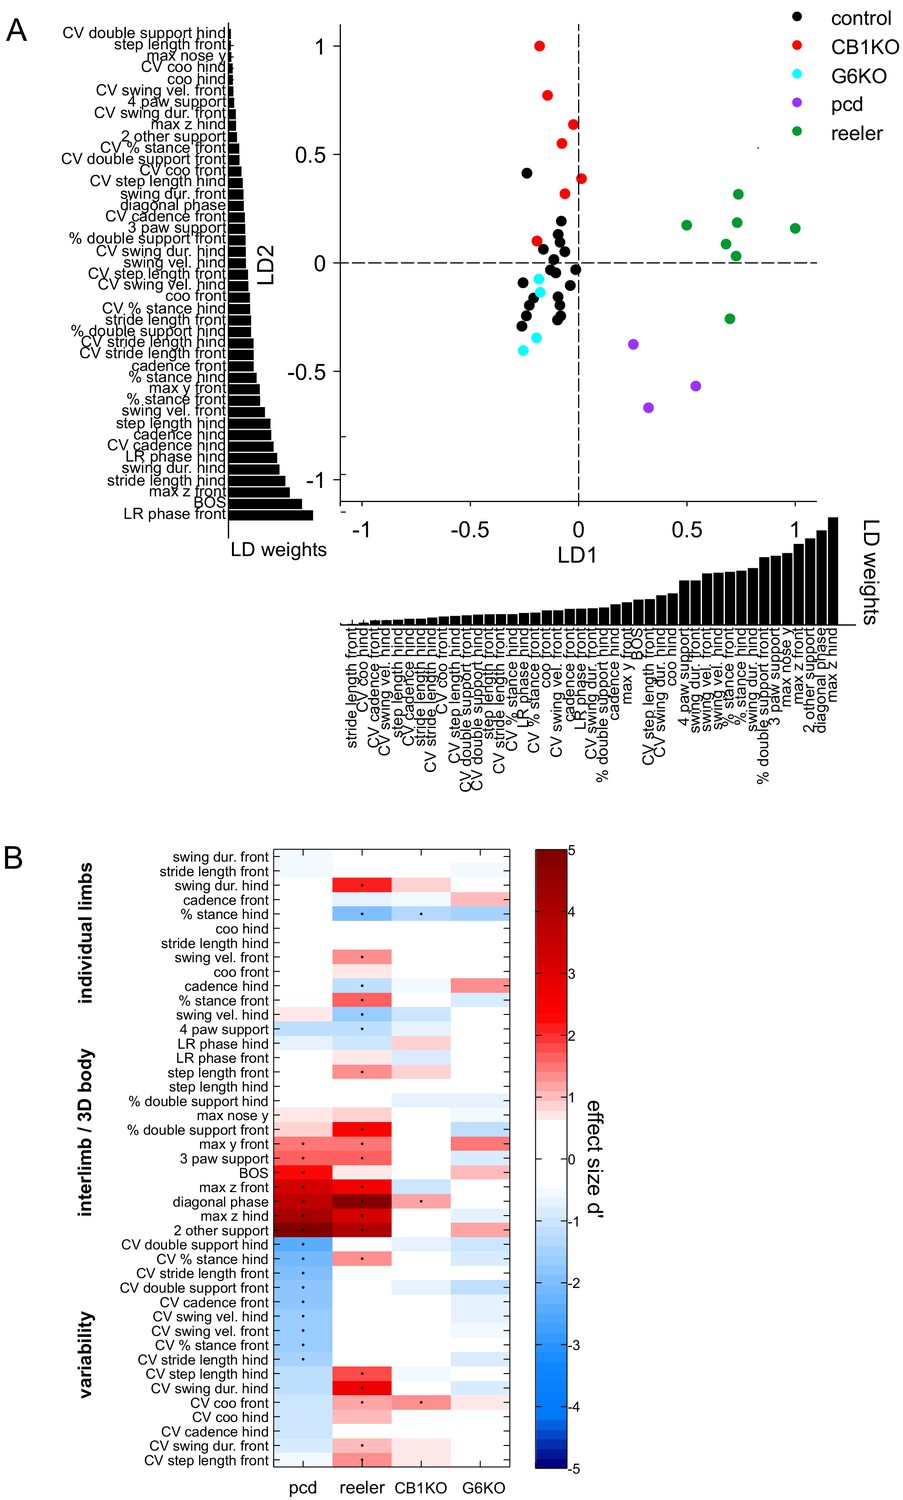
Linear discriminant analysis separates CB1KO mice from two mutants with cerebellar ataxia.
(A) Linear discriminant analysis (LDA) of locomotor parameters separates mutants with cerebellar ataxia (pcd and reeler) from global and cell-specific CB1KO and size-matched controls. For this analysis, we included 45 gait parameters describing the movement of individual limbs, interlimb coordination, body trajectories and variability (see Methods). Each dot represents the average over all analyzed strides of a single animal walking at a particular speed (0.2–0.25 m/s). Size and speed-matched controls for all groups are shown in black (N = 15), global CB1KO mice in red (N = 7), granule-cell-specific CB1 knockout mice (G6KO) in cyan (n = 4), reeler in green (N = 8) and pcd mutants in purple (N = 3). Bars underneath and next to the main axes represent the contribution scores (LD coefficients) of each locomotor parameter. (B) Magnitude of differences (Cohen’s d) compared to size-matched controls for gait parameters included in LDA across genotypes (pcd, reeler, G6KO and CB1KO). Black dots indicate significant differences (unpaired t-test). Mice with cerebellar ataxia show sig. differences variability, interlimb and body coordination (Machado et al., 2015; Machado et al., 2020). Global CB1KO mice showed sig. differences in % stance hind, diagonal phase and CV coo front. No significant differences were observed between G6KO and controls in any gait parameter included.
Figure 4—figure supplement 3
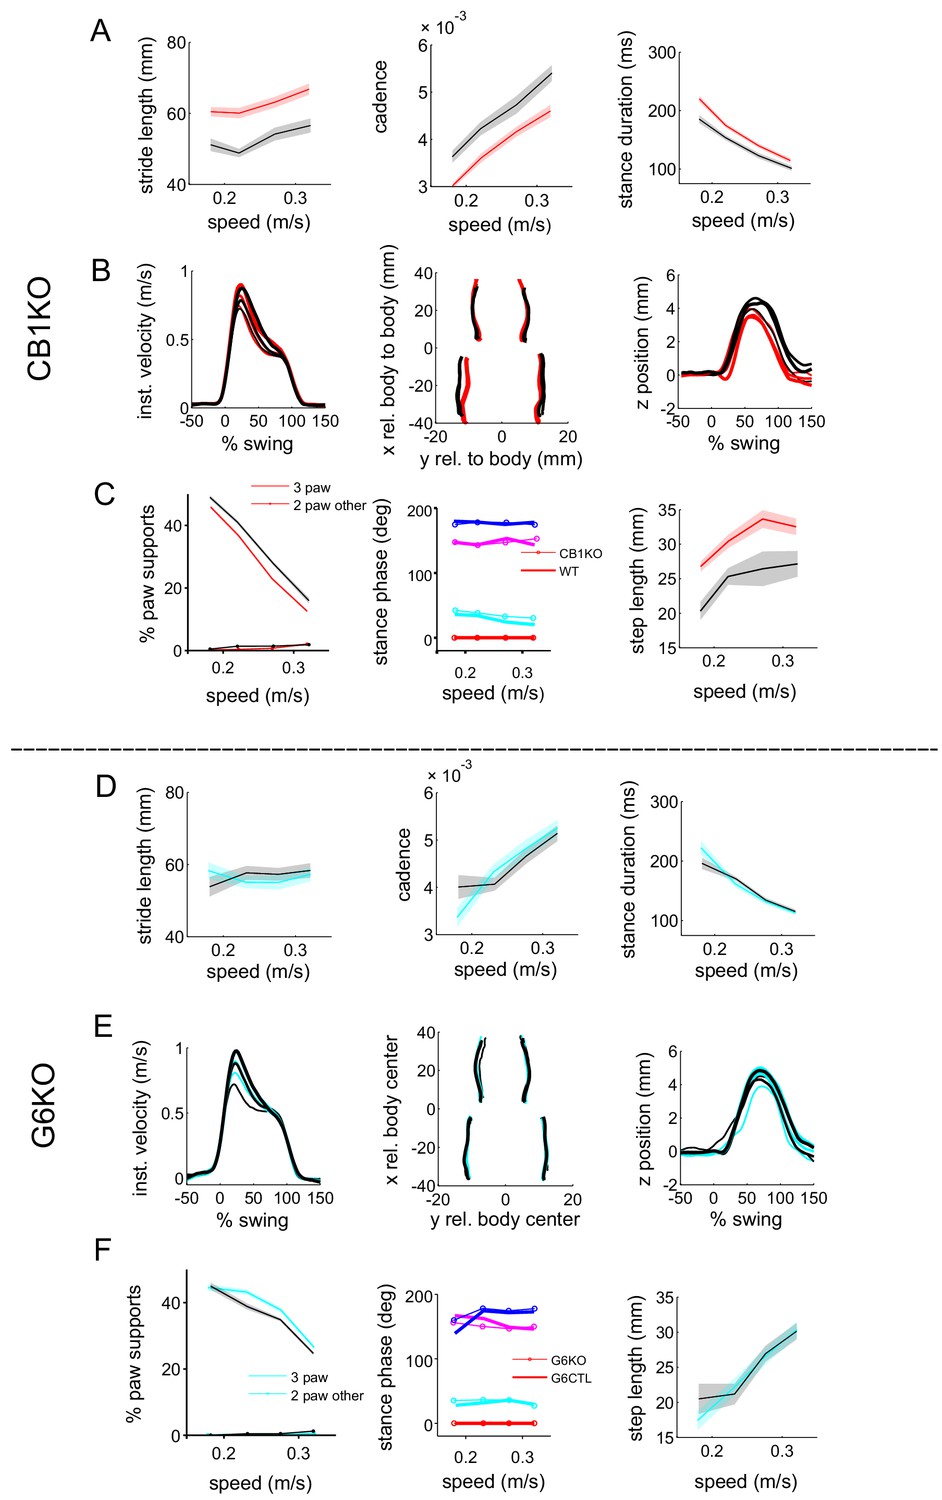
Analysis of treadmill locomotion in global and granule-cell-specific CB1KO mice.
(A) Mean (+/- SEM) individual limb parameters stride length (left), cadence (middle) and stance duration as a function of walking speed for global CB1KOs (N = 12; red) and their littermate controls (N = 8; black/gray). (B) Average front limb paw trajectories during swing phases are plotted for forward (x) instantaneous velocity (left), side-to-side (y) movements relative to the body (center), and vertical (z) position (right). Thicker lines indicate faster walking speeds. (C) Interlimb coordination. % of irregular paw supports (3 paws and two paw non-diagonal (other)), as a function of walking speed. Center: Relative phasing of foot touch-down for each paw (color-coded according to the inset), relative to the front, right reference limb (red). Thin lines and open circles represent CB1KO data. Right: step length (as in Figure 4E). (D–F) Same as A–C but for granule-cell-specific CB1KO mice (N = 8; cyan) and their littermate controls (N = 6; black/gray). See method for detailed gait parameter descriptions.
Videos
Video 1
Example movie of littermate control mouse (top) and global CB1KO mouse (bottom) walking on LocoMouse overground setup.
Video 2
Example movie of littermate control mouse (top) and global CB1KO mouse walking on LocoMouse treadmill during 'tied' belt condition (0.275 m/s).
Additional files
Download links
A two-part list of links to download the article, or parts of the article, in various formats.
Downloads (link to download the article as PDF)
Open citations (links to open the citations from this article in various online reference manager services)
Cite this article (links to download the citations from this article in formats compatible with various reference manager tools)
Cannabinoids modulate associative cerebellar learning via alterations in behavioral state
eLife 9:e61821.
https://doi.org/10.7554/eLife.61821


