Single-cell dynamics of pannexin-1-facilitated programmed ATP loss during apoptosis
- Graduate School of Biostudies, Kyoto University, Japan
- Graduate School of Engineering, Osaka University, Japan
- Department of Anatomy and Cell Biology, Schulich School of Medicine and Dentistry, University of Western Ontario, Canada
- Institute of Multidisciplinary Research for Advanced Materials, Tohoku University, Japan
Figures
Figure 1 with 3 supplements
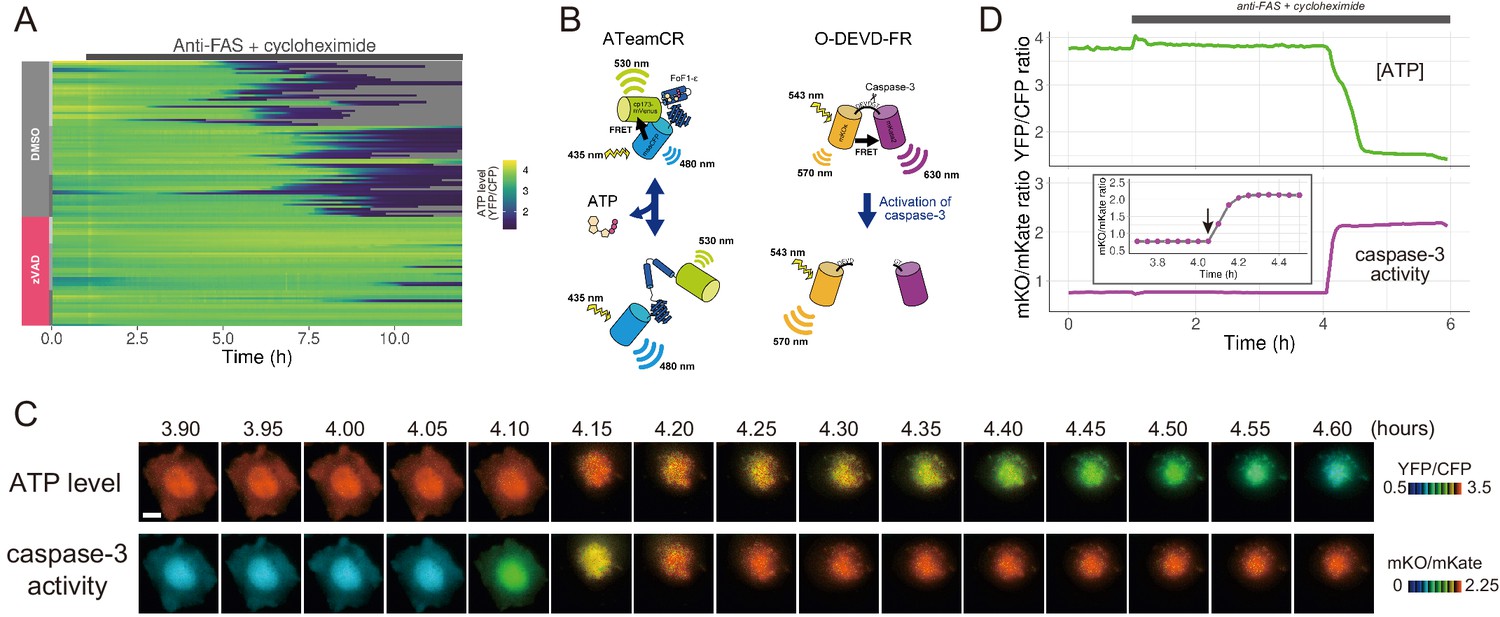
The initiation of cytosolic ATP decrease occurs almost simultaneously with that of caspase-3 activation.
(A) Single-cell ATP dynamics after anti-FAS treatment in the absence and the presence of zVAD-fmk. Each line represents the time course of the YFP/CFP ratio of AT1.03CR from a single cell (70 [DMSO] and 49 [zVAD] cells from three biological replicates). Cells were treated with anti-FAS and cycloheximide at time = 1.0 hr. DMSO (0.1%) or pan-caspase inhibitor zVAD-fmk (20 µM) was added just before the start of imaging experiment. (B) Schematic drawings of AT1.03CR and O-DEVD-FR. (C) Time-lapse images of the ATP level and caspase-3 activity of a single apoptotic HeLa cell expressing AT1.03CR and O-DEVD-FR. Pseudocolored ratio images of AT1.03CR are shown in the upper panel, and those of O-DEVD-FR are shown in the lower panel. Bar, 10 µm. (D) Time courses of ATP level and caspase-3 activity of a single apoptotic HeLa cell. YFP/CFP ratio of AT1.03CR and mKO/mKate ratio of O-DEVD-FR were shown in the upper and the lower panels, respectively. Arrow in the inset indicates the onset of caspase-3 activation. Fluorescence images were captured every 3 min.
Figure 1—figure supplement 1
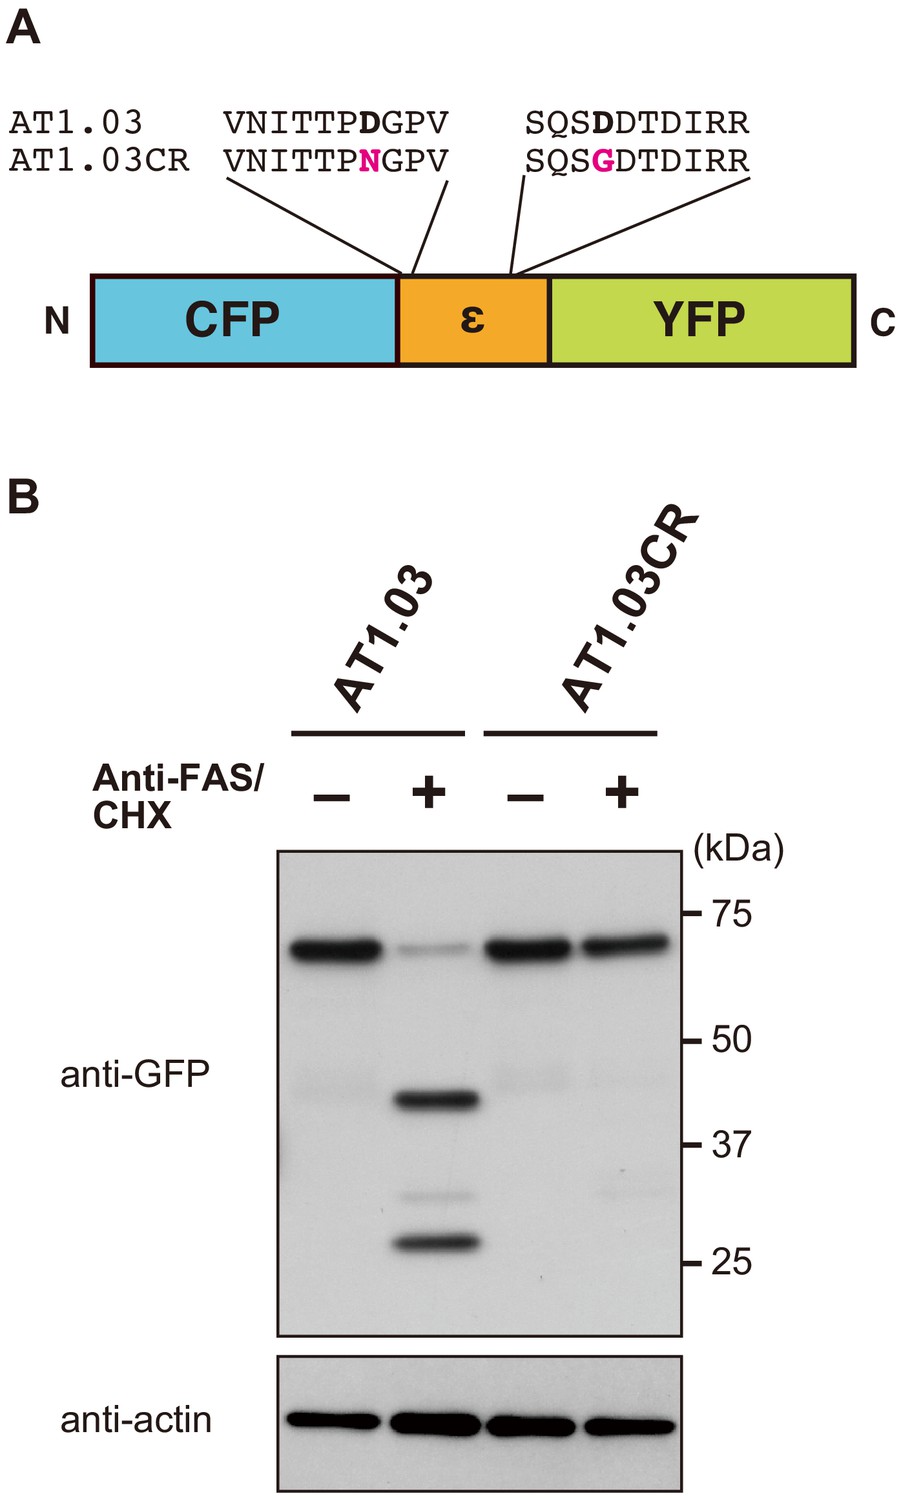
AT1.03CR, a caspase-resistant mutant of the FRET-based ATP biosensor ATeam.
(A) Schematic drawing of ATeam. An ATP binding protein (Bacillus subtilis FoF1-ATP synthase ε subunit) is sandwiched by CFP (mseCFP) and YFP (cp173-mVenus). Critical Asp residues (Asp-242 and Asp-339) within putative caspase-cleavage sequences within the original ATeam (AT1.03) were replaced by Asn and Gly, respectively. (B) Western blot analysis of the integrity of ATeam in apoptotic cells revealed that AT1.03CR was resistance to cleavage upon the initiation of apoptosis. HeLa cells expressing either AT1.03 or AT1.03CR were stimulated with anti-FAS and cycloheximide (CHX) to induce apoptosis. Cell lysates were analyzed by western blotting using an anti-GFP antibody.
Figure 1—figure supplement 2
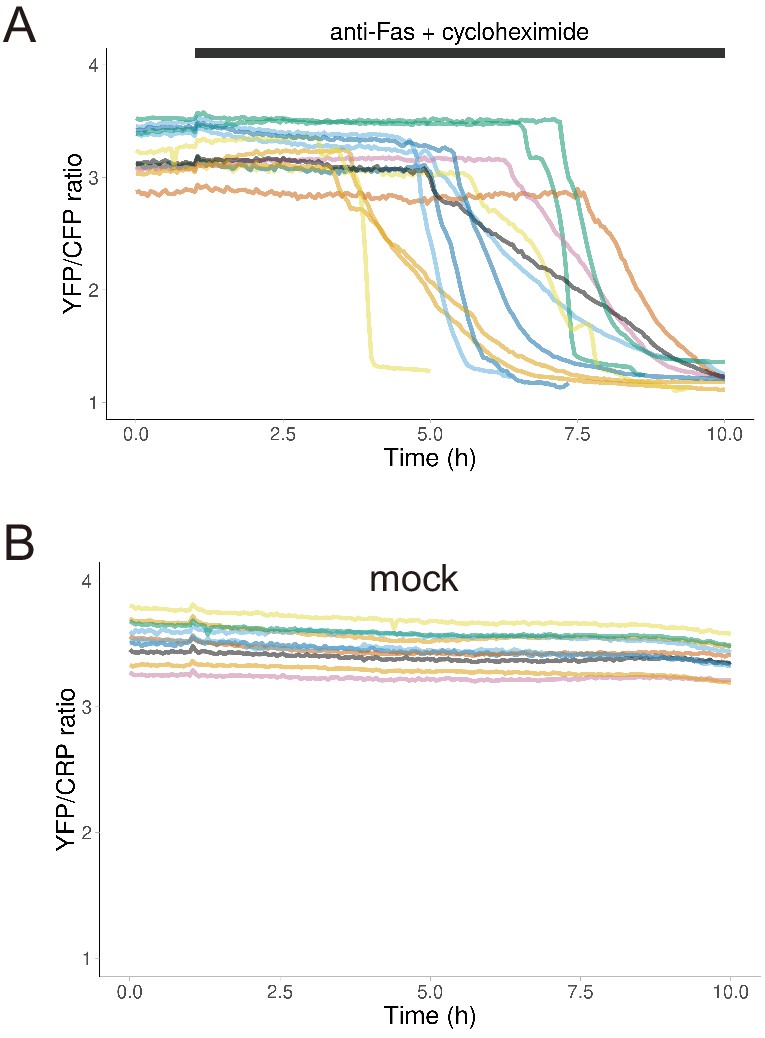
Dynamics of cytosolic ATP levels in individual apoptotic cells.
Each line represents the time course of the FRET/CFP ratio of AT1.03CR in a single apoptotic cell. Medium with (A) or without (B) anti-FAS and CHX was added at 1 hr after starting imaging. One data set out of three biological replicates are shown (13 cells for anti-FAS treatment and 10 cells for mock treatment).
Figure 1—figure supplement 3
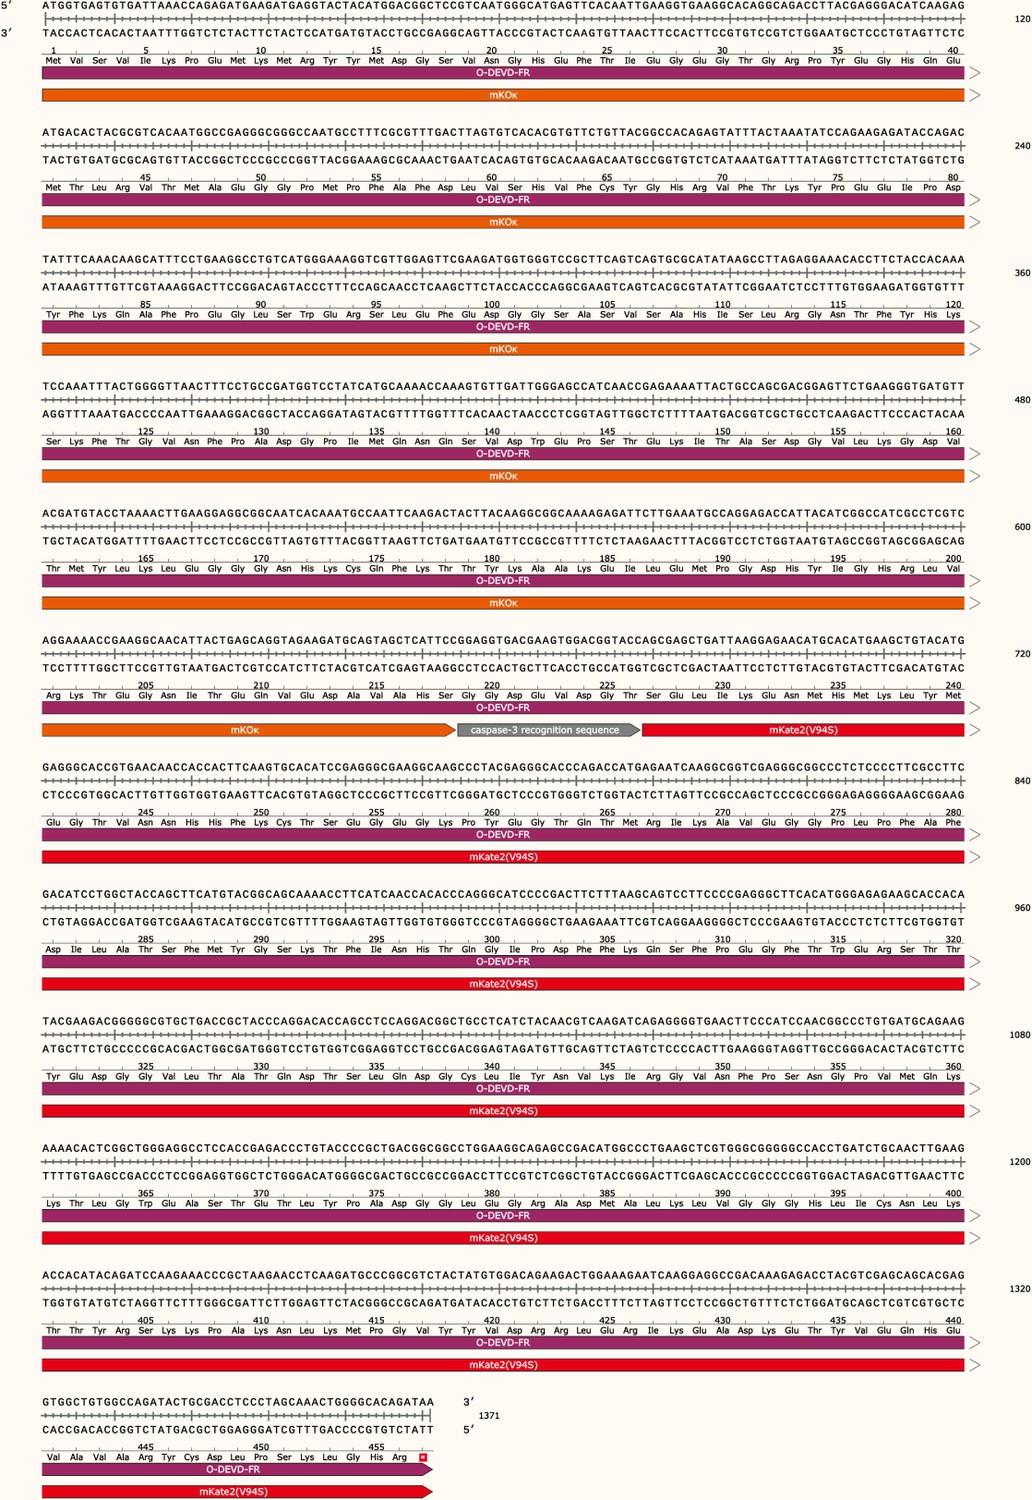
Nucleotide and amino acid sequences of O-DEVD-FR.
Figure 2 with 3 supplements
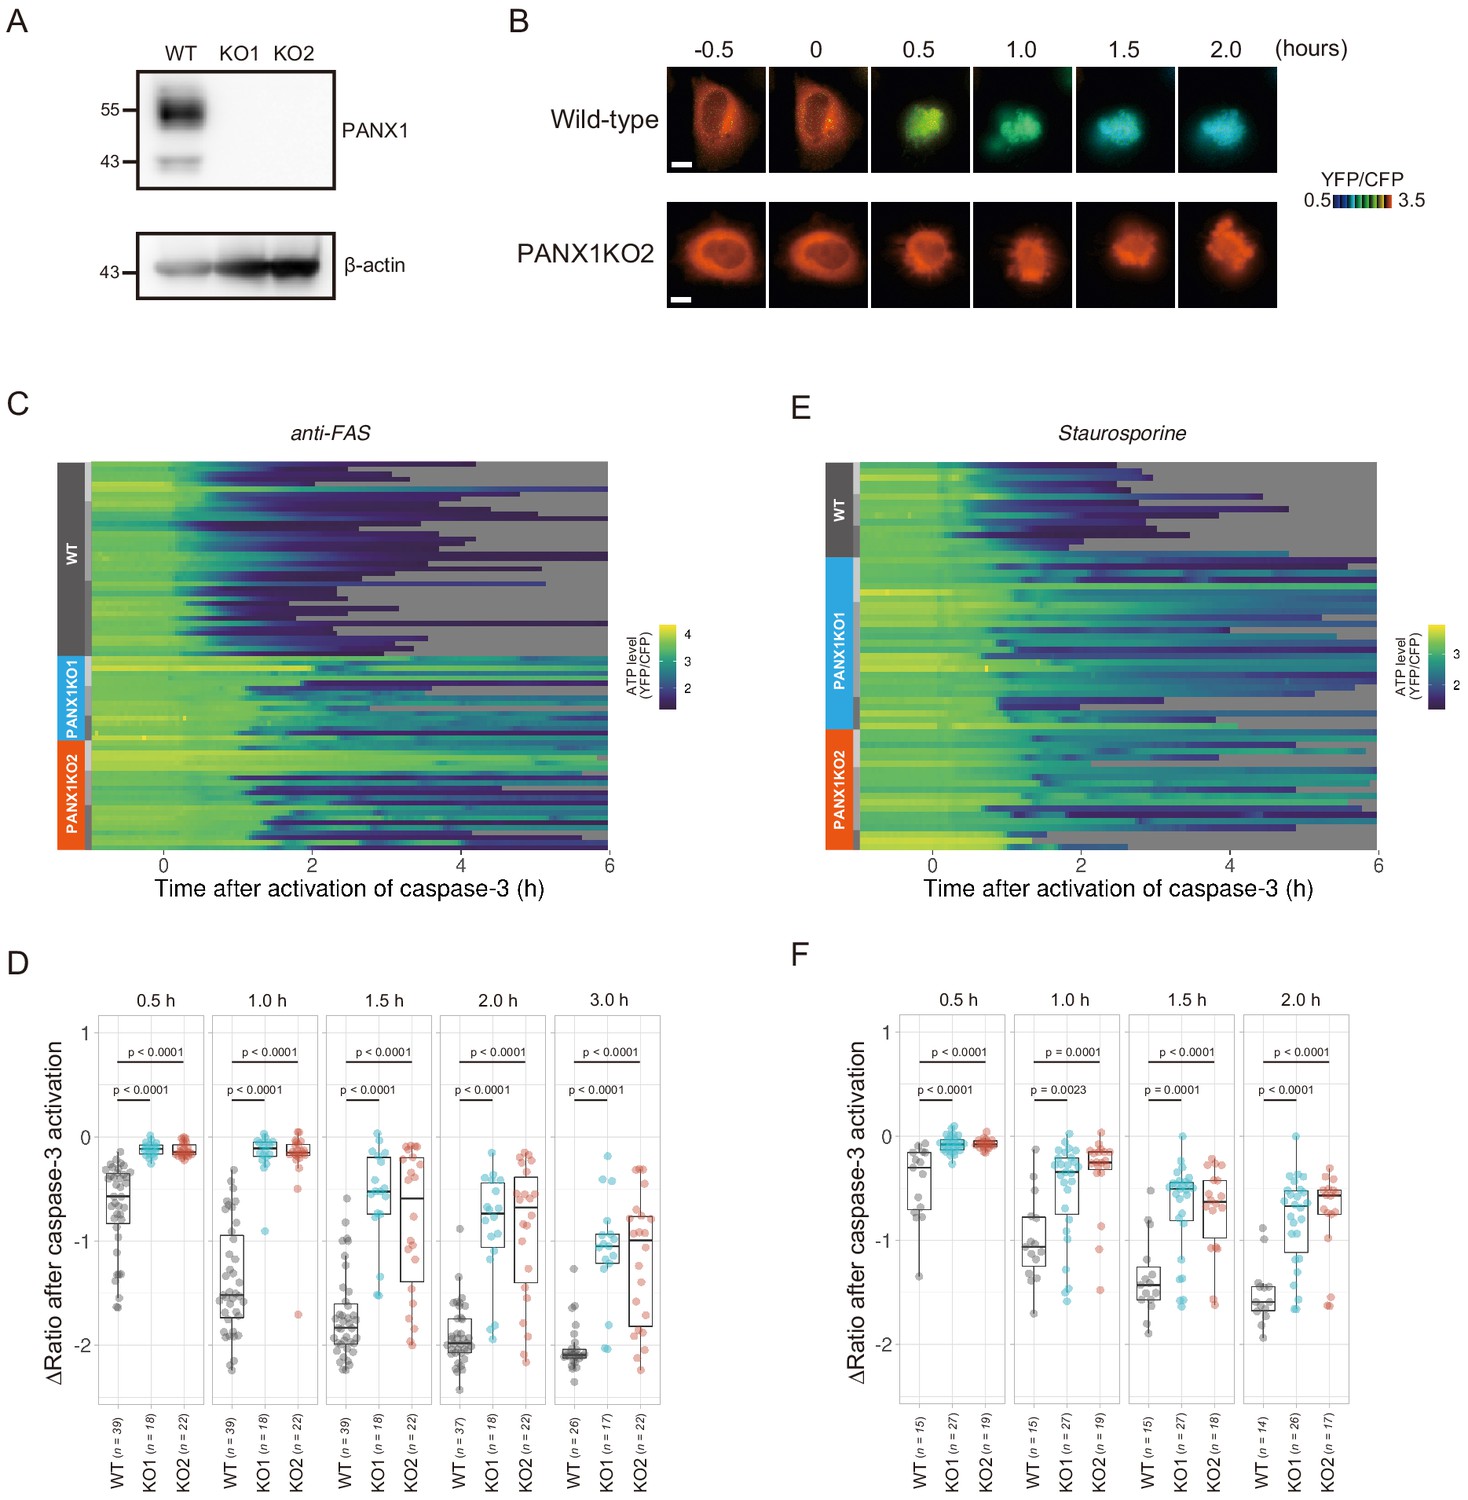
Knockout of PANX1 suppresses the cytosolic ATP decrease during apoptotic progression.
(A) Western blot analysis of PANX1 expression of wild-type and PANX1-KO HeLa cells. (B) Time-lapse images of the ATP level of a wild-type cell and a PANX1-KO cell. Pseudocolored ratio images of AT1.03CR are shown. Apoptosis was induced by anti-FAS and cycloheximide. The onset of caspase-3 activation was set as time = 0. Bar, 10 µm. (C, E) Single cell ATP dynamics of wild-type and PANX1-KO cells during apoptosis. Apoptosis was induced by anti-FAS and cycloheximide (C; 39 [WT], 18 [PANX1-KO1] and 22 [PANX1-KO2] cells from three biological replicates), or staurosporine (E; 15 [WT], 27 [PANX1-KO1] and 19 [PANX1-KO2] cells from three biological replicates). Each line represents the time course of the YFP/CFP ratio of AT1.03CR from a single cell, and was adjusted by setting the onset of caspase-3 activation as time = 0. Traces from different replicates were labeled with bars of different shades. (D, F) Effect of PANX1 knockout on the decrease in cytosolic ATP levels. Changes in YFP/CFP ratios at indicated time after the onset of caspase-3 activation were calculated for each apoptotic cell. Apoptosis was induced by anti-FAS and cycloheximide (D), or staurosporine (F). Analysis of variance (ANOVA) followed by post-hoc Dunnett’s test (versus wild-type).
Figure 2—figure supplement 1
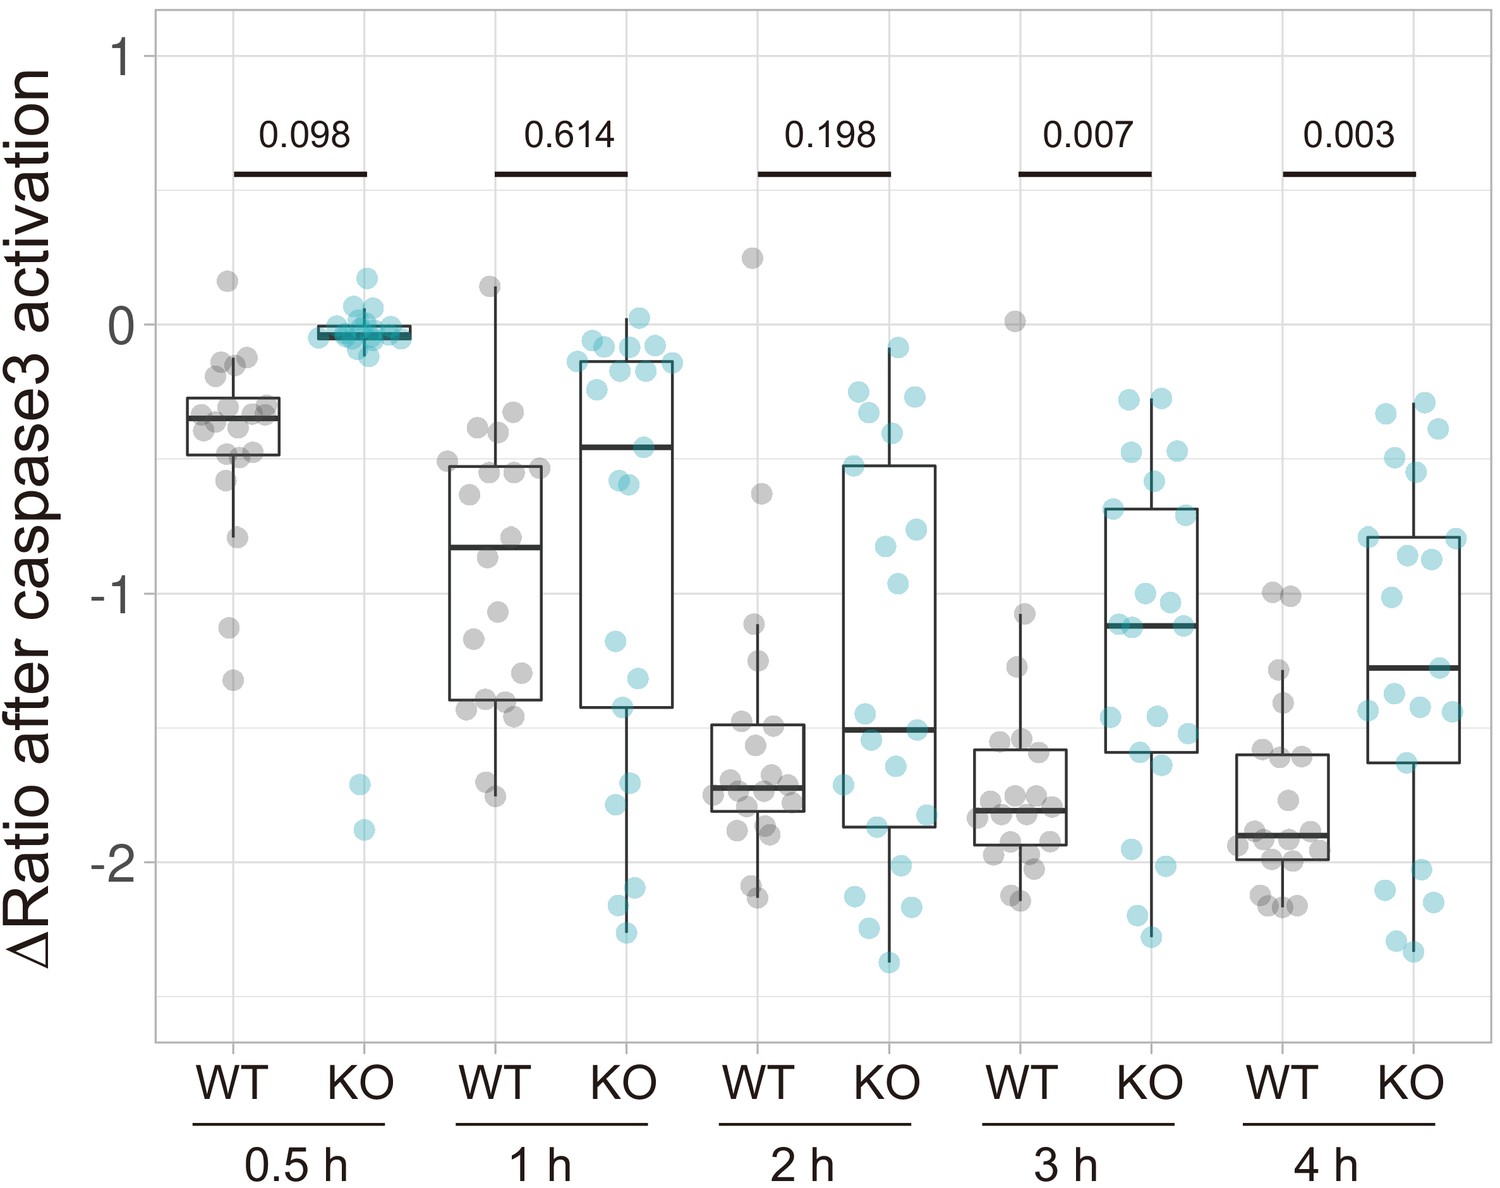
Knockout of PANX1 suppresses the cytosolic ATP decrease of SW480 cells during apoptosis.
Apoptosis of wild-type and PANX1-KO SW480 cells expressing AT1.03CR and O-DEVD-FR were induced by TRAIL. Changes in YFP/CFP ratios at indicated time after the onset of caspase-3 activation were calculated for each apoptotic cell (20 [WT] and 21 [PANX1-KO] cells from three biological replicates). P-values of Student’s t-test were shown.
Figure 2—figure supplement 2
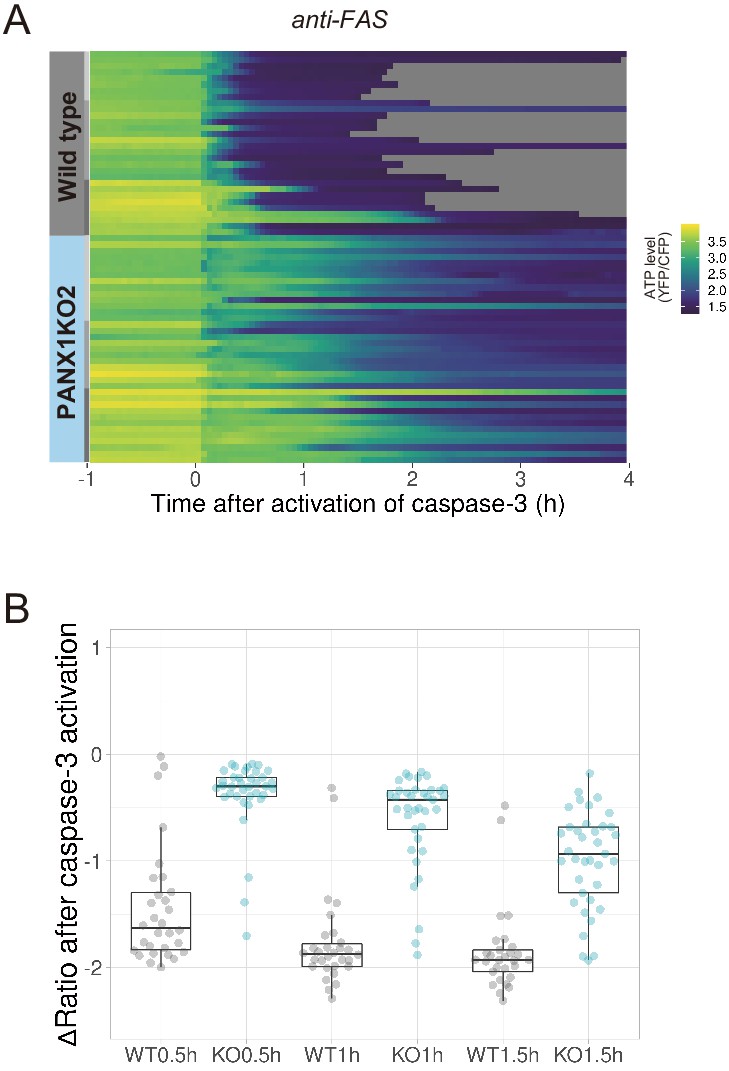
PANX1 knockout significantly suppresses the decrease in cytosolic ATP levels of apoptotic HeLa cells in an OXPHOS-dependent culture condition.
HeLa cells were cultured in glucose-free DMEM supplemented with 10% fetal bovine serum (FBS), 10 mM lactate and 10 mM DCA. Apoptosis was induced with anti-FAS/CHX. (A) Each line represents the YFP/CFP ratio of AT1.03CR from a single apoptotic cell, and was adjusted by setting the onset of caspase-3 activation as time = 0 (30 [WT] and 37 [PANX1KO2] cells from three biological replicates). (B) Effect of PANX1-KO on the decrease in cytosolic ATP levels. Changes in YFP/CFP ratios at indicated time after the onset of caspase-3 activation were calculated for each apoptotic cell. Apoptosis was induced by anti-FAS and cycloheximide.
Figure 2—figure supplement 3
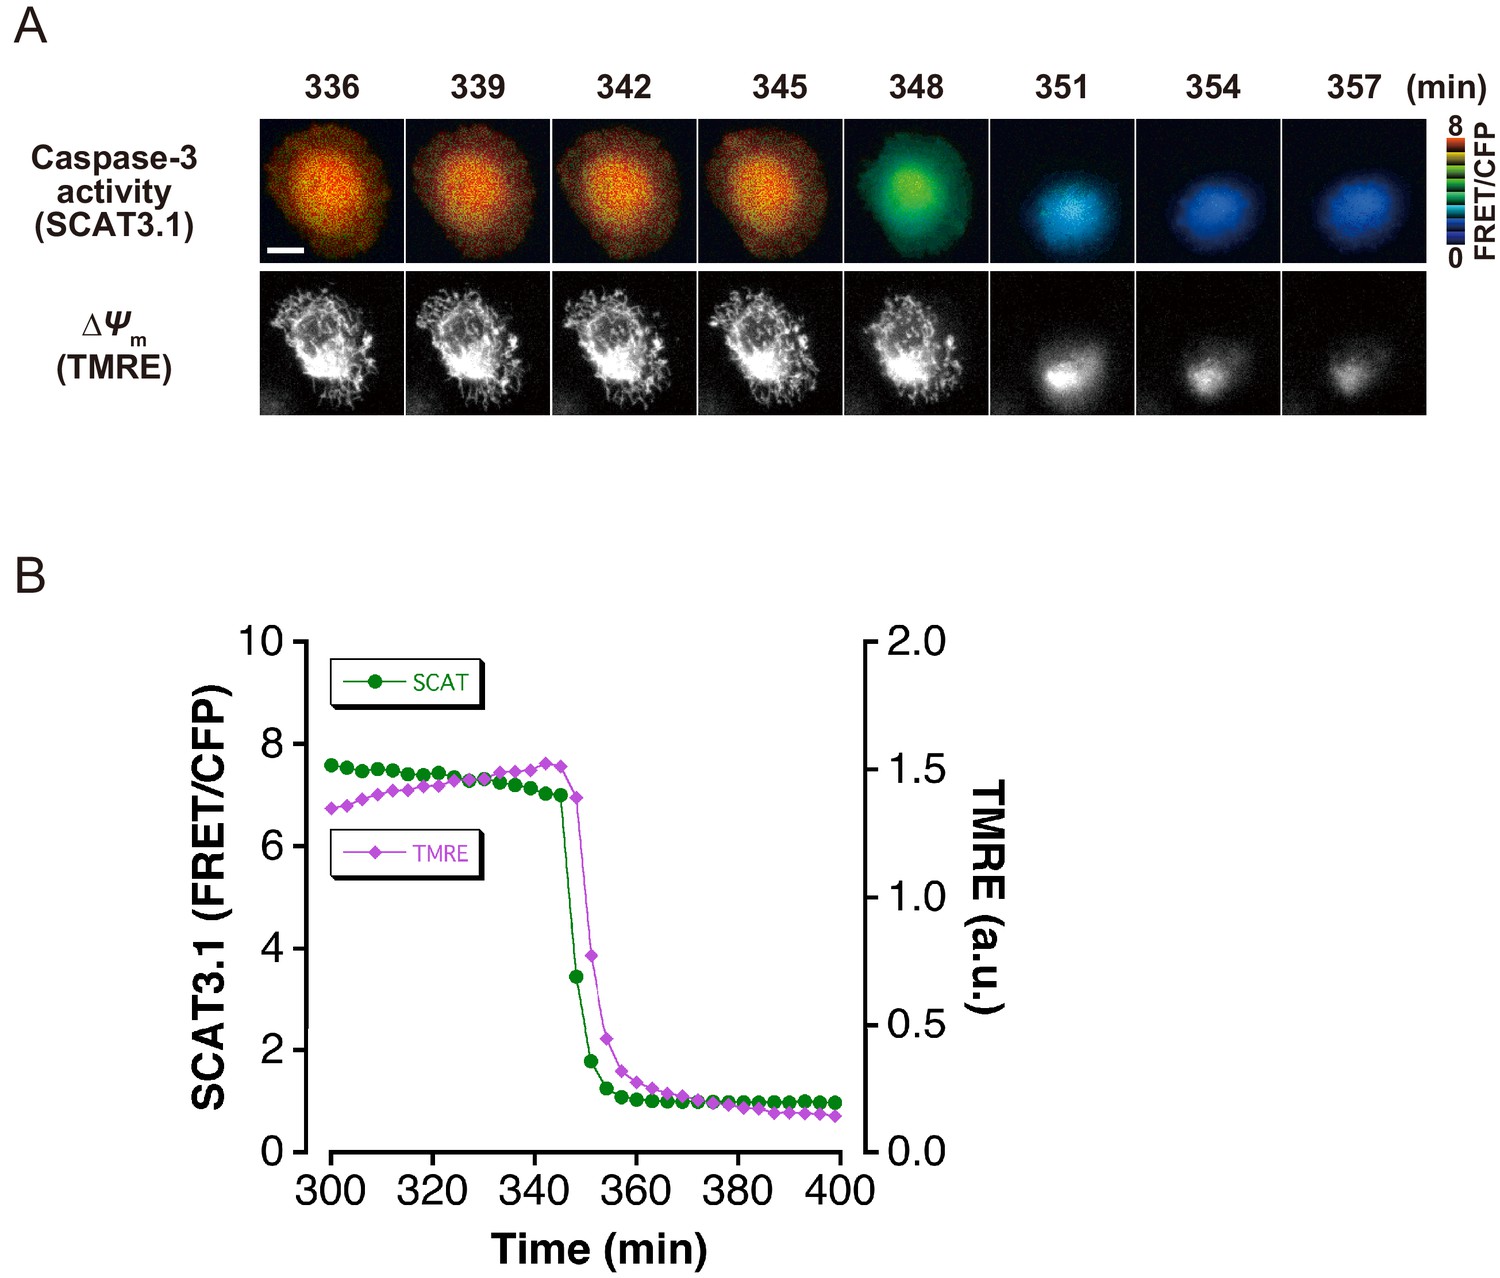
The initiation of caspase-3 activation occurs almost simultaneously with mitochondrial membrane potential loss.
(A) Time-lapse images of caspase-3 activity and mitochondrial membrane potential (∆Ψm) of a representative single apoptotic cell. Fluorescence images of a HeLa cell, which expressed SCAT3.1 and which was loaded with TMRE, were captured every 3 min. Imaging was initiated 30 min after induction of apoptosis with anti-FAS antibody/CHX. Pseudocolored FRET/CFP ratio images of SCAT3.1 are shown in the upper panel, and TMRE images are shown in the lower panel. Bar, 10 µm. (B) Representative time course of the cytosolic ATP level and ∆Ψm of a single apoptotic cell. Quantified FRET/CFP ratio (green circle, left axis) and TMRE fluorescence intensity (magenta triangle, right axis) from the apoptotic cell in (A) are shown.
Figure 3
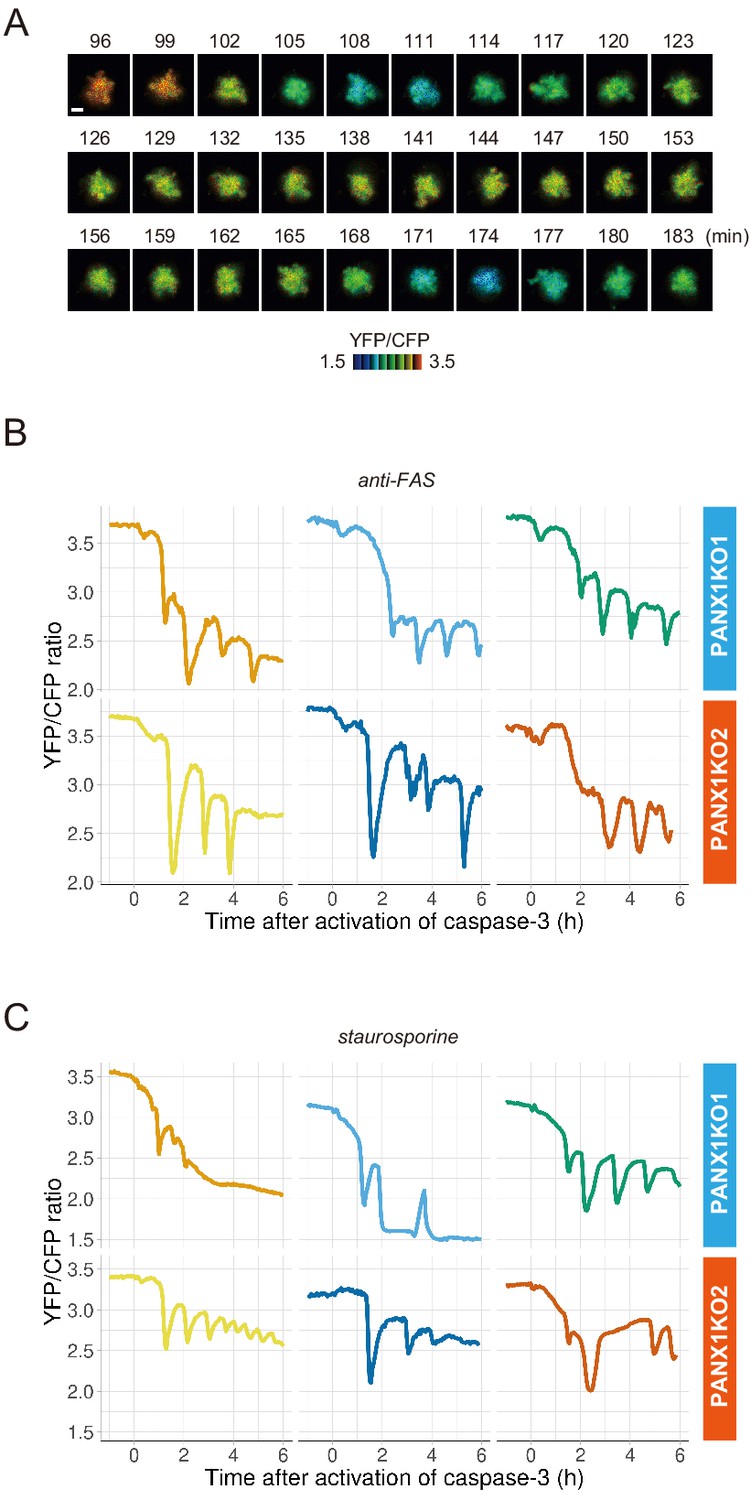
PANX1 knockout cells show fluctuations of cytosolic ATP levels after the activation of caspase-3.
(A) Fluctuation of cytosolic ATP level of a PANX1-KO2 cell. Pseudocolored YFP/CFP ratio images of AT1.03CR are shown. Apoptosis was induced by anti-FAS and cycloheximide. Bar, 10 µm. (B, C) Representative traces of YFP/CFP ratios of AT1.03CR from single PANX1-KO cells from three biological replicates are shown. Apoptosis was induced by anti-FAS and cycloheximide (B), or staurosporine (C). Each trace was adjusted by setting the onset of caspase-3 activation as time = 0.
Figure 4
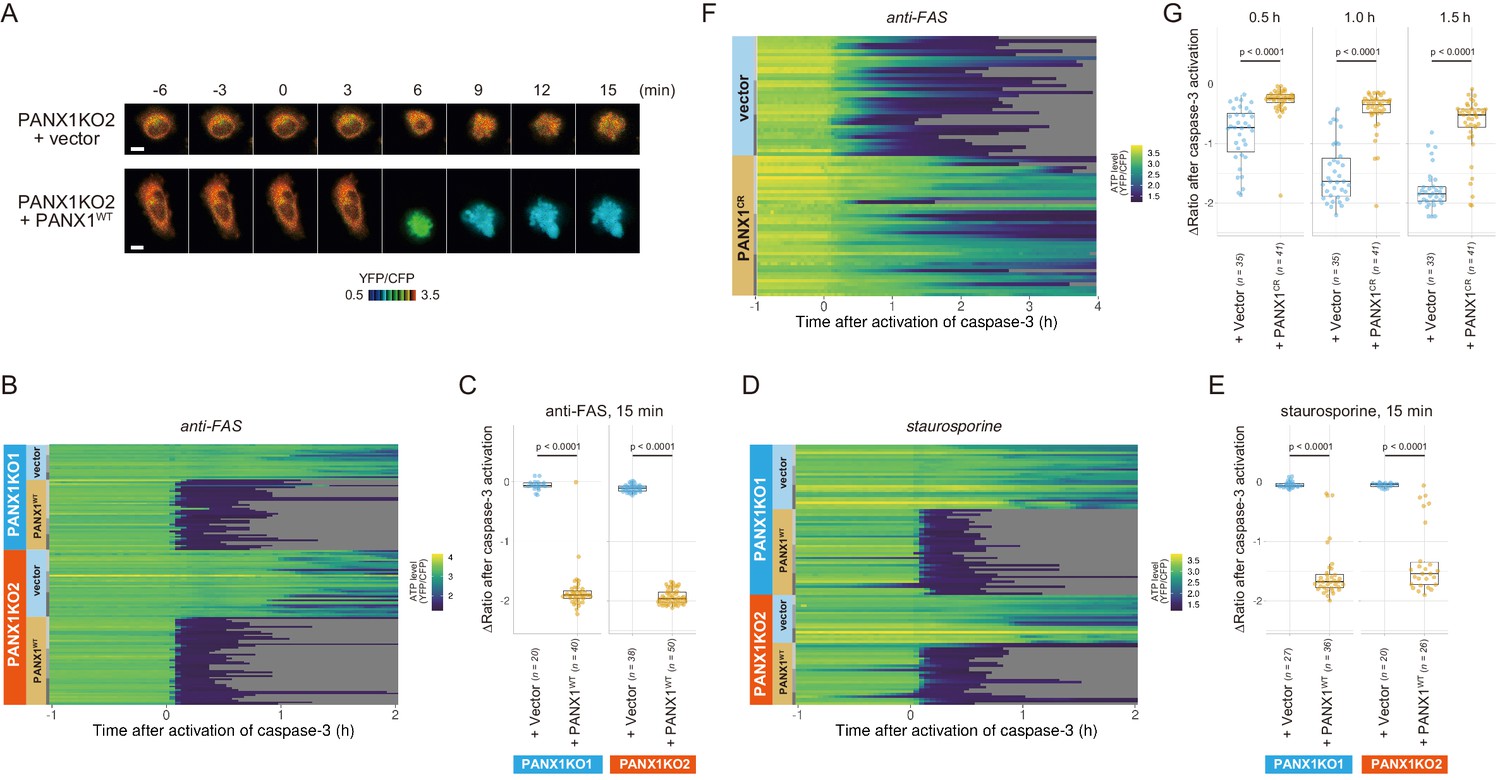
Exogenous expression of PANX1 alters cytosolic ATP dynamics of apoptotic cells.
(A) Time-lapse images of the ATP level of PANX1-KO2 cells. Cells were transfected with either an empty vector (upper) or a vector expressing wild-type PANX1 (PANX1WT) (lower). Pseudocolored ratio images of AT1.03CR are shown. (B, D) Single-cell ATP dynamics of PANX1-KO cells expressing exogenous PANX1WT. Cells were transfected with either an empty vector or a vector expressing PANX1WT. Apoptosis was induced by either anti-FAS and cycloheximide (B; 20 [PANX1-KO1 + vector], 40 [PANX1-KO1 + PANX1WT], 38 [PANX1-KO2 + vector] and 50 [PANX1-KO2 + PANX1WT] cells from three biological replicates), or staurosporine (D; 27 [PANX1-KO1 + vector], 36 [PANX1-KO1 + PANX1WT], 20 [PANX1-KO2 + vector] and 26 [PANX1-KO2 + PANX1WT] cells from three biological replicates). Each line represents the time course of the YFP/CFP ratio of AT1.03CR from a single cell, and was adjusted by setting the onset of caspase-3 activation as time = 0. (C, E) Effect of exogenous expression of PANX1WT on the decrease in cytosolic ATP levels. Changes in YFP/CFP ratios for 15 min after the onset of caspase-3 activation were calculated for each apoptotic cell. Apoptosis was induced by anti-FAS and cycloheximide (C), or staurosporine (E). Student’s t-test. (F) Single-cell ATP dynamics of wild-type cells exogenously expressing a caspase-resistant mutant of PANX1. Wild-type HeLa cells were transfected with either an empty vector or a vector expressing a caspase-resistant mutant of PANX1 (PANX1CR). Apoptosis was induced by anti-FAS and cycloheximide. Each line represents the time course of the YFP/CFP ratio of AT1.03CR from a single cell, and was adjusted by setting the onset of caspase-3 activation as time = 0 (35 [vector] and 41 [PANX1CR] cells from three biological replicates). (G) Effect of exogenous expression of PANX1CR on the decrease in cytosolic ATP levels. Changes in YFP/CFP ratios at indicated time after the onset of caspase-3 activation were calculated for each apoptotic cell. Apoptosis was induced by anti-FAS and cycloheximide. P-values of Student’s t-test are shown.
Figure 5
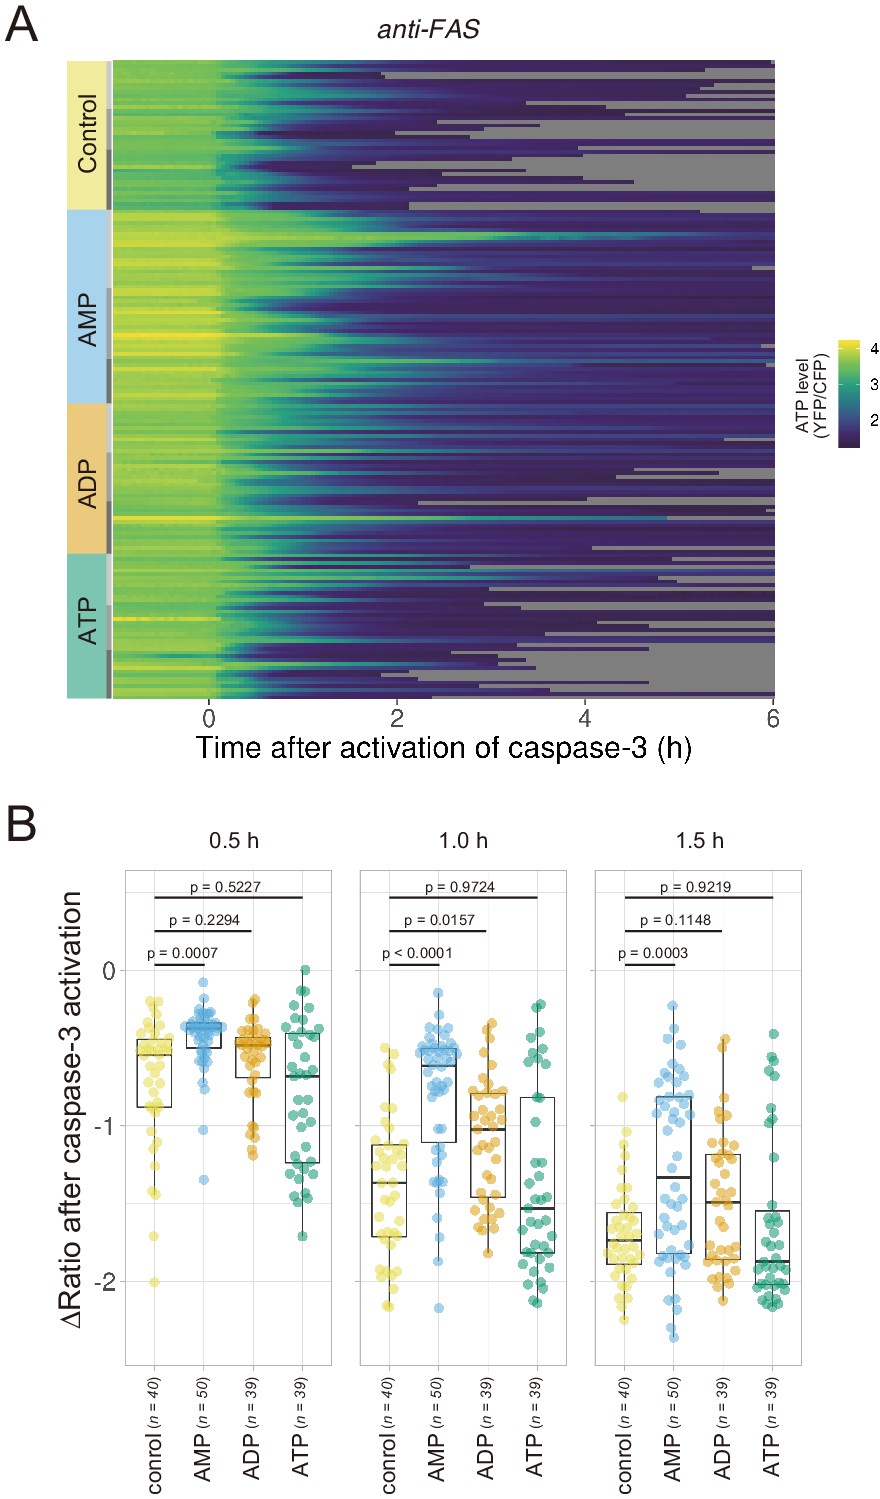
Extracellular AMP counteracts the decrease in the cytosolic ATP level of apoptotic cells.
Wild-type HeLa cells expressing AT1.03CR and O-DEVD-FR were imaged in the presence of an adenine nucleotide (1 mM) in the culture medium. Apoptosis was induced by anti-FAS and cycloheximide. (A) Each line represents the YFP/CFP ratio of AT1.03CR from a single apoptotic cell, and was adjusted by setting the onset of caspase-3 activation as time = 0 (40 [control], 50 [AMP], 39 [ADP] and 39 [ATP] cells from three biological replicates). (B) Effect of the addition of extracellular nucleotide on the decrease in cytosolic ATP levels. Changes in FRET/CFP ratios at 0.5, 1.0, and 1.5 hr after the caspase-3 activation were calculated for each apoptotic cell. ANOVA followed by post-hoc Dunnett’s test (versus control).
Figure 6

PANX1 regulates the cytosolic free Mg2+ level, but not the externalization of phosphatidylserine, in apoptotic cells.
(A) HeLa cells expressing Halo-tag were loaded with Halo-TMR and a magnesium indicator MGH(AM), followed by induction of apoptosis. Each trace represents a time course of normalized MGH/TMR fluorescence ratios of individual cell from three biological replicates. Timing of the initiation of cell shrinkage was defined as time = 0. Reddish and bluish traces represent wild-type cells (n = 22) and PANX1-KO2 cells (n = 20), respectively, from three biological replicates. Traces from different biological replicates were shown in different color codes. (B) Apoptosis of HeLa cells was induced by anti-FAS and cycloheximide in the presence of Alexa647-annexinV and propidium iodide. Fluorescence intensity of Alexa647-annexinV of each cell that does not show propidium iodide fluorescence was quantified using a fluorescent microscopy at 6 hr after induction of apoptosis (359 [WT] and 322 [PANX1-KO2] cells from three biological replicates).
-
Figure 6—source data 1
Numerical data used for panel B.
- https://cdn.elifesciences.org/articles/61960/elife-61960-fig6-data1-v2.xlsx
Figure 7

PANX1 is required for suppressing consumption of glucose by apoptotic cells.
(A–D) Effect of metabolic inhibitors on cytosolic ATP of apoptotic cells. Apoptosis of PANX1-KO2 cells expressing AT1.03CR and O-DEVD-FR were induced by anti-FAS and cycloheximide. After activation of caspase-3, the cells were untreated (A) or treated either with 10 mM 2-deoxyglucose (B), 50 mM sodium oxamate (C), or 1 µg/ml oligomycin A. Each trace represents the YFP/CFP ratio of AT1.03CR from a single apoptotic cell, and was adjusted by setting the onset of caspase-3 activation as time = 0. A period of inhibitor treatment was indicated as a bar on each plot. Representative traces from three biological replicates are shown. (E) Glycolytic activity of living wild-type and PANX1-KO cells. Consumption of glucose (left) and release of lactate (right) in 8 hr is shown. (F–G) Glycolytic activity of apoptotic cells. Apoptosis was induced either by anti-FAS/cycloheximide (left) or ultraviolet (right) at time = 0. Consumed glucose (F) and released lactate (G) by wild-type Hela cells (black, dashed line) and PANX1-KO2 cells (red, solid line) are shown. Means ± s.d. (three biological replicates) and p-values of paired t-test were shown (E–G).
-
Figure 7—source data 1
Numerical data used for panel E.
- https://cdn.elifesciences.org/articles/61960/elife-61960-fig7-data1-v2.xlsx
-
Figure 7—source data 2
Numerical data used for panel F.
- https://cdn.elifesciences.org/articles/61960/elife-61960-fig7-data2-v2.xlsx
-
Figure 7—source data 3
Numerical data used for panel G.
- https://cdn.elifesciences.org/articles/61960/elife-61960-fig7-data3-v2.xlsx
Figure 8
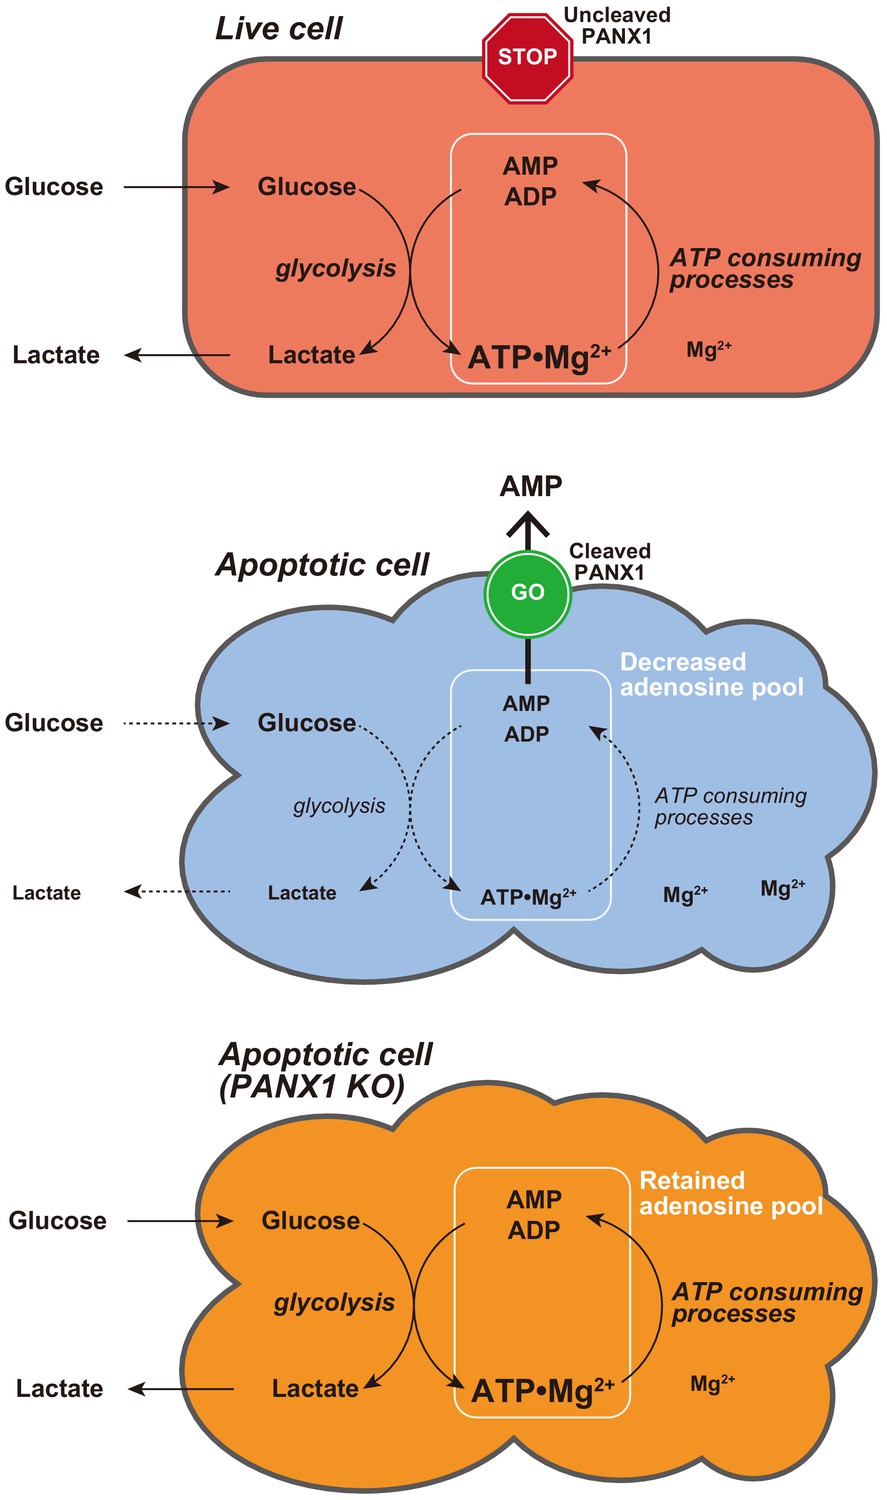
Proposed model for PANX1-dependent control of the cytosolic ATP level and glucose consumption of apoptotic cells.
Videos
Video 1
Time-lapse fluorescent movie of an apoptotic wild-type HeLa cell.
YFP (FRET) fluorescence from ATeam is shown. Apoptosis was induced by anti-FAS and cycloheximide. Time = 0 indicates the onset of caspase-3 activation.
Video 2
Time-lapse fluorescent movie of an apoptotic PANX1-KO HeLa cell.
The same experimental conditions as Figure 1—figure supplement 1.
Video 3
Time-lapse florescent movie of an untreated apoptotic PANX1-KO HeLa cell.
Apoptosis was induced by anti-FAS and cycloheximide. Time = 0 indicates the onset of caspase-3 activation.
Video 4
Time-lapse fluorescent movie of a 2DG-treated apoptotic PANX1-KO HeLa cell.
Apoptosis was induced by anti-FAS and cycloheximide. Time = 0 indicates the onset of caspase-3 activation. 2DG was added between 60 and 63 min.
Tables
Key resources table
| Reagent type (species) or resource | Designation | Source or reference | Identifiers | Additional information |
|---|---|---|---|---|
| Cell line (H.sapiens) | HeLa | Shin Yonehara Lab | Authenticated by STR profiling; mycoplasma tested | |
| Cell line (H.sapiens) | HeLa-PANX1-KO1 | This study | PANX1-knockout line | |
| Cell line (H.sapiens) | HeLa-PANX1-KO2 | This study | PANX1-knockout line | |
| Cell line (H.sapiens) | SW480 | ATCC | ATCC: CCL-228; RRID:CVCL_0546 | |
| Cell line (H.sapiens) | SW480-PANX1-KO | This study | PANX1-knockout line | |
| Antibody | anti-FAS (Mouse monoclonal) | Molecular biology laboratory | Cat. #:SY-001, RRID:AB_591016 | |
| Antibody | anti-His tag (Mouse monoclonal) | R and D Systems | Cat. #: MAB050-100 | |
| Antibody | anti-PANX1 (Rabbit monoclonal) | Cell Signalling | Cat# 91137, RRID:AB_2800167 | WB (1:1000) |
| Antibody | HRP-conjugated anti-β-actin (Mouse monoclonal) | Santa Cruz Biotechnology | Cat# sc-47778 HRP, RRID:AB_2714189 | WB (1:1000) |
| Recombinant DNA reagent | pcDNA3.1-AT1.03 (plasmid) | Imamura et al., 2009 | Original ATP biosensor | |
| Recombinant DNA reagent | pcDNA3.1-AT1.03CR (plasmid) | This paper | Caspase-resistant ATP biosensor | |
| Recombinant DNA reagent | pcDNA3.1-O-DEVD-FR (plasmid) | This paper | Caspase-3 biosensor | |
| Recombinant DNA reagent | IRAK027A14 (plasmid) | Riken Bioresource Center | Cat. #: HGX010814 | Human pannexin-1 cDNA clone |
| Recombinant DNA reagent | pIRES2-Sirius (plasmid) | This paper | ||
| Recombinant DNA reagent | pIRES2-Sirius-PANX1 (plasmid) | This paper | Wild-type human PANX1 | |
| Recombinant DNA reagent | pIRES2-Sirius-PANX1CR (plasmid) | This paper | Caspase-resistant human PANX1 mutant | |
| Recombinant DNA reagent | pcDNA4-SCAT3.1 (plasmid) | Nagai and Miyawaki, 2004 | Caspase-3 biosensor | |
| Recombinant DNA reagent | Pannexin-1 CRISPR/Cas9 KO Plasmid (h) | Santa Cruz Biotechnology | Cat. #: sc-401635 | |
| Peptide, recombinant protein | TRAIL, human | R and D Systems | Cat. #: 375-TL-010 | |
| Commercial assay or kit | Glucose CII-test Wako | Wako Pure Chemicals | Cat. #: 300167002 | |
| Commercial assay or kit | Lactate Assay Kit-WST | Dojindo | Cat. #: L256 | |
| Chemical compound, drug | MGH | Matsui et al., 2017 | ||
| Chemical compound, drug | Halo-TMR | Promega | Cat. #: G8251 | |
| Chemical compound, drug | Annexin-V, Alexa647 conjugate | Molecular Probes | Cat. #: A23204 | |
| Chemical compound, drug | Tetramethylrhodamine ethyl ester | Molecular Probes | Cat. #: T669 | |
| Software, algorithm | Metamorph | Molecular Devices | RRID:SCR_002368 |
Additional files
Download links
A two-part list of links to download the article, or parts of the article, in various formats.
Downloads (link to download the article as PDF)
Open citations (links to open the citations from this article in various online reference manager services)
Cite this article (links to download the citations from this article in formats compatible with various reference manager tools)
Single-cell dynamics of pannexin-1-facilitated programmed ATP loss during apoptosis
eLife 9:e61960.
https://doi.org/10.7554/eLife.61960


