Meta-Research: COVID-19 research risks ignoring important host genes due to pre-established research patterns
- Successful Clinical Response in Pneumonia Therapy (SCRIPT) Systems Biology Center, Northwestern University, United States
- Department of Chemical and Biological Engineering, Northwestern University, United States
- Center for Genetic Medicine, Northwestern University School of Medicine, United States
- Northwestern Institute on Complex Systems (NICO), Northwestern University, United States
- Department of Molecular Biosciences, Northwestern University, United States
- Department of Physics and Astronomy, Northwestern University, United States
- Department of Medicine, Northwestern University School of Medicine, United States
Figures
Figure 1 with 1 supplement
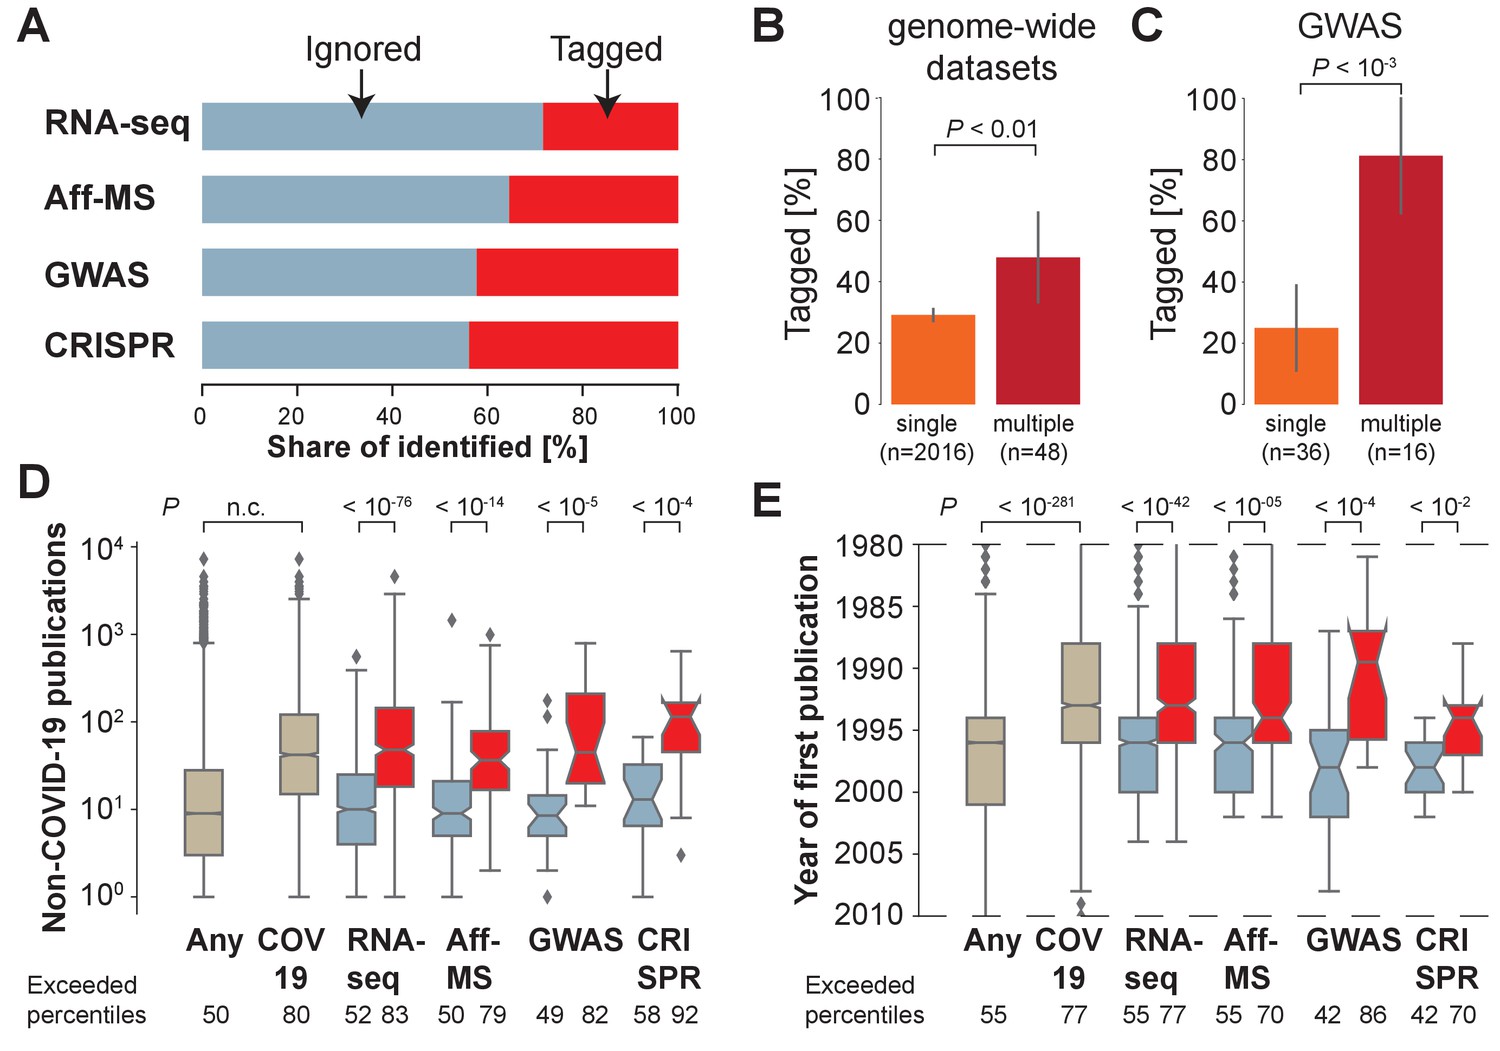
Most host genes implicated in COVID-19 identified by genome-wide approaches are not being investigated.
(A) Share of identified genes, which are ignored (never tagged, blue) or tagged (at least once) within the COVID-19 literature. (B) Share of tagged genes identified by a single (orange) or multiple (maroon) genome-wide datasets. P-values are calculated via Fisher’s exact test. n is the number of genes. (C) Share of tagged genes identified by a single (orange) or multiple (maroon) GWAS comparisons. P-values are calculated via Fisher’s exact test. n is the number of genes. (D) Non-COVID-19 publications measured for any human protein-coding gene (ocher, any) and those occurring in the COVID-19 literature (ocher, COV19) and genes identified in A (colors as in A). Notches indicate 95% confidence interval of the median. P-values are calculated via Mann-Whitney U test. Exceeded percentiles indicates percentiles of all genes exceeded by the median gene of the genes in an individual boxplot. n.c. marks non-computable P-values that approximate 0. (E) As D, but for year of initial publication on the gene. Dashed lines indicate limit of visualized values. Some genes had their first publication before or afterwards.
Figure 1—figure supplement 1

Share of identified genes that are ignored or tagged.
Share of identified genes, which are ignored (never tagged, blue) or tagged at least once (red) within the COVID-19 literature after additionally including genes occurring in abstracts of preprints.
Figure 2 with 1 supplement
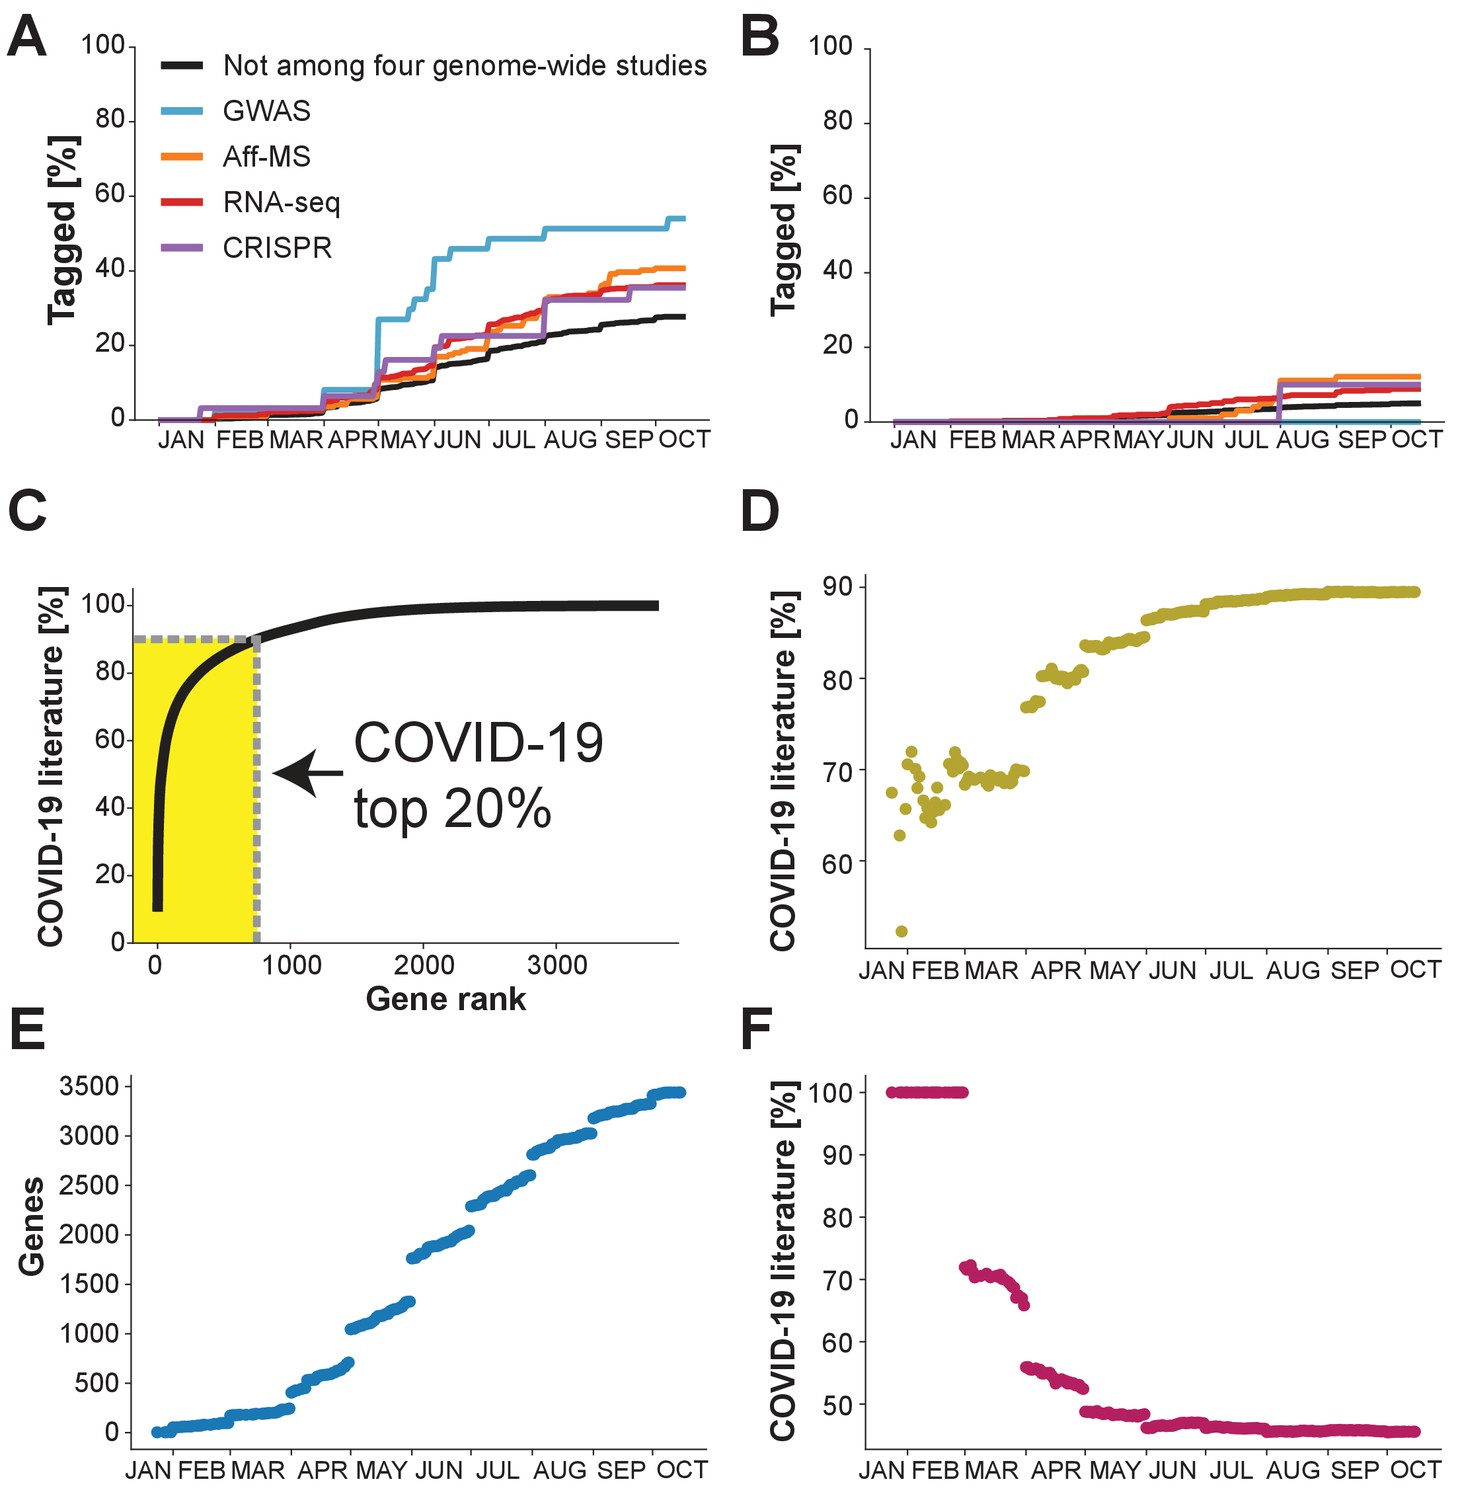
What the future holds?
Percentage of genes with indicated levels of support by the four genome-wide studies which have been tagged at least once in the COVID-19 literature. (A) Analysis restricted to the 50% of genes with highest number of publications in non-COVID-19 literature. (B) Analysis restricted to the 50% of genes with the lowest number of publications in the non-COVID-19 literature. (C) Cumulative share of literature on human protein-coding genes tagged in the COVID-19 literature. Top 20% indicates the 20% of genes that occur the most in the non-COVID-19 literature. Gene rank refers to the order of human protein-coding genes. The gene with the most publication equivalents would be have rank 1. Yellow area indicates share of literature accounted for by the top 20% genes. (D) Share of COVID-19 literature accounted for by the 20% of genes that had occurred the most in the COVID-19 literature by a given date. (E) Number of distinct human protein coding genes that have been tagged in the literature by a given date. (F) Share of COVID-19 literature accounted for by first 100 genes to be tagged in the COVID-19 literature by a given date.
Figure 2—figure supplement 1
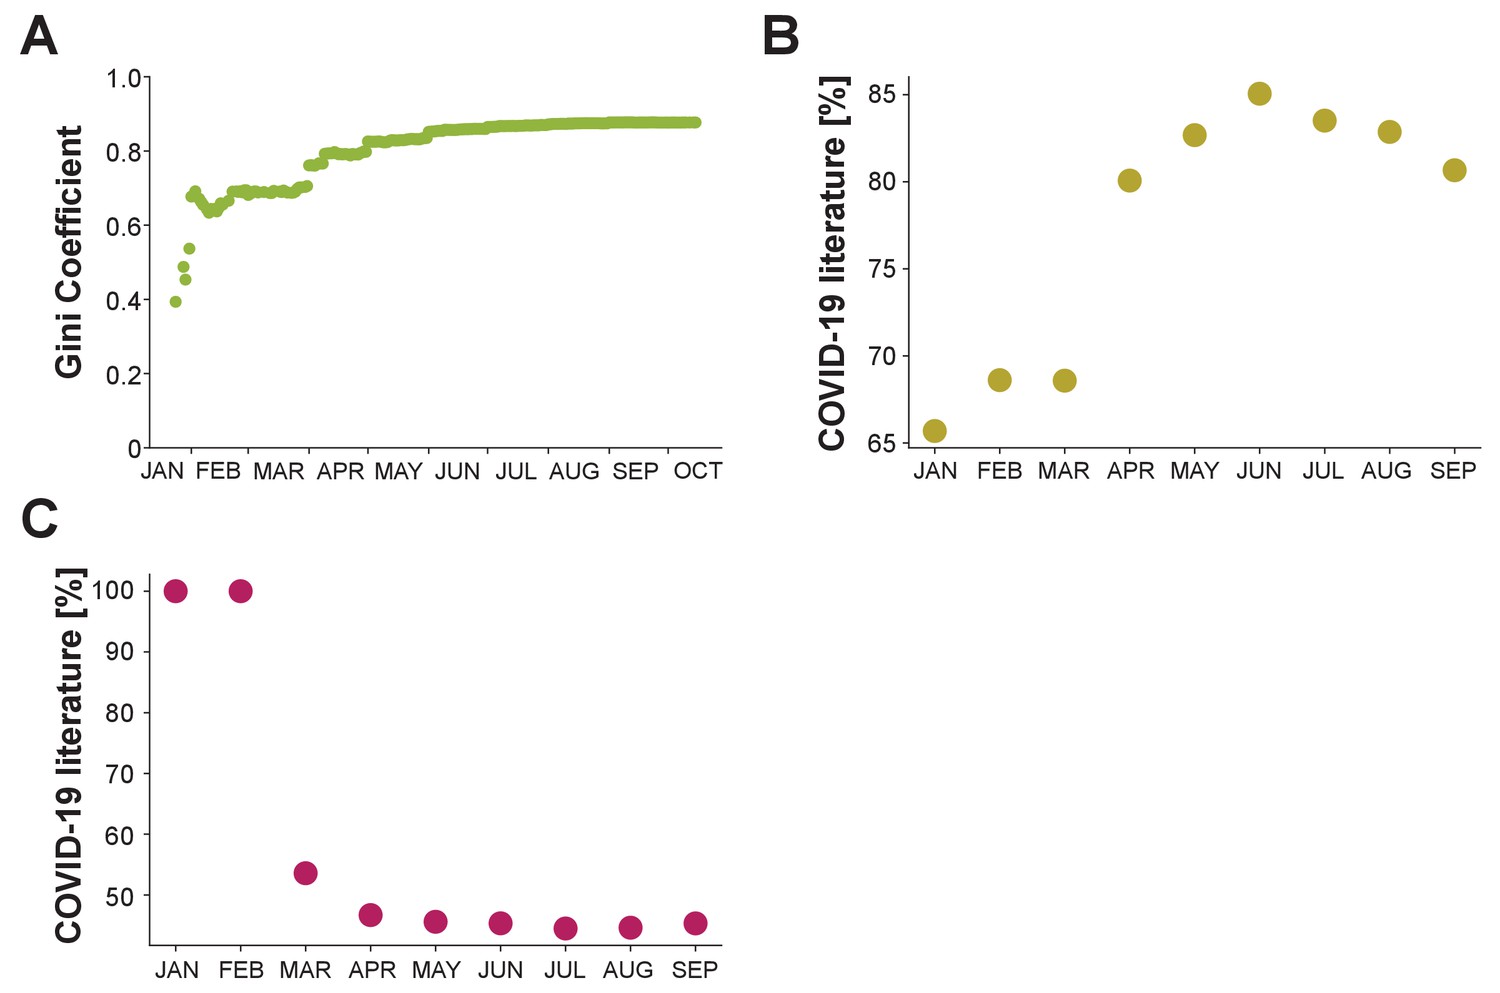
Temporal trends in the diversity of COVID-19 research.
(A) Gini Coefficient within COVID-19 literature until indicated day (green dots). (B) As Figure 2D but considering individual months (ochre dots). (C) As Figure 2F but considering individual months (purple dots). Note that September is the last month shown as October had been indexed incompletely within the most recent release of the database providing publication dates of for the COVID-19 literature.
Figure 3
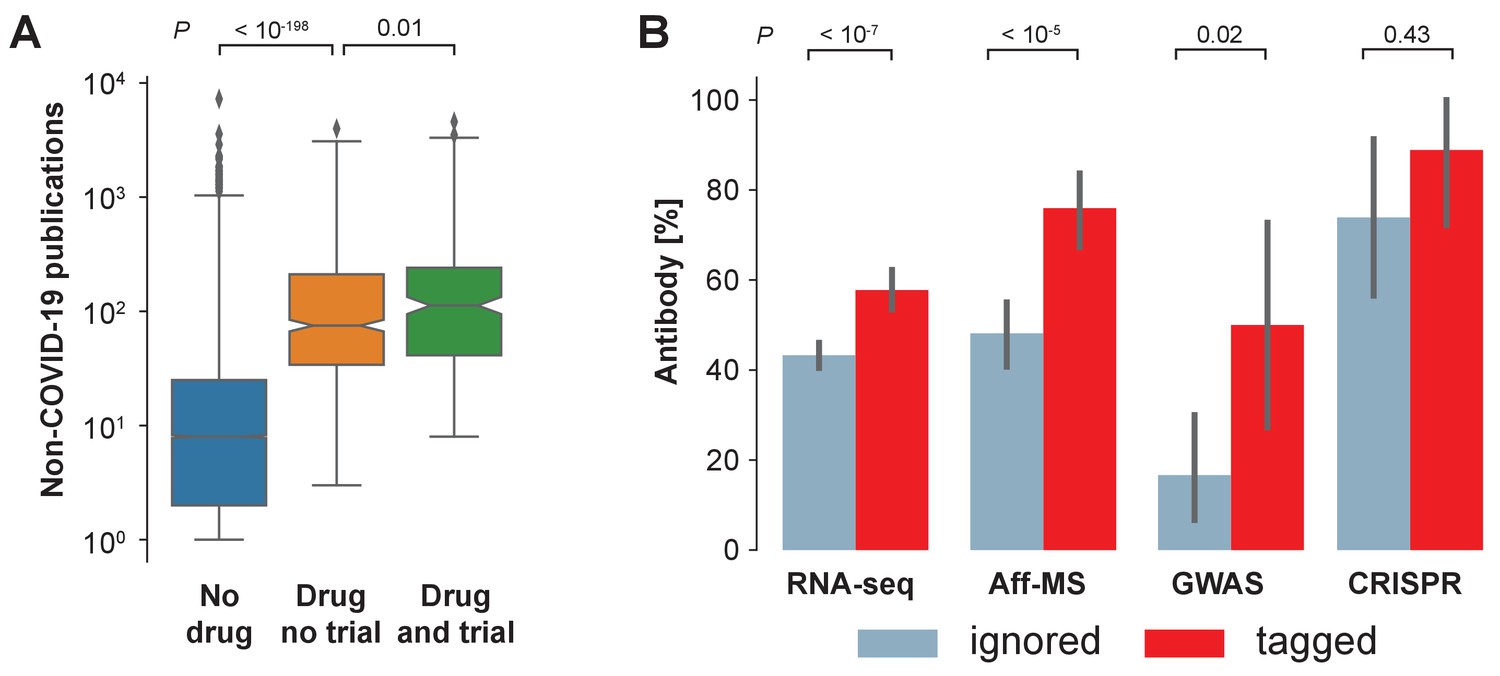
Availability of reagents.
(A) Drugs studied in COVID-19 related clinical trials are frequently studied within the non-COVID-19 literature. We compare non-COVID-19 publications measured for human protein-coding genes that are not listed as pharmaceutical targets in DrugBank (ocher, No drug), against those that are listed as pharmaceutical targets but have not occurred as an intervention in a clinical trial on COVID-19 (orange, Drug no trial), and against those that are listed as pharmaceutical targets and have occurred as an intervention in a clinical trial on COVID-19 (green, Drug and trial). Notches indicate 95% confidence interval of the median. P-values are calculated via Mann-Whitney U test. (B) Fraction of genes with reported usage of an antibody to detect the encoded protein as a prey in BioGRID. Bars are genes identified by the four different genome-wide studies that have either been tagged in the COVID-19 literature (red) or ignored (blue). Error bars indicate 95% confidence interval. P-values are calculated via Fisher’s exact test.
Author response image 1

Additional files
-
Source code 1
Source code for curation and analysis of datasets.
- https://cdn.elifesciences.org/articles/61981/elife-61981-code1-v1.zip
-
Supplementary file 1
Gene Ontology enrichment analysis for human protein-coding genes tagged in the COVID-19 literature.
- https://cdn.elifesciences.org/articles/61981/elife-61981-supp1-v1.xlsx
-
Supplementary file 2
Identification of genes through multiple GWAS comparisons.
- https://cdn.elifesciences.org/articles/61981/elife-61981-supp2-v1.xlsx
-
Supplementary file 3
Implicated host genes identified by multiple genome-wide studies.
- https://cdn.elifesciences.org/articles/61981/elife-61981-supp3-v1.xlsx
-
Supplementary file 4
Extent of tags in COVID-19 literature compared to rate identification in genome-wide datasets.
Per-gene average share of COVID-19 literature and per-gene average identification rate in genome-wide datasets (one if identified, 0 if not identified). Shown are the ratios of this share and the rates in individual groups (100 first tagged genes, and 20% top-tagged genes) over the share and the rates of the other genes that have been tagged in the COVID-19 literature.
- https://cdn.elifesciences.org/articles/61981/elife-61981-supp4-v1.xlsx
-
Supplementary file 5
Number of laboratories working on individual genes, identified within one of the four genome-wide datasets, between 2006 and 2015.
- https://cdn.elifesciences.org/articles/61981/elife-61981-supp5-v1.xlsx
-
Transparent reporting form
- https://cdn.elifesciences.org/articles/61981/elife-61981-transrepform-v1.docx
Download links
A two-part list of links to download the article, or parts of the article, in various formats.
Downloads (link to download the article as PDF)
Open citations (links to open the citations from this article in various online reference manager services)
Cite this article (links to download the citations from this article in formats compatible with various reference manager tools)
Meta-Research: COVID-19 research risks ignoring important host genes due to pre-established research patterns
eLife 9:e61981.
https://doi.org/10.7554/eLife.61981


