SARM1 depletion rescues NMNAT1-dependent photoreceptor cell death and retinal degeneration
- Department of Genetics, Washington University School of Medicine, United States
- Department of Perinatal and Neonatal Medicine, Aichi Medical University, Japan
- Department of Ophthalmology and Visual Sciences, Washington University School of Medicine, United States
- Department of Pediatrics, Powell Gene Therapy Center, United States
- Department of Developmental Biology, Washington University School of Medicine, United States
- Needleman Center for Neurometabolism and Axonal Therapeutics, United States
- Department of Pediatrics, Division of Cellular and Molecular Therapy, United States
- Department of Medicine, Washington University School of Medicine, United States
Figures
Figure 1 with 1 supplement
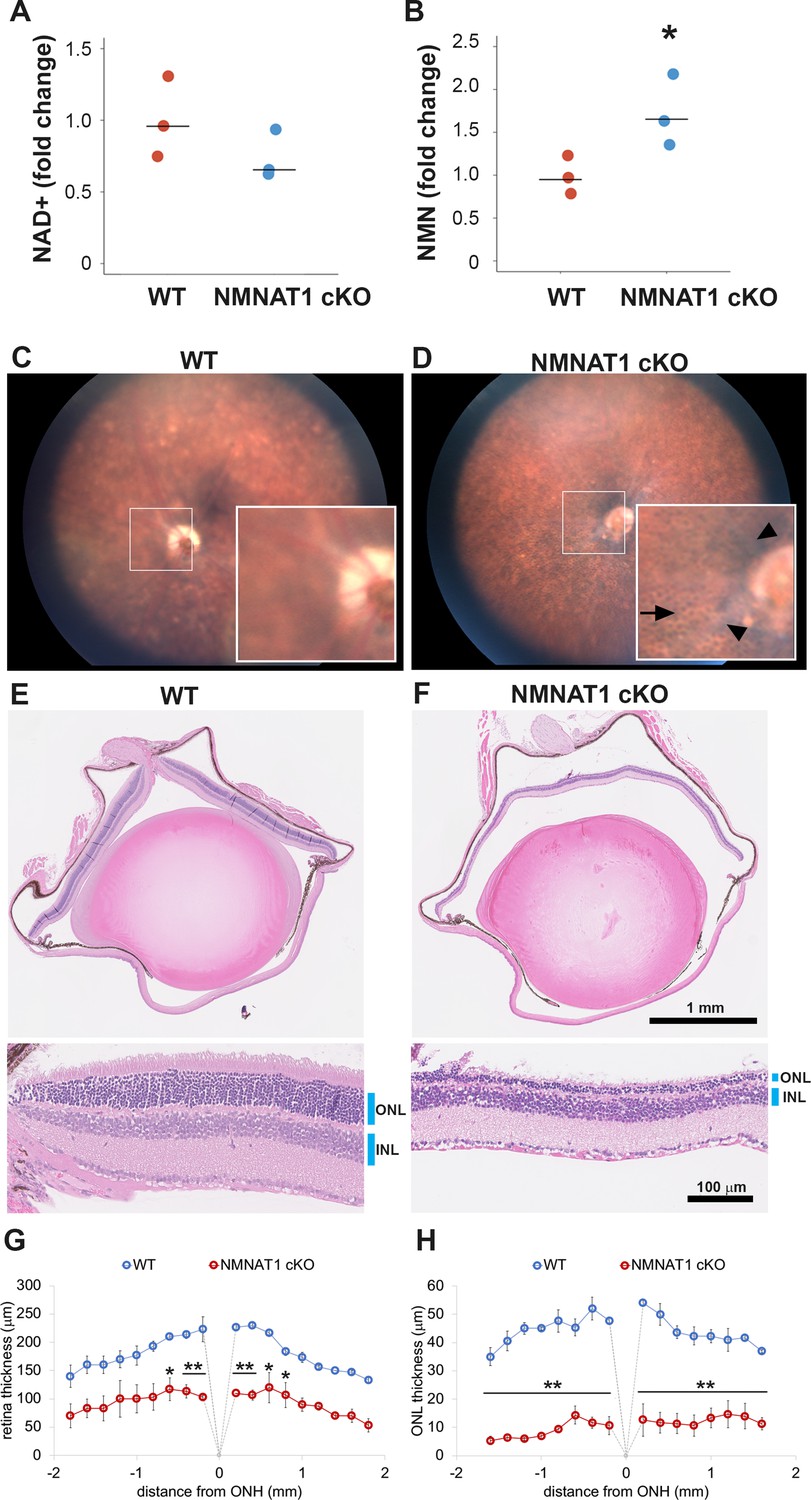
NMNAT1 depletion induces severe retinal degeneration.
(A, B) Metabolite analysis by LC-MSMS in retinal tissues from WT or NMNAT1 conditional knockout (Nmnat1fl/fl: CAG-CreERT2 + tamoxifen: NMNAT1 cKO) mice at 25 days post tamoxifen injection. Fold changes of NAD+ (A) and NMN (B) concentrations compared with that of WT retinal tissues are shown. *p<0.05 denotes the significant difference from WT with Kruskal-Wallis test (n = 3 mice for WT and n = 3 mice for NMNAT1 cKO). Graphs show the all data points and median (cross bars). (C, D) Fundus biomicroscopy images of the retina from wild type (WT, C) or NMNAT1 conditional knock out (Nmnat1fl/fl: CAG-CreERT2 + tamoxifen: NMNAT1 cKO, D) mice at 4 weeks post tamoxifen injection. (E, F) representative images of hematoxylin and eosin stained eye sections from WT mice (E) or NMNAT1 conditional knockout (Nmnat1fl/fl: CAG-CreERT2 + tamoxifen: NMNAT1 cKO, E) mice at 4 weeks post tamoxifen injection (ONL: outer nuclear layer and INL: inner nuclear layer). The substantial thinning of the ONL was observed in 3 WT and 3 NMNAT1 cKO mice. (G) The quantification of the retina thickness from WT and NMNAT1 conditional knockout (Nmnat1fl/fl: CAG-CreERT2 + tamoxifen: NMNAT1 cKO) mice were shown. Graphs show the average and error bars represent the standard error. Statistical analysis was performed by two-way ANOVA with Tukey post-hoc test (n = 3 mice for WT, n = 3 mice for NMNAT1 cKO (Nmnat1fl/fl: CAG-CreERT2 + tamoxifen at 4 weeks post tamoxifen injection)). F(1, 72)=309, p<1.0×10⁻¹⁶ between WT and NMNAT1 cKO retina. *p<0.05 and **p<0.001 denotes the significant difference compared with WT retina. (H) The quantification of the ONL thickness from WT and NMNAT1 conditional knockout (Nmnat1fl/fl: CAG-CreERT2 + tamoxifen: NMNAT1 cKO) mice were shown. Graphs show the average and error bars represent the standard error. Statistical analysis was performed by two-way ANOVA with Tukey post-hoc test (n = 3 mice for WT and n = 3 mice for NMNAT1 cKO). F(1, 72)=1023, p<1.0×10⁻¹⁶ between WT and NMNAT1 cKO retina. **p<0.001 denotes the significant difference compared WT.
-
Figure 1—source data 1
Source data for Figure 1.
- https://cdn.elifesciences.org/articles/62027/elife-62027-fig1-data1-v1.xlsx
Figure 1—figure supplement 1
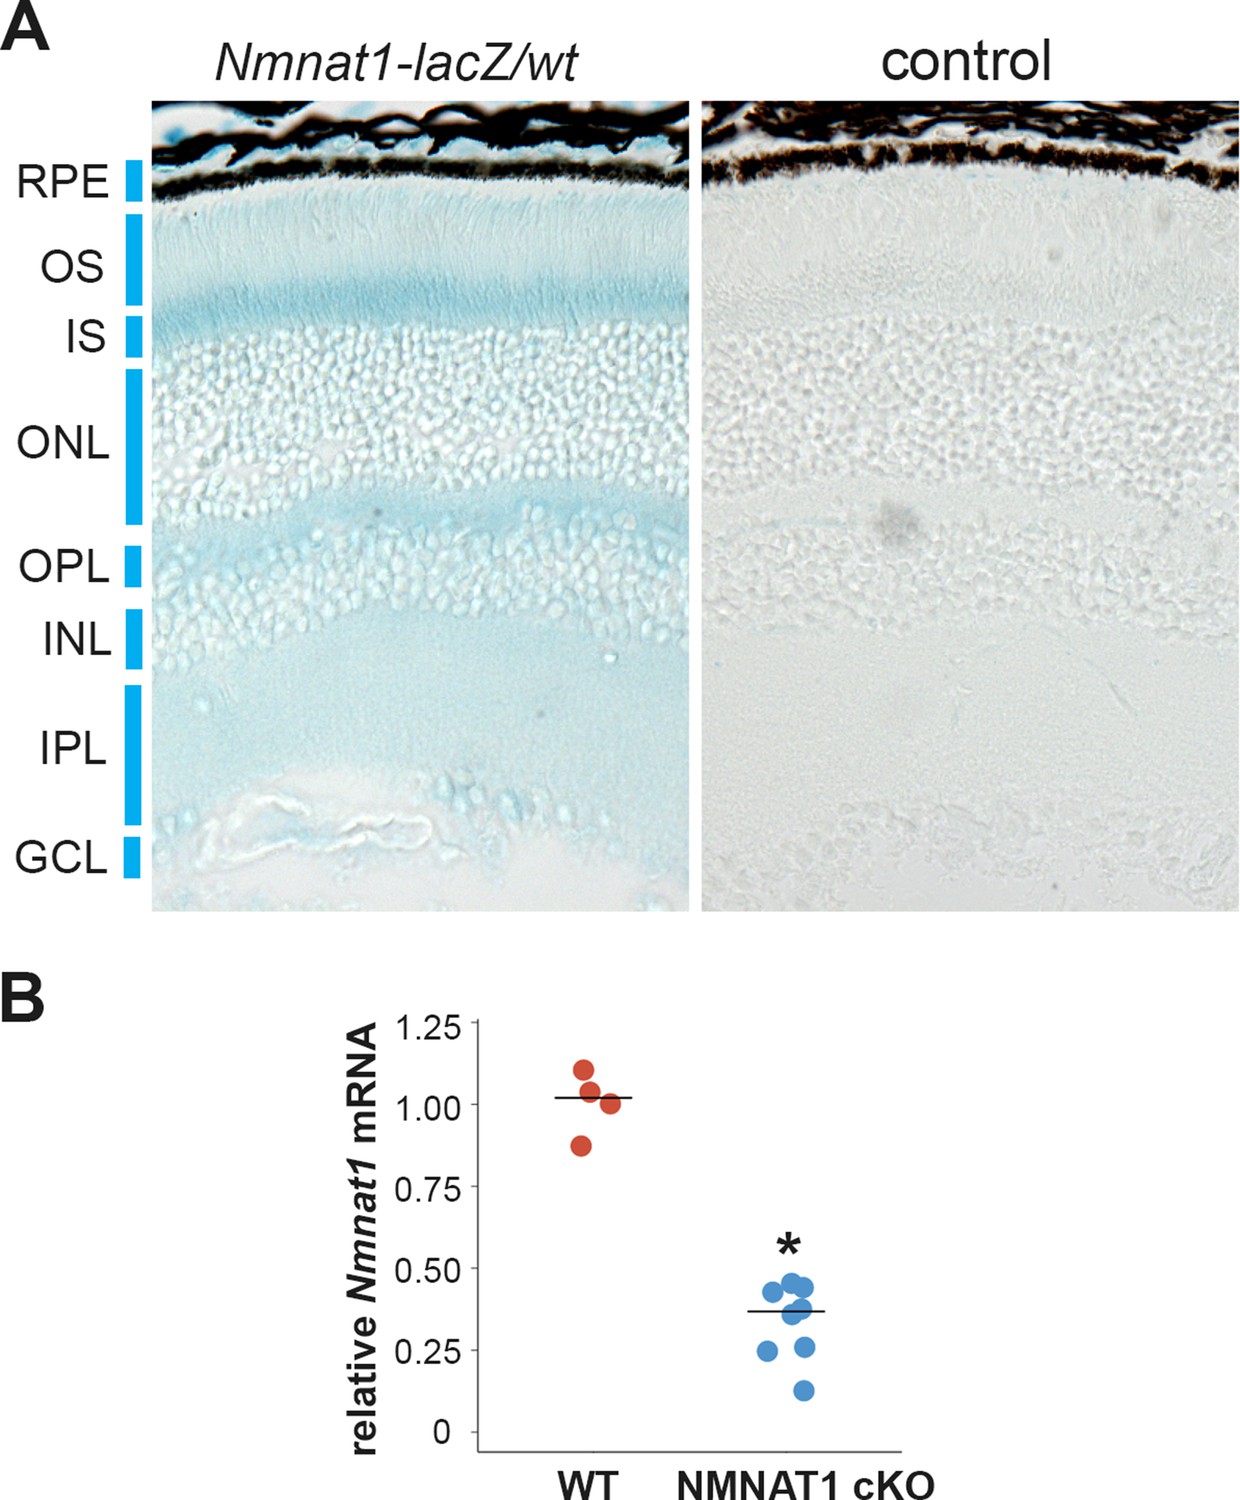
NMNAT1 is ubiquitously expressed in the retina.
(A) X-Gal staining of retinal tissues from mice heterozygous for Nmnat-lacZ fusion protein lacking the nuclear localization signal (Nmnat1-lacZ/wt) or wild-type (WT) mice (control). (B) Quantitative RT-PCR analysis of Nmnat1 mRNA in retinal tissues from WT or Nmnat1fl/fl: CAG-CreERT2 mice at 21 days post tamoxifen injection (NMNAT1 cKO) showed significant reduction of Nmnat1 mRNA compared with WT. *p<0.05 denotes the significant difference from WT with Mann-Whitney U test (n = 4 for WT (two mice) and n = 8 for NMNAT1 cKO (four mice)).
-
Figure 1—figure supplement 1—source data 1
Source data for Figure 1—figure supplement 1.
- https://cdn.elifesciences.org/articles/62027/elife-62027-fig1-figsupp1-data1-v1.xlsx
Figure 2 with 1 supplement
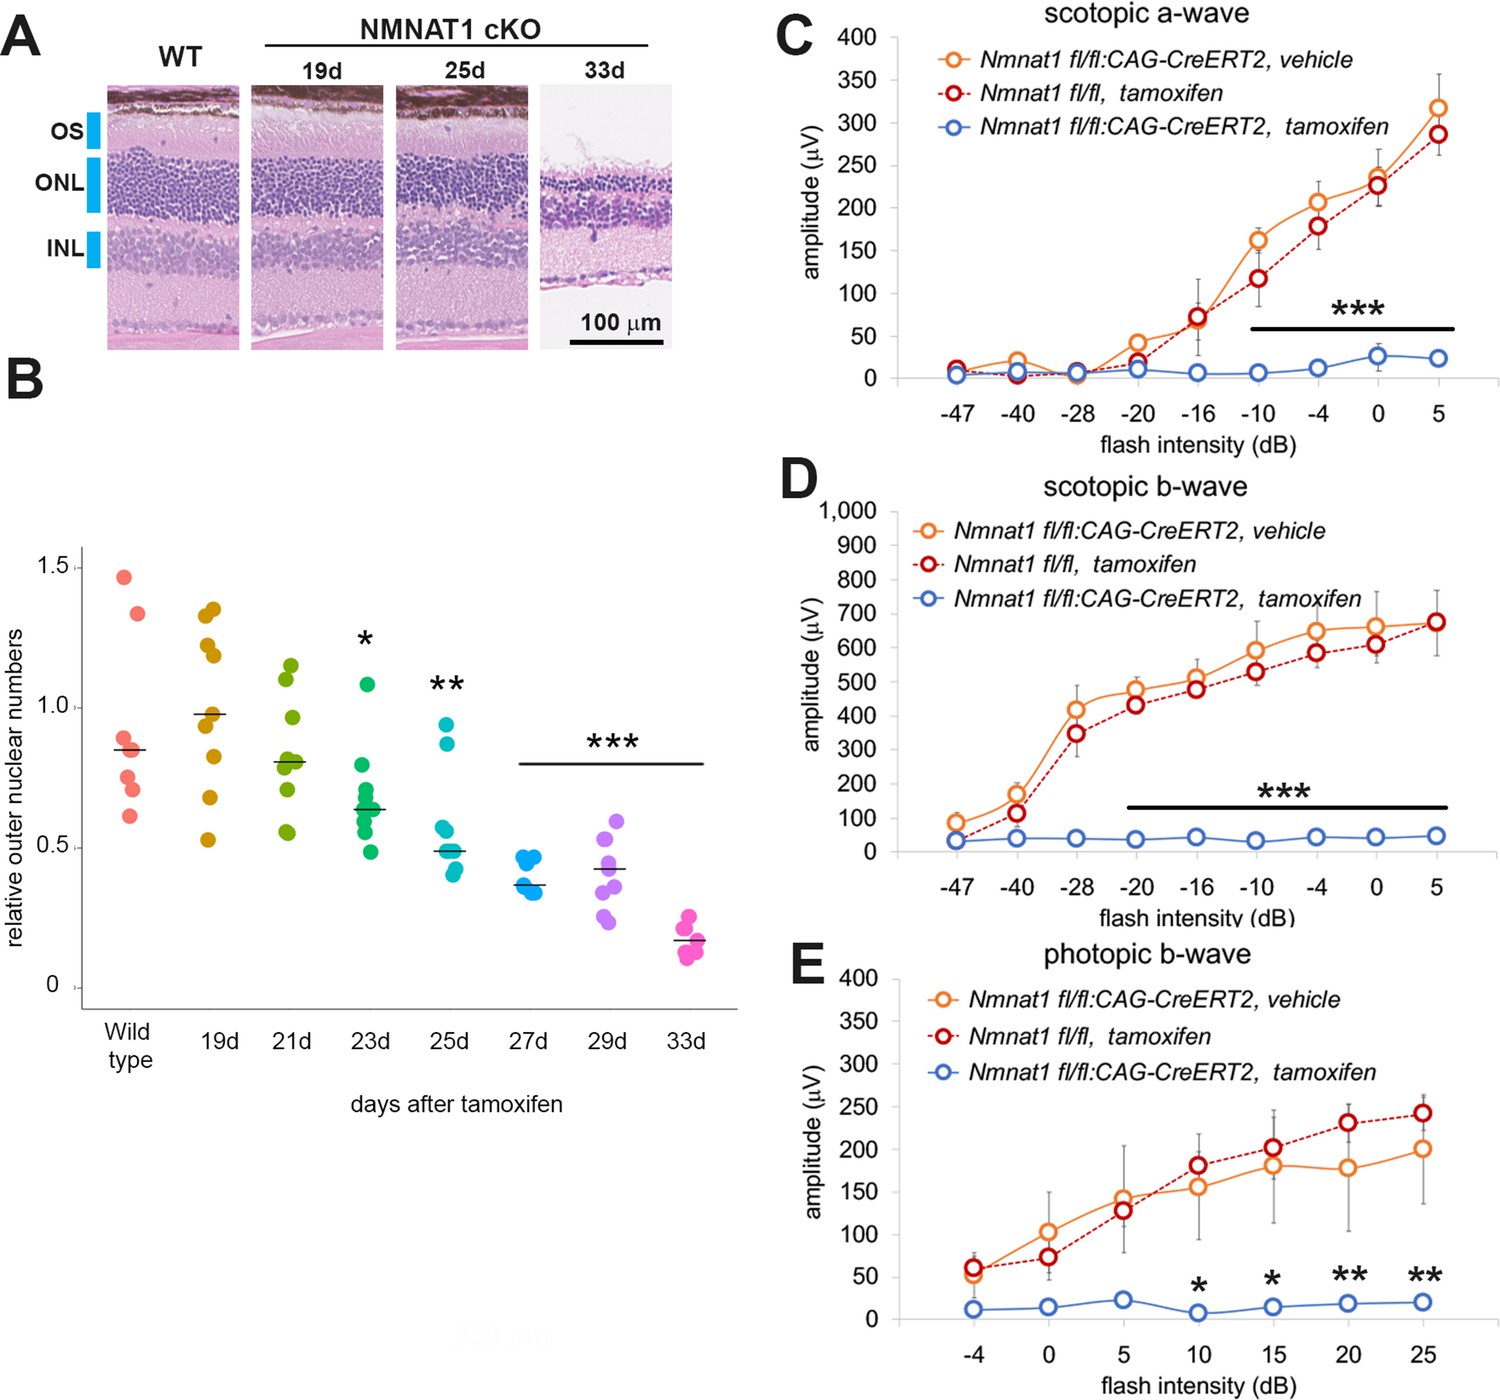
NMNAT1 induces the loss of photoreceptor cells and retinal function.
(A) Representative images of hematoxylin and eosin stained sections showing time course of retinal degeneration in NMNAT1 conditional knockout (Nmnat1fl/fl: CAG-CreERT2 + tamoxifen: NMNAT1 cKO) mice at 19 to 33 days post tamoxifen injection or littermate wild-type (WT) mice at 33 days post tamoxifen injection (WT). Blue bars indicate outer nuclear layer (ONL), inner nuclear layer (INL), and outer segment (OS). Similar results were obtained from three mice at each time point. (B) Quantification of relative ONL nuclei numbers of NMNAT1 conditional knockout mouse (Nmnat1fl/fl: CAG-CreERT2 + tamoxifen: NMNAT1 cKO) compared with WT at various time after tamoxifen injection. The graph shows all data points and median (cross bars). Statistical analysis was performed by one-way ANOVA with Holm-Bonferroni multiple comparison (n = 3 mice for each of WT, 19d, 21d, 33d and n = 4 mice for each of 25d, 27d). F(7, 64)=19, p=1.9×10⁻¹³. *p<0.05, **p<0.001, and ***p<0.0001 denotes the significant difference compared with WT. (C, D, E) ERG analysis of controls (Nmnat1fl/fl: CAG-CreERT2 vehicle or Nmnat1fl/fl + tamoxifen) and NMNAT1 conditional knockout (Nmnat1fl/fl: CAG-CreERT2 + tamoxifen: NMNAT1 cKO). Graphs show the average and error bars represent the standard error. Scotopic a-wave (C), scotopic b-wave (D), and photopic b-wave (E) are shown. Statistical analysis was performed by two-way ANOVA with Tukey post-hoc test (n = 3 mice for Nmnat1fl/fl: CAG-CreERT2 with vehicle, n = 3 mice for Nmnat1fl/fl at 33 days post tamoxifen injection, n = 4 mice for Nmnat1fl/fl: CAG-CreERT2 at 33 days post tamoxifen injection). F(1, 72)=220, p<2×10⁻¹⁶ between controls (Nmnat1fl/fl: CAG-CreERT2 with vehicle and Nmnat1fl/fl 33 days post tamoxifen injection) and NMNAT1 cKO for scotopic a-wave, F(1, 72)=633, p<2×10⁻¹⁶ between controls and NMNAT1 cKO for scotopic b-wave, F(1, 56)=94, p=1.3×10⁻¹³ between controls and NMNAT1 cKO for photopic b-wave. *p<0.05, **p<0.001, and ***p<0.0001 denote a significant difference compared with WT.
-
Figure 2—source data 1
Source data for Figure 2.
- https://cdn.elifesciences.org/articles/62027/elife-62027-fig2-data1-v1.xlsx
Figure 2—figure supplement 1

ERG analysis of NMNAT3-deficient retina.
ERG analysis of WT or NMNAT3 knock out mice (NMNAT3 KO). Graphs show the average and error bars represent the standard error. Statistical analysis was performed by one-way ANOVA (n = 3 mice for WT, n = 3 mice for NMNAT3 KO). F (8, 36)=0.78, p=0.623 for scotopic a-wave, F (8, 36)=0.28, p=0.97 for scotopic b-wave, F (6, 28)=0.23, p=0.97 for photopic b-wave and there is no statistical difference between WT and NMNAT3 KO in each flush intensity.
-
Figure 2—figure supplement 1—source data 1
Source data for Figure 2—figure supplement 1.
- https://cdn.elifesciences.org/articles/62027/elife-62027-fig2-figsupp1-data1-v1.xlsx
Figure 3 with 1 supplement

Photoreceptor-specific depletion of NMNAT1 induces retinal degeneration.
(A, B, C) Hematoxylin and eosin stained eye sections from 6 week old wild-type (WT, A), rod-specific NMNAT1 KO (Nmnat1fl/fl:Rho-Cre: Rho-Cre, B), or cone-specific NMNAT1 KO (Nmnat1fl/fl:OPN1LW-Cre: OPN1LW-Cre, C) mice. Blue bars indicate outer nuclear layer (ONL) and inner nuclear layer (INL). Red bars indicate the outer segments (OS) and inner segments (IS). Similar results were obtained from three mice for each genotype. (D) Quantification of retina and ONL thickness in WT or rod-specific NMNAT1 KO (Rho-Cre) retinas. The graph shows all data points and median (cross bars). Statistical analysis was performed by two-way ANOVA with Tukey post-hoc test (n = 3 mice for WT and n = 3 mice for Rho-Cre). F(1, 72)=428, p<2×10⁻¹⁶ between WT and Rho-Cre retina thickness and F(1, 64)=530, p<2×10⁻¹⁶ between WT and Rho-Cre ONL thickness. *p<0.05, **p<0.001, and ***p<0.0001 denote significant differences compared with WT. (E) Quantification of retina and ONL thickness in WT or cone-specific NMNAT1 KO (OPN1LW-Cre) retinas. Graphs show the average and error bars represent the standard error. Statistical analysis was performed by two-way ANOVA with Tukey post-hoc test (n = 3 mice for WT and n = 3 mice for OPN1LW-Cre). F(1, 72)=4, p=0.037 between WT and OPN1LW-Cre retina thickness and F(1, 64)=0.03, p=0.87 between WT and OPN1LW-Cre ONL thickness. There are no significant differences in OPN1LW-Cre retina and ONL thickness compared with WT. (F) Quantification of relative ONL nuclei numbers compared with WT. The graph shows all data points and median (cross bars). Statistical analysis was performed by one-way ANOVA with Holm-Bonferroni multiple comparison (n = 6 mice for WT, n = 3 mice for Rho-Cre, n = 3 mice for OPN1LW-Cre). F(2, 35)=59, p=5.9×10⁻¹². ***p<0.0001 denotes the significant difference compared WT. (G, H, I) ERG analysis of WT, Rho-Cre, and OPN1LW-Cre mice. Scotopic a-wave (G), scotopic b-wave (H), and photopic b-wave (I) are shown. Graphs show the average and error bars represent the standard error. Statistical analysis was performed by two-way ANOVA with Tukey post-hoc test (n = 6 mice for WT, n = 3 mice for Rho-Cre, n = 3 mice for OPN1LW-Cre). F(2, 81)=314, p<2.0×10⁻¹⁶ among genotypes (WT, Rho-Cre, and OPN1LW-Cre) for scotopic a-wave, F(2, 81)=413, p<2×10⁻¹⁶ among genotypes for scotopic b-wave, F(2, 63)=102 , p<2×10⁻¹⁶ among genotypes for photopic b-wave. *p<0.05, **p<0.001, and ***p<0.0001 denote a significant difference compared with WT.
-
Figure 3—source data 1
Source data for Figure 3.
- https://cdn.elifesciences.org/articles/62027/elife-62027-fig3-data1-v1.xlsx
Figure 3—figure supplement 1
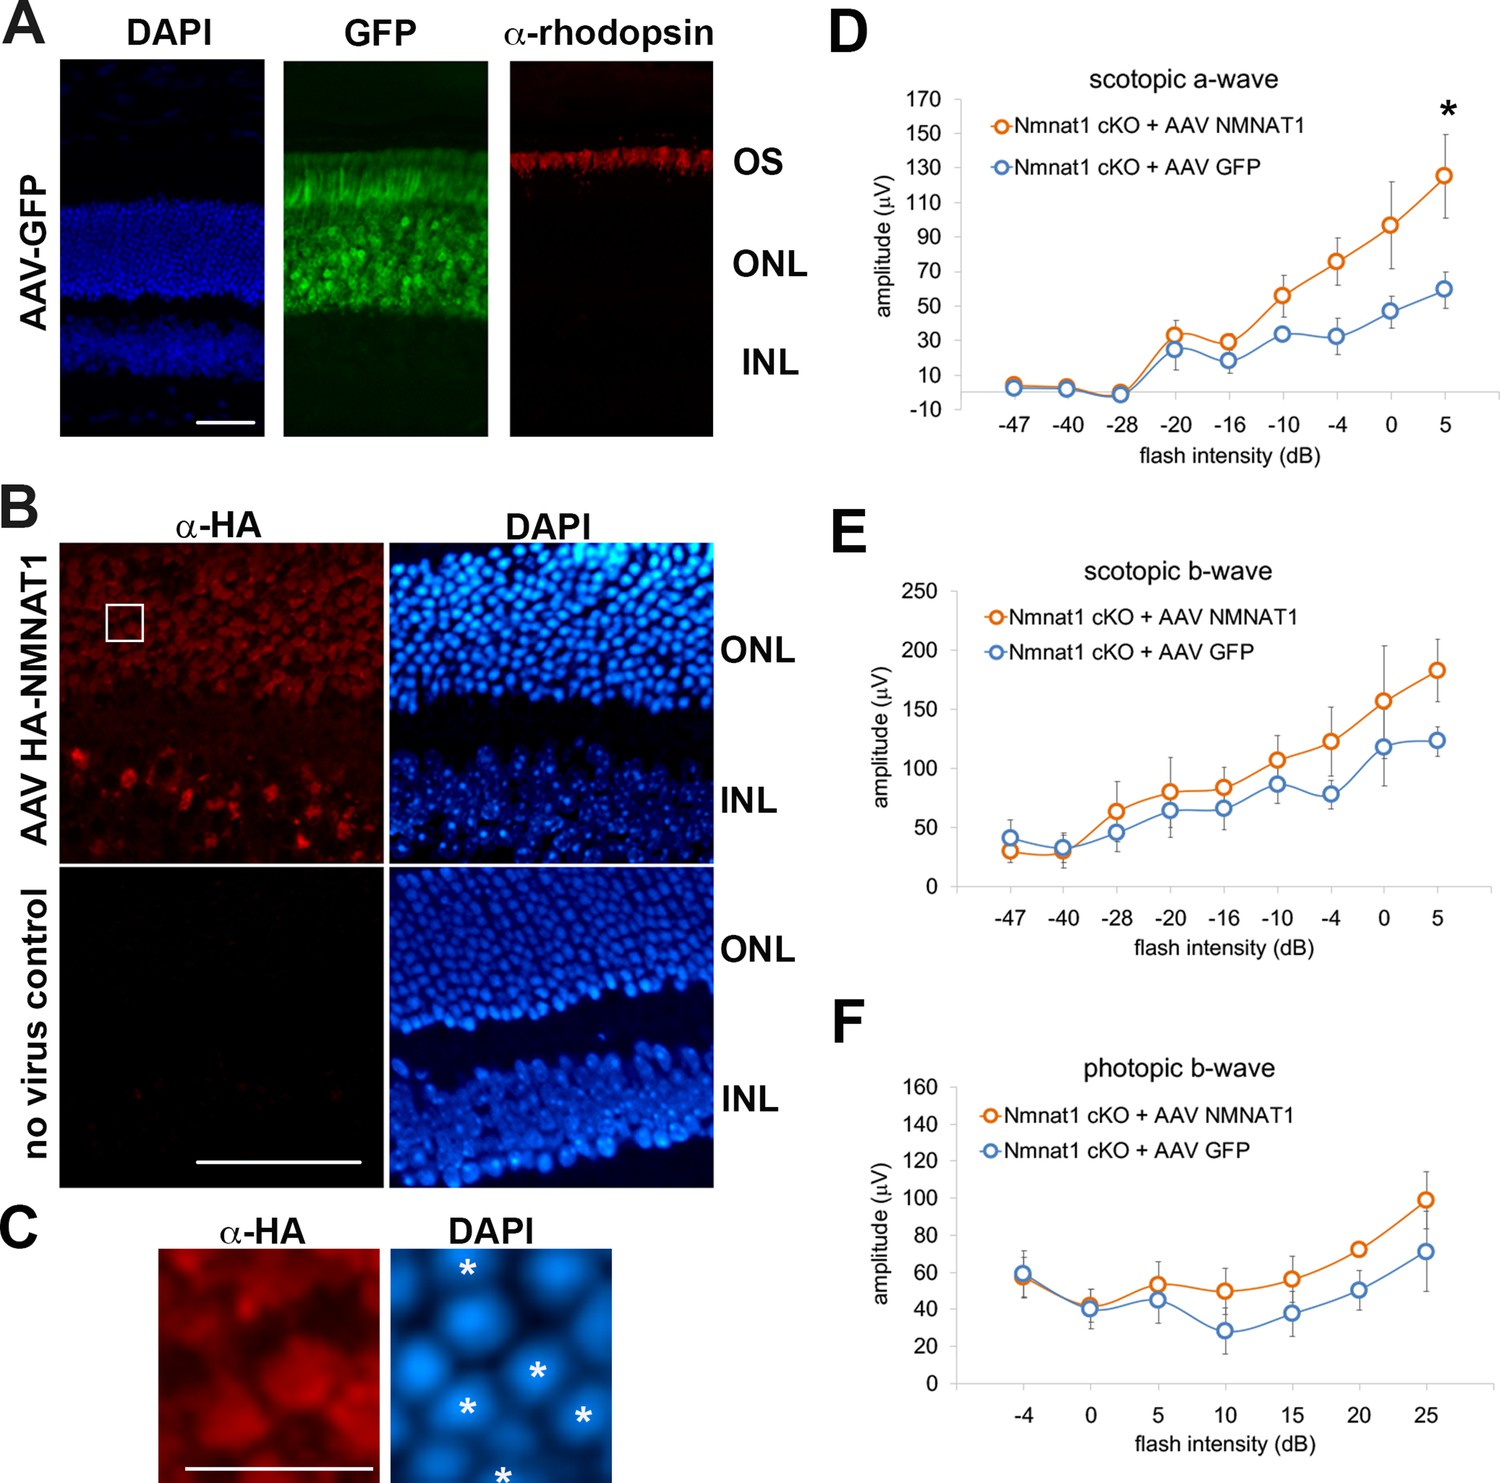
AAV-NMNAT1 partially rescued the retinal degeneration in NMNAT1-deficient retinas.
(A) Fluorescent microscope images of the retina after subretinal injection of AAV expressing GFP. The photoreceptor cell layer is identified with immunostaining with antibody against human rhodopsin. Scale bar, 50 μm. (B) Fluorescent microscope images of the retina after subretinal injection of AAV expressing HA-tagged human NMNAT1. The expression of NMNAT1 is shown by immunohistochemistry with antibody against HA epitope tag and nuclei are visualized with DAPI. Asterisks indicate the cells expressing HA-Nmnat1. Scale bar, 50 μm. (C) Enlarged images corresponding to the white box in (B), showing the partial expression of NMNAT1 in the cells in the outer nuclear layer. The stars indicate the NMNAT1 expressing cells. Scale bar, 10 μm. (D, E, F) ERG analysis of AAV-GFP (control) or AAV NMNAT1 (AAV- NMNAT1) administrated NMNAT1 cKO mice. Scotopic a-wave (D), scotopic b-wave (E), and photopic b-wave amplitudes (F) are shown. Graphs show the average and error bars represent the standard error. Statistical analysis was performed by two-way ANOVA with Tukey post-hoc test (n = 5 for control or AAV- NMNAT1). F(8, 72)=2.4, p=0.022 between control and AAV-NMNAT1 for scotopic a- wave, F(8, 72)=0.48, p=0.86 between control and AAV-NMNAT1 for scotopic b- wave, F(6, 56)=0.39, p=0.88 between controls and AAV-NMNAT1 for photopic b- wave. *p<0.05 denotes the statistical difference between WT and AAV-NMNAT1 mice.
-
Figure 3—figure supplement 1—source data 1
Source data for Figure 3—figure supplement 1.
- https://cdn.elifesciences.org/articles/62027/elife-62027-fig3-figsupp1-data1-v1.xlsx
Figure 4
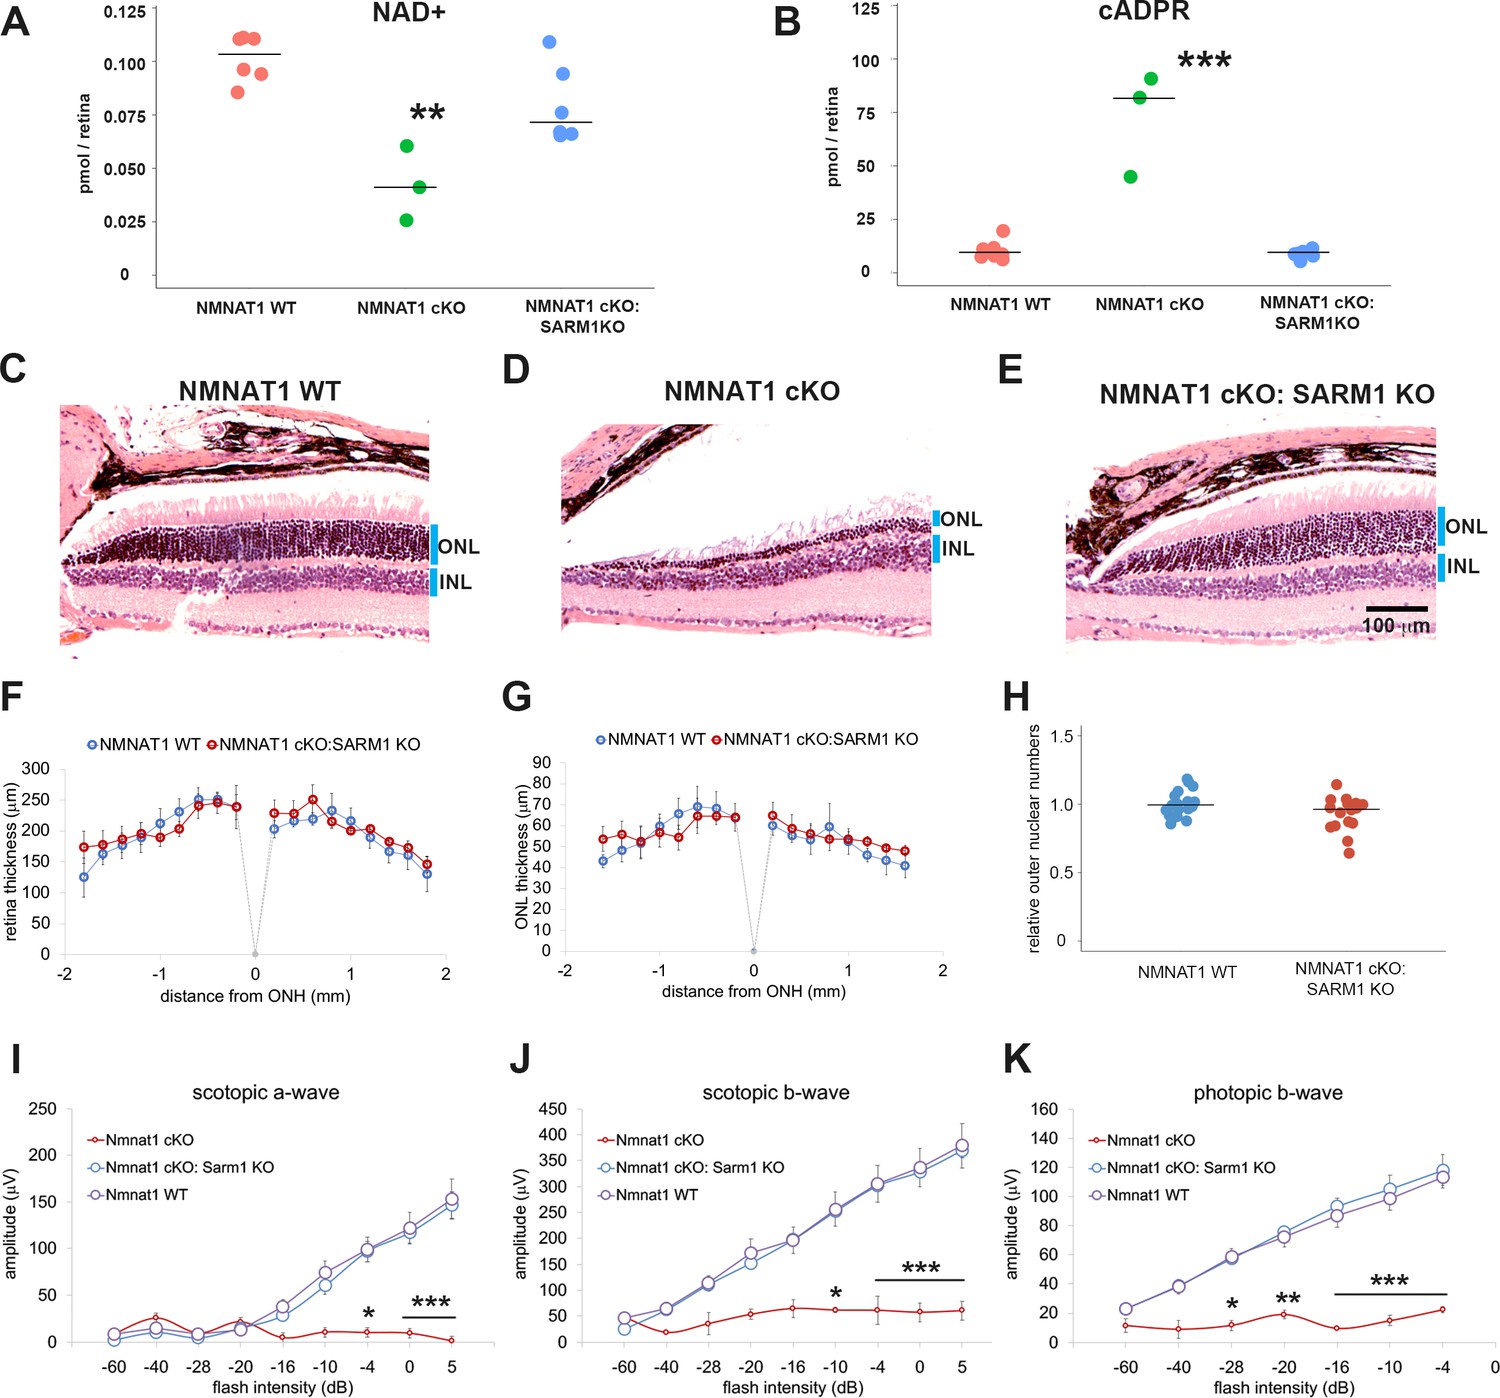
Depletion of SARM1 rescues retinal degeneration in the NMNAT1-deficient retina.
(A, B) Metabolite analysis by LC-MSMS in retinal tissues from WT, NMNAT1 conditional knockout (Nmnat1fl/fl: CAG-CreERT2 + tamoxifen at 29 to 32 days post tamoxifen injection: NMNAT1 cKO), or NMNAT1 cKO:SARM1 KO mice were shown. Metabolites from whole retina of one eye were analyzed for NAD+ (A) and cADPR (B) concentrations and compared with that of WT retinal tissues . Graphs show the all data points and median (cross bars). Statistical analysis was performed by one-way ANOVA with Holm-Bonferroni multiple comparison (n = 7 mice for WT, n = 3 mice for NMNAT1 cKO, and n = 6 mice for NMNAT1 cKO:SARM1 KO). F(2, 13)=259, p=3.0×10⁻⁴ for NAD+ and F(2,13) = 48, p=9.43×10⁻⁷ for cADPR. **p<0.001 and ***p<0.0001 denote the significant difference compared with WT. (C, D, E) Representative images of hematoxylin and eosin stained eye sections from NMNAT1 WT (Nmnat1fl/fl: Sarm1+/-, C), NMNAT1 cKO (Nmnat1fl/fl:Sarm1+/+: CAG-CreERT2 post 32 days tamoxifen injection, D), and NMNAT1 cKO: SARM1 KO (Nmnat1fl/fl: Sarm1-/-: CAG-CreERT2 at post 32 days tamoxifen injection, E). Blue bars represent outer nuclear layer (ONL) and inner nuclear layer (INL). Similar results were obtained from three mice for WT, two mice for NMNAT1 cKO, and three mice for NMNAT1cKO:SARM1 KO. (F) The quantification of the retina thickness from NMNAT1 WT and NMNAT1 cKO:SARM1 KO mice were shown. Graphs show the average and error bars represent the standard error. Statistical analysis was performed by two-way ANOVA with Tukey post-hoc test (n = 3 mice for NMNAT1 WT, n = 3 mice for NMNAT1 cKO:SARM1 dKO). F(1, 72)=0.8, p=0.37 between NMNAT1 WT and NMNAT1 cKO:SARM1 KO retina. There is no significant difference between NMNAT1 WT and NMNAT1 cKO:SARM1 KO. (G) The quantification of the outer nuclear layer (ONL) thickness from NMNAT1 WT and NMNAT1 cKO:SARM1 KO mice were shown. Graphs show the average and error bars represent the standard error. Statistical analysis was performed by two-way ANOVA with Tukey post-hoc test (n = 3 mice for NMNAT1 WT, n = 3 mice for NMNAT1 cKO:SARM1 KO). F(1, 64)=0.43, p=0.51 between NMNAT1 WT and NMNAT1 cKO:SARM1 KO retina. There is no significant difference between NMNAT1 WT and NMNAT1 cKO:SARM1 KO. (H) Quantification of relative ONL nuclei numbers compared with WT. The graph shows all data points and median (cross bars). Statistical analysis was performed by Mann-Whitney U test (n = 3 mice for NMNAT1 WT, n = 3 mice for NMNAT1 cKO:SARM1 KO). p=0.10. There are no statistical differences between NMNAT1 WT and NMNAT1 cKO:SARM1KO. (I, J, K) ERG analysis of NMNAT1 WT (Nmnat1fl/fl: Sarm1+/- or Nmnat1fl/fl: Sarm1-/-), NMNAT1 cKO (Nmnat1fl/fl: CAG-CreERT2 post 29 to 32 days tamoxifen injection), and NMNAT1 cKO: SARM1 KO (Nmnat1fl/fl: SARM1-/-: CAG-CreERT2 post 32 days tamoxifen injection). Graphs show the average and error bars represent the standard error. Statistical analysis was performed by two-way ANOVA with Tukey post-hoc test (n = 8 mice for NMNAT1 WT, n = 3 mice for NMNAT1 cKO, and n = 8 mice for NMNAT1 cKO: SARM1 KO). F (2, 144)=29, p=2.9×10⁻¹¹ among genotypes (NMNAT1 WT, NMNAT1 cKO, NMNAT1 cKO:SARM1 KO) for scotopic a-wave, F (2, 144)=46, p<2.0×10⁻¹⁶ among genotypes for scotopic b-wave, F (2, 112)=94, p<2.0×10⁻¹⁶ among genotypes for photopic b-wave. *p<0.05, **p<0.001, and ***p<0.0001 denotes the statistical difference between NMNAT1 WT and NMNAT1 cKO or between NMNAT1 cKO:SARM1KO and NMNAT1 cKO. There is no statistical difference between NMNAT1 WT and NMNAT1 cKO: SARM1 KO.
-
Figure 4—source data 1
Source data for Figure 4.
- https://cdn.elifesciences.org/articles/62027/elife-62027-fig4-data1-v1.xlsx
Tables
Key resources table
| Reagent type (species) or resource | Designation | Source or reference | Identifiers | Additional information |
|---|---|---|---|---|
| Genetic reagent (mouse, male and female) | Nmnat1 FRTgeo;loxP | EUCOMM | RRID:MGI:5782147 | C57BL/6J to generate NMNAT1 knockout mouse |
| Genetic reagent (mouse, male and female) | CAG-CreERT2 | The Jackson Laboratory | 004682, RRID:IMSR_JAX:004682 | Whole body Cre transgenic mouse:C57BL/6J |
| Genetic reagent (mouse, male and female) | Rho-Cre | Li et al., 2005 | Rhodopsin- iCre75 | Rod-specific Cre transgenic mouse:C57BL/6J |
| Genetic reagent (mouse, male and female) | OPN1LW-Cre | Le et al., 2004 | human red/green pigment-Cre, RRID:IMSR_JAX:032911 | Cone-specific Cre transgenic mouse:C57BL/6J |
| Recombinant DNA reagent | NMNAT1 | Sasaki et al., 2015 | ||
| Antibody | Anti-Rhodopsin (mouse monoclonal) | Abcam | Cat# ab3267, RRID:AB_303655 | IF(1:500) |
| Antibody | anti-HA (Rabbit monoclonal) | Cell Signaling Technology | Cat# 3724, RRID:AB_1549585 | IF(1:400) |
| Recombinant DNA reagent | GAPDH mouse | This paper | PCR primers | TGCCCCCATGTTTGTGATG |
| Recombinant DNA reagent | GAPDH mouse | This paper | PCR primers | TGTGGTCATGAGCCCTTCC |
| Recombinant DNA reagent | NMNAT1 mouse | This paper | PCR primers | AGAACTCACACTGGGTGGAAG |
| Recombinant DNA reagent | NMNAT1 mouse | This paper | PCR primers | CAGGCTTTTCCAGTGCAGGTG |
| Recombinant DNA reagent | AAV8(Y733F) | Zolotukhin et al., 2002 | ||
| Cell line (Homo-sapiens) | HEK293 | ATCC | CRL-1573 RRID:CVCL_0045 | Used for AAV virus production |
Additional files
Download links
A two-part list of links to download the article, or parts of the article, in various formats.
Downloads (link to download the article as PDF)
Open citations (links to open the citations from this article in various online reference manager services)
Cite this article (links to download the citations from this article in formats compatible with various reference manager tools)
SARM1 depletion rescues NMNAT1-dependent photoreceptor cell death and retinal degeneration
eLife 9:e62027.
https://doi.org/10.7554/eLife.62027


