Single-molecule view of coordination in a multi-functional DNA polymerase
- Department of Integrative Structural and Computational Biology, The Scripps Research Institute, United States
Figures
Figure 1
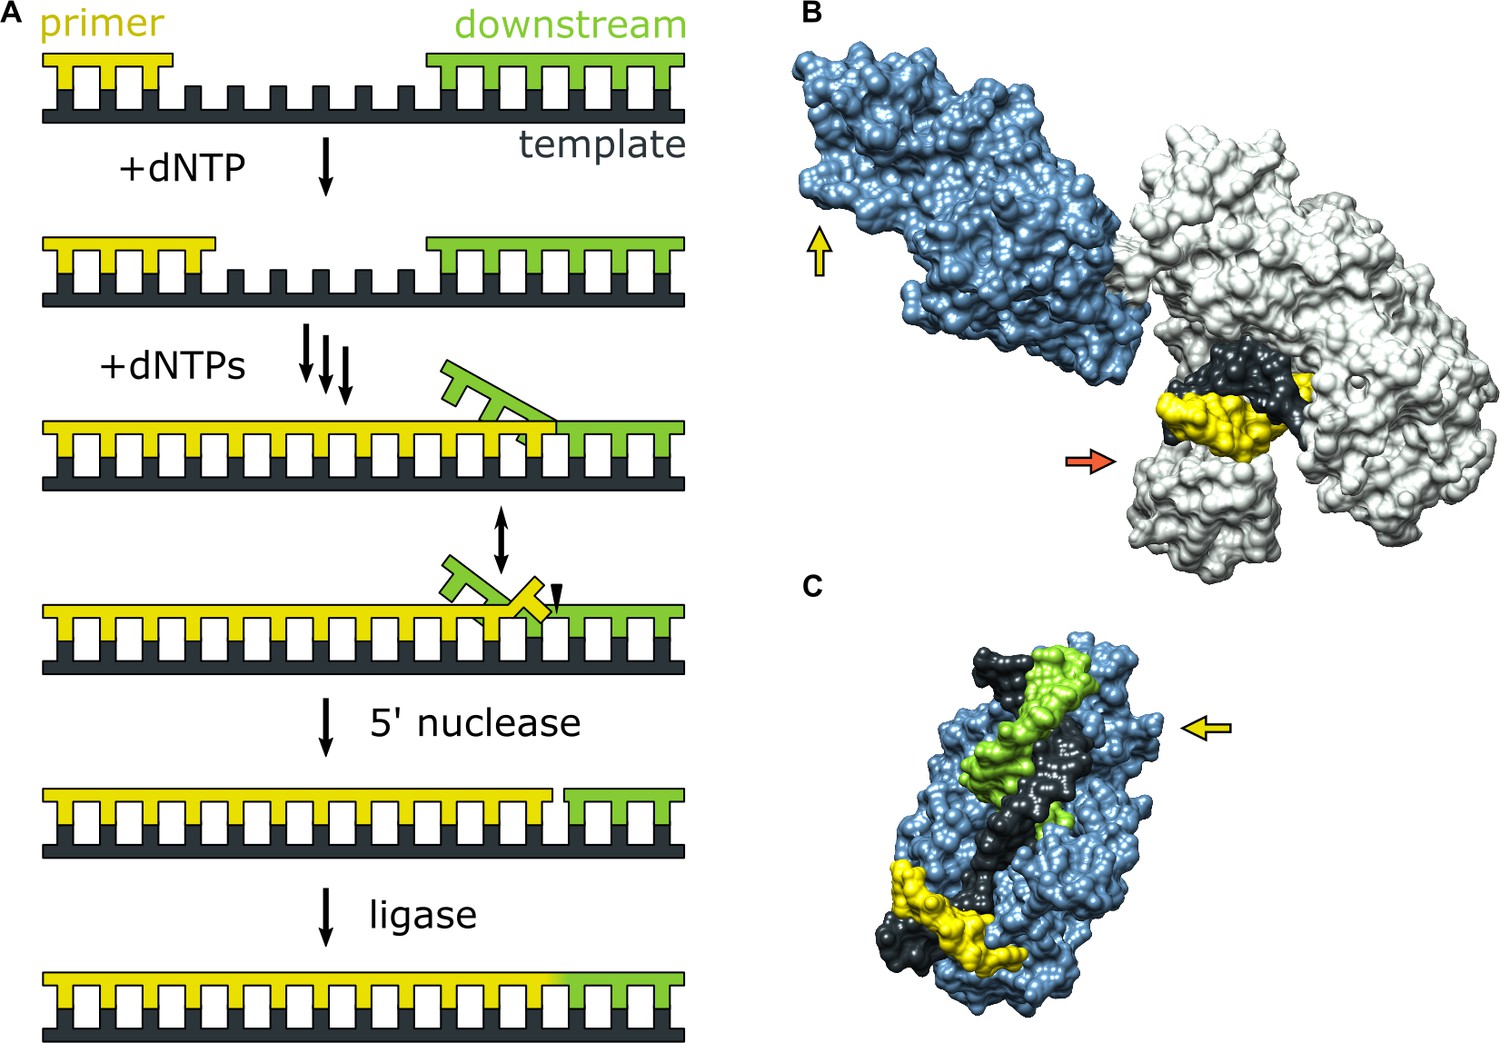
Activities of Pol I and three-dimensional structures of Pol I homologs.
(A) Processes catalyzed by Pol I during lagging strand DNA replication or base excision repair. A growing primer strand is extended through repeated cycles of nucleotide incorporation, resulting in displacement of a downstream strand (RNA in the case of Okazaki fragment maturation or DNA in the case of base excision repair). The resulting substrate rearranges to a double flap structure that is cleaved by the 5’ nuclease activity of Pol I (site indicated by a half arrow head). The final ligation step is performed by a DNA ligase (not shown). (B) Crystal structure of the Pol I homolog Taq polymerase with DNA primer/template bound in the pol domain (PDB ID: 1TAU). The polymerase core is shown in gray and the 5’ nuc domain is shown in light blue. (C) Crystal structure of human FEN1 bound to a DNA substrate (PDB: 3Q8M). In both B and C, the DNA strands are colored as in A and the green and red arrows denote the approximate locations of the sites for donor (scheme 2) or acceptor (scheme 1) labeling, respectively.
Figure 2
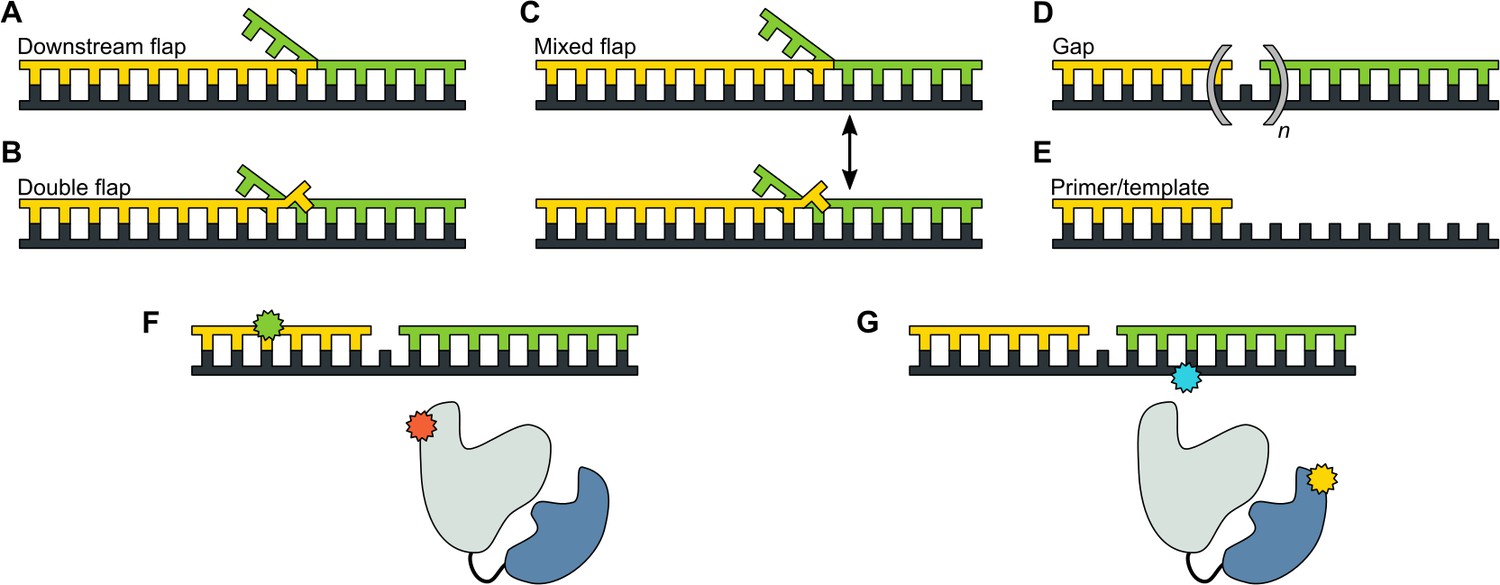
DNA substrates used in this study.
(A) Substrate containing a 5’ flap on the downstream strand (designated downstream flap DNA). (B) Substrate containing the same 5’ flap as in A, plus a single unpaired base at the primer 3’ terminus (designated double flap DNA). Because of the base sequences of the strands (Appendix 1), the structures shown in A and B are ‘locked in’. (C) Substrate that can exist as a mixture of the structures shown in A and B (designated mixed flap DNA). (D) Substrates containing a nick (n = 0) or gaps of various size (n = 1–4). (E). Primer/template substrate. (F) Schematic illustration of donor (green) and acceptor (red) labeling sites for the first FRET scheme. Pol I is depicted in cartoon form, with the core colored grey and the 5' nuc domain colored blue. (G) Schematic illustration of donor (yellow) and acceptor (blue) labeling sites for the second FRET scheme.
Figure 3 with 4 supplements
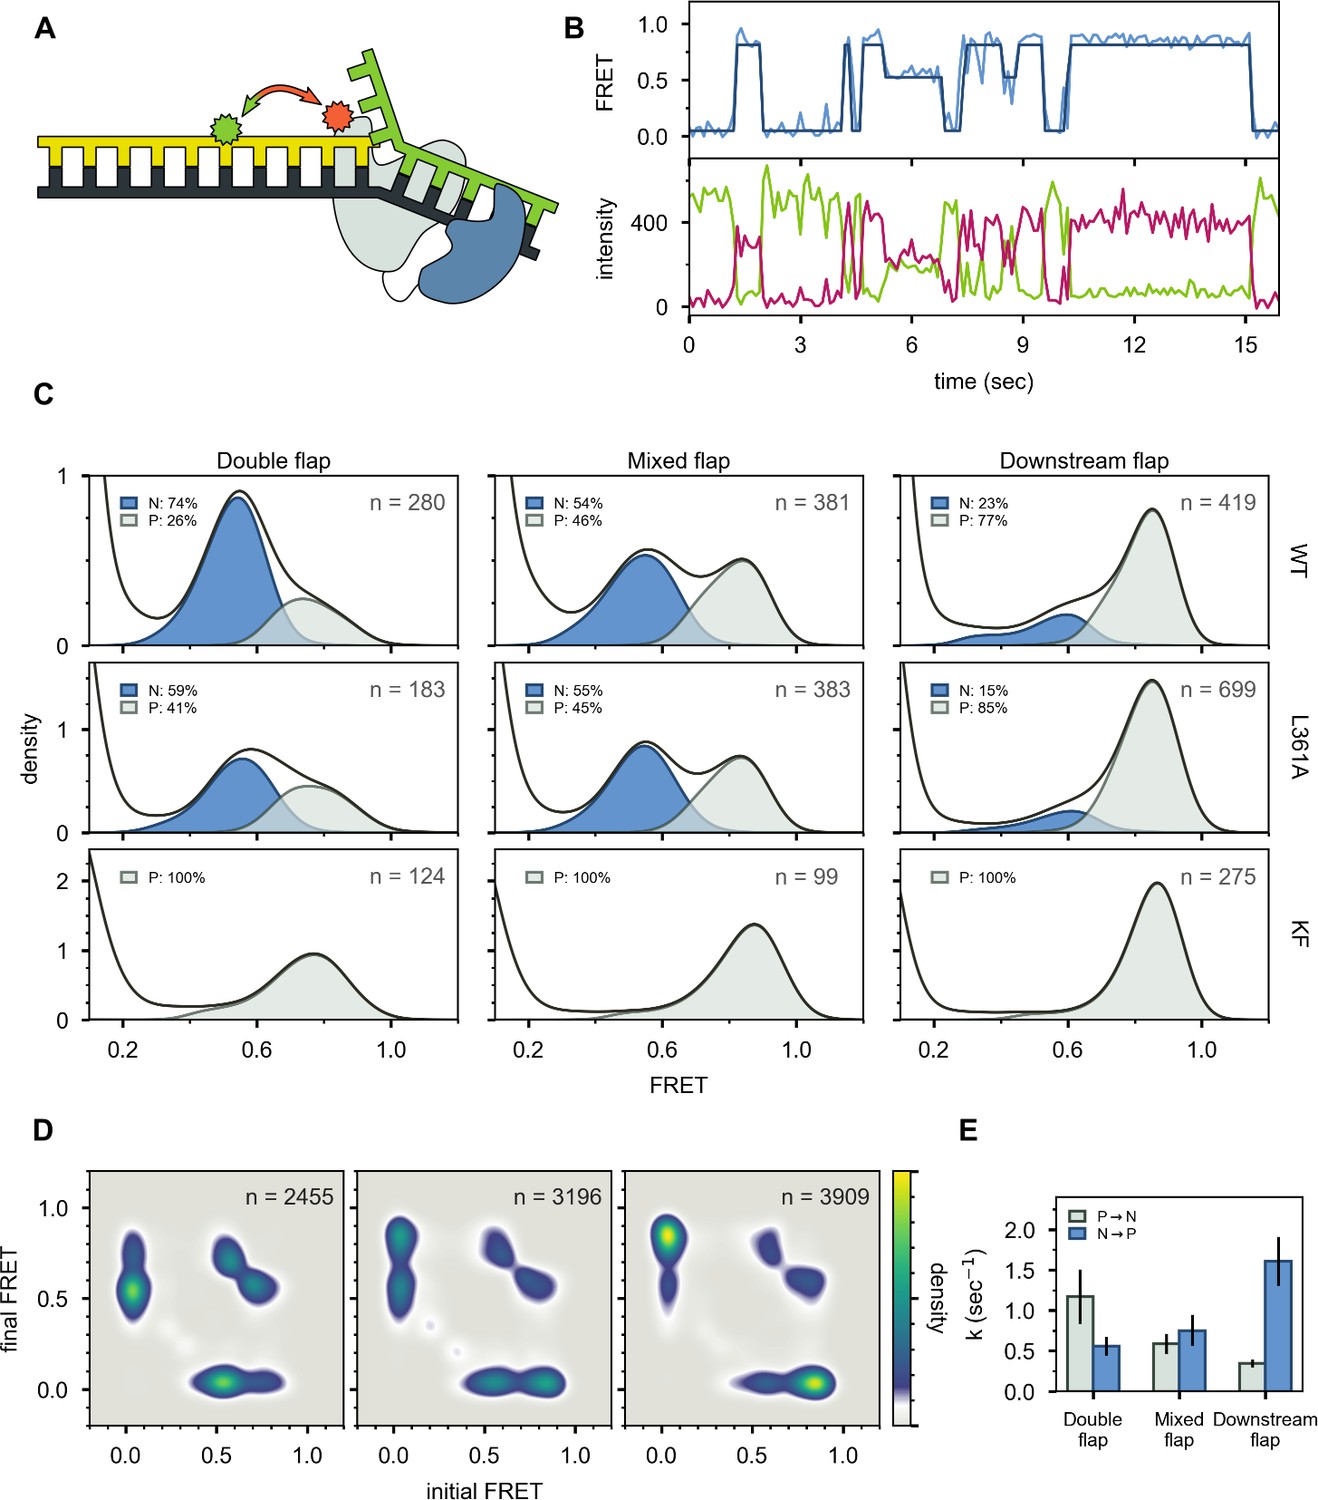
Probing the location of DNA substrates within Pol I.
(A) Schematic representation of the donor (green, attached to primer strand) and acceptor (magenta, attached to thumb region of Pol I) labeling sites. Pol I is depicted in cartoon form, with the core colored gray and the 5’ nuc domain colored blue. (B) Representative smFRET trajectory (blue) and donor (green) and acceptor (magenta) emission trajectories, for Pol I interacting with mixed flap substrate. The bold line is the idealized state path determined from Hidden Markov modeling. (C) Composite FRET efficiency histograms for states P and N, compiled from n individual FRET trajectories (n value indicated in each plot), for various combinations of DNA substrate and protein. The proteins, from top to bottom, are WT Pol I, Pol I L361A, and KF L361A. The corresponding populations of states P and N are indicated. (D) Transition density plots for Pol I interacting with flap-containing DNA substrates, compiled from a total of n transitions. From left to right: double flap DNA, mixed flap DNA and downstream flap DNA. (E) Rate constants for intramolecular transfer of DNA substrates from pol domain to 5’ nuc domain (P→N) or from 5’ nuc domain to pol domain (N→P).
Figure 3—figure supplement 1
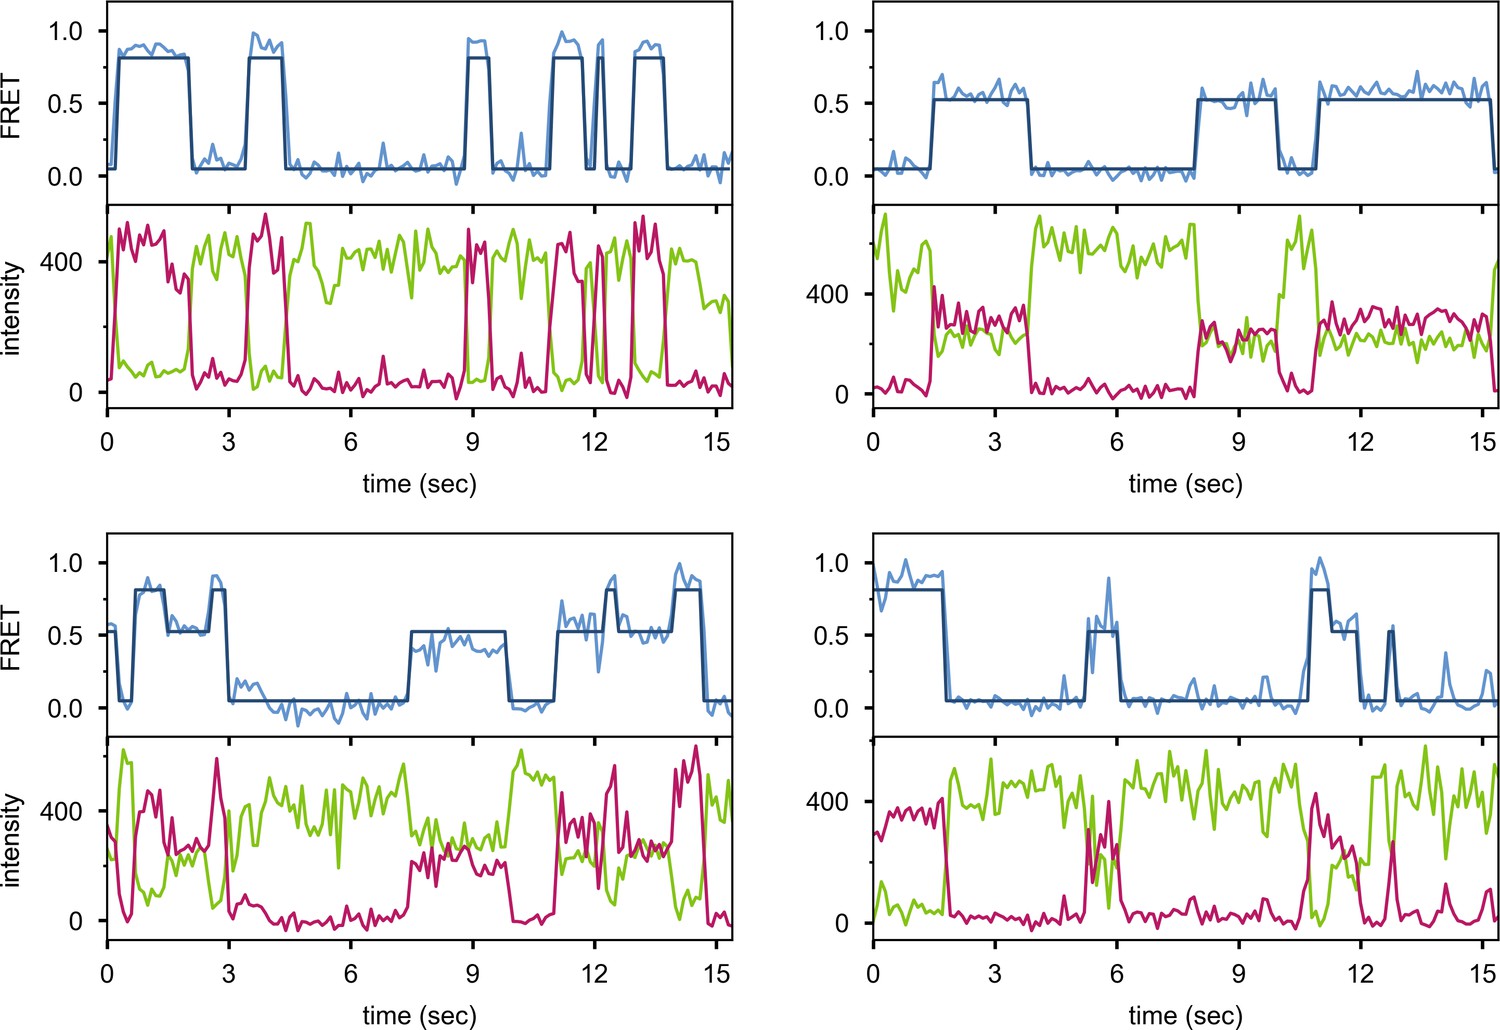
Additional examples of smFRET trajectories (blue) and corresponding donor intensity (green) and acceptor intensity (red).
The bold lines are idealized state paths from Hidden Markov modeling.
Figure 3—figure supplement 2
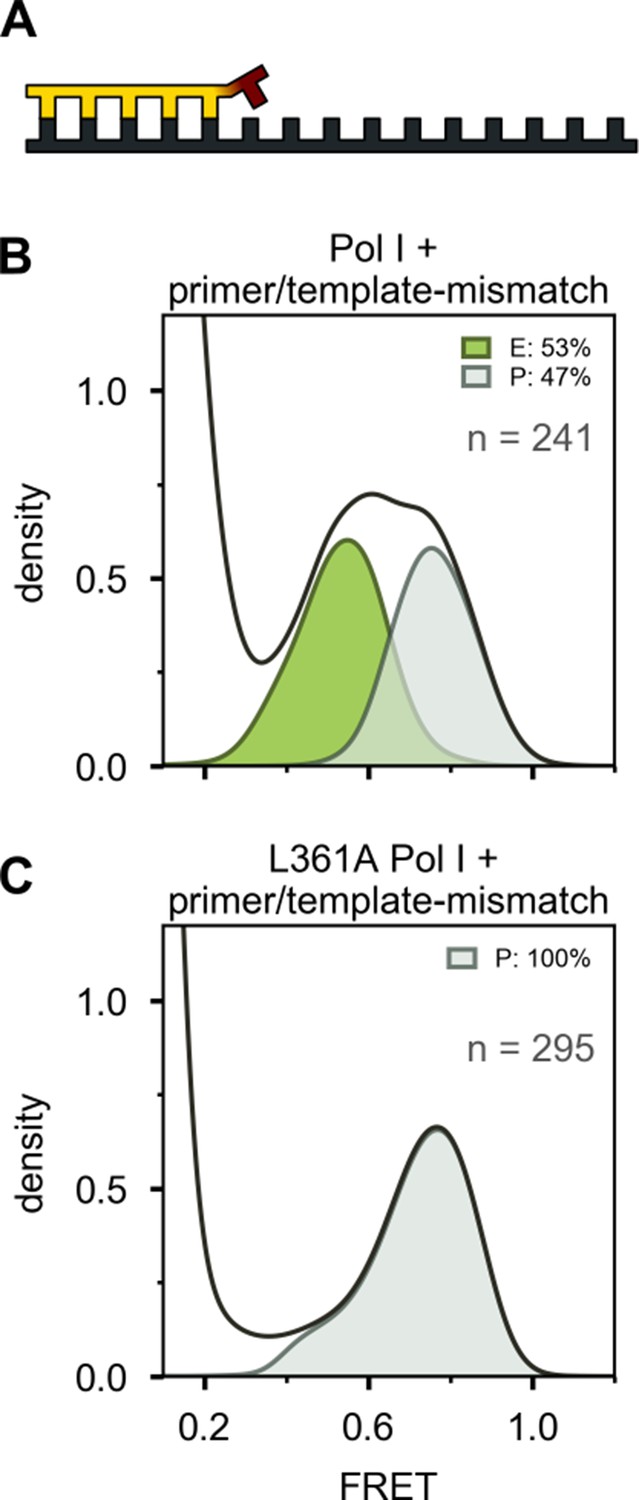
Interaction of Pol I with mismatched primer/template.
(A) Schematic illustration of mismatched primer/template. (B) FRET efficiency histogram for Pol I interacting with mismatched primer/template. (C) FRET efficiency histogram for Pol I containing L361A mutation interacting with mismatched primer/template. The fractional populations of states E and P are indicated in each case.
Figure 3—figure supplement 3
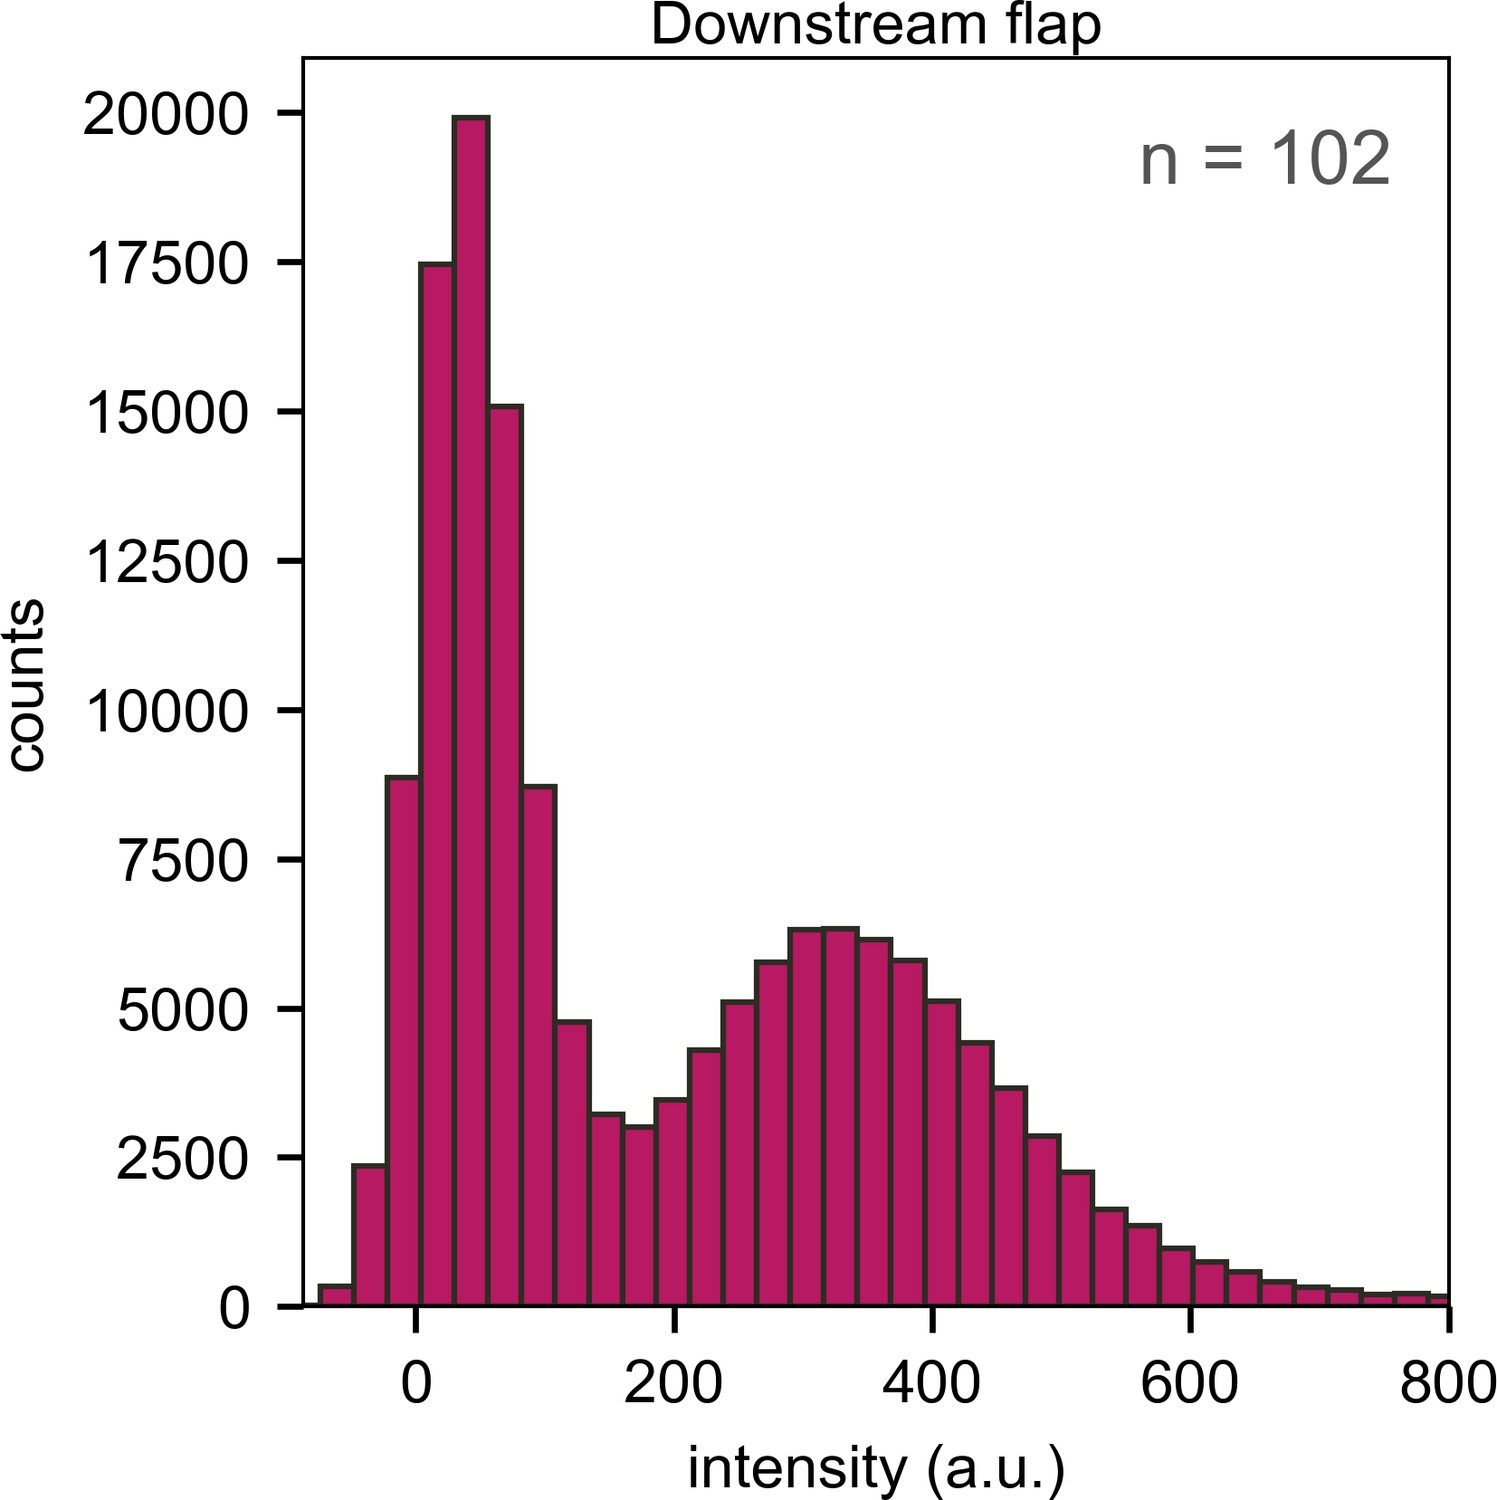
Histogram of emission intensities resulting from direct excitation of A594 in Pol I bound to downstream flap DNA, compiled from 102 individual emission trajectories.
The single peak centered at ∼350 a.u. indicates that only one enzyme molecule binds to the DNA. The peak at ∼0 a.u. corresponds to periods during which Pol I is not bound to the DNA.
Figure 3—figure supplement 4
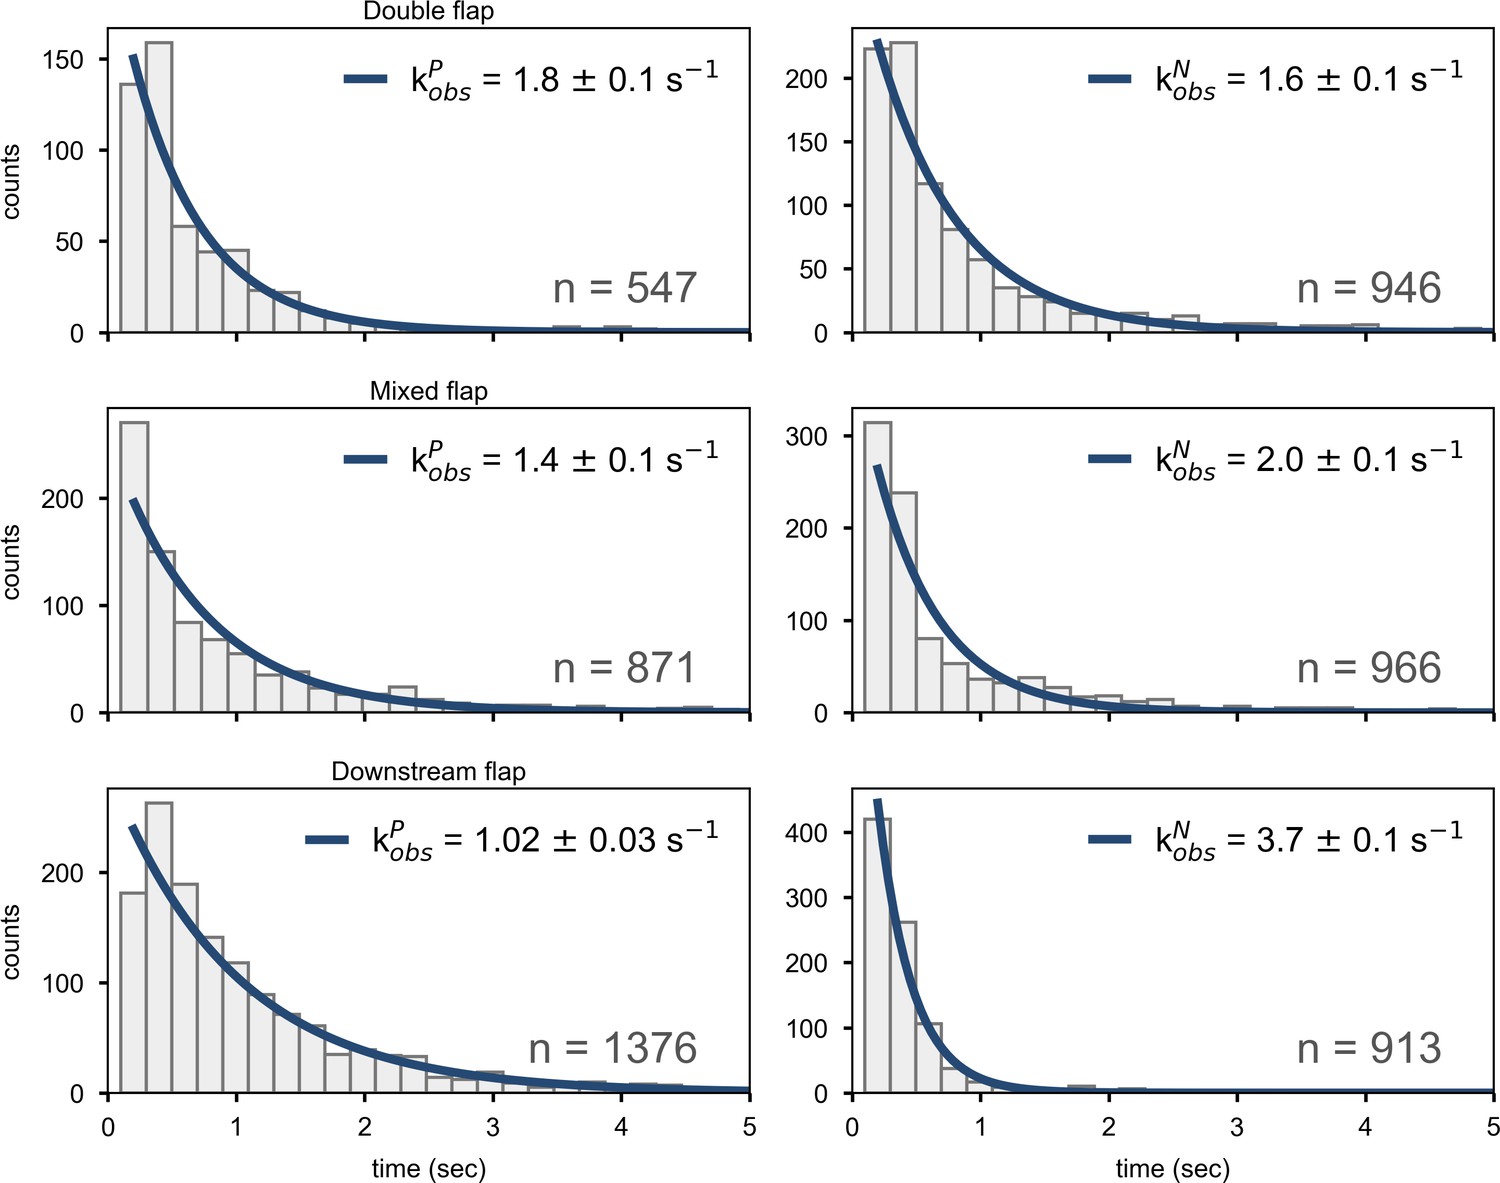
Dwell time histograms for overall decay of state P (left column) or state N (right column) for Pol I interacting with flap-containing DNA substrates, compiled from a total of n transitions.
The solid lines are best fits to a single exponential function, with the rate constants indicated.
Figure 4 with 2 supplements
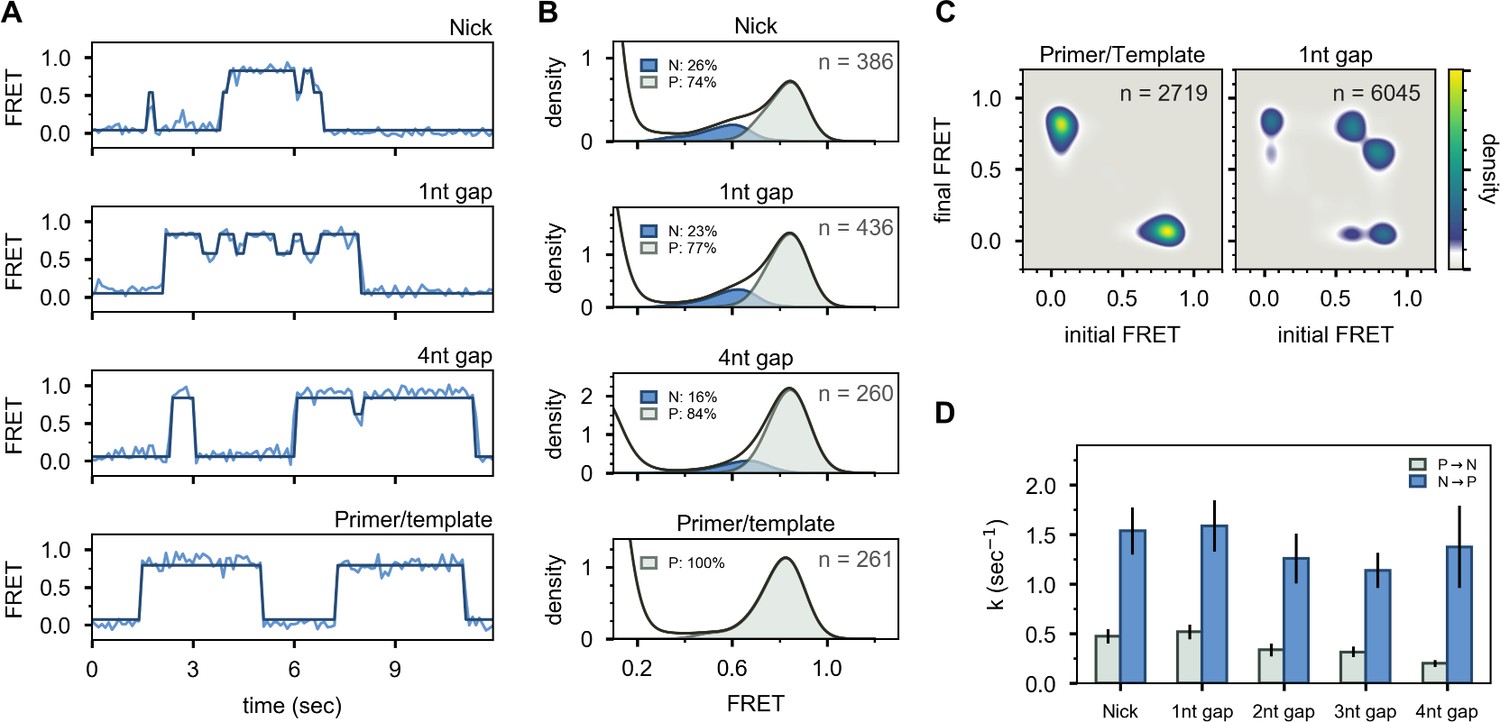
Interaction of Pol I with primer/template DNA or DNA substrates containing a nick or gap.
(A) Representative smFRET trajectories for DNA substrates interacting with Pol I, as indicated. Schematic representations of DNA substrates are shown in Figure 2. Bold lines are idealized state paths determined from Hidden Markov modeling. (B) Composite FRET efficiency histograms for states P and N compiled from n individual FRET trajectories, for various DNA substrates interacting with Pol I, as indicated. The corresponding populations of states P and N are indicated. (C) Transition density plots for Pol I interacting with various DNA substrates compiled from a total of n transitions, as indicated. (D) Rate constants for intramolecular transfer of various DNA substrates between pol domain and 5’ nuc domain (P→N, grey) or between 5’ nuc domain and pol domain (N→P, blue).
Figure 4—figure supplement 1
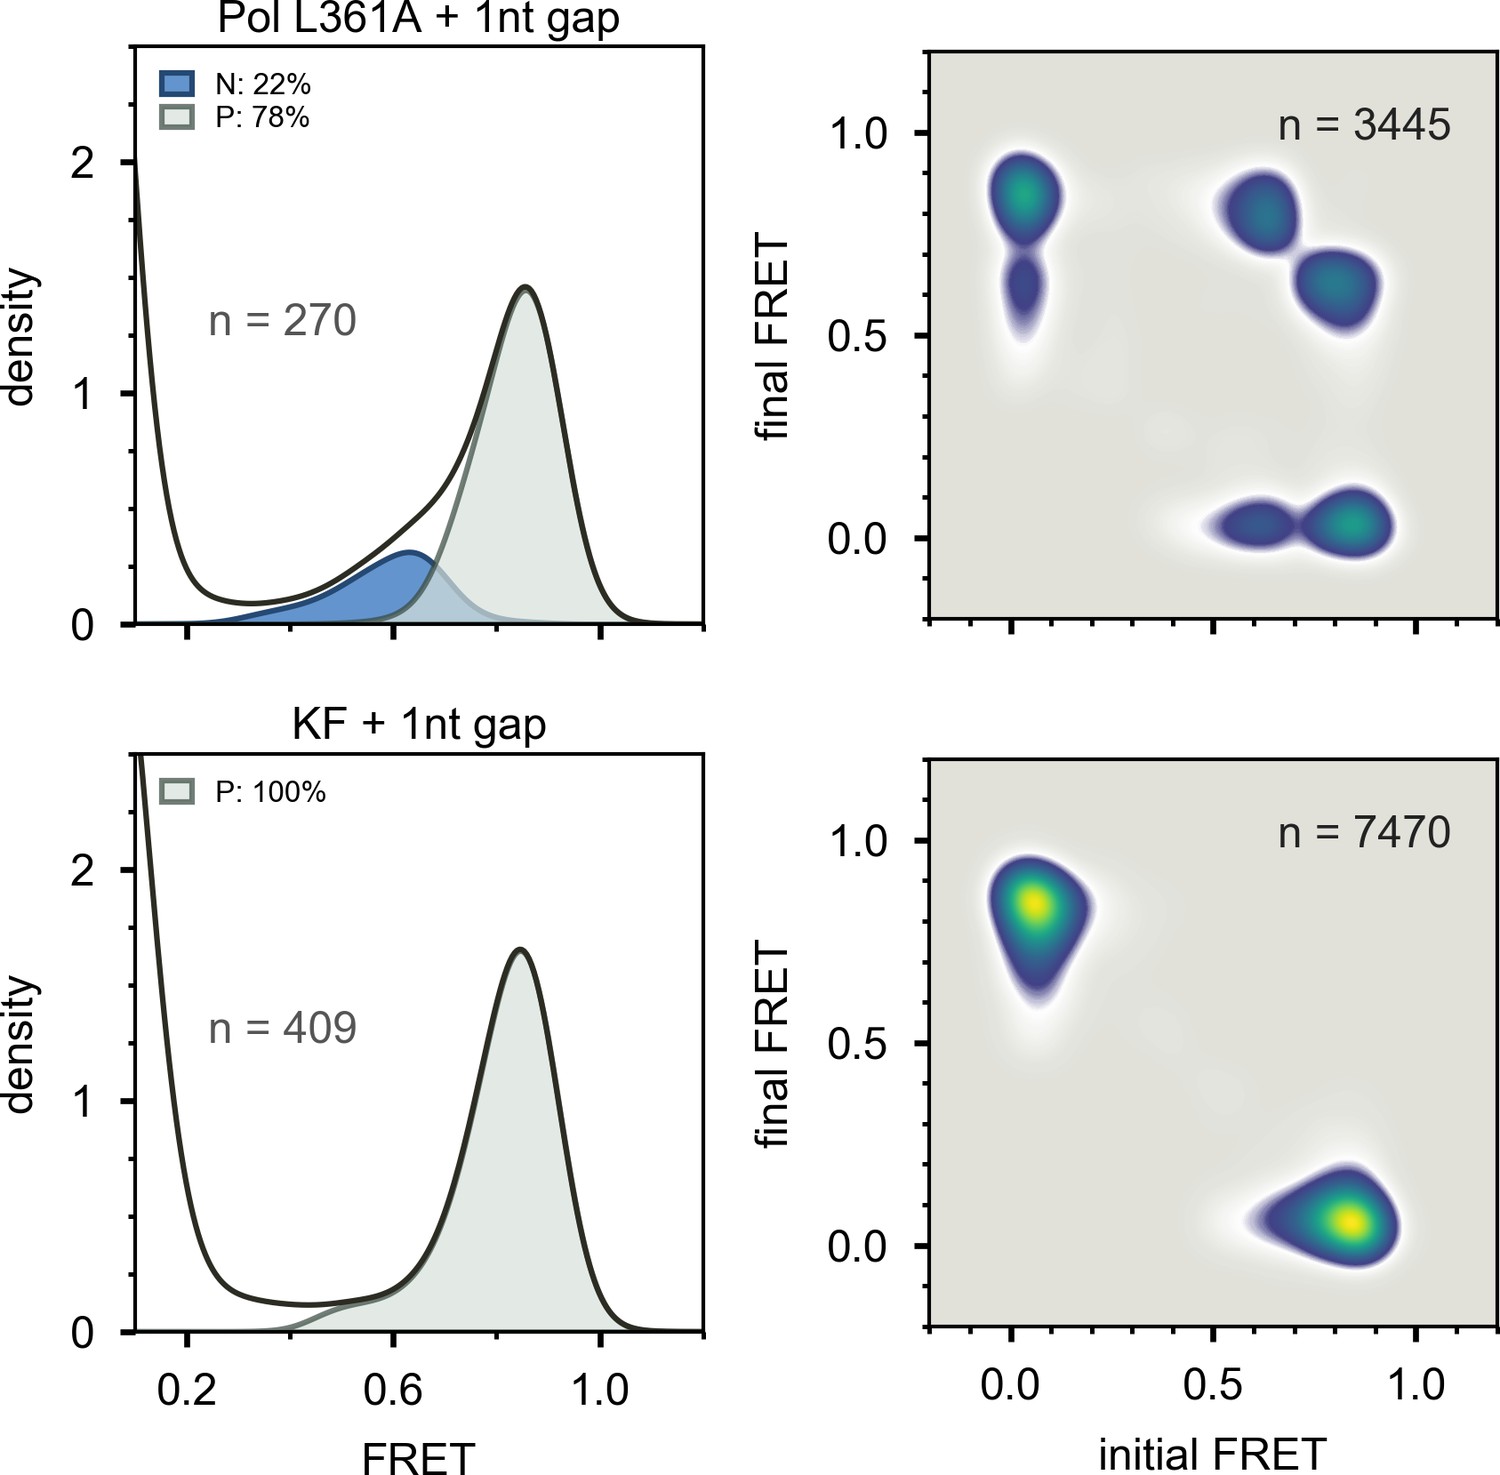
Histograms and TDPs of Pol I L361A and KF interacting with 1nt gap DNA.
Composite FRET efficiency histograms (left) and transition density plots (right) for Pol I L361A (top panels) and KF (bottom panels) interacting with 1nt gap substrate. The numbers of trajectories or transitions used to compile each plot are indicated.
Figure 4—figure supplement 2
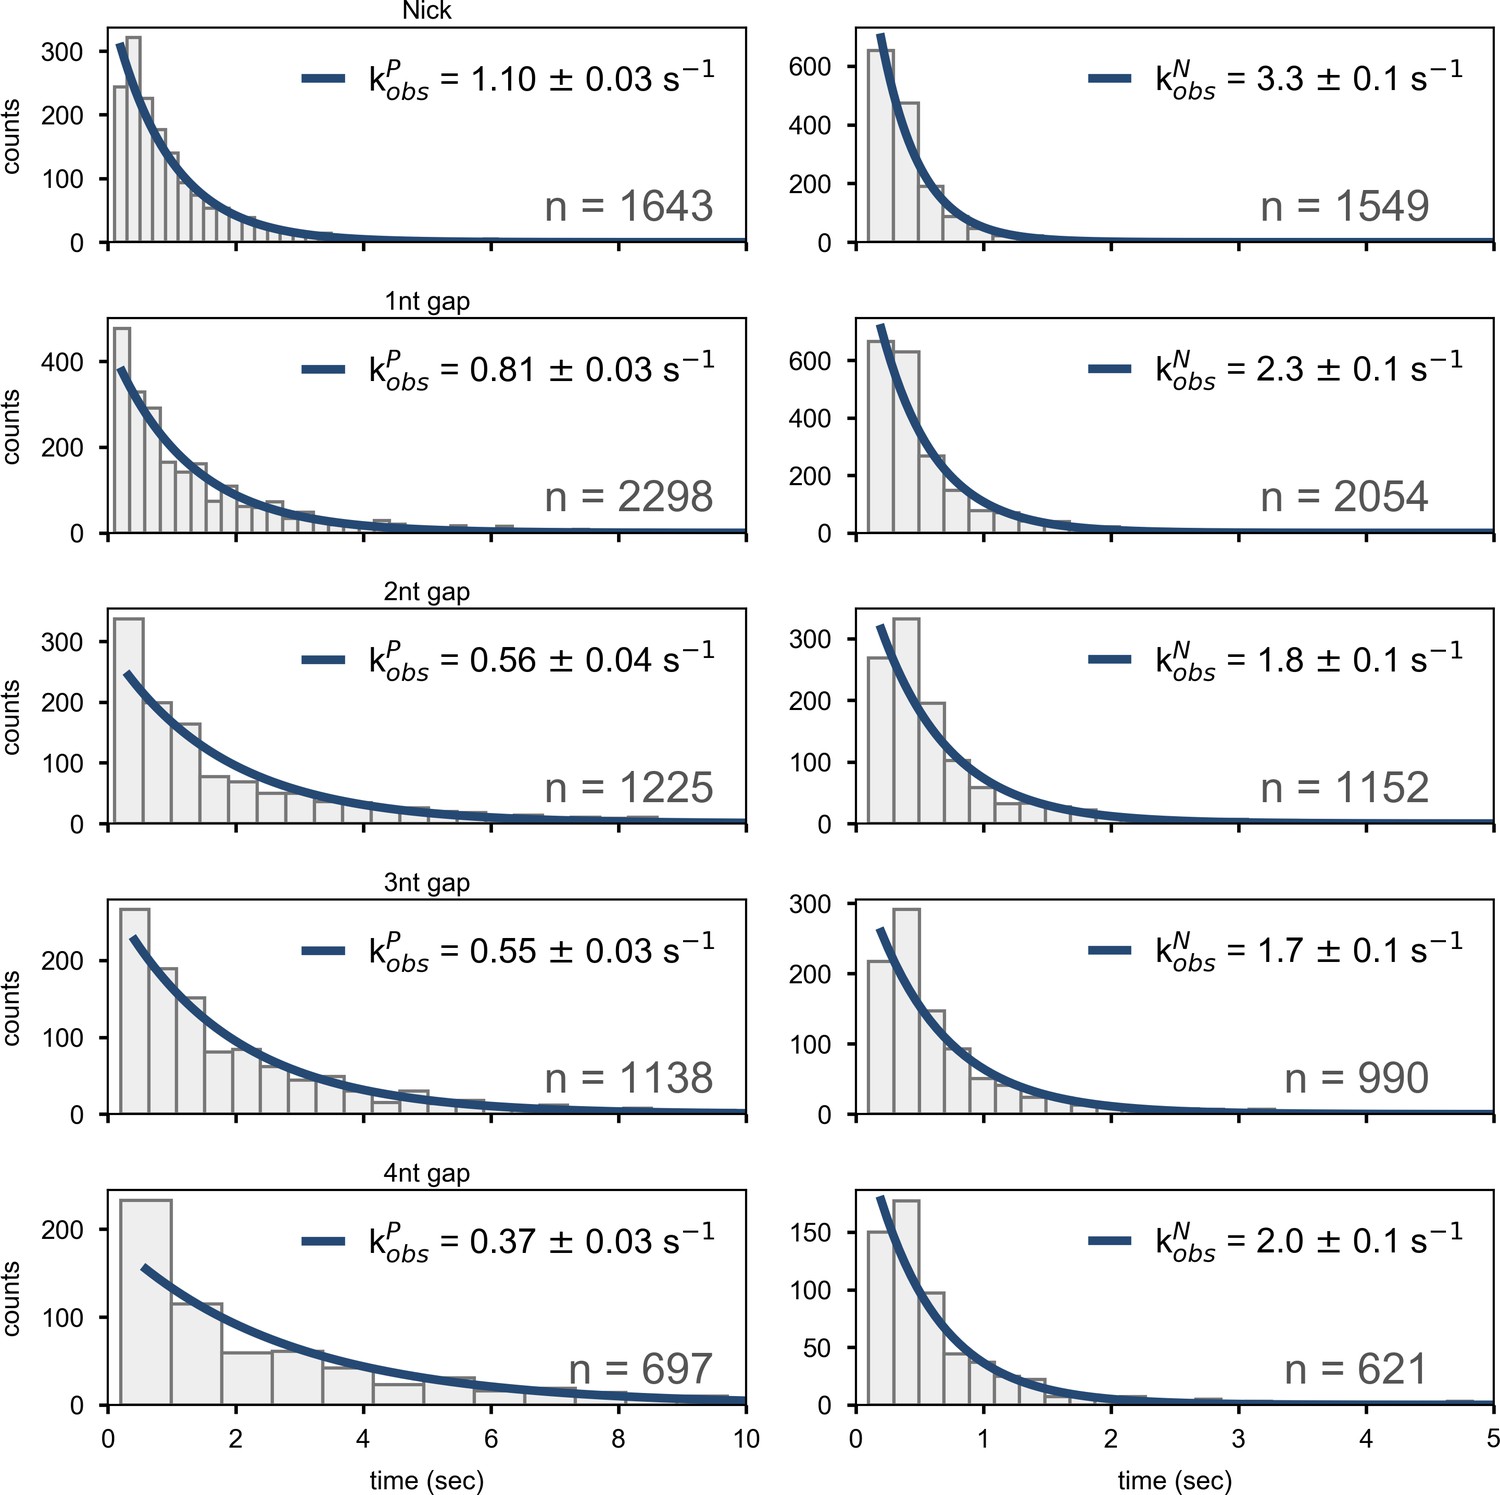
Dwell time histograms for overall decay of state P (left column) or state N (right column) for Pol I interacting with nick- or gap-containing DNA substrates, compiled from a total of n transitions.
The solid lines are best fits to a single-exponential function, with the rate constants indicated.
Figure 5
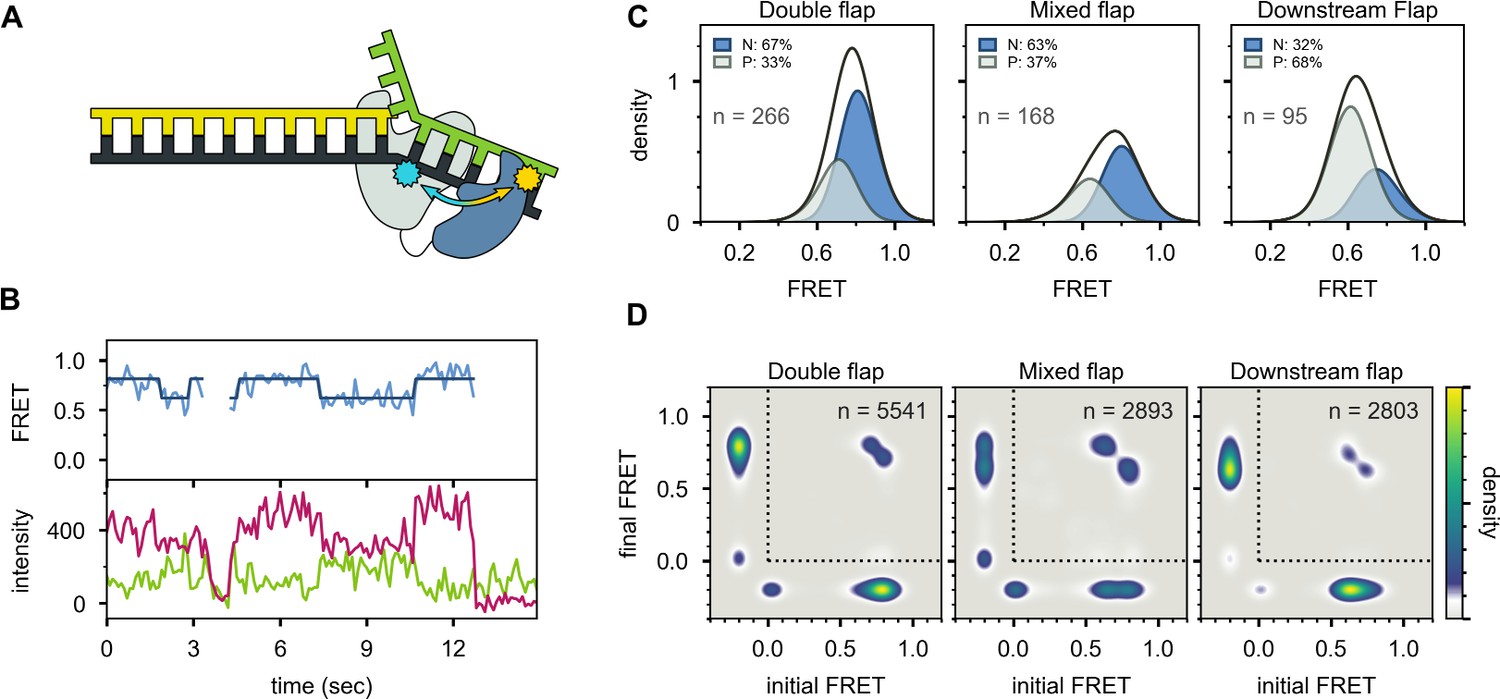
Probing the location of the 5’ nuc domain within Pol I bound to flap substrates.
(A) Schematic representation of donor (yellow, attached to 5’ nuc domain) and acceptor (cyan, attached to downstream template strand) labeling sites. (B) Representative set of donor, acceptor and FRET trajectories for mixed flap DNA substrate. The bold lines are idealized state paths from Hidden Markov modeling. (C) FRET efficiency histograms compiled from n individual FRET trajectories. (D) Transition density plots compiled from a total of n transitions. Since the FRET efficiency is not defined during periods when Pol I is not bound to DNA, the FRET efficiency is set to −0.2. The quadrant enclosed by the dotted lines corresponds to periods during which Pol I is bound to DNA.
Figure 6
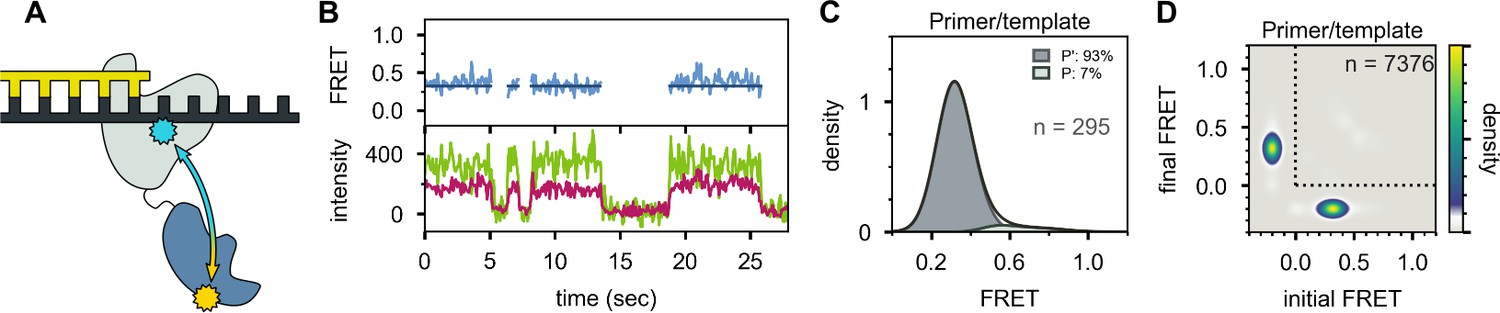
Location of the 5’ nuc domain within Pol I bound to primer/template substrate.
(A) Schematic representation of donor (yellow) and acceptor (cyan) labeling sites. (B) Representative set of donor, acceptor and FRET trajectories. (C) FRET efficiency histograms compiled from n individual FRET trajectories. (D) Transition density plot compiled from a total of n transitions. Same presentation as Figure 5D.
Figure 7
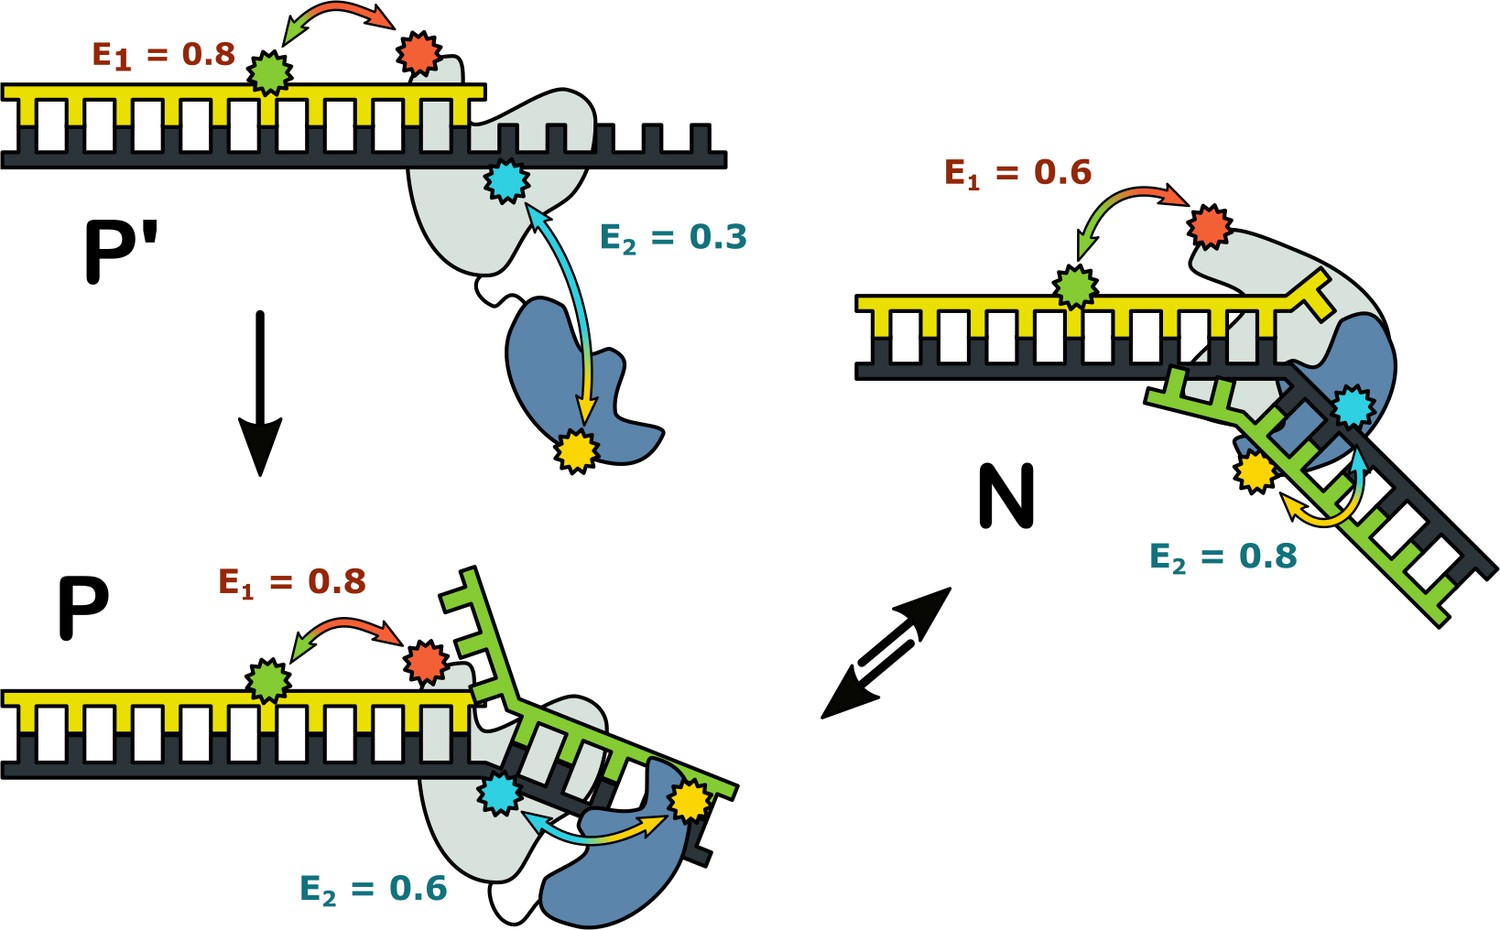
Possible configurations of Pol I-DNA complexes.
Complex P’: in the absence of a nearby downstream strand, the primer 3’ terminus resides in the pol domain within the enzyme core (grey) and the 5’ nuc domain (blue) is extended away from the core. The donor and acceptor probes for the first labeling scheme are green and magenta, respectively, while the donor and acceptor for the second labeling scheme are yellow and blue. The FRET efficiencies for the first and second labeling schemes are denoted E1 and E2, respectively. Complex P: The primer 3’ terminus resides in the pol domain and the 5’ nuc domain is located in proximity to a nearby downstream strand. Complex N: The 5’ nuc domain is docked with the downstream strand and the DNA primer 3’ terminus resides within the same domain.
Appendix 2—figure 1
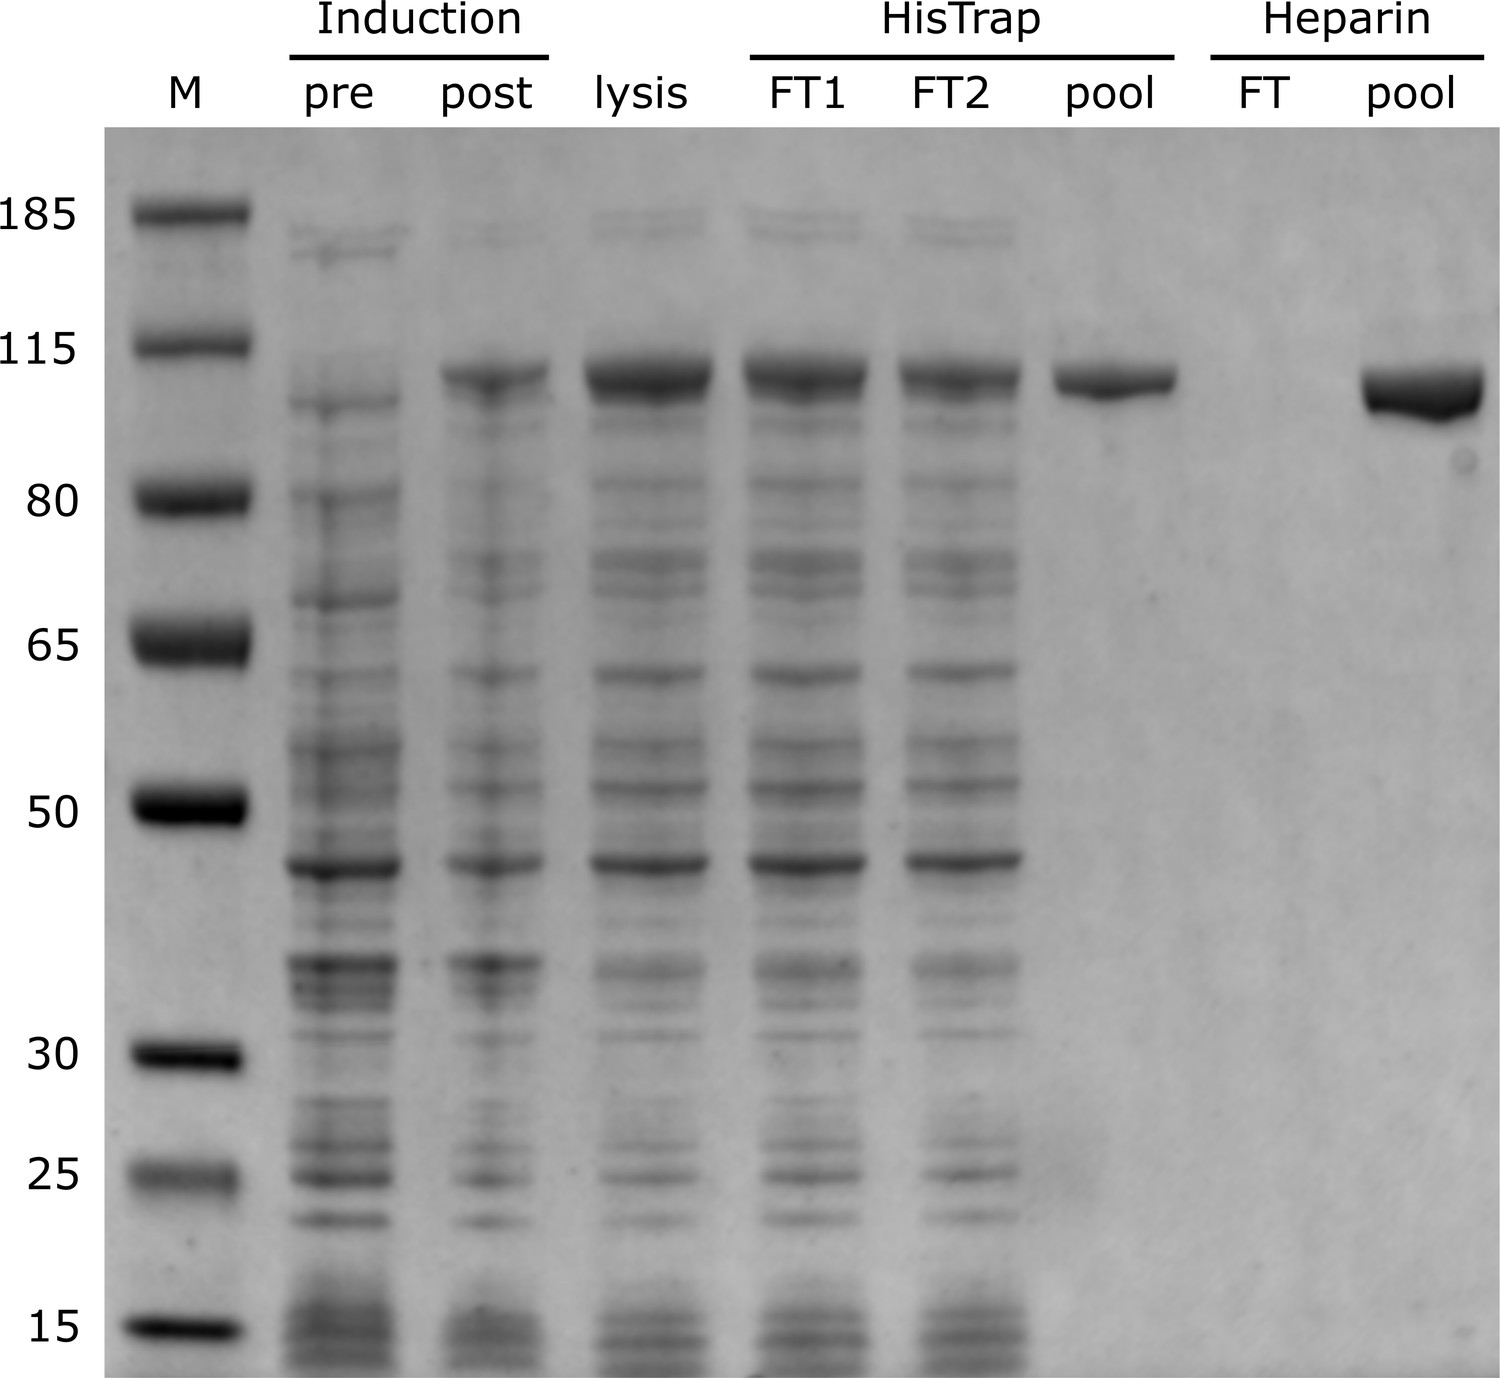
PAGE analysis of Pol I expression and purification steps.
(M = size marker; FT = flow-through).
Author response image 1
Tables
Key resources table
| Reagent type (species) or resource | Designation | Source or reference | Identifiers | Additional information |
|---|---|---|---|---|
| Strain, strain background (Escherichia coli) | CJ803 | Yale coli genetic stock center | ||
| Recombinant DNA | pXS67 | Yale coli genetic stock center | ||
| Commercial assay or kit | Q5 site-directed mutagenesis kit | New England Biolabs | #E0554 | |
| Quik Change kit | Agilent | 200523 | ||
| Chemical compound | Alexa Fluor 488 NHS ester | Thermo Fisher | A20000 | |
| Alexa Fluor 488 C5 maleimide | Thermo Fisher | A10254 | ||
| Alexa Fluor 594 NHS ester | Thermo Fisher | A20004 | ||
| Alexa Fluor 594 C5 maleimide | Thermo Fisher | A10256 | ||
| Software, algorithm | scikit_learn | other | public domain | |
| Software, algorithm | SciPy | other | public domain |
Appendix 1—table 1
Sequences of DNA oligonucleotides used to construct substrates for FRET scheme 1.
| Substrate | Oligo name | Sequence | |
|---|---|---|---|
| Double flap | 17e | 5'- | TCGCAGCCGYCAATATg |
| T2b | 3'-BT10- | AGCGTCGGCAGTTATAGATATAGCTTCGGAACAC −5' | |
| D18c_2 | taCTATATCGAAGCCTTGTG −3' | ||
| Mixed flap | 17e | 5'- | TCGCAGCCGYCAATATG |
| T1b | 3'-BT10- | AGCGTCGGCAGTTATACATATAGCTTCGGAACAC −5' | |
| D18b_2 | taGTATATCGAAGCCTTGTG −3' | ||
| Downstream flap | 17e | 5'- | TCGCAGCCGYCAATATG |
| T1b | 3'-BT10- | AGCGTCGGCAGTTATACATATAGCTTCGGAACAC −5' | |
| D18c_2 | tacTATATCGAAGCCTTGTG −3' | ||
| Nick | 17e | 5'- | TCGCAGCCGYCAATATG |
| T1b | 3'-BT10- | AGCGTCGGCAGTTATACATATAGCTTCGGAACAC −5' | |
| D17b | TATATCGAAGCCTTGTG −3' | ||
| 1nt gap | 17e | 5'- | TCGCAGCCGYCAATATG |
| T1b | 3'-BT10- | AGCGTCGGCAGTTATACATATAGCTTCGGAACAC −5' | |
| D16b | ATATCGAAGCCTTGTG −3' | ||
| 2nt gap | 17e | 5'- | TCGCAGCCGYCAATATG |
| T1b | 3'-BT10- | AGCGTCGGCAGTTATACATATAGCTTCGGAACAC −5' | |
| D15b | TATCGAAGCCTTGTG −3' | ||
| 3nt gap | 17e | 5'- | TCGCAGCCGYCAATATG |
| T1b | 3'-BT10- | AGCGTCGGCAGTTATACATATAGCTTCGGAACAC −5' | |
| D14b | ATCGAAGCCTTGTG −3' | ||
| 4nt gap | 17e | 5'- | TCGCAGCCGYCAATATG |
| T1b | 3'-BT10- | AGCGTCGGCAGTTATACATATAGCTTCGGAACAC −5' | |
| D13b | TCGAAGCCTTGTG −3' | ||
| Primer/template | 17e | 5'- | TCGCAGCCGYCAATATG |
| T1b | 3'-BT10- | AGCGTCGGCAGTTATACATATAGCTTCGGAACAC −5' | |
| Primer/template- | 17e | 5'- | TCGCAGCCGYCAATATg |
| mismatch | T2b | 3'-BT10- | AGCGTCGGCAGTTATAGATATAGCTTCGGAACAC −5' |
Appendix 1—table 2
Sequences of DNA oligonucleotides used to construct substrates for FRET scheme 2.
| Substrate | Oligo name | Sequence | |
|---|---|---|---|
| Double flap | P18mmt | 5'- | ACTTGAGAGCCGTATGAg |
| T33Y | 3'-BT10- | TGAACTCTCGGCATACTGGTAAYGGTAGCGTGC −5' | |
| D16 | ttCCATTACCATCGCACG −3' | ||
| Mixed flap | P18 | 5'- | ACTTGAGAGCCGTATGAC |
| T33Y | 3'-BT10- | TGAACTCTCGGCATACTGGTAAYGGTAGCGTGC −5' | |
| D16 | ttCCATTACCATCGCACG −3' | ||
| Downstream flap | P18 | 5'- | ACTTGAGAGCCGTATGAC |
| T33Y | 3'-BT10- | TGAACTCTCGGCATACTGGTAAYGGTAGCGTGC −5' | |
| D16mmt | ttgCATTACCATCGCACG −3' | ||
| Primer/template | P1 | 5'- | ACTTGAGAGCCGTATG |
| T33Y | 3'-BT10- | TGAACTCTCGGCATACTGGTAAYGGTAGCGTGC −5' | |
Appendix 3—table 1
Binding of Pol I to flap-containing DNA substrates.
| Substrate | () | |
|---|---|---|
| Double flap | 0.28 ± 0.03 | 13 ± 2 |
| Mixed flap | 0.27 ± 0.04 | 14 ± 3 |
| Downstream flap | 0.22 ± 0.03 | 18 ± 3 |
Appendix 3—table 2
Statistical frequencies of state-to-state transitions for Pol I interacting with flap-containing substrates.
| Transition frequencies | ||||
|---|---|---|---|---|
| Substrate | ||||
| Double flap | 0.6 ± 0.1 | 0.4 ± 0.1 | 0.4 ± 0.1 | 0.6 ± 0.1 |
| Mixed flap | 0.4 ± 0.1 | 0.6 ± 0.1 | 0.4 ± 0.1 | 0.6 ± 0.1 |
| Downstream flap | 0.34 ± 0.04 | 0.66 ± 0.04 | 0.4 ± 0.1 | 0.6 ± 0.1 |
Appendix 3—table 3
Rate constants for state-to-state transitions for Pol I interacting with flap-containing substrates.
| Rate constants (s-1) | ||||
|---|---|---|---|---|
| Substrate | ||||
| Double flap | 1.2 ± 0.1 | 0.6 ± 0.2 | 0.56 ± 0.05 | 1.0 ± 0.2 |
| Mixed flap | 0.58 ± 0.04 | 0.8 ± 0.2 | 0.8 ± 0.1 | 1.3 ± 0.3 |
| Downstream flap | 0.34 ± 0.02 | 0.7 ± 0.1 | 1.6 ± 0.1 | 2.1 ± 0.4 |
Appendix 3—table 4
Statistical frequencies of state-to-state transitions for Pol I interacting with nick- or gap-containing substrates.
| Transition frequencies | ||||
|---|---|---|---|---|
| Substrate | ||||
| Nick | 0.4 ± 0.1 | 0.6 ± 0.1 | 0.5 ± 0.1 | 0.5 ± 0.1 |
| 1nt gap | 0.64 ± 0.04 | 0.36 ± 0.04 | 0.67 ± 0.04 | 0.33 ± 0.04 |
| 2nt gap | 0.6 ± 0.1 | 0.4 ± 0.1 | 0.7 ± 0.1 | 0.3 ± 0.1 |
| 3nt gap | 0.6 ± 0.1 | 0.4 ± 0.1 | 0.66 ± 0.04 | 0.34 ± 0.04 |
| 4nt gap | 0.54 ± 0.05 | 0.46 ± 0.05 | 0.7 ± 0.1 | 0.3 ± 0.1 |
Appendix 3—table 5
Rate constants for state-to-state transitions for Pol I interacting with nick- or gap-containing substrates.
| Rate constants () | ||||
|---|---|---|---|---|
| Substrate | ||||
| Nick | 0.47 ± 0.02 | 0.6 ± 0.1 | 1.5 ± 0.1 | 1.7 ± 0.3 |
| 1nt gap | 0.52 ± 0.02 | 0.30 ± 0.04 | 1.6 ± 0.1 | 0.8 ± 0.1 |
| 2nt gap | 0.34 ± 0.02 | 0.23 ± 0.04 | 1.3 ± 0.1 | 0.6 ± 0.1 |
| 3nt gap | 0.32 ± 0.02 | 0.23 ± 0.04 | 1.14 ± 0.05 | 0.6 ± 0.1 |
| 4nt gap | 0.20 ± 0.02 | 0.17 ± 0.03 | 1.4 ± 0.1 | 0.6 ± 0.2 |
Appendix 3—table 6
Binding of Pol I to various DNA substrates.
| Substrate | () | |
|---|---|---|
| Nick | 0.20 ± 0.02 | 20 ± 3 |
| 1nt gap | 0.39 ± 0.02 | 8 ± 1 |
| 2nt gap | 0.47 ± 0.04 | 6 ± 1 |
| 3nt gap | 0.52 ± 0.05 | 5 ± 1 |
| 4nt gap | 0.56 ± 0.04 | 4 ± 1 |
| primer/template | 0.27 ± 0.02 | 14 ± 2 |
Appendix 4—table 1
Steady-state fluorescence controls.
| Labeled macromolecule | Label | Ligand | Normalized intensity | Anisotropy |
|---|---|---|---|---|
| Double flap | A488 | none | 1.0 | 0.05 ± 0.01 |
| Pol I | 0.94 | 0.21 ± 0.05 | ||
| Primer/template | A488 | none | 1.0 | 0.05 ± 0.01 |
| Pol I | 1.2 | 0.22 ± 0.01 | ||
| Pol I | A594 | none | 1.0 | 0.32 ± 0.02 |
| double flap | 1.2 | 0.34 ± 0.03 | ||
| primer/template | 1.1 | 0.34 ± 0.03 |
-
total emission intensity normalized to the value for the free macromolecule A488 data obtained with excitation at 495 nm, A594 with excitation at 590 nm
Additional files
Download links
A two-part list of links to download the article, or parts of the article, in various formats.
Downloads (link to download the article as PDF)
Open citations (links to open the citations from this article in various online reference manager services)
Cite this article (links to download the citations from this article in formats compatible with various reference manager tools)
Single-molecule view of coordination in a multi-functional DNA polymerase
eLife 10:e62046.
https://doi.org/10.7554/eLife.62046


