Activity-dependent regulation of mitochondrial motility in developing cortical dendrites
- Department of Synapse and Network Development, Netherlands Institute for Neuroscience, Netherlands
- Department of Biological Sciences, University of Toronto Scarborough, Canada
- Department of Functional Genomics, Center for Neurogenomics and Cognitive Research, University Amsterdam, Netherlands
Figures
Figure 1
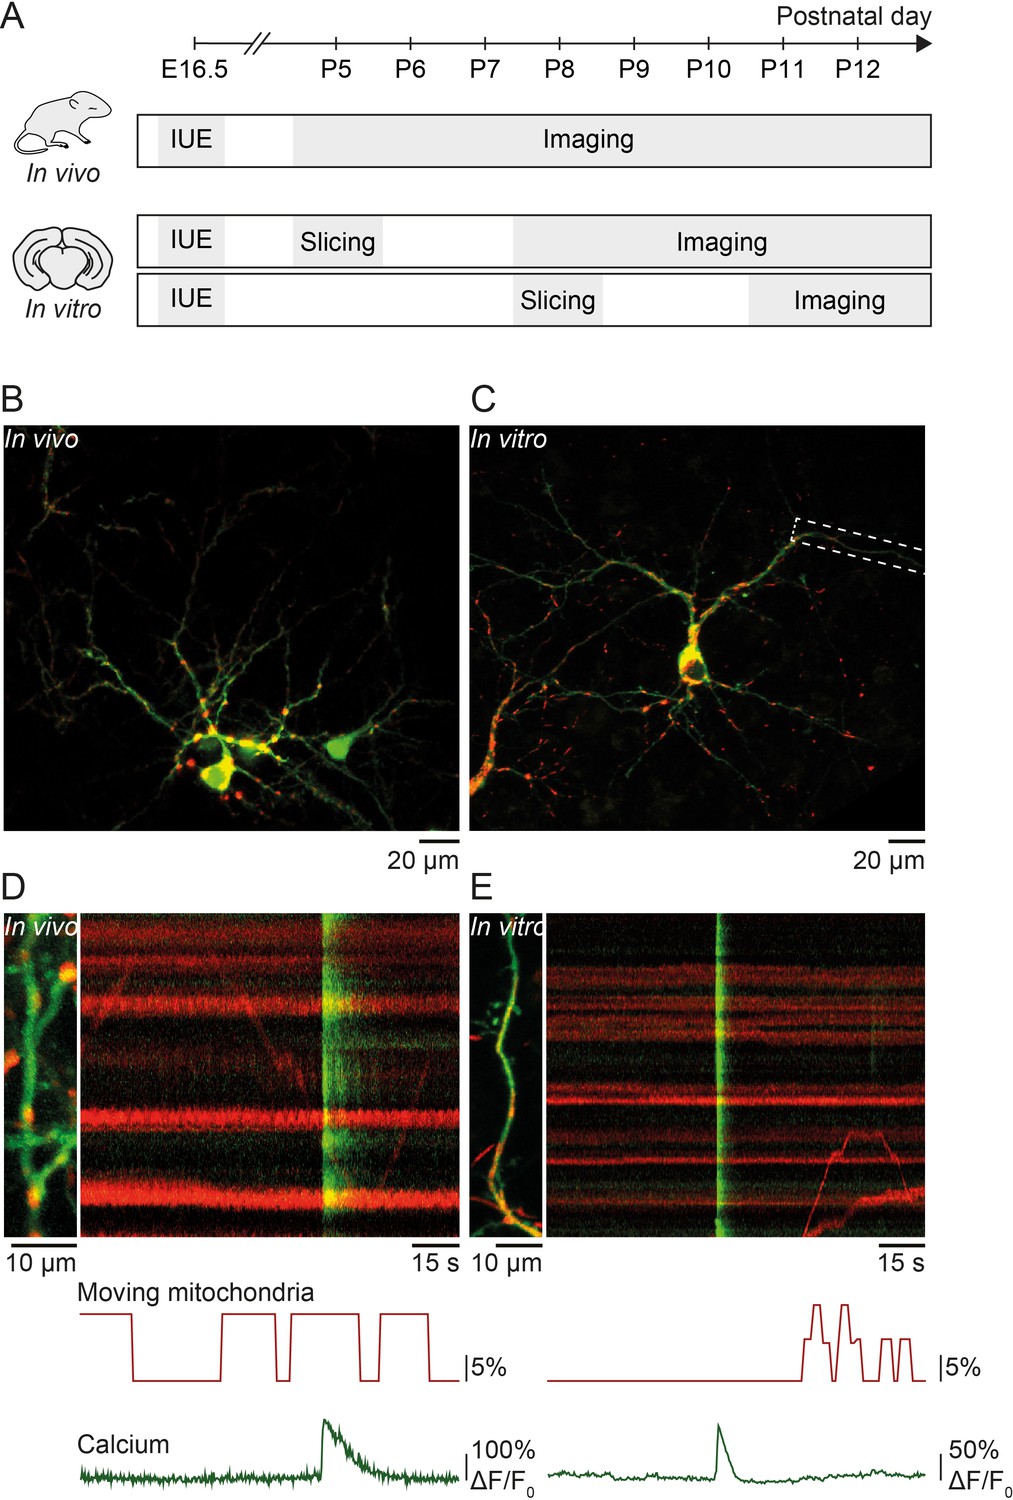
Simultaneous imaging of dendritic calcium transients and mitochondrial motility in vitro and in vivo.
(A) Timeline of in vivo and in vitro experiments: in utero electroporation (IUE) was performed at embryonic day (E) 16.5 to deliver GCaMP6s (calcium indicator) and Mito-DsRed (mitochondrial marker) to pyramidal neurons of layer II/III in the visual cortex. In vivo experiments: acute imaging of transfected dendrites in pups between postnatal day (P) 5 and P12 using a two-photon microscope. In vitro experiments: imaging of transfected dendrites using a confocal microscope in organotypic cortical slices cultured for 3–7 days after slice preparation from P5 or P8 pups. (B) GCaMP6- and Mito-DsRed-expressing layer II/III pyramidal neurons in vivo (P16). (C) GCaMP6- and Mito-DsRed-expressing layer II/III pyramidal neurons in vitro (P5 + DIV4). (D) Dendrite of layer II/III pyramidal neuron in vivo and kymograph (right) representing dendritic calcium transients (green) as well as motile and stationary mitochondria (red). Immobile mitochondria appear as horizontal lines (no change in position over time) and moving mitochondria as diagonal lines. Below, graphic representation of the percentage of moving mitochondria and global calcium transients. The percentage of moving mitochondria was calculated as the number of moving mitochondria over the total number of mitochondria, binned for every second. The mean percentage of moving mitochondria across the duration of this recording was 8.5%. Vertical green lines show spontaneously occurring global calcium transients, most likely resulting from back-propagating action potentials. (E) Dendrite of the layer II/III pyramidal neuron shown in C. The mean percentage of moving mitochondria across the duration of the recording was 2.4%.
Figure 2 with 2 supplements
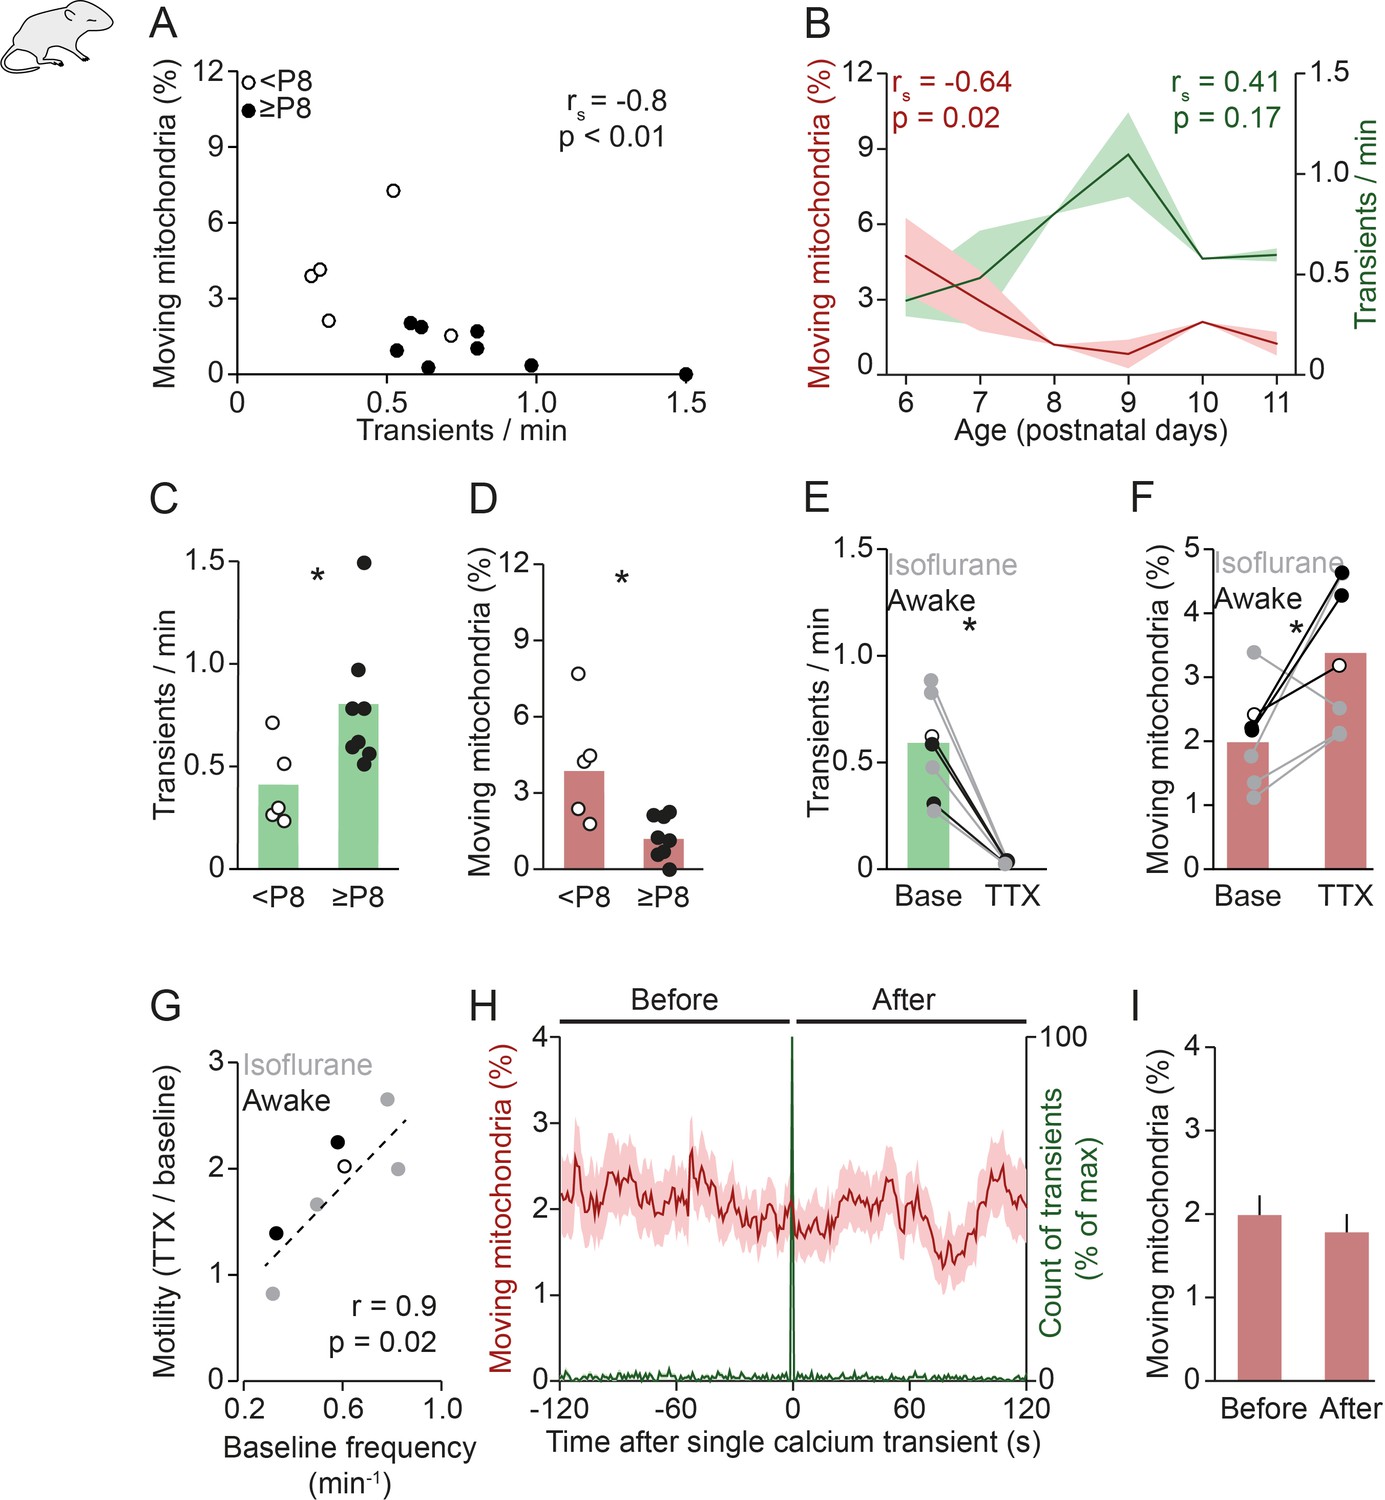
Mitochondrial motility and spontaneous activity are anti-correlated during in vivo early postnatal development.
(A) Anti-correlation between the frequency of spontaneous global calcium transients and the percentage of moving mitochondria in imaging experiments of awake pups (n = 13 pups, Spearman’s rank correlation; 1192 mitochondria in 131 dendrites). (B) The frequency of spontaneous global calcium transients increased until postnatal day (P) 9 (but not significantly for the entire age range, Spearman’s rank correlation) and the percentage of moving mitochondria decreased over P6–11 in vivo (Spearman’s rank correlation). (C-D) When comparing awake animals younger than P8 to P8 and older, the frequency of spontaneous global calcium transients increased (t-test, n = 5 vs. n = 8, p = 0.02) and the percentage of moving mitochondria decreased (t-test, n = 5 vs. n = 8, p = 0.045). (E-F) Application of tetrodotoxin (TTX, 2 µM) on the surface of the cortex (n = 7 pups, 1625 mitochondria in 160 dendrites) completely abolished spontaneously occurring global calcium transients (paired t-test, p = 6*10–4) and increased the percentage of moving mitochondria (paired t-test, p = 0.035). (G) Higher baseline frequency of spontaneous global calcium transients was correlated with a larger effect of TTX on the percentage of moving mitochondria (n = 7 pups, Pearson correlation, r = 0.85, p = 0.015). (H-I): Mean mitochondrial motility time-locked to the onset of single global calcium transients. The percentage of moving mitochondria did not change significantly between the 2 minutes before and after spontaneously occurring global calcium transients in awake animals (n = 136 transients, paired t-test, p = 0.33).
-
Figure 2—source data 1
Source data for Figure 2A-D.
- https://cdn.elifesciences.org/articles/62091/elife-62091-fig2-data1-v1.xlsx
-
Figure 2—source data 2
Source data for Figure 2E-G.
- https://cdn.elifesciences.org/articles/62091/elife-62091-fig2-data2-v1.xlsx
-
Figure 2—source data 3
Source data for Figure 2H.
- https://cdn.elifesciences.org/articles/62091/elife-62091-fig2-data3-v1.xlsx
-
Figure 2—source data 4
Source data for Figure 2I.
- https://cdn.elifesciences.org/articles/62091/elife-62091-fig2-data4-v1.xlsx
Figure 2—figure supplement 1

Relationship between neuronal activity, mitochondrial motility, and age in vivo.
(A) Anti-correlation between the frequency of spontaneous global calcium transients and the percentage of moving mitochondria in animals under isoflurane anesthesia (Spearman’s rank correlation: rs = –0.47, p = 0.04). (B) The frequency of spontaneous global calcium transients increased with age (Spearman’s rank correlation). (C-D) When comparing animals younger than postnatal day (P) 8 to P8 and older, the frequency of spontaneous global calcium transients increased (t-test, n = 5 vs. n = 14, p = 3*10–6) and the percentage of moving mitochondria decreased (t-test, n = 5 vs. n = 14, p = 0.002) in animals under isoflurane anesthesia. (E-F) Mean mitochondrial speed time-locked to the onset of single global calcium transients. The speed of moving mitochondria did not change between the 2 min before and after a single spontaneously occurring calcium transient in vivo (right, Student’s t-test, n = 1029 mitochondria, p = 0.07).
-
Figure 2—figure supplement 1—source data 1
Source data for Figure 2—figure supplement 1A-D.
- https://cdn.elifesciences.org/articles/62091/elife-62091-fig2-figsupp1-data1-v1.xlsx
-
Figure 2—figure supplement 1—source data 2
Source data for Figure 2—figure supplement 1E.
- https://cdn.elifesciences.org/articles/62091/elife-62091-fig2-figsupp1-data2-v1.xlsx
-
Figure 2—figure supplement 1—source data 3
Source data for Figure 2—figure supplement 1F.
- https://cdn.elifesciences.org/articles/62091/elife-62091-fig2-figsupp1-data3-v1.xlsx
Figure 2—figure supplement 2
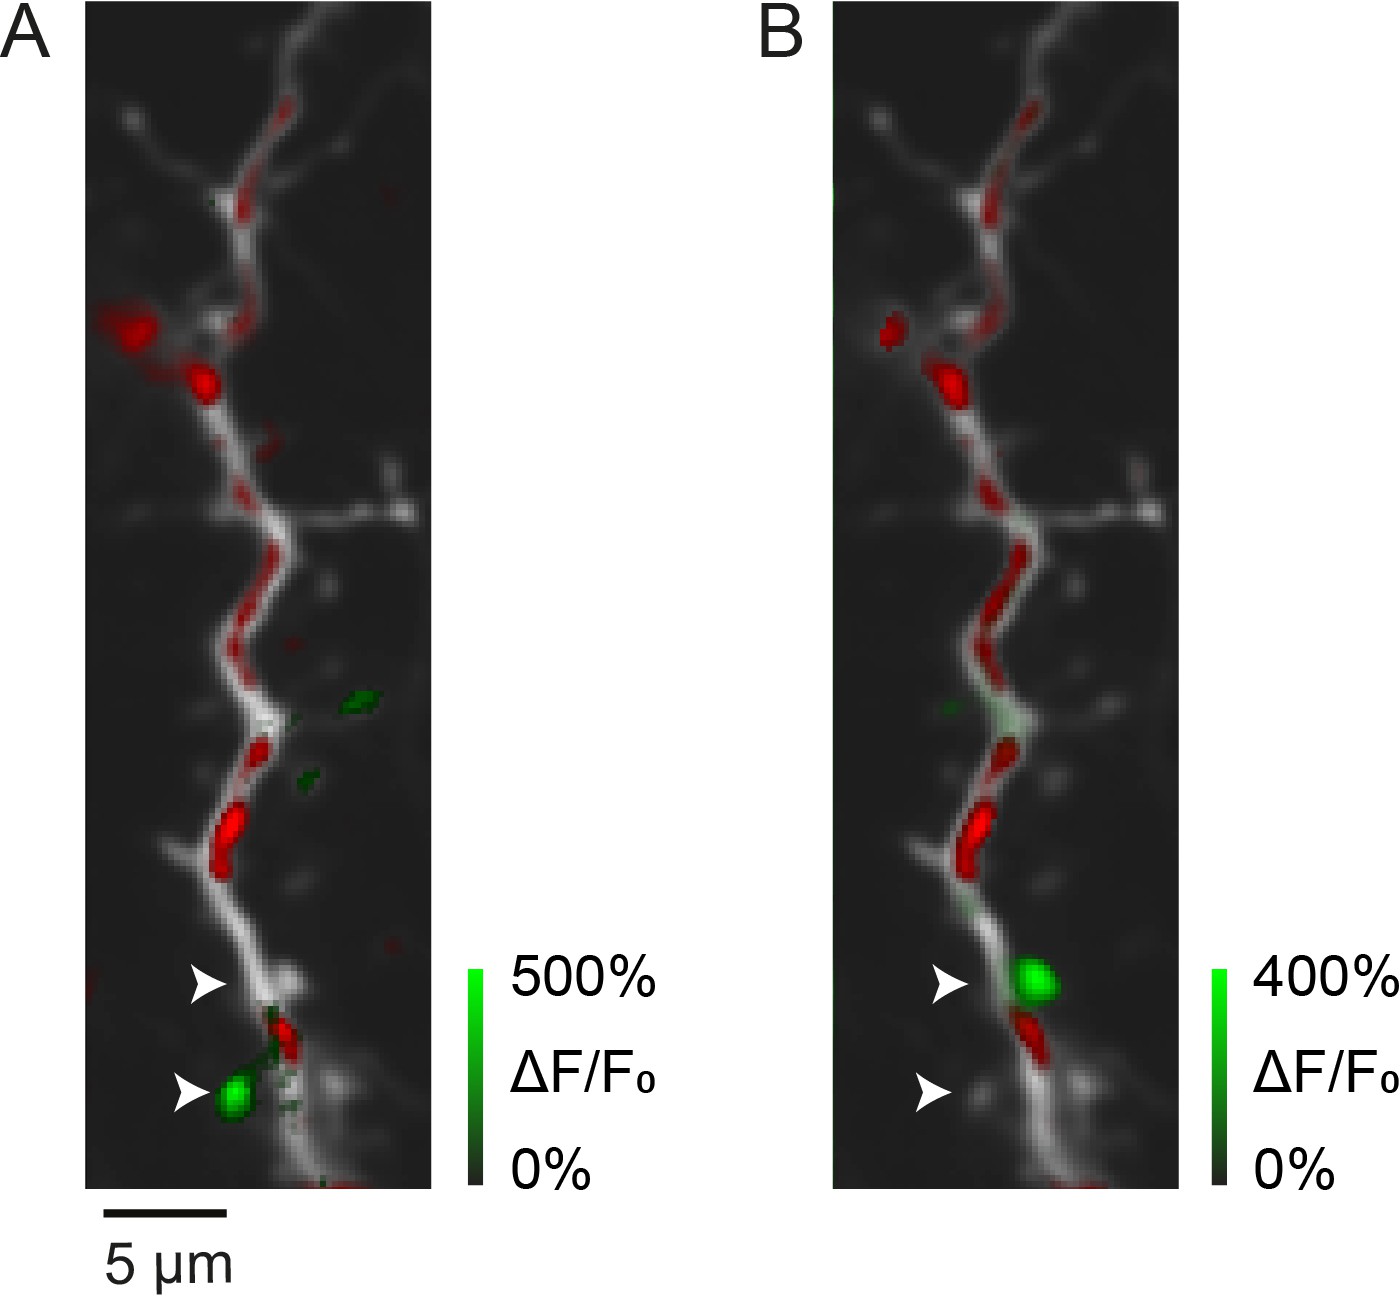
Synaptic calcium transients in vivo.
(A, B) Two examples of local calcium transients (green) in spines of a layer II/III pyramidal neuron dendrite at postnatal day (P) 13 (red: mitochondrial-DsRed). Arrow heads mark two spines that are activated in A or B.
Figure 3 with 2 supplements

Mitochondria stop at synapses after synaptic transmission events.
(A-B) Frequency of global calcium transients and mitochondrial motility in slices obtained from postnatal day (P) 5 and P8 pups. The frequency of spontaneous global calcium transients did not change significantly (n = 15 vs. n = 5 cells, Student’s t-test, p = 0.37). The percentage of moving mitochondria was significantly decreased in slices from older animals (n = 15 [252 mitochondria] vs. n = 5 [85 mitochondria], Student’s t-test, p = 0.02), similar to the in vivo results. (C-D) The percentage of moving mitochondria did not change significantly between the 2 min before and after spontaneously occurring calcium transients in P5 (n = 158 transients, paired t-test, p = 0.07) or P8 slices (paired t-test, n = 101 transients, p = 0.3). (E) Dendritic segment and kymograph showing a mitochondrion approaching and passing an inactive synapse (arrow). (F) Same dendritic segment as in A. A mitochondrion arrived near the same synapse (arrow) after a synaptic calcium transient occurred and stopped within its vicinity (Δx: distance to synapse, Δt: time after synaptic calcium transient). (G-H) Mitochondria moving toward a synapse can show one of two behaviors: they may continue moving (left) or stop near the synapse (right). We compared the percentage of approaching mitochondria that stopped within a specific distance range before individual synaptic calcium transients occurred (G) with that of mitochondria that reached a synapse after a transient (H) within a specific time interval. (I) There was a significant increase in the percentage of stopping mitochondria after a single local calcium transient occurred (distance ≤ 1 µm; interval ≤ 120 s; *p = 6*10–5, chi-squared test). (J) We compared the effect size of mitochondrial arrest at active synapses to a distribution generated by shuffling the time points at which synaptic calcium transients occurred (1000 runs). The observed effect size was within the top 5 percentile of those generated from shuffled data for distances ≤ 1 µm and intervals ≤ 120 s. (K) Quantitative estimation of the spatio-temporal characteristics of mitochondrial arrest (chi-squared test for each distance/interval pair Bonferroni-corrected; distance ≤ 1 µm; interval ≤ 80 s, p = 0.0035; interval ≤ 100 s, p = 0.0016; interval ≤ 120 s, p = 0.0025). (L) Matrix showing the individual chi-squared test p-values from each distance/interval pair. Roughly, p < 0.05 for intervals between 80 and 120 s and distances of up to 5 µm. (Number of observations for K,L: see Figure 3—figure supplement 2B.) (M) Distribution of mitochondrial arrest durations after single spontaneous synaptic events. Shown in dark gray are underestimated durations for data points where mitochondria remained immotile until the end of the recording.
-
Figure 3—source data 1
Source data for Figure 3A,B.
- https://cdn.elifesciences.org/articles/62091/elife-62091-fig3-data1-v1.xlsx
-
Figure 3—source data 2
Source data for Figure 3C.
- https://cdn.elifesciences.org/articles/62091/elife-62091-fig3-data2-v1.xlsx
-
Figure 3—source data 3
Source data for Figure 3D.
- https://cdn.elifesciences.org/articles/62091/elife-62091-fig3-data3-v1.xlsx
-
Figure 3—source data 4
Source data for Figure 3I.
- https://cdn.elifesciences.org/articles/62091/elife-62091-fig3-data4-v1.xlsx
-
Figure 3—source data 5
Source data for Figure 3J.
- https://cdn.elifesciences.org/articles/62091/elife-62091-fig3-data5-v1.xlsx
-
Figure 3—source data 6
Source data for Figure 3K.
- https://cdn.elifesciences.org/articles/62091/elife-62091-fig3-data6-v1.xlsx
-
Figure 3—source data 7
Source data for Figure 3L.
- https://cdn.elifesciences.org/articles/62091/elife-62091-fig3-data7-v1.xlsx
-
Figure 3—source data 8
Source data for Figure 3M.
- https://cdn.elifesciences.org/articles/62091/elife-62091-fig3-data8-v1.xlsx
Figure 3—figure supplement 1
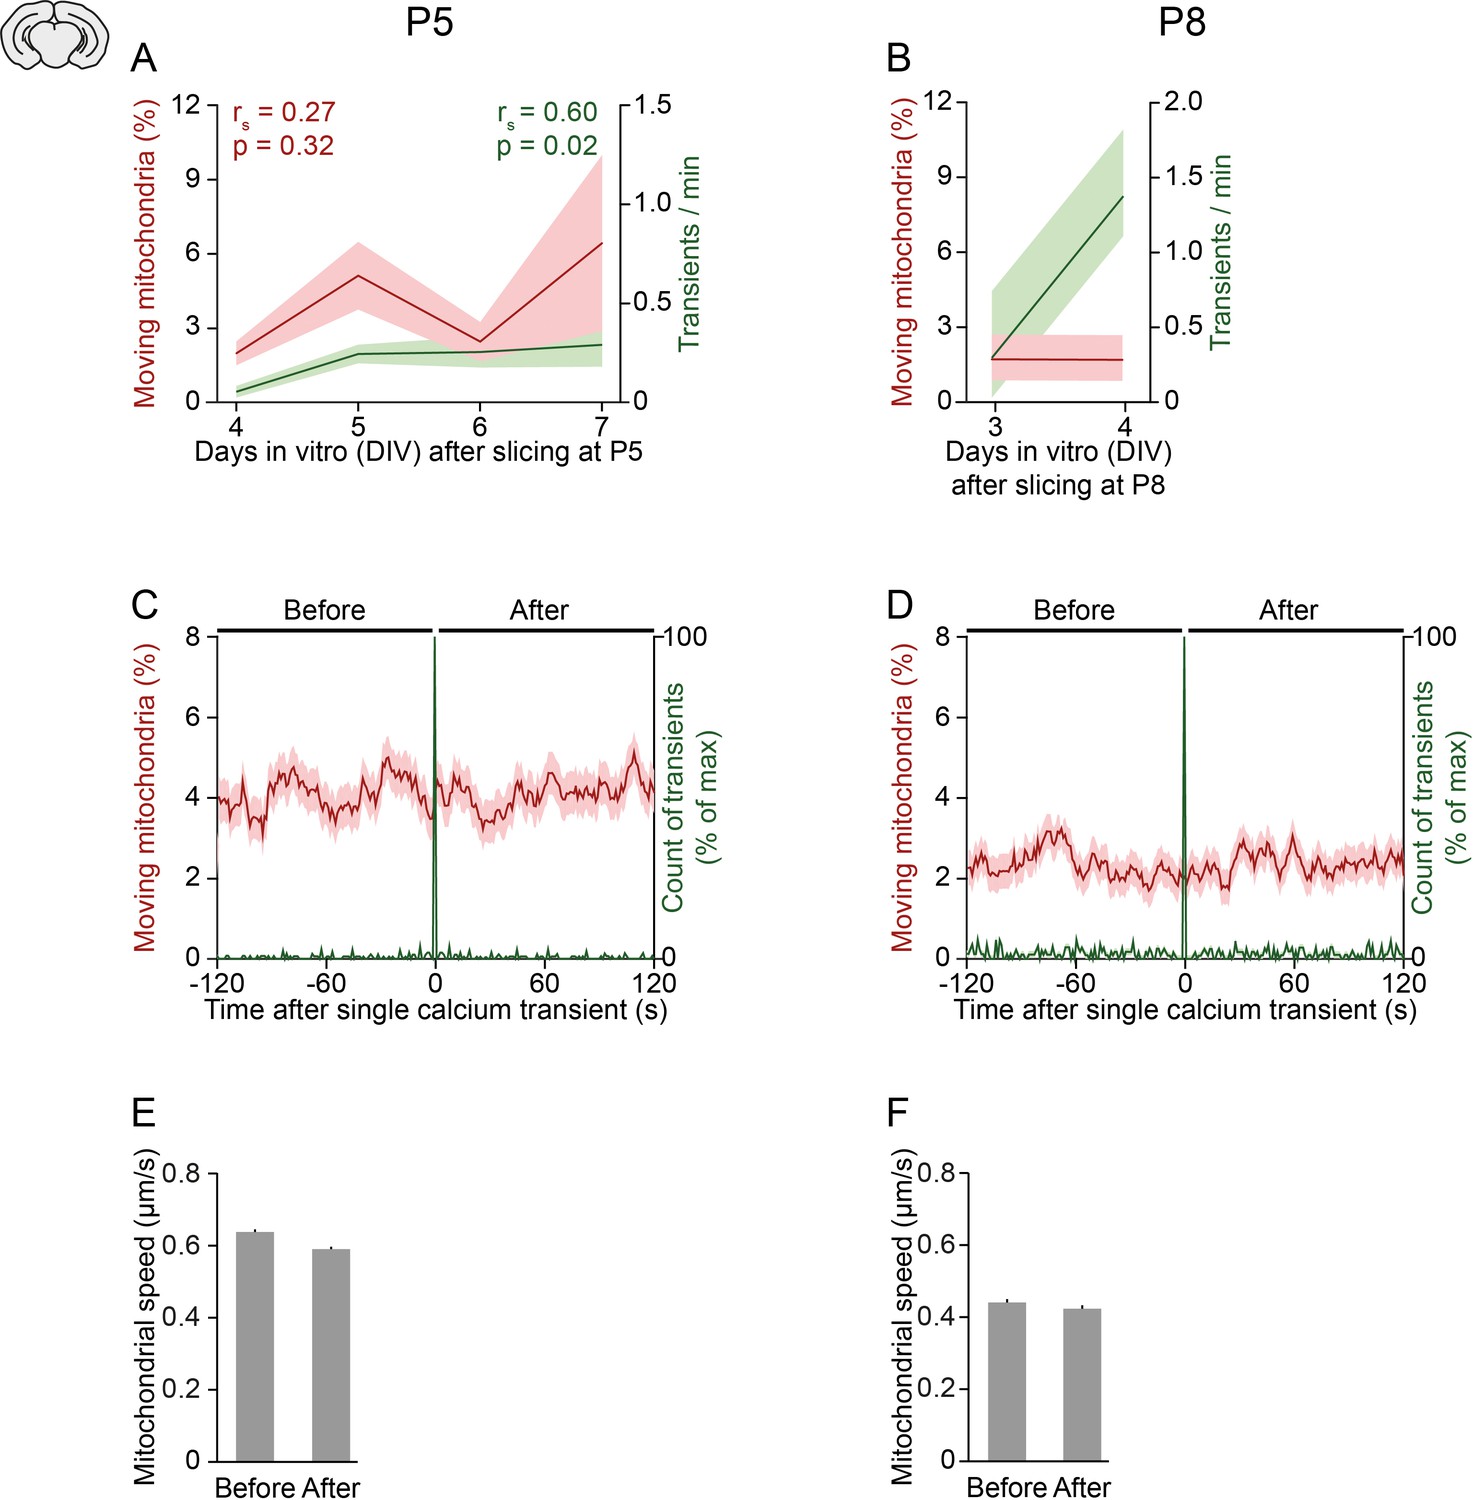
Relationship between neuronal activity, mitochondrial motility, and age in organotypic slice cultures.
(A-B) In slices obtained from postnatal day (P) 5 (A) or P8 pups (B), the frequency of spontaneous global calcium transients increased slightly over days in vitro whereas the motility of mitochondria did not change significantly (Spearman’s rank correlation). (C-D) Mean mitochondrial motility time-locked to the onset of single global calcium transients for slices obtained from P5 (C) and P8 pups (D). (E-F) The speed of moving mitochondria did not change between the 2 min before and after a single spontaneously occurring calcium transient in cells from P5 (E, Student’s t-test, n = 1592 mitochondria, p = 0.1) or P8 pups (F, paired t-test, n = 769 mitochondria, p = 0.5).
-
Figure 3—figure supplement 1—source data 1
Source data for Figure 3—figure supplement 1A,B.
- https://cdn.elifesciences.org/articles/62091/elife-62091-fig3-figsupp1-data1-v1.xlsx
-
Figure 3—figure supplement 1—source data 2
Source data for Figure 3—figure supplement 1C.
- https://cdn.elifesciences.org/articles/62091/elife-62091-fig3-figsupp1-data2-v1.xlsx
-
Figure 3—figure supplement 1—source data 3
Source data for Figure 3—figure supplement 1D.
- https://cdn.elifesciences.org/articles/62091/elife-62091-fig3-figsupp1-data3-v1.xlsx
-
Figure 3—figure supplement 1—source data 4
Source data for Figure 3—figure supplement 1E.
- https://cdn.elifesciences.org/articles/62091/elife-62091-fig3-figsupp1-data4-v1.xlsx
-
Figure 3—figure supplement 1—source data 5
Source data for Figure 3—figure supplement 1F.
- https://cdn.elifesciences.org/articles/62091/elife-62091-fig3-figsupp1-data5-v1.xlsx
Figure 3—figure supplement 2
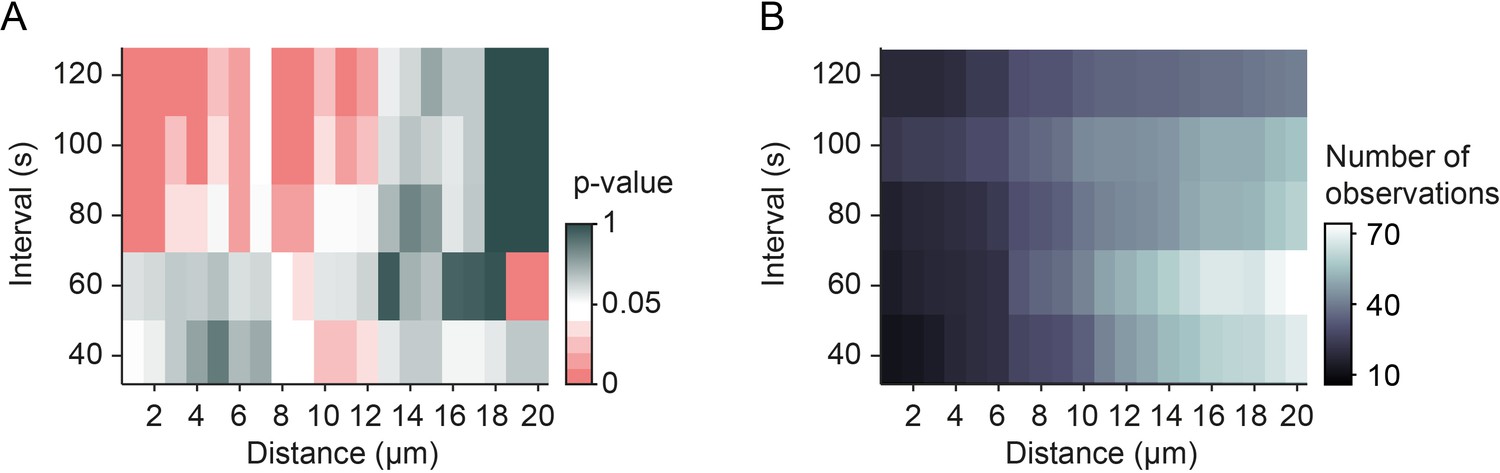
Number of observations for mitochondrial arrest at individual synapses.
(A) Significance levels (Figure 3L) and (B) number of observations for mitochondrial arrest at synapses after synaptic transmission events for each interval and distance bin.
-
Figure 3—figure supplement 2—source data 1
Source data for Figure 3—figure supplement 2A.
- https://cdn.elifesciences.org/articles/62091/elife-62091-fig3-figsupp2-data1-v1.xlsx
-
Figure 3—figure supplement 2—source data 2
Source data for Figure 3—figure supplement 2B.
- https://cdn.elifesciences.org/articles/62091/elife-62091-fig3-figsupp2-data2-v1.xlsx
Figure 4
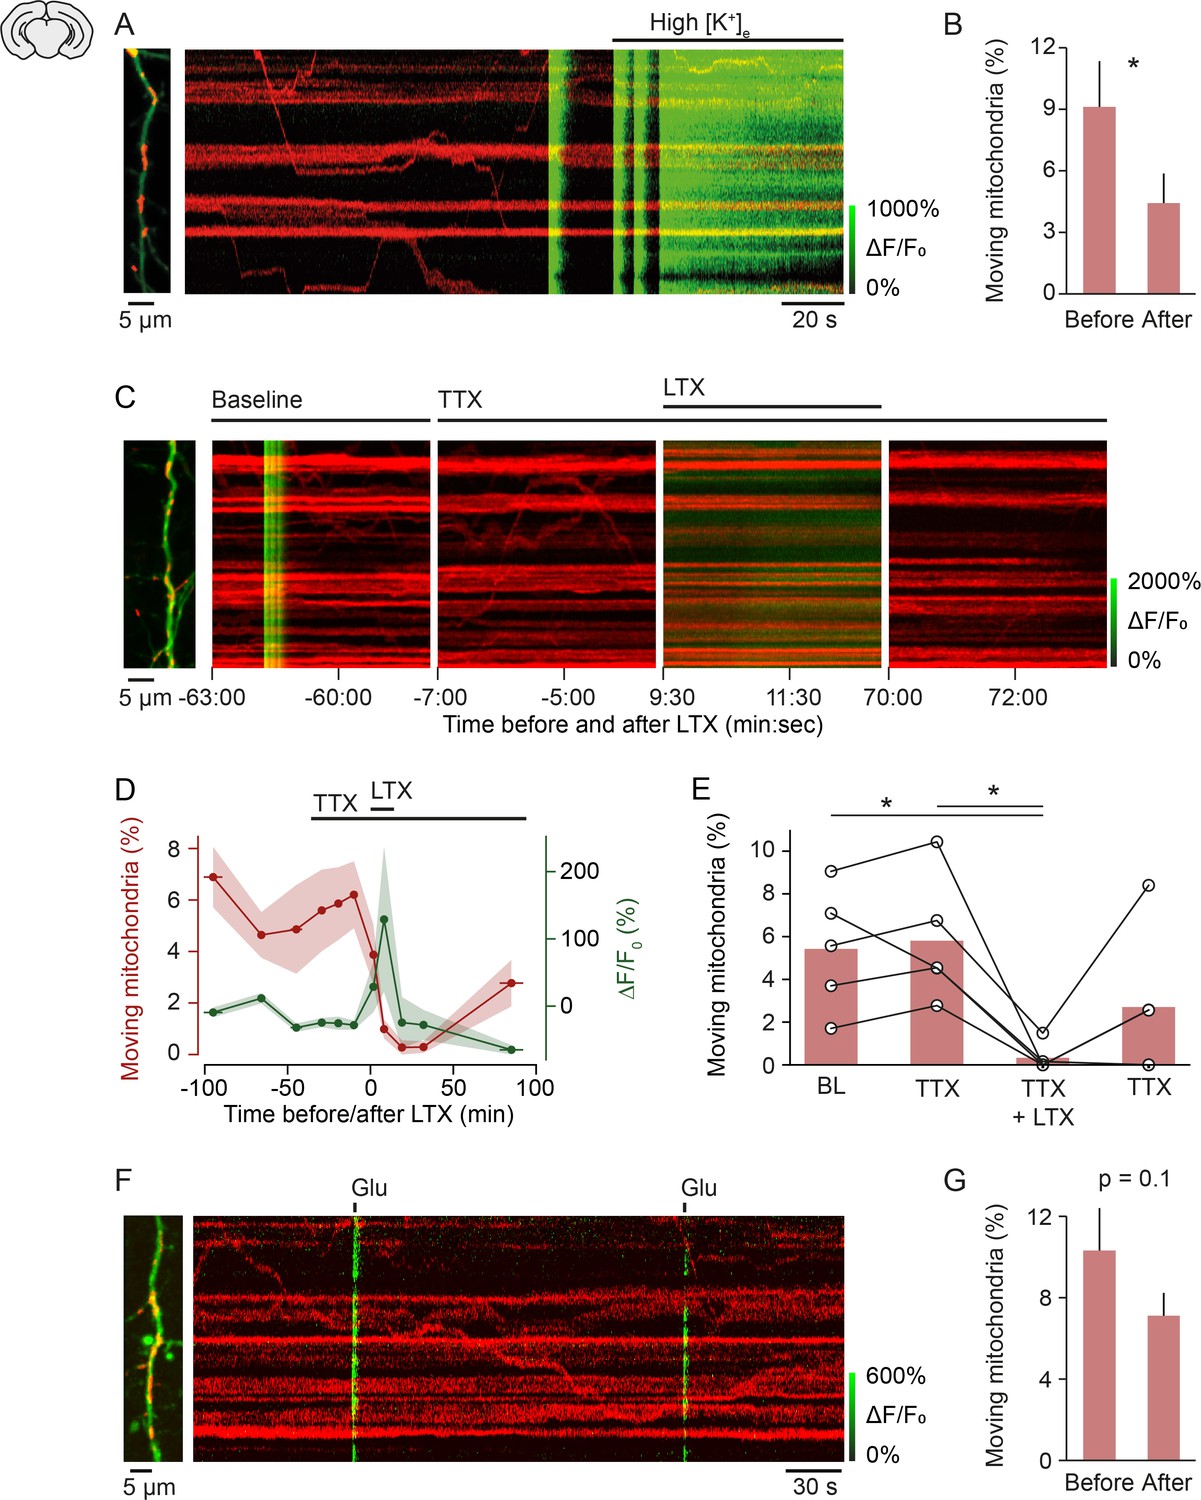
Mechanism of activity-induced mitochondrial arrest.
(A, B) Perfusing layer II/III pyramidal neurons (postnatal day [P] 5 + 3–7 DIV) with high-potassium medium [50 mM] triggered a massive influx of calcium and significantly reduced mitochondrial motility within 2 min (n = 9 cells; 107 mitochondria, paired t-test, p = 0.04). (C-E) Stimulating synaptic vesicle release with latrotoxin (LTX) interrupted mitochondrial motility entirely. (C) Example kymographs from recordings during baseline, in the presence of tetrodotoxin (TTX), TTX and LTX, and after washout of LTX. Basal calcium levels were elevated and mitochondrial motility was absent during the presence of LTX. (D) Averaged time course of mitochondrial motility and GCaMP6 ΔF/F0 for the duration of the experiments. Shaded areas and horizontal bars indicate SEMs of values and time points, respectively. (E) Percentage of moving mitochondria across all conditions (p = 0.0058, repeated measures ANOVA, *p = 0.028 (baseline vs. LTX + TTX), *p = 0.022 (TTX vs. TTX + LTX), post hoc t-test with Bonferroni multi-measures correction, n = 5 cells, 92 mitochondria). (F-G) Triggering calcium transients with focal application of glutamate (100 µM) in the presence of TTX did not affect mitochondrial motility significantly (P5 + 3–7 DIV, n = 74 transients from 13 cells, 146 mitochondria, paired t-test, before vs. after, 10.32 ± 2.09 vs. 7.12 ± 1.12, p = 0.1).
-
Figure 4—source data 1
Source data for Figure 4B.
- https://cdn.elifesciences.org/articles/62091/elife-62091-fig4-data1-v1.xlsx
-
Figure 4—source data 2
Source data for Figure 4D,E.
- https://cdn.elifesciences.org/articles/62091/elife-62091-fig4-data2-v1.xlsx
-
Figure 4—source data 3
Source data for Figure 4G.
- https://cdn.elifesciences.org/articles/62091/elife-62091-fig4-data3-v1.xlsx
Figure 5
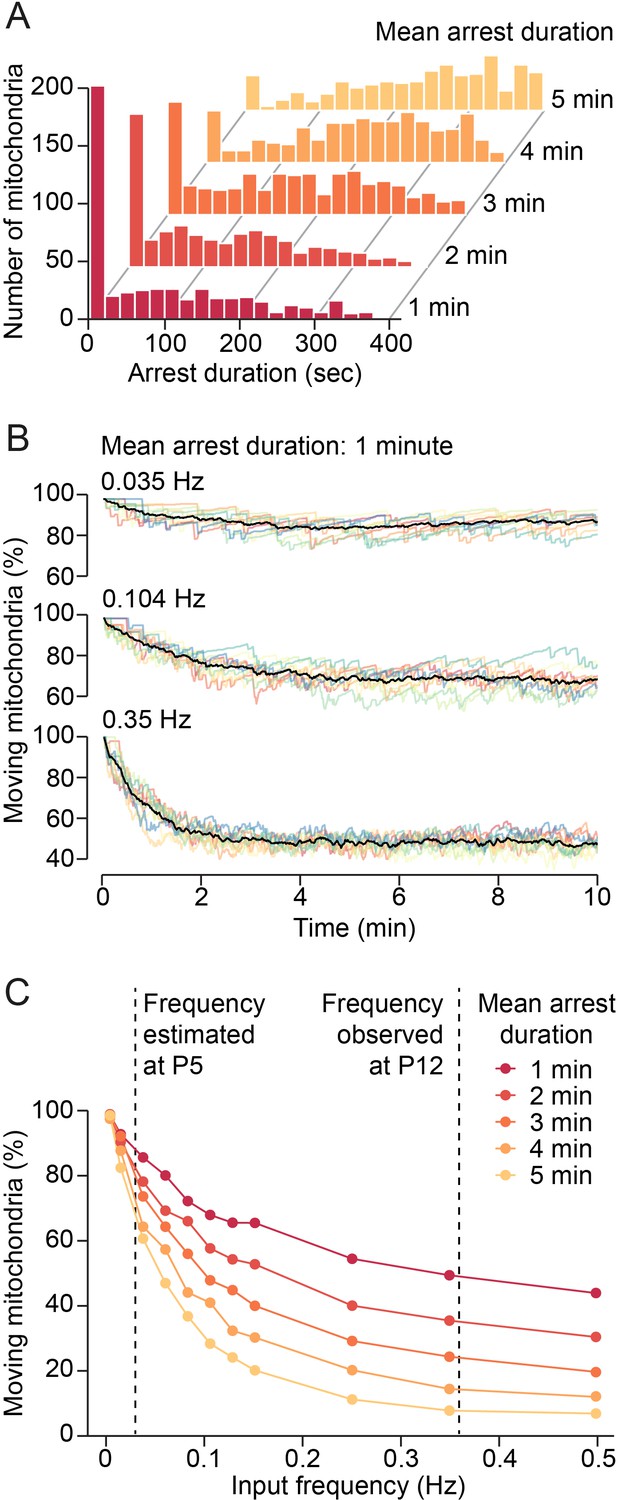
Model of synaptic input-mediated modulation of mitochondrial motility.
(A) Distribution of mitochondrial arrest durations generated by the model for mean durations of 1–5 min. (B) Changes of mitochondrial motility after onset of simulated synaptic inputs for a mean arrest duration of 1 min. Input frequencies are given as total synaptic inputs along a 100 µm stretch of dendrite. Low input frequencies hardly changed overall mitochondrial motility. Higher input frequencies reduced motility substantially. Steady state was reached after a few minutes. Colored lines: individual simulations, black lines: average of 10 simulations. (C) Relationship between synaptic input frequency and mitochondrial motility for different arrest durations at steady state. The expected increase of synaptic activity from postnatal day (P) 5 to P12 reduced mitochondrial motility by 30–60%, depending on the actual duration of mitochondrial arrest after synaptic transmission.
Tables
Key resources table
| Reagent type (species) or resource | Designation | Source or reference | Identifiers | Additional information |
|---|---|---|---|---|
| Strain, strain background (Mus musculus, male/ female) | C57Bl/6 J, male and female | Janvier Labs; | ||
| Transfected construct | GCaMP6s (species: Rattus norvegicus) | Add gene plasmid 40753; Douglas Kim | RRID:Addgene_40753 | Cloned into pCAG vector |
| Transfected construct | Mitochondrial-DsRed (species: Homo sapiens) | Gift from Thomas Misgeld | Mitochondrial targeting sequence from subunit VIII of human cytochrome c oxidase causing mitochondrial localization as previously described; Rizzuto et al., 1995; Li et al., 2004; MacAskill et al., 2009 Cloned into pCAG vector | |
| Chemical compound, drug | TTX | 1078, Bio-Techne, Minneapolis, MN | ||
| Chemical compound, drug | LTX | ALX-630–027 C040, Enzo Life Sciences b.v., Farmingdale, NY | ||
| Chemical compound, drug | Glutamate | G1626, Sigma | ||
| Software, algorithm | MitoMotil | This study | https://github.com/annikc/MitoMotil (copy archived at swh:1:rev:a4cfb2b4fd66579f63ea5a150a0f9b1b21b89a83, Yalnizyan-Carson, 2021) | |
| Software, algorithm | MATLAB | The MathWorks | https://mathworks.com | |
| Software, algorithm | NormCorre | Flatiron Institute, Simons Foundation | https://github.com/flatironinstitute/NoRMCorre, Pnevmatikakis and Giovannucci, 2021 | |
| Software, algorithm | Python | Python Software Foundation | https://www.python.org/ | |
| Software, algorithm | Elephant library | Human Brain Project | https://elephant.readthedocs.io/en/latest/ |
Author response table 1
Contingency table related to data shown in Figure 2F. The Fisher’s exact test statistic value is 0.0034.
| Moving mitochondria | Stable mitochondria | |
| Baseline | 70 | 599 |
| TTX | 172 | 946 |
Additional files
Download links
A two-part list of links to download the article, or parts of the article, in various formats.
Downloads (link to download the article as PDF)
Open citations (links to open the citations from this article in various online reference manager services)
Cite this article (links to download the citations from this article in formats compatible with various reference manager tools)
Activity-dependent regulation of mitochondrial motility in developing cortical dendrites
eLife 10:e62091.
https://doi.org/10.7554/eLife.62091


