Human ORC/MCM density is low in active genes and correlates with replication time but does not delimit initiation zones
- Research Unit Gene Vectors, Helmholtz Zentrum München (GmbH), German Research Center for Environmental Health, Germany
- Research Unit Gene Vectors, Helmholtz Zentrum München (GmbH), German Research Center for Environmental Health and German Center for Infection Research (DZIF), Germany
- Institut de Biologie de l'ENS (IBENS), Département de Biologie, Ecole Normale Supérieure, CNRS, Inserm, PSL Research University, France
- Laboratory for Functional Genome Analysis (LAFUGA), Gene Center of the Ludwig-Maximilians Universität (LMU) München, Germany
- Institute for Molecular Immunology, Monoclonal Antibody Core Facility, Helmholtz Zentrum München, German Research Center for Environmental Health (GmbH), Germany
- German Center for Neurodegenerative Diseases (DZNE e.V.), Germany
- Rheinische Friedrich-Wilhelms-Universität Bonn, Germany
- Univ Lyon, ENS de Lyon, Univ. Claude Bernard, CNRS, Laboratoire de Physique, France
Figures
Figure 1 with 3 supplements
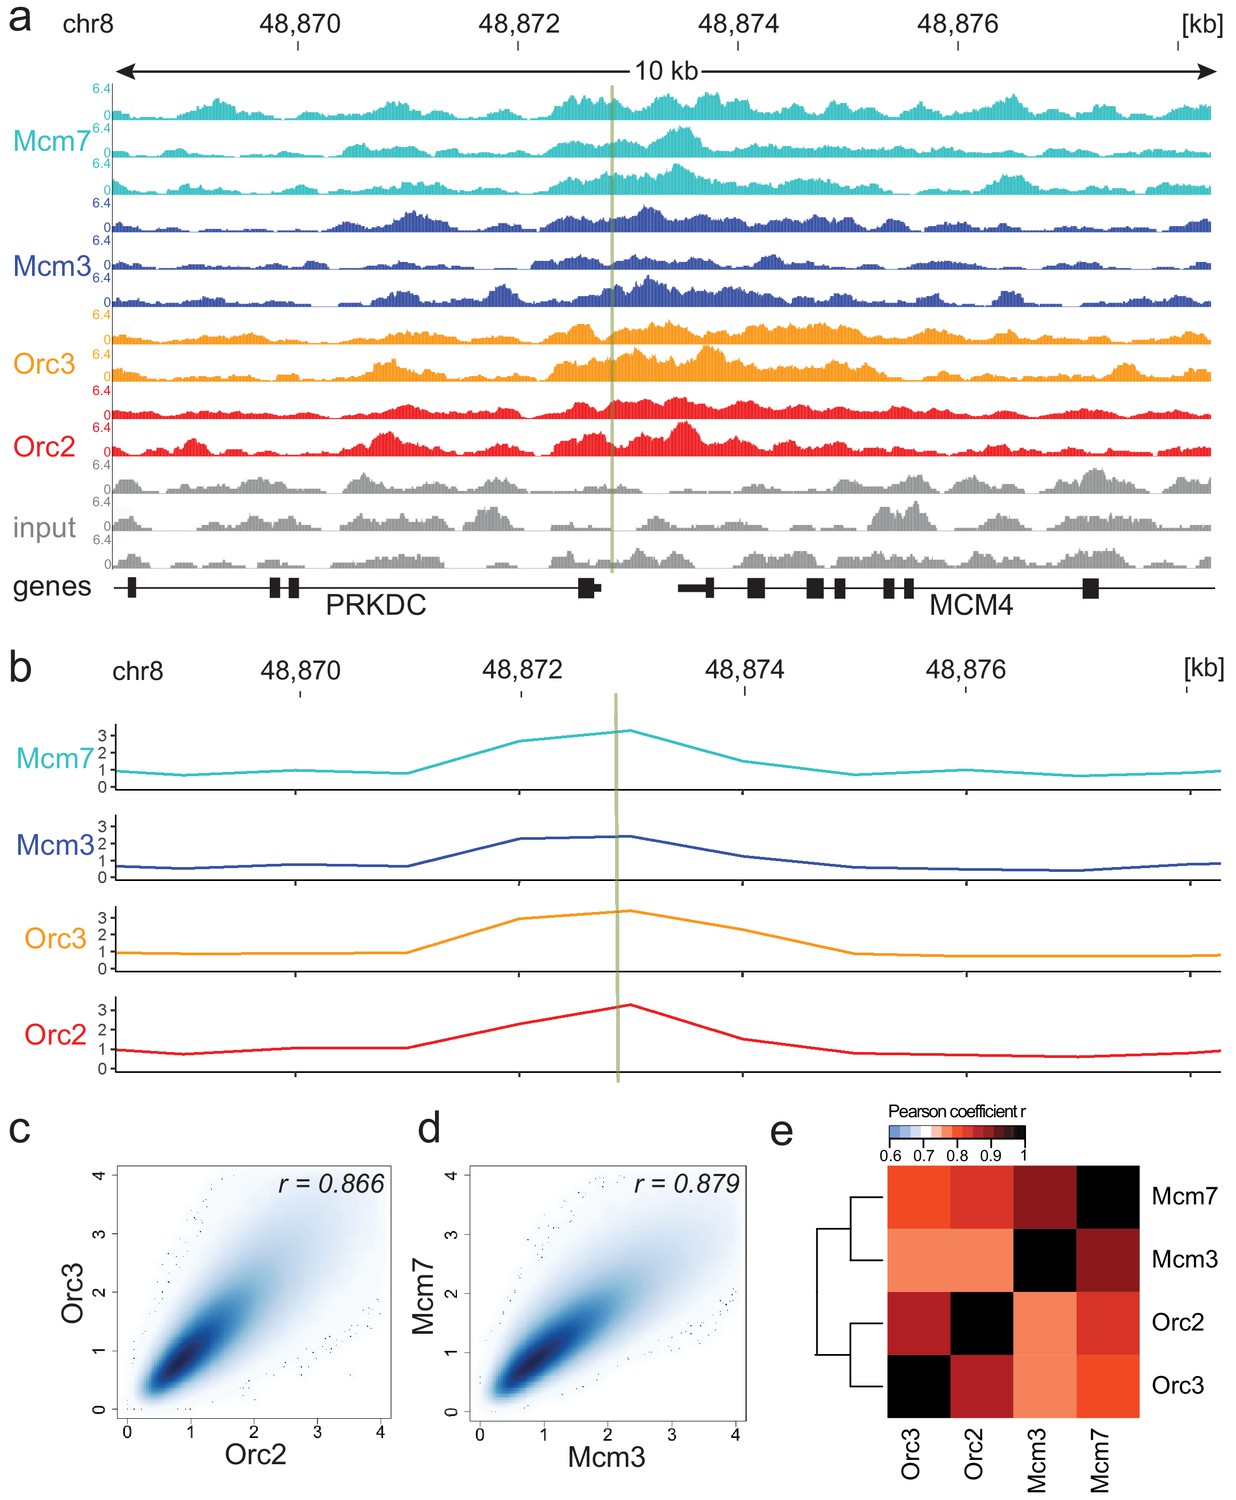
Moderate averaging represents a valid approach for origin recognition complex/minichromosome maintenance complex (ORC/MCM) chromatin immunoprecipitation followed by sequencing (ChIP-seq) analysis.
(a) Sequencing profile visualization in UCSC Genome Browser (hg19) at the Mcm4/PRKDC origin after reads per genomic content normalization: two samples of Orc2 and Orc3, and three samples of Mcm3 and Mcm7, are plotted against the input in three replicates. The profiles are shown in a 10 kb window (chr8: 48,868,314–48,878,313); the mapped position of the origin is indicated as green line. (b) The profile of ORC/MCM ChIP-seq after 1 kb binning at the same locus. The reads of replicates were summed and normalized by the total genome-wide ChIP read frequency followed by input division. Y-axis represents the resulting relative read frequency. (c) Correlation plot between Orc2 and Orc3 relative read frequencies in 1 kb bins. (d) Correlation plot between Mcm3 and Mcm7 relative read frequencies in 1 kb bins. (e) Heatmap of Pearson correlation coefficients r between all ChIP relative read frequencies in 1 kb bins. Column and line order were determined by complete linkage hierarchical clustering using the correlation distance (d = 1 r). Refer to Figure 1—figure supplement 3 for data representation without input division.
Figure 1—figure supplement 1
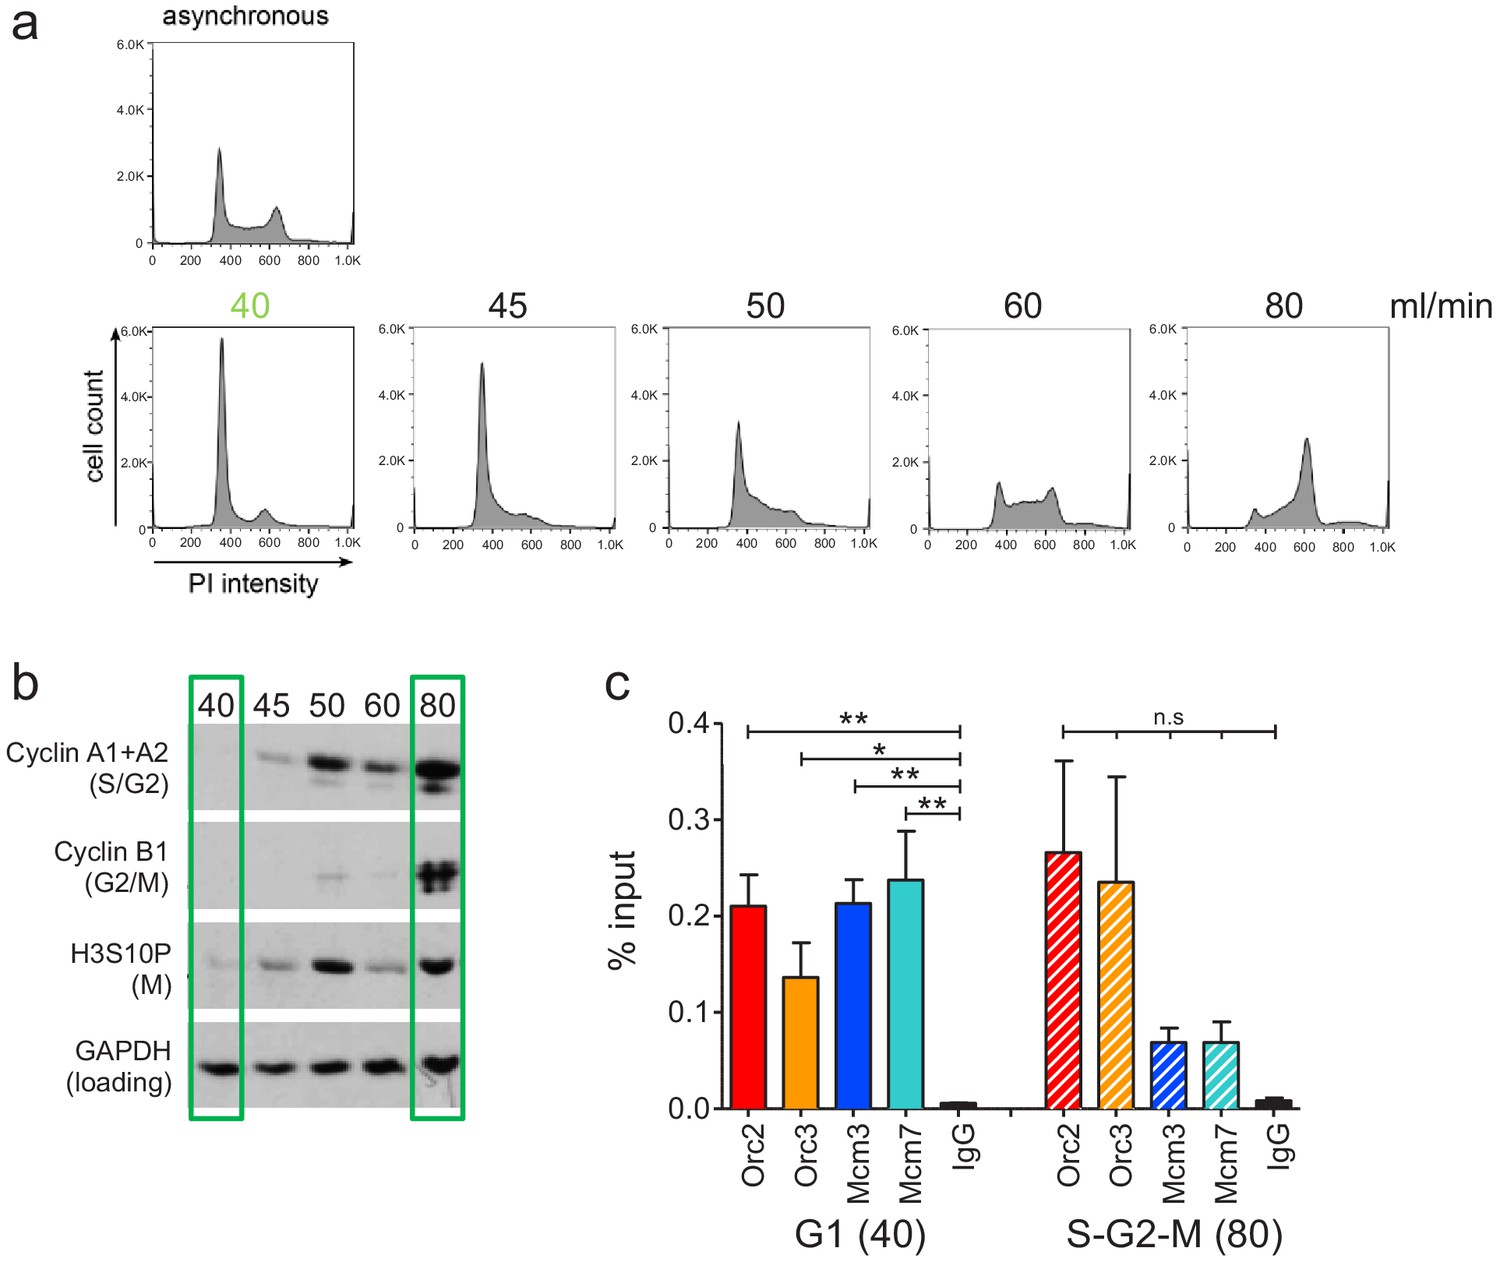
Experimental validation of cell cycle fractionation and origin recognition complex and minichromosome maintenance complex (ORC/MCM) chromatin immunoprecipitation followed by sequencing quality.
(a) Example DNA content (propidium iodide) staining followed by FACS of logarithmically growing Raji (top) cells and after cell cycle fractionation by centrifugal elutriation (increasing counter flow rates indicated above each profile in ml/min). (b) Western blot analyses of the single fractions detecting cyclin A (S/G2), cyclin B (G2/M), H3S10P (M), and GAPDH. (c) qPCR validation of Orc2, Orc3, Mcm3, and Mcm7 enrichment at the Epstein–Barr virus latent origin oriP dyad symmetry element. Representation in % input. Isotype IgG was used as control. *p<0.05, **p<0.01.
Figure 1—figure supplement 2
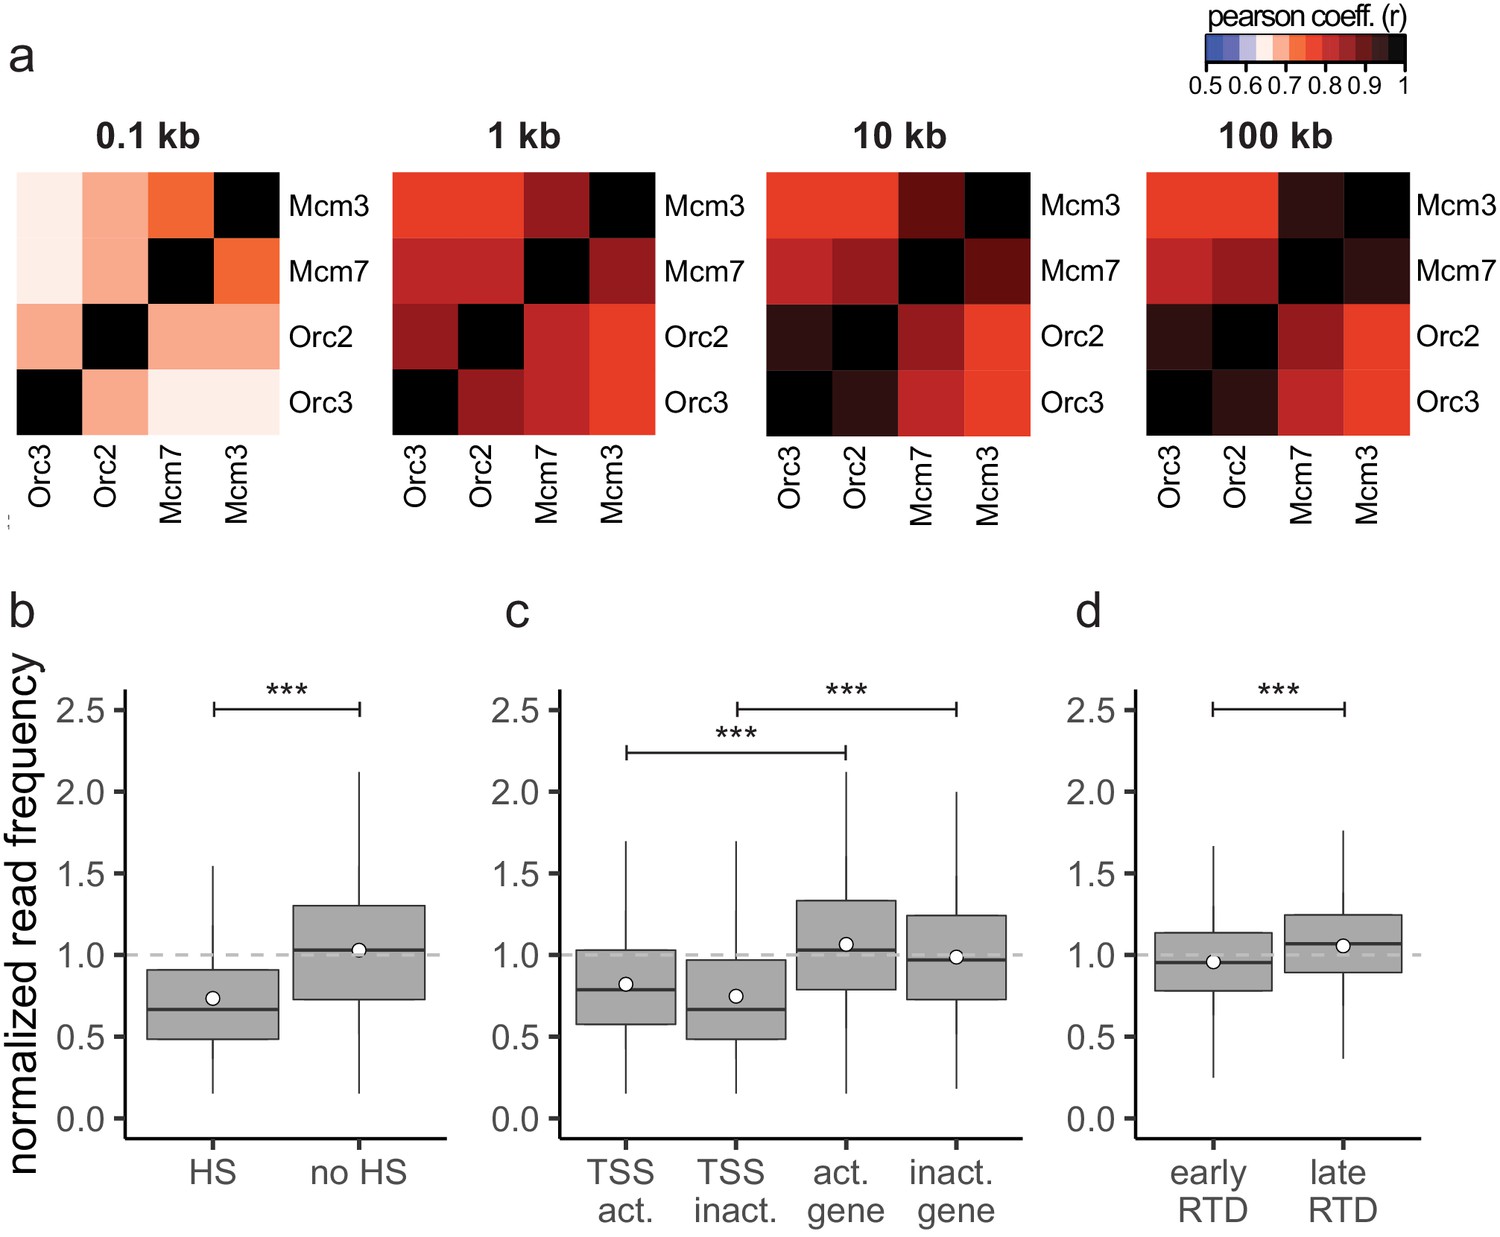
The input sequencing control is differentially represented in regions of biological function.
(a) Heatmaps of Pearson correlation coefficients r between all chromatin immunoprecipitation relative read frequencies at different bin sizes: 100 bp, 1 kb, 10 kb, and 100 kb. (b–d) Boxplot of normalized read frequencies in relation to (b) DNase hypersensitivity. DNase hypersensitive (HS) clusters were obtained from 125 cell lines in ENCODE, only HS sites larger 1 kb were considered. (c) Transcription: transcription start sites and gene bodies of active (transcripts per kilobase per million [TPM] >3) and inactive (TPM <3) gene. (d) Early- or late-replication timing domains. The dashed gray horizontal line indicates read frequency 1.0 for orientation. Boxplot represents the mean (circle), median (thick line), first and third quartile (box), and first and ninth decile (whiskers) of the normalized read frequencies, without representing outliers. Statistics were performed using one-sided t-test. ***p<0.001.
Figure 1—figure supplement 3
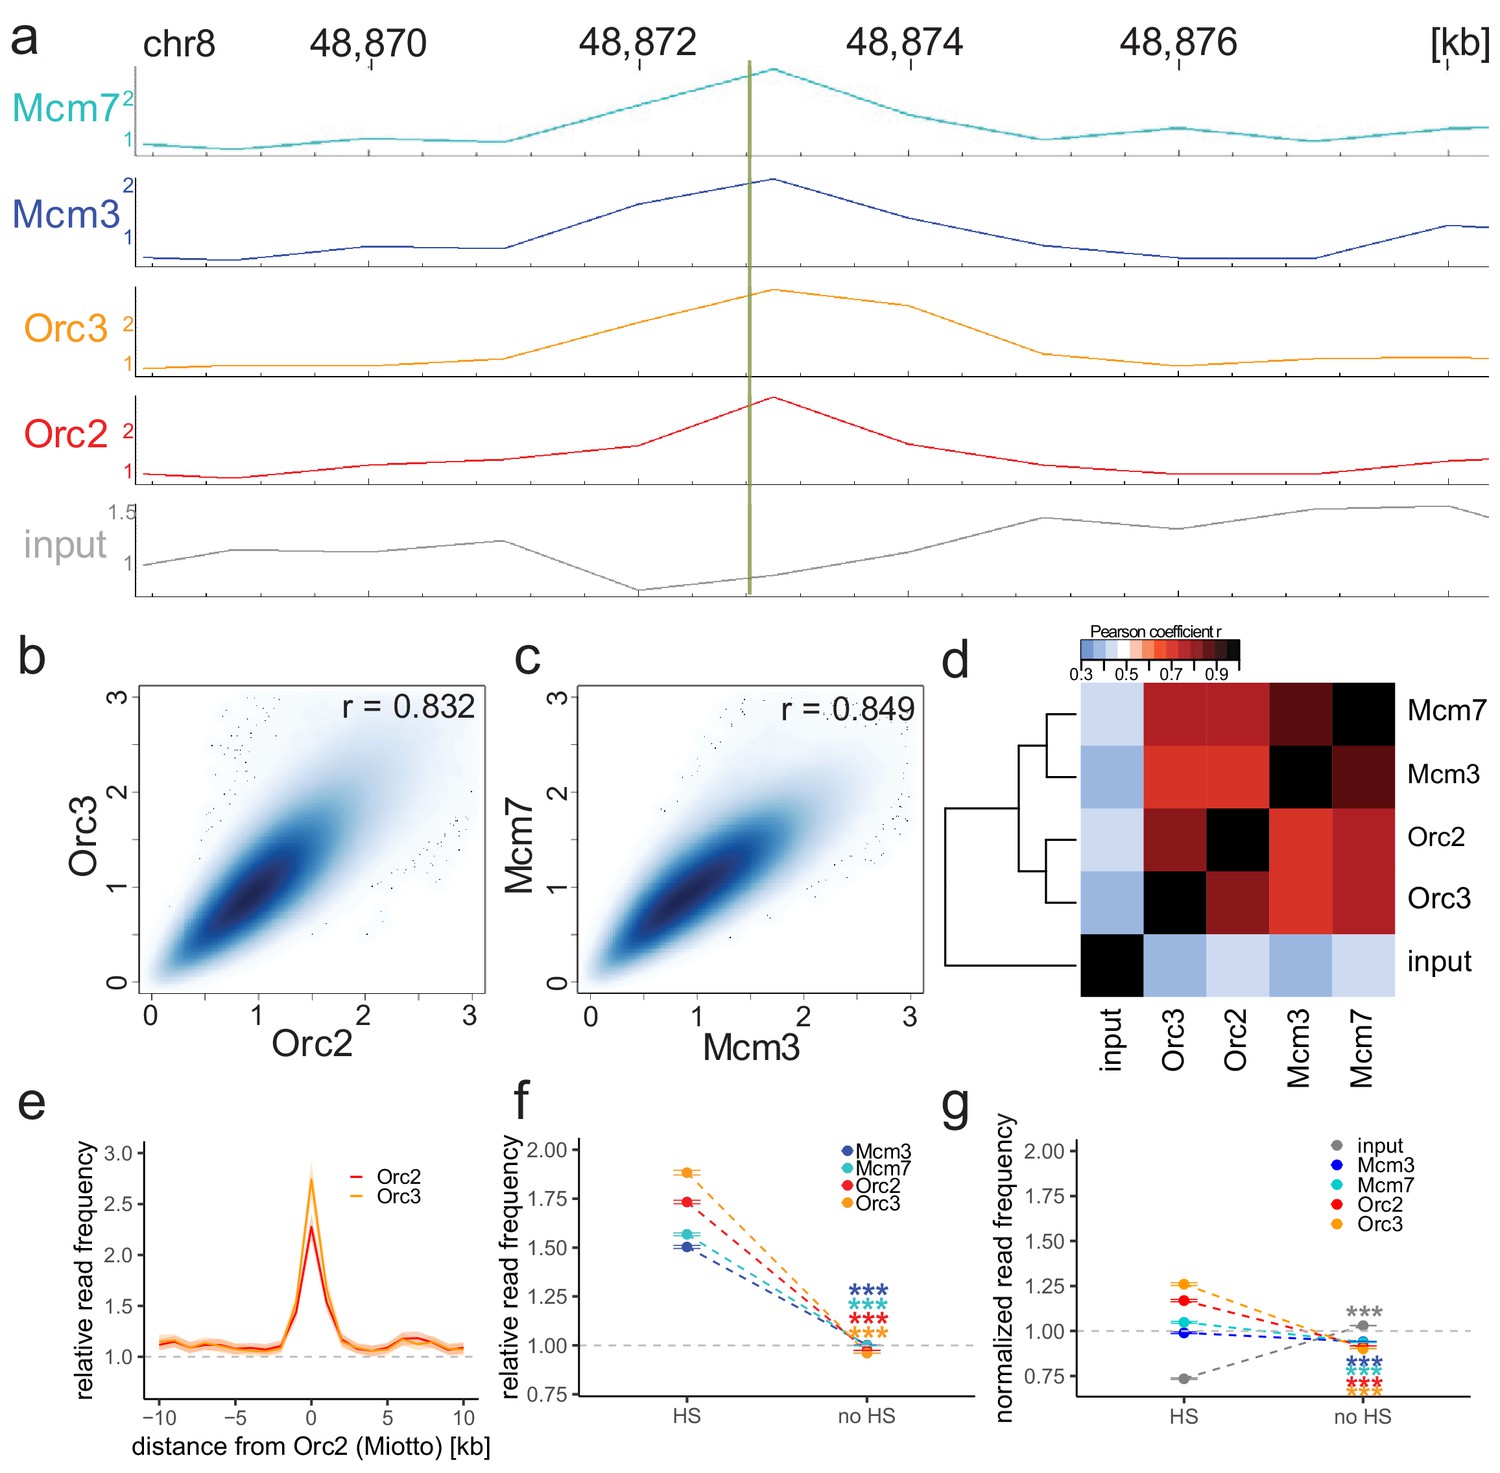
Origin recognition complex/minichromosome maintenance complex (ORC/MCM) enrichments at the MCM4/PRKDC origin persists without input normalization.
(a) The profile of ORC/MCM chromatin immunoprecipitation followed by sequencing (ChIP-seq) after 1 kb binning in the same 10 kb window as Figure 1b (chr8: 48,868,314–48,878,313). The reads of replicates were summed and normalized by the total genome-wide ChIP read frequency. Y-axis represents the resulting normalized read frequency. (b) Correlation plot between Orc2 and Orc3 normalized read frequencies in 1 kb bins. (c) Correlation plot between Mcm3- and Mcm7-normalized read frequencies in 1 kb bins. (d) Heatmap of Pearson correlation coefficients r between all ChIP-normalized read frequencies including input in 1 kb bins. Column and line order were determined by complete linkage hierarchical clustering using the correlation distance (d = 1 r). (e) ORC relative read frequencies at Orc2 peaks (>1 kb) retrieved from Miotto et al., 2016. (f, g) ORC/MCM binding is confirmed at DNase hypersensitive (HS) sites. (f) Mean input-normalized ORC/MCM relative read frequencies (±2 × SEM) in relation to DNase hypersensitivity. (g) ORC/MCM-normalized read frequencies without input division (±2 × SEM) in relation to DNase hypersensitivity. Only HS sites larger than 1 kb were considered. Statistics were performed using one-sided t-test. ***p<0.001.
Figure 2 with 2 supplements
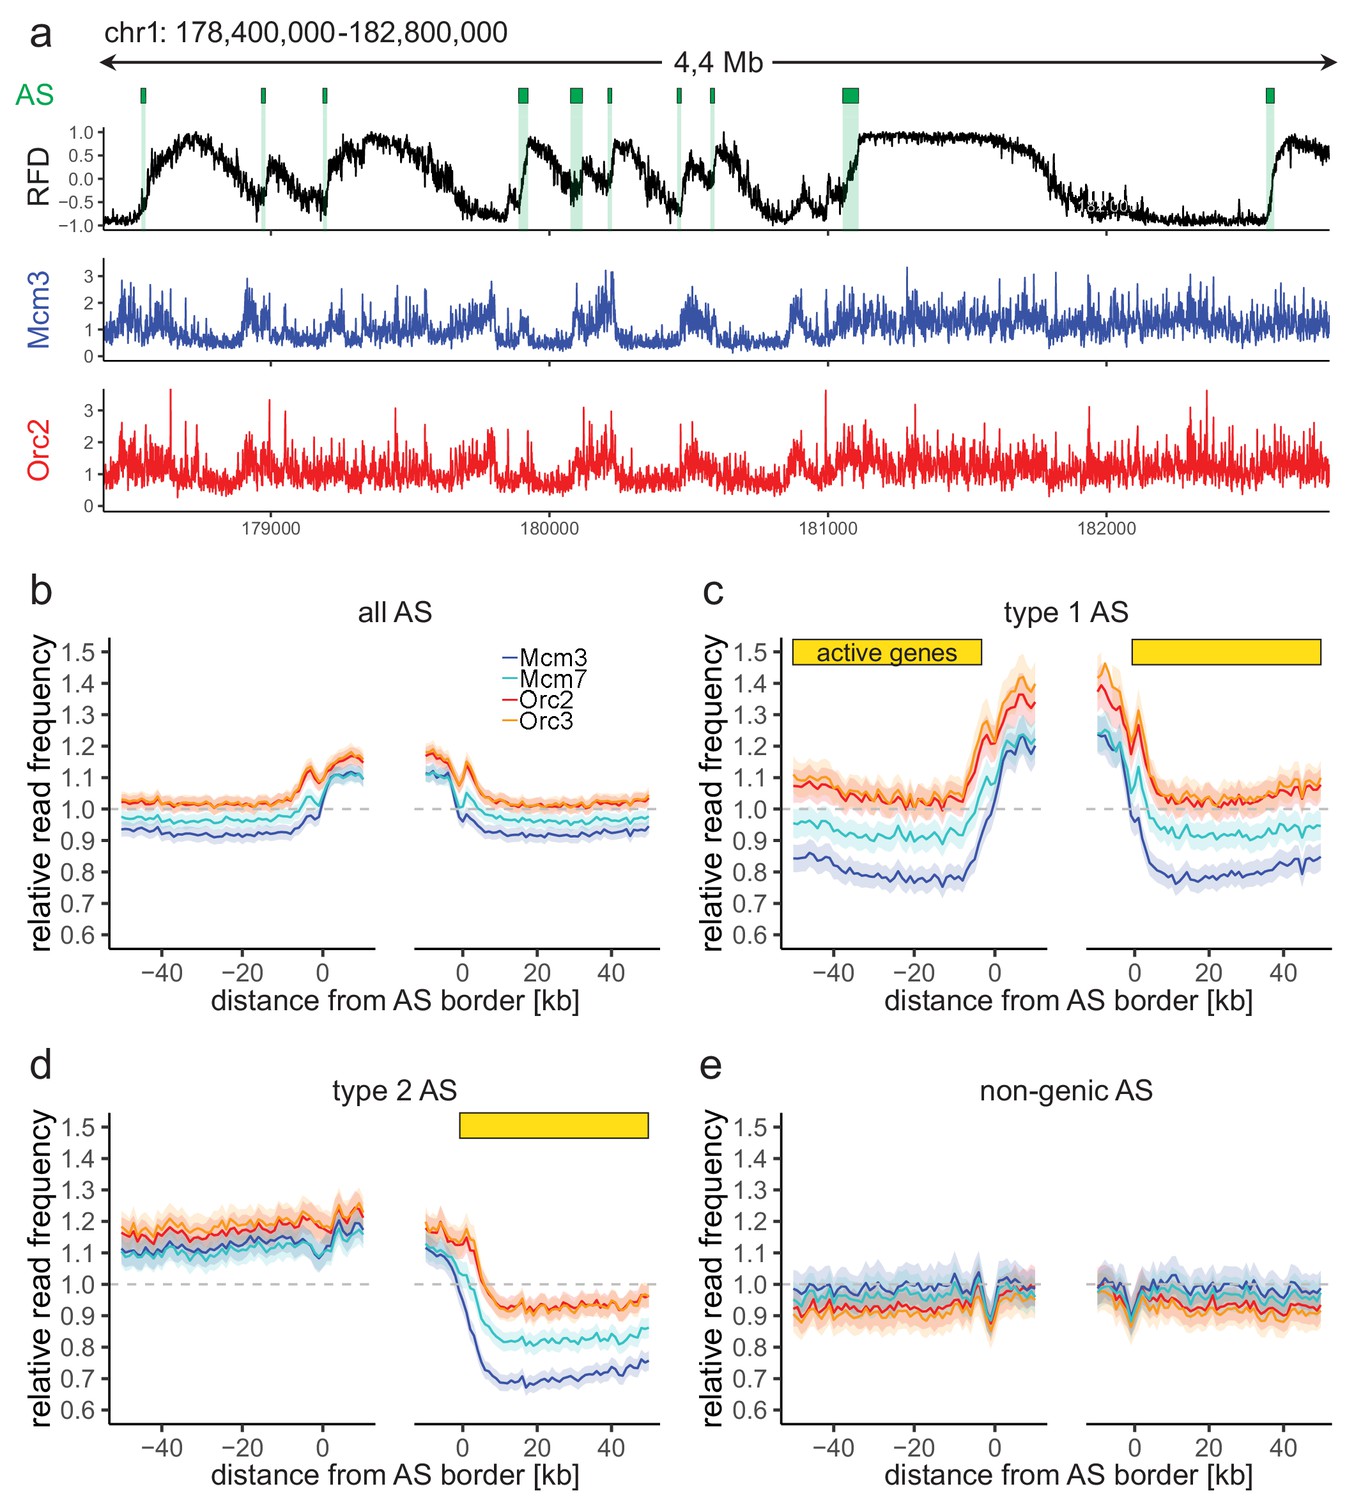
Origin recognition complex/minichromosome maintenance complex (ORC/MCM) enrichment within ascending segments (ASs) depends on active transcription.
(a) Top panel: example of an replication fork direction (RFD) profile on chr1: 178,400,000–182,800,000, covering 4 Mb. Detected ASs are labeled by green rectangles (irrespective of length and RFD shift). Middle and bottom panels: representative Mcm3 (blue) and Orc2 (red) chromatin immunoprecipitation followed by sequencing (ChIP-seq) profiles after binning for the same region. (b–e) Average input-normalized relative ChIP read frequencies of Orc2, Orc3, Mcm3, and Mcm7 at AS borders of (b) all AS (L > 20 kb and ΔRFD >0.5; n = 2957), (c) type 1 ASs with transcribed genes at both AS borders (n = 673), (d) type 2 ASs oriented with their AS border associated to transcribed genes at the right (n = 1026), and (e) non-genic ASs in gene-deprived regions (n = 506). The mean of ORC and MCM relative read frequencies is shown ±2 × SEM (lighter shadows). The dashed grey horizontal line indicates relative read frequency 1.0 for reference. For type 1 and 2 ASs, yellow bars mark the AS borders associated to transcribed genes. Refer to Figure 2—figure supplement 2 for analysis without input division.
Figure 2—figure supplement 1
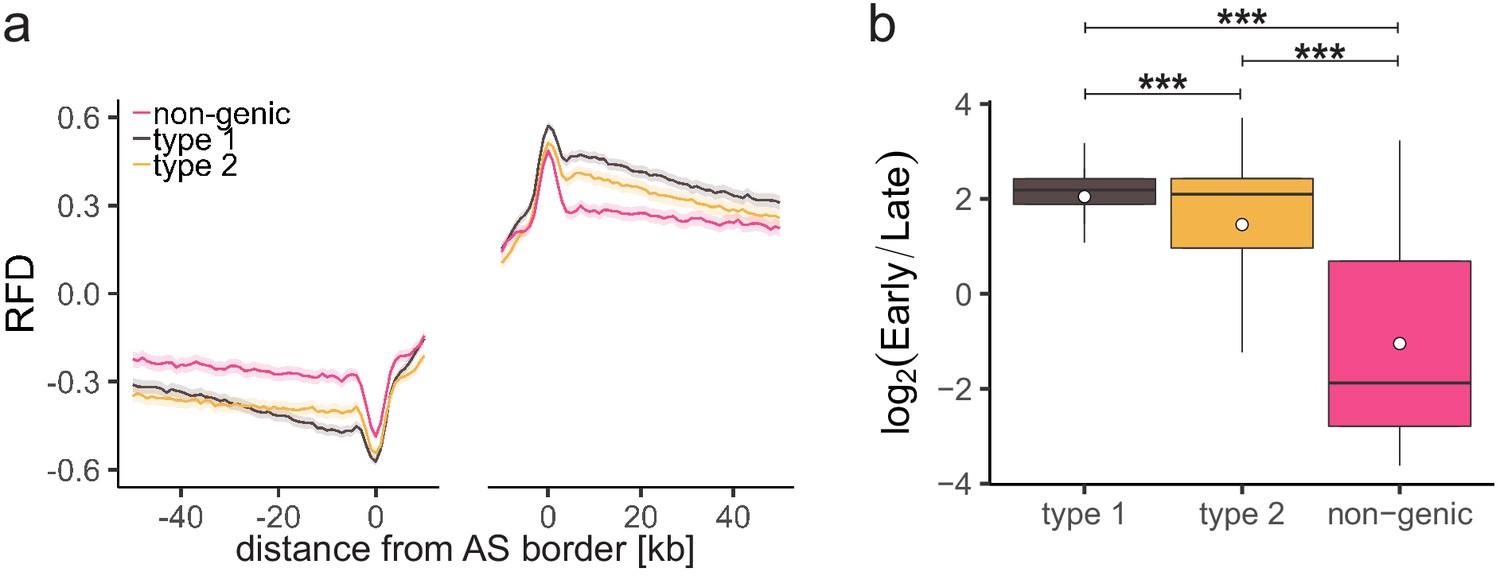
Characterization of different ascending segment (AS) types.
(a) Average replication fork direction profiles (±2 × SEM; lighter shadows) for different AS types (Table 1) aligned at AS borders. (b) Replication timing ratio log2(Early/Late) was assigned to type 1, type 2, and non-genic AS and represented as boxplot. Each boxplot represents the mean (circle), median (thick line), first and third quartile (box), and first and ninth decile (whiskers) of the relative read frequencies, without representing outliers. Statistics were performed by one-way ANOVA followed by Tukey’s post-hoc test. ***p<0.001.
Figure 2—figure supplement 2
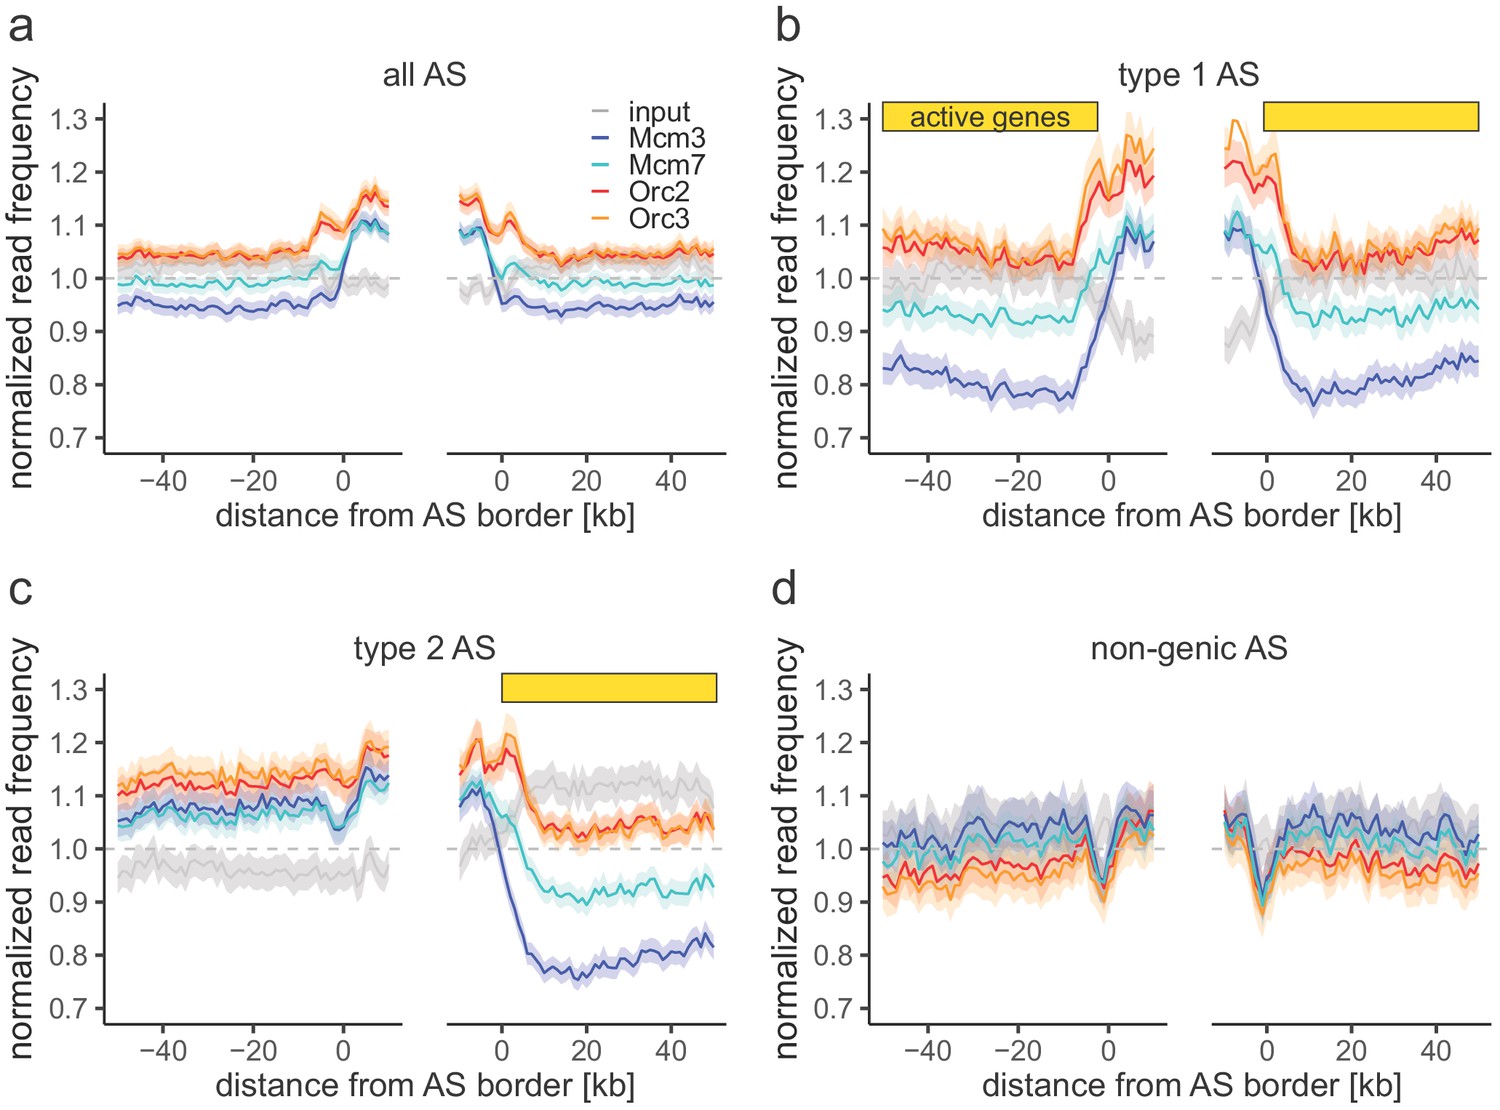
Origin recognition complex/minichromosome maintenance complex (ORC/MCM) enrichments within ascending segments (ASs) without input normalization.
(a–d) Average chromatin immunoprecipitation-normalized read frequencies of Orc2, Orc3, Mcm3, Mcm7, and input at AS borders of (a) all ASs (n = 2957), (b) type 1 ASs with transcribed genes at both ASs borders (n = 673), (c) type 2 ASs with transcribed genes oriented at their right ASs border (n = 1026), and (d) non-genic ASs in gene-deprived regions (n = 506). The mean of normalized read frequencies is shown ±2 × SEM (lighter shadows). The dashed grey horizontal line indicates read frequency 1.0 for reference. Yellow bars mark the AS borders associated to transcribed genes.
Figure 3 with 1 supplement
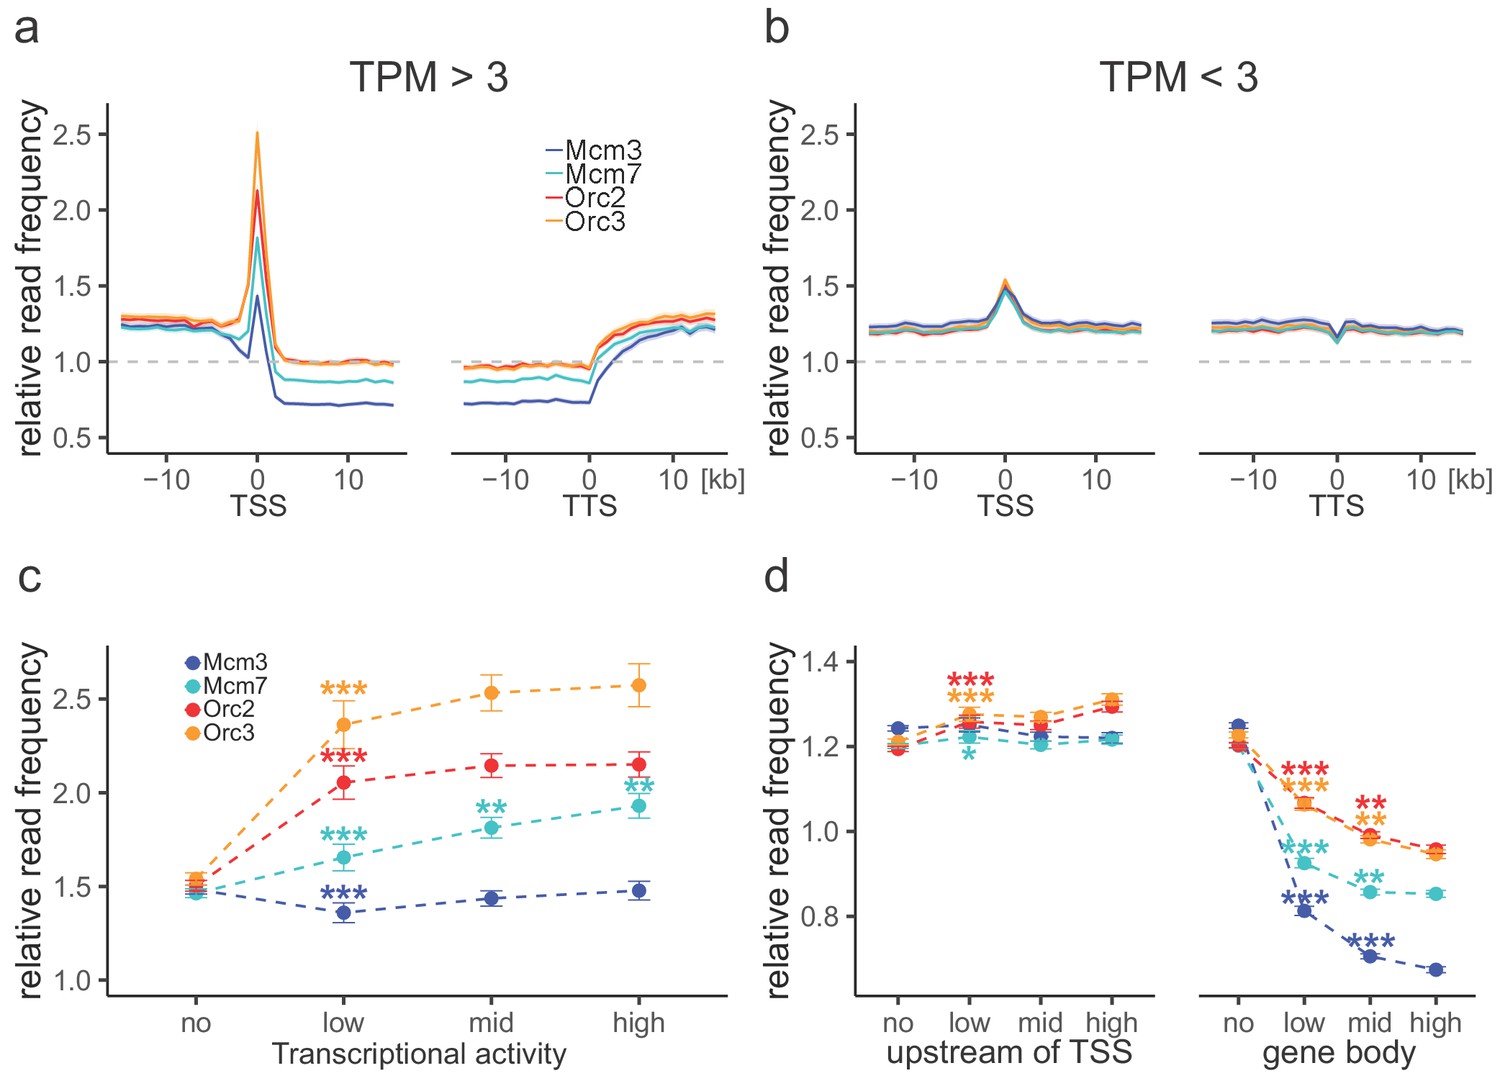
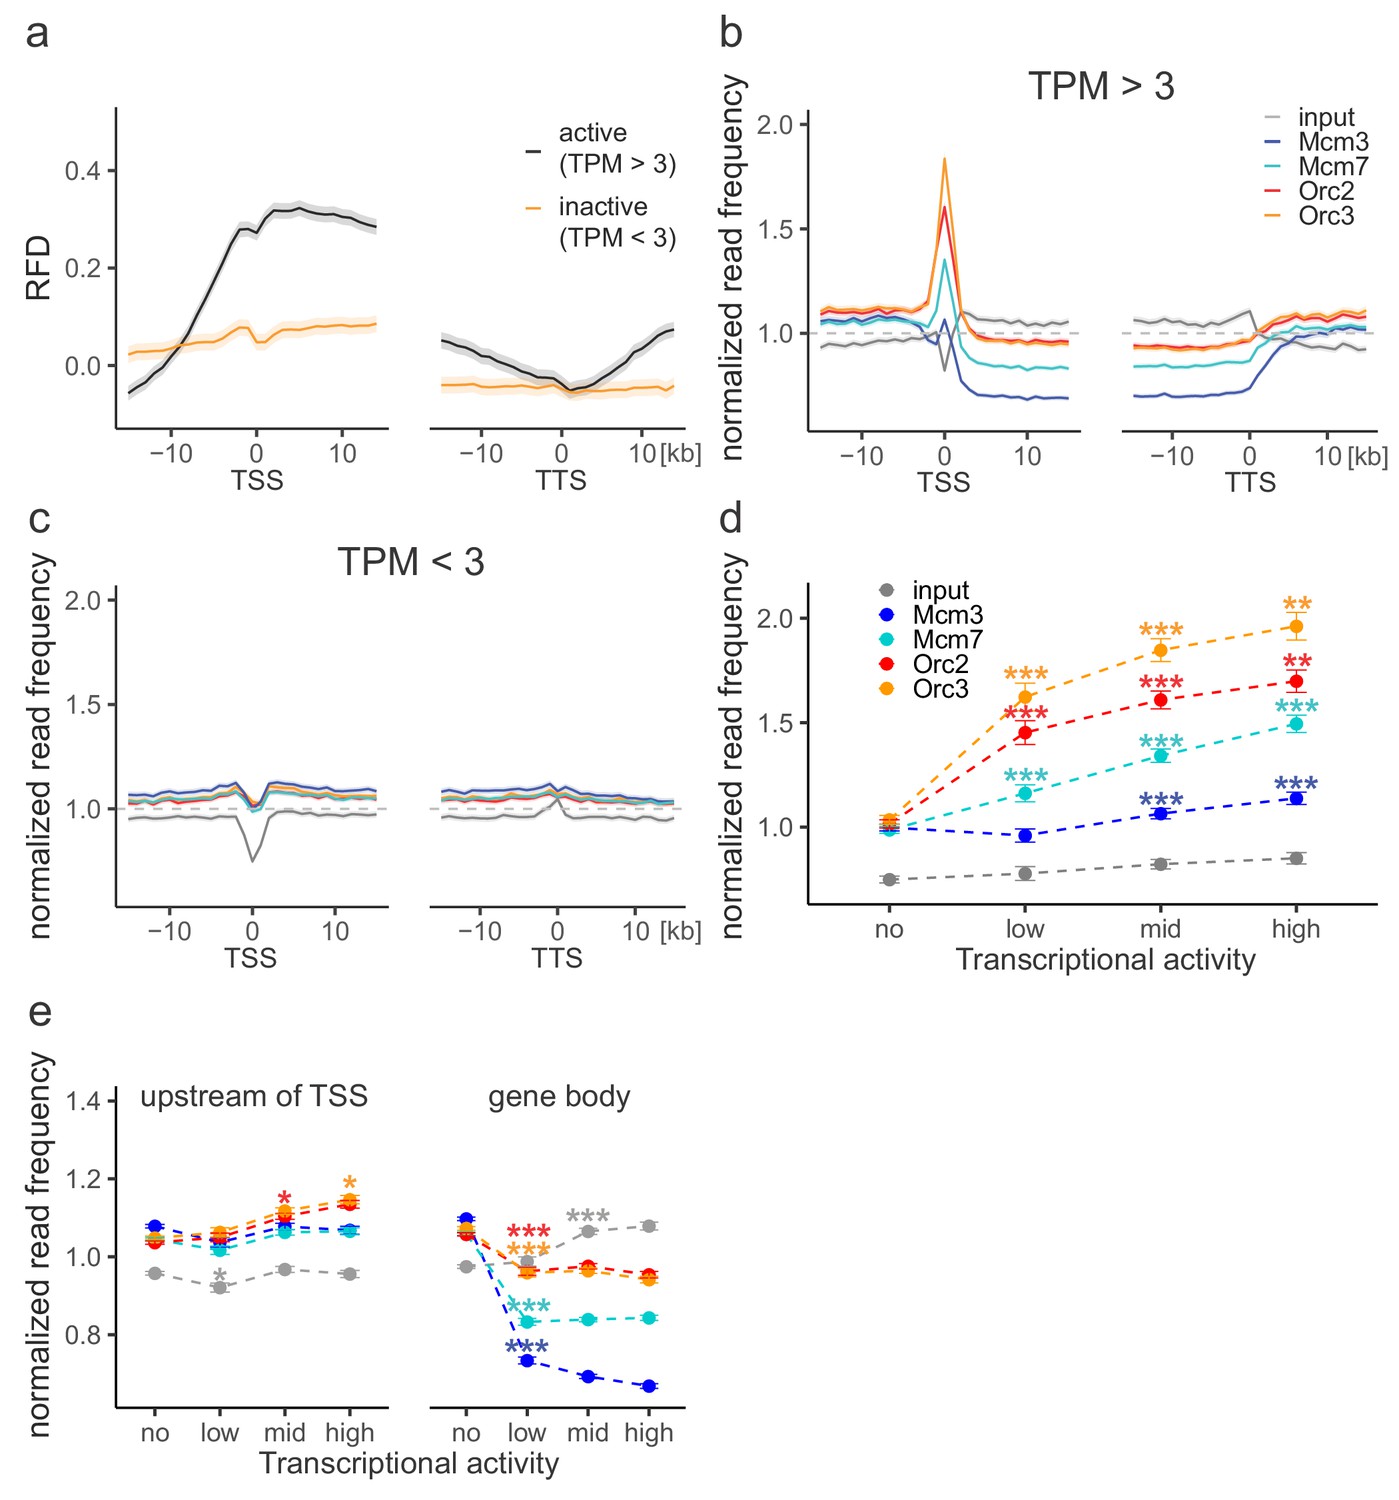
Origin recognition complex (ORC) is enriched at active transcription start sites (TSSs) while minichromosome maintenance complex (MCM) is depleted from actively transcribed genes.
(a, b) ORC/MCM relative read frequencies around TSSs or transcriptional termination sites (TTSs) for (a) active genes (transcripts per kilobase per million [TPM] >3) and (b) inactive genes (TPM <3). Only genes larger than 30 kb without any adjacent gene within 15 kb were considered. Distances from TSSs or TTSs are indicated in kb. Means of ORC and MCM frequencies are shown ±2 × SEM (lighter shadows). The dashed grey horizontal line indicates relative read frequency 1.0 for reference. (c) ORC/MCM relative read frequencies at TSSs dependent on transcriptional activity (±2 × SEM). (d) ORC/MCM relative read frequencies upstream of TSSs and within the gene body dependent on transcriptional activity (±2 × SEM; TSSs ± 3 kb removed from analysis). Transcriptional activity was classified as no (TPM <3), low (TPM 3–10), mid (TPM 10–40), and high (TPM >40). Statistics were performed by one-way ANOVA followed by Tukey’s post-hoc test. p-Values are indicated always comparing to the previous transcriptional level. *p<0.05, **p<0.01, ***p<0.001. Refer to Figure 3—figure supplement 1 for analyses without input division.
Figure 3—figure supplement 1
Replication fork direction (RFD) and origin recognition complex/minichromosome maintenance complex (ORC/MCM) profiles without input normalization at gene extremities.
(a) Mean RFD profiles around transcription start sites (TSSs) or transcriptional termination sites (TTSs) of active genes (black) or inactive genes (yellow). Distances from TSSs or TTSs are indicated in kb. RFD means are shown ±2 × SEM (lighter shadows). (b, c) Normalized ORC/MCM/input read frequencies without input division around TSSs or TTSs for (b) active genes (TPM >3) and (c) inactive genes (TPM <3). Only genes larger than 30 kb without any adjacent gene within 15 kb were considered. Distances from TSSs or TTSs are indicated in kb. Means of normalized read frequencies are shown ±2 × SEM (lighter shadows). The dashed grey horizontal line indicates read frequency 1.0 for reference. (d) Normalized ORC/MCM/input read frequencies at TSSs dependent on transcriptional activity (±2 × SEM). (e) Normalized ORC/MCM/input read frequencies upstream of TSSs and in the gene body dependent on transcriptional activity (±2 × SEM; TSSs ± 3 kb removed from analysis). Transcriptional activity was classified as no (TPM <3), low (TPM 3–10), mid (TPM 10–40), and high (TPM >40). Statistics were performed by one-way ANOVA followed by Tukey’s post-hoc test. p-Values are indicated always comparing to the previous transcriptional level. *p<0.05, **p<0.01, ***p<0.001.
Figure 4 with 2 supplements

Origin recognition complex/minichromosome maintenance complex (ORC/MCM) levels correlate with replication timing (RT) and transcriptional activity but are otherwise homogeneously distributed along the genome and uncorrelated to replication fork direction (RFD) patterns.
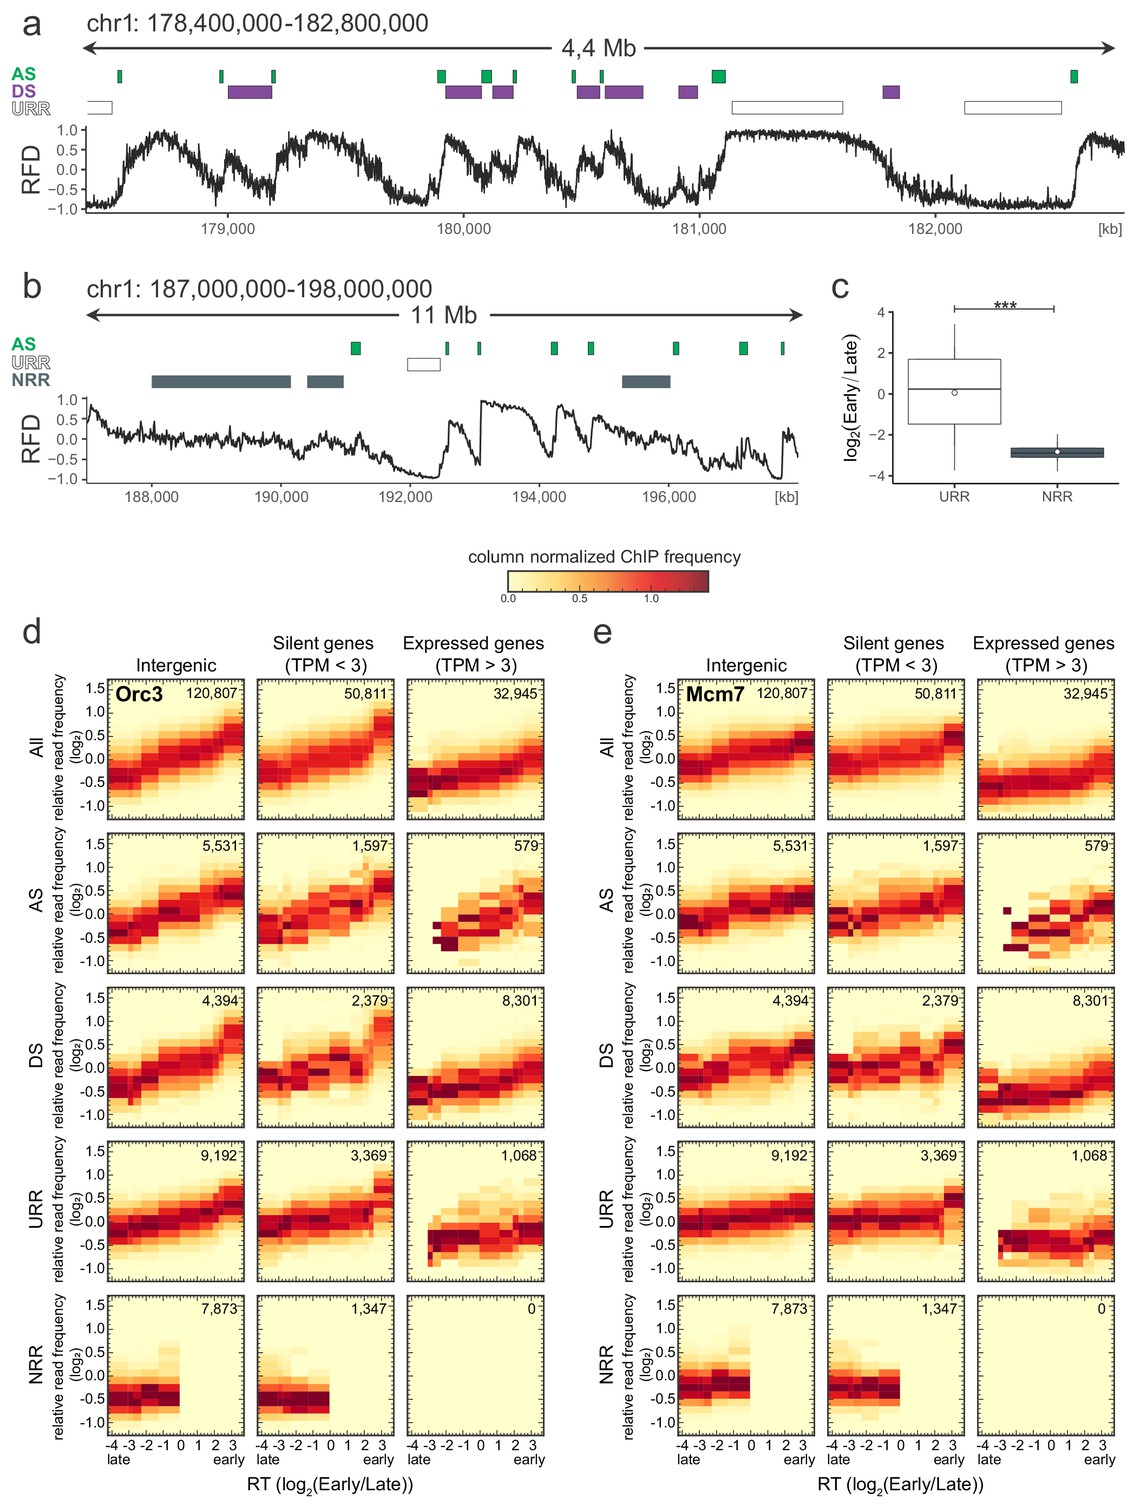
(a, b) 3 × 5 panel of 2D histograms of Orc2 (a) and Mcm3 (b) chromatin immunoprecipitation (ChIP) relative read frequency versus RT (average log2(Early/Late) over 100 kb binned according to the decile of RT distribution). The analysis was performed in 10 kb bins. Histograms are normalized by column and represent the probability density functions of ChIP relative frequencies at a given replication timing. The color legend is indicated on top. 2D histograms are computed for intergenic regions (left column), silent genes (transcripts per kilobase per million TPM <3, middle column), and expressed genes (TPM >3, right column). Transcription start sites and transcriptional termination sites proximal regions were not considered (see Materials and methods). The rows show either all bins (top row) or restriction to ascending segment (AS) bins (predominant replication initiation, second row), descending segment (DS) bins (descending segment, predominant replication termination, third row), unidirectionally replicating region (URR) bins (unidirectional replication, no initiation, no termination, fourth row), and null RFD region (NRR) bins (null RFD regions, spatially random initiation and termination, bottom row). The number of bins per histogram is indicated in each panel. See Figure 4—figure supplement 1 for equivalent Orc3 and Mcm7 analyses. Refer to Figure 4—figure supplement 2a for statistical comparisons.
Figure 4—figure supplement 1
Origin recognition complex/minichromosome maintenance complex (ORC/MCM) levels are correlated with replication timing (RT) and transcriptional activity but otherwise homogeneously distributed along the genome and uncorrelated to replication fork direction (RFD) patterns.
(a) Same RFD profile example as Figure 2a (chr1: 178,400,000–182,800,000, covering 4 Mb) with indication of ascending segment (AS; green), descending segment (DS; purple), and unidirectionally replicating region (URR; white boxes) positions. (b) RFD profile example on chr1: 187,000,000–198,000,000, covering 11 MB, with ASs (green), URRs (white boxes), and null RFD regions (NRRs; dark gray) indicated. (c) RT ratio log2(Early/Late) was assigned to URRs and NRRs and represented as boxplot (mean [circle], median [thick line], first and third quartile [box], and first and ninth decile [whiskers], without representing outliers). Statistics were performed using one-sided t-test. ***p<0.001. (d, e) 3 × 5 panel of 2D histograms of Orc3 (d) and Mcm7 (e) chromatin immunoprecipitation (ChIP) frequency versus RT (average log2(Early/Late) over 100 kb binned according to the decile of RT distribution). The analysis was performed in 10 kb windows. Histograms are normalized by column and represent the probability density function of ChIP relative frequencies at given replication timings. The color legend is indicated on top. 2D histograms are computed for intergenic regions (left column), silent genes (transcripts per kilobase per million [TPM] <3, middle column), and expressed genes (TPM >3, right column). Transcription start sites and transcriptional termination sites proximal regions were not considered (see Materials and methods). The rows show either all bins (top row), AS bins (predominant replication initiation, second row), DS bins (descending segment, predominant replication termination, third row), URR bins (unidirectional replication, no initiation, no termination, fourth row), and NRR bins (null RFD regions, spatially random initiation and termination, bottom row). The number of bins per histogram is indicated in each panel. See Figure 4 for equivalent Orc2 and Mcm3 data. Refer to Figure 4—figure supplement 2a for statistical comparisons.
Figure 4—figure supplement 2
Kolmogorov–Smirnov statistics between the origin recognition complex/minichromosome maintenance complex (ORC/MCM).
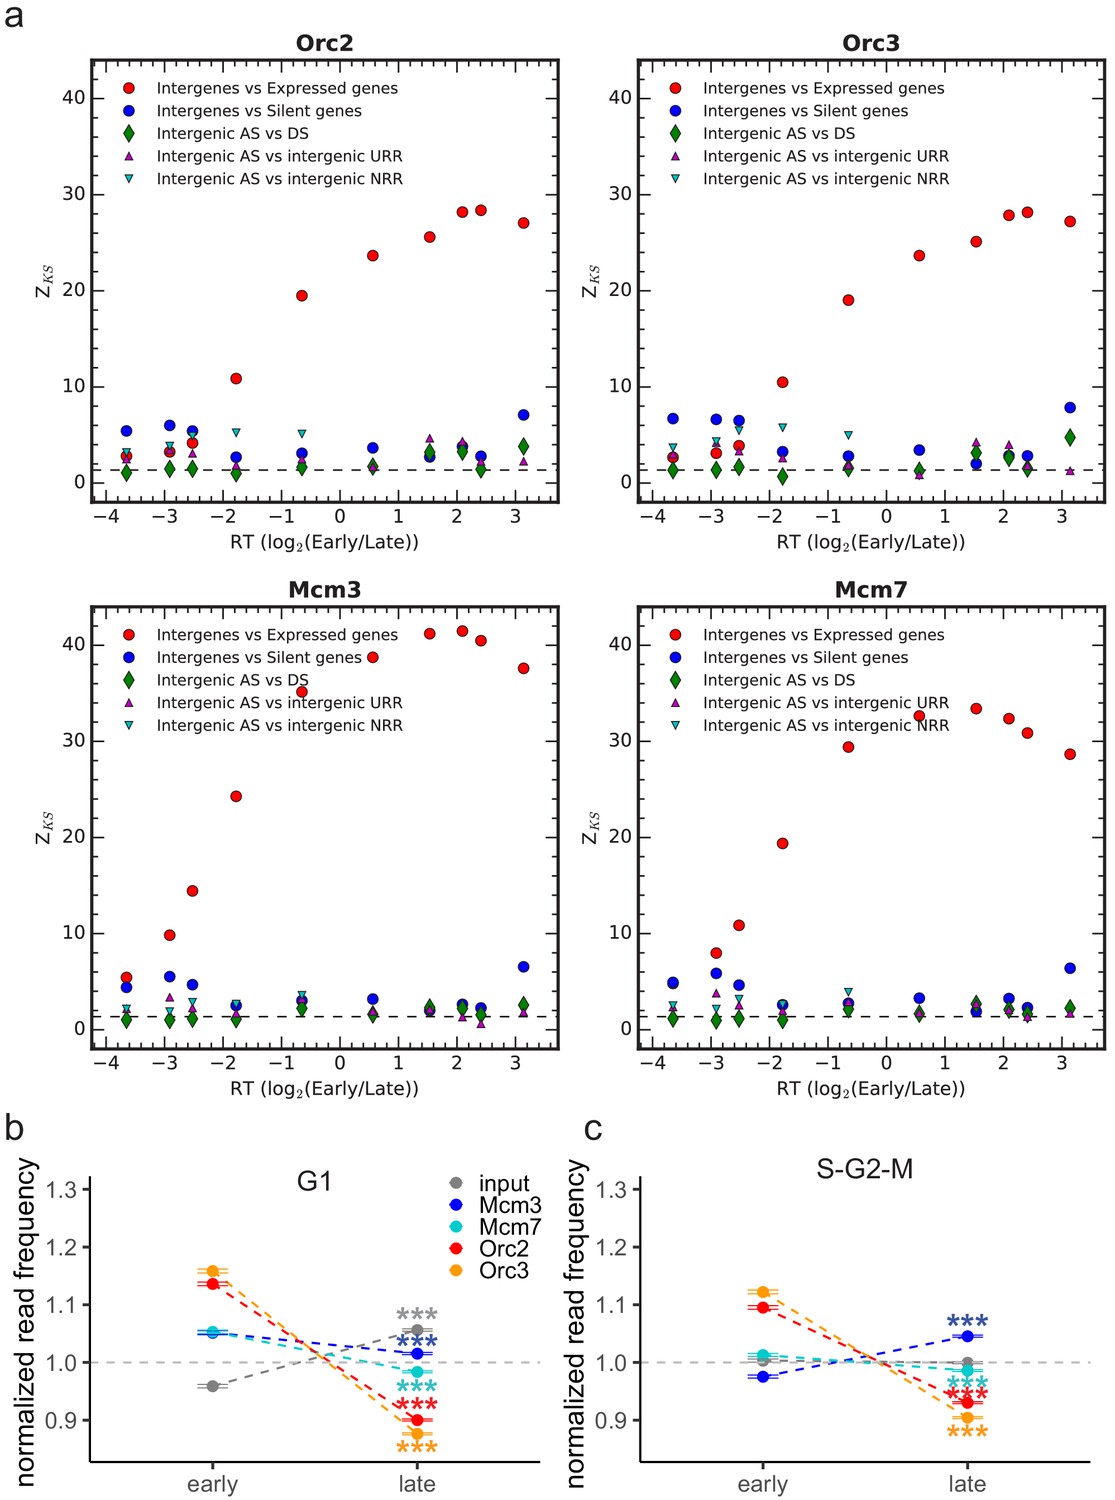
(a) Relative read frequency distributions in each replication timing bin (shown in Figure 4 and Figure 4—figure supplement 1d, e) in intergenic versus expressed gene regions (red circles), intergenic versus silent gene regions (blue circles) and between intergenic regions in ascending segments (AS) versus descending segments (DS; green diamonds), AS versus unidirectionally replicating regions (URR; magenta triangles pointing up), and AS versus null RFD regions (NRR; cyan triangles pointing down). Z_KS is normalized for sample size. The horizontal dashed lines correspond to p-value=5%. (b) Normalized ORC/MCM/input (G1) read frequencies without input division (±2 × SEM) in early or late replication timing domains (RTDs). Early RTDs were defined as log2(Early/Late) > 1.6; late RTDs < −2.0. The analysis was performed in 10 kb bins. Any gene ±10 kb was removed from the analysis. (c) ORC/MCM input normalized read frequencies (±2 × SEM) obtained from S-G2-M-phased chromatin in early or late RTDs using the same settings as in (b). Statistics were performed using one-sided t-test. ***p<0.001.
Figure 5 with 1 supplement

H4K20me3 selectively marks a subset of late-replicating non-genic ascending segments (ASs).
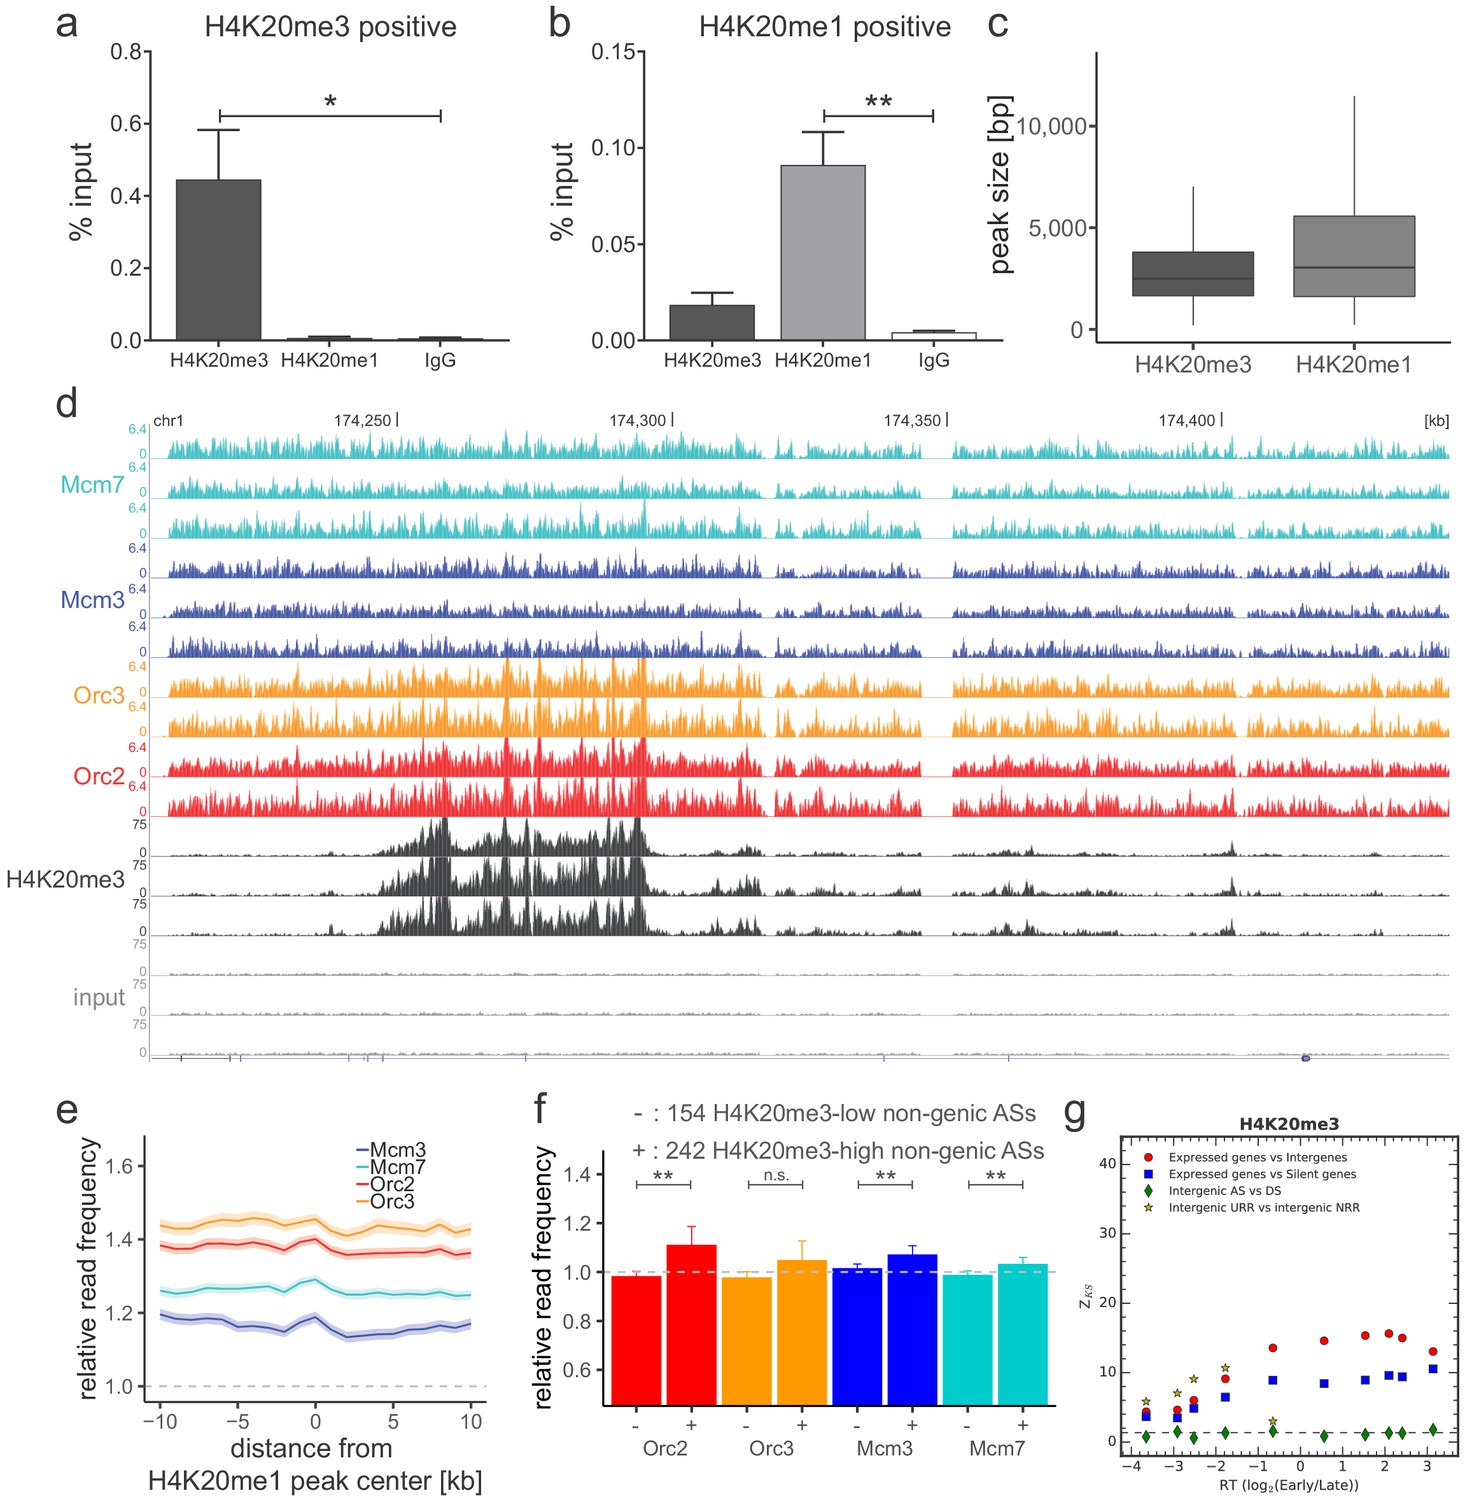
(a) Origin recognition complex/minichromosome maintenance complex (ORC/MCM) G1 chromatin relative read frequencies (±2 × standard error of the mean [SEM]) in early or late replication timing domains (RTDs). Early RTDs were defined as log2(Early/Late) > 1.6; late RTDs < −2.0. The analysis was performed in 10 kb bins. Any gene ±10 kb was removed from the analysis. Statistics were performed using one-sided t-test. (b) ORC/MCM relative read frequencies (±2 × SEM) obtained from S-G2-M chromatin in early or late RTDs using the same settings as in (a). (c) Average ORC/MCM relative read frequencies at H4K20me3 peaks (>1 kb). (d) H4K20me3 relative read frequencies at AS borders of the different AS types. Type 2 ASs are oriented with their AS borders associated to transcribed genes at the right. Means of H4K20me3 relative read frequencies are shown ±2 × SEM (lighter shadows). (e) Boxplot representation of H4K20me3 relative read frequencies within the different AS types. Boxplot represents the mean (circle), median (thick line), first and third quartile (box), and first and ninth decile (whiskers) of the relative read frequencies in each AS type. Statistics were performed by one-way ANOVA followed by Tukey’s post-hoc test. (f) Histogram representation of mean ±2 × SEM of ORC/MCM relative read frequencies in G1 at 242 H4K20me3-low non-genic ASs and 154 H4K20me3-high non-genic ASs. Statistics were performed using one-sided t-test. ***p<0.001. Refer to Figure 5—figure supplement 1 for validation of H4K20me3 chromatin immunoprecipitation.
Figure 5—figure supplement 1
Origin recognition complex/minichromosome maintenance complex (ORC/MCM) is enriched in late-replicating, H4K20me3-high non-genic ascending segment (AS) and null RFD region (NRR) windows.
(a, b) qPCR validation of H4K20me3 and H4K20me1 enrichment after chromatin immunoprecipitation at (a) an H4K20me3 positive locus and (b) an H4K20me1 positive locus. Representation in % input. Isotype IgG antibodies were used as control. *p<0.05, **p<0.01. (c) Boxplot of H4K20me3 and H4K20me1 peak size (in bp) distribution. (d) Sequencing profile visualization in UCSC Genome Browser (hg19) at chr1:174,205,071–174,444,322 after reads per genomic content normalization: three samples of H4K20me3 are plotted against the three input samples. Two samples of Orc2 and Orc3, and three samples of Mcm3 and Mcm7, are also visualized for comparison. (e) Average ORC/MCM relative read frequencies after input normalization at H4K20me1 peaks (>1 kb). (f) Histogram representation of mean ±2 × SEM of ORC/MCM relative read frequencies derived from S-G2-M chromatin at 242 H4K20me3-low non-genic ASs and 154 H4K20me3-high non-genic ASs. Statistics were performed using one-sided t-test. **p<0.01. (g) Kolmogorov–Smirnov statistics between the H4K20me3 relative read frequency distributions in each replication timing bin (shown in Figure 6a): expressed gene versus intergenic (red circles) and silent gene (blue squares) regions as well as between intergenic regions in AS versus descending segments (DS; green diamonds) and unidirectionally replicating region (URR) versus null replication fork directionality region (NRR) (yellow stars). Z_KS is normalized for sample size. The horizontal dashed lines correspond to p-value=5%.
Figure 6
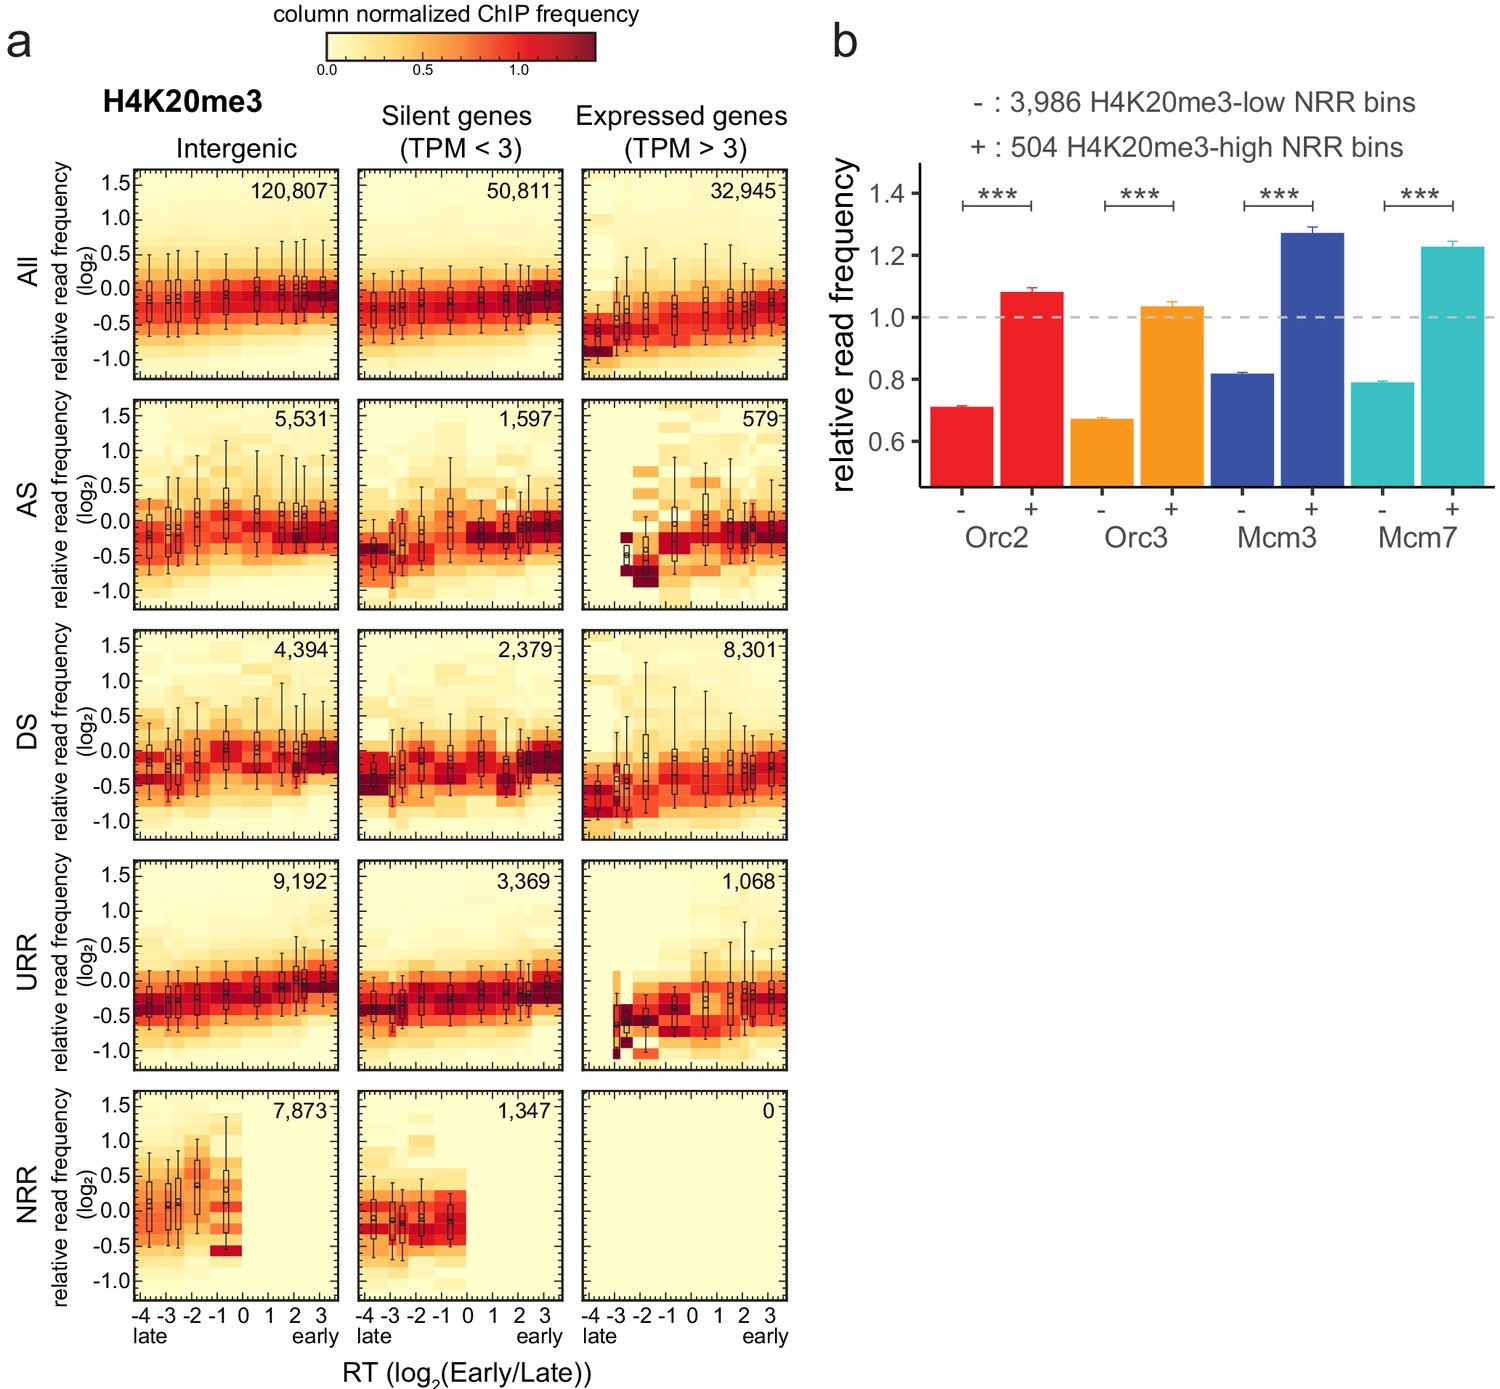
H4K20me3 is enriched in late-replicating null RFD regions (NRR).
(a) 3 × 5 panel of 2D histograms of H4K20me3 chromatin immunoprecipitation relative read frequencies versus replication timing (RT) (average log2(Early/Late) over 100 kb binned according to the decile of RT distribution). The analysis was performed in 10 kb bins. Histograms are normalized by column and displayed for different bin categories (columns: intergenic regions, silent genes, expressed genes; rows: all bins, ascending segment [AS], descending segment [DS], unidirectionally replicating region [URR], null replication fork directionality region [NRR] bins) as for origin recognition complex/minichromosome maintenance complex (ORC/MCM) in Figure 4. The number of bins per histogram is indicated in each panel. Superimposed boxplots represent the mean (circle), median (thick line), first and third quartile (box), and first and ninth decile (whiskers) of the relative read frequencies in each timing bins. Refer to Figure 5—figure supplement 1g for statistical comparisons. (b) Histogram representation of mean ±2 × SEM of ORC/MCM relative read frequencies at 3986 H4K20me3-low NRR 10 kb bins and 504 H4K20me3-high NRR 10 kb bins. Statistics were performed using one-sided t-test. ***p<0.001.
Figure 7 with 1 supplement
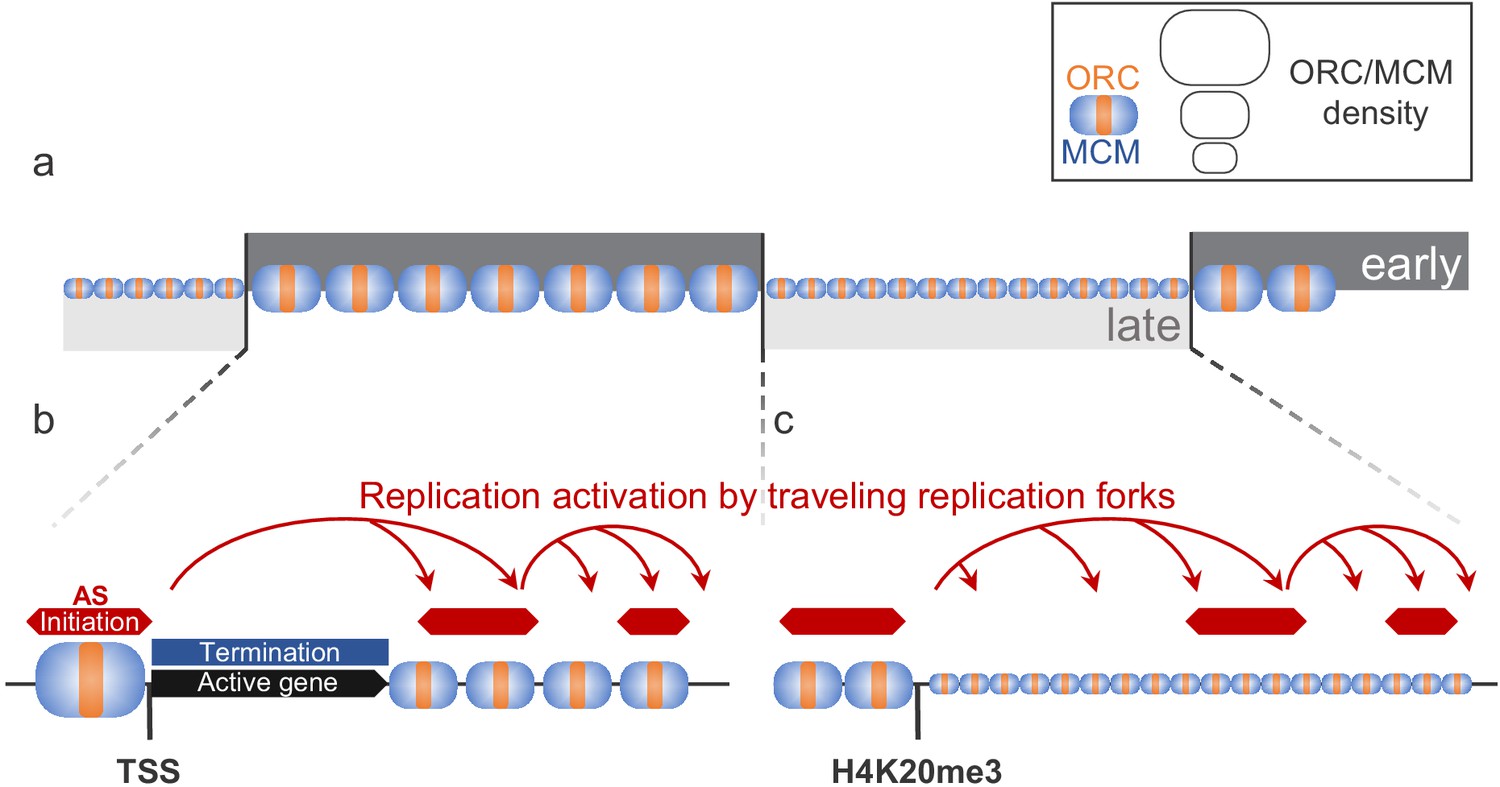
Model for replication organization in higher eukaryotes.
(a) Replication is organized in large segments of constant replication timing (early replication timing domain [RTD], dark grey; late RTD, light grey) (Marchal et al., 2019). While we observe the ubiquitous presence of the origin recognition complex (ORC; orange) and the minichromosome maintenance complex (MCM; blue) throughout the genome, the enrichment levels of ORC/MCM were higher in early RTDs compared to late RTDs. (b) Early RTDs are among other characterized by active transcription. ORC/MCM are locally highly enriched at active transcription start site (TSS). However, actively transcribed gene bodies (black) are deprived of ORC/MCM, often correlating with replication termination (blue). Besides TSSs, we find ORC/MCM stochastically distributed along intergenic regions. We hypothesize that traveling replication forks trigger activation of replication in a cascade (red arrows). (c) In gene-deprived and transcriptionally silent late-replicating heterochromatin, we detected homogeneous ORC/MCM distribution at generally lower levels. H4K20me3 is present at late-replicating non-genic ascending segments (ASs) and null RFD regions (NRRs) and leads to enhanced ORC/MCM binding, linking this histone mark to replication activation in heterochromatin.
Figure 7—figure supplement 1
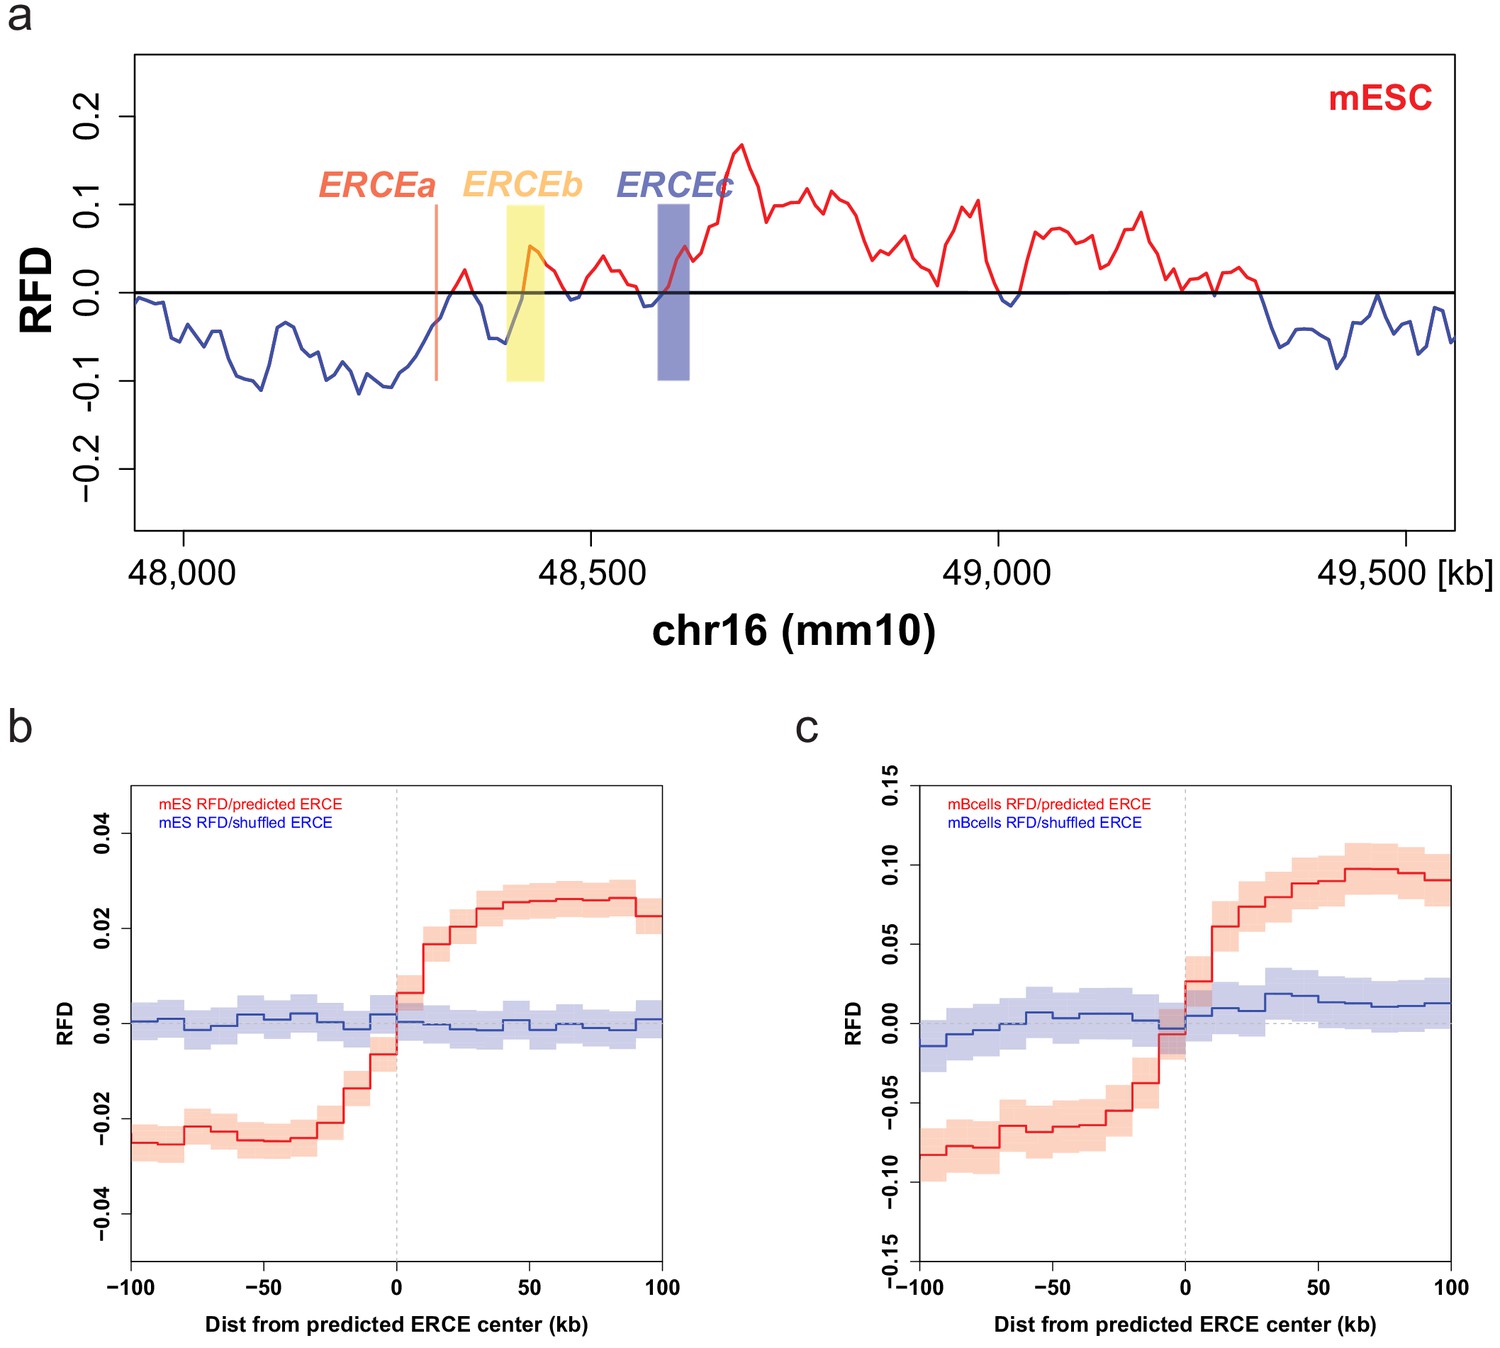
Early replication control elements (ERCEs) correlate with replication initiation.
(a) Mouse embryonic stem cells (mESC) strand-oriented Okazaki-segment sequencing (OK-seq) replication fork direction (RFD) profile of the mouse Dppa2/4 locus (chr16: 48,000,000–49,500,000) with indicated ERCEs (ERCEa, ERCEb, ERCEc). ERCEa and ERCEc are located within ascending RFD segments (ascending segment [AS]) in mESCs. ERCEb encompasses an entire AS. (b) Mean mESC OK-seq RFD profile around the 1835 mESC ERCEs (red) predicted by Sima et al., 2019 and randomly shuffled ERCEs (blue). (c) Mean mouse primary B-cell OK-seq RFD profile around the same mESC ERCE set (red) and randomly shuffled ERCEs (blue). mESC OK-seq data was obtained from Petryk et al., 2018; mouse primary B cell OK-seq data was computed from Tubbs et al., 2018; mESC ERCEs were predicted by Sima et al., 2019.
Author response image 1
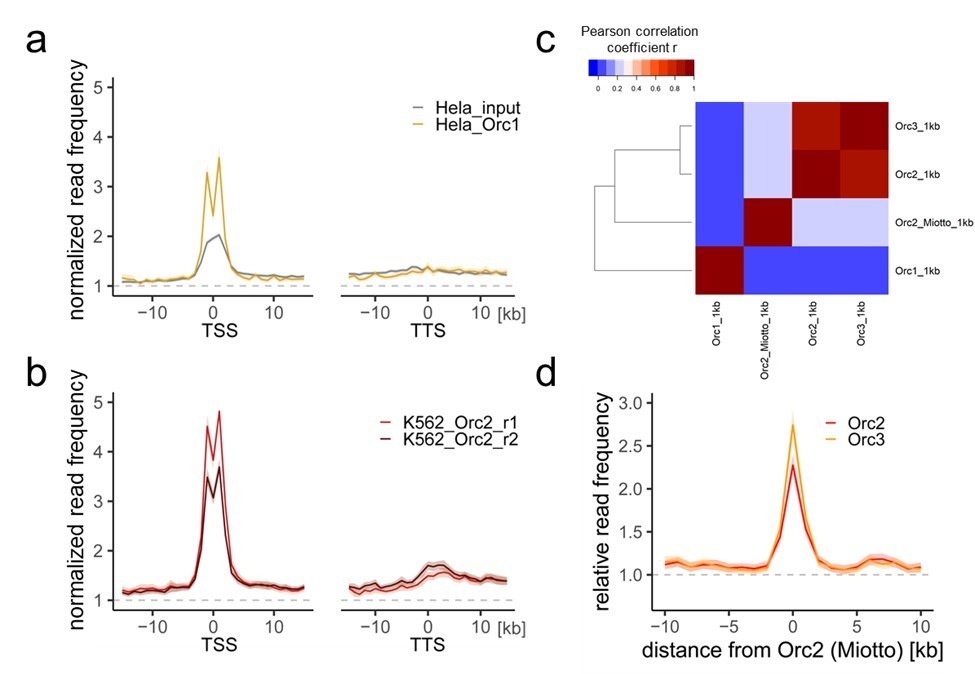
Comparison of our ORC/MCM ChIPs with previous Orc1 and Orc2 ChIP-seq data.
a) HeLa Orc1 and b) K562 Orc2 normalized read frequencies around TSSs or TTSs (independent of gene activity). Only genes larger than 30 kb without any adjacent gene within 15 kb were considered. Distances from TSSs or TTSs are indicated in kb. Means of Orc1 and Orc2 frequencies are shown ± 2 x SEM (lighter shadows). The dashed grey horizontal line indicates relative read frequency 1.0 for reference. c) Heat map of Pearson correlation coefficients R of our ORC ChIPs and the sum of two Orc2 replicates in K562 (Miotto et al.) and Orc1 in HeLa (Dellino et al., 2013) at 1 kb resolution. Column and line order were determined by complete linkage hierarchical clustering using the correlation distance (d = 1-r). d) Average ORC relative read frequencies at Orc2 (Miotto et al., 2016) peaks (>1 kb).
Tables
Table 1
Characterization of different AS subtypes.
| Number | Genome coverage (%) | Average length (kb) | |
|---|---|---|---|
| All AS | 2957 | 4.9 | 52.3 |
| Genic AS | 2451 | 4.1 | 52.3 |
| Type 1 AS | 673 | 1.1 | 50.7 |
| Type 2 AS | 1026 | 5.2 | 50.2 |
| Non-genic AS | 506 | 0.8 | 50.7 |
| Only AS ≥20 kb with ΔRFD > 0.5 were considered. Genic ASs: ASs extended 20 kb on both sides is overlapped by genic region(s) irrespective of transcriptional activity; type 1 and type 2 AS: ASs flanked by expressed genes (TPM ≥3) within 20 kb on both sides (type 1) or one side (type 2); non-genic: no annotated gene ±20 kb of AS borders; AS: ascending segment; RFD: replication fork direction; TPM: transcripts per kilobase per million. | |||
Table 2
Ratio of chromatin immunoprecipitation (ChIP) mean relative read frequencies in early versus late replication timing domains and G1 versus S-G2-M samples.
| Mean relative read frequency ratio (early/late) | Mean relative read frequency ratio (G1/S-G2-M) | |||
|---|---|---|---|---|
| G1 | S-G2-M | Early | Late | |
| Orc2 | 1.40 | 1.18 | 1.11 | 0.93 |
| Orc3 | 1.47 | 1.24 | 1.10 | 0.93 |
| Mcm3 | 1.15 | 0.93 | 1.16 | 0.93 |
| Mcm7 | 1.19 | 1.02 | 1.11 | 0.96 |
| Calculated in 10 kb bins. All annotated genic regions were removed ± 10 kb. | ||||
Key resources table
| Reagent type (species) or resource | Designation | Source or reference | Identifiers | Additional information |
|---|---|---|---|---|
| Cell line (Homo sapiens) | Raji (lymphoblast) | ATCC/DZMZ | ATCC: CCL-86 DZMZ: ACC 319 RRID:CVCL_0511 | B-lymphocyte; Burkitt’slymphoma Received from:https://www.dsmz.de/collection/catalogue/details/culture/AC C-319 Tested mycoplasma negative |
| Antibody | Cyclin A1/A2 (rabbit monoclonal) | Abcam | ab185619 | WB: 1:1000 |
| Antibody | Cyclin B1 (mouse monoclonal) | Abcam | ab72, RRID:AB_305751 | WB: 1:1000 |
| Antibody | H3S10P (rabbit monoclonal) | Cell Signaling | Clone D2C8, cat. no. 3377, RRID:AB_1549592 | WB: 1:1000 |
| Antibody | GAPDH (rat monoclonal) | This paper | Clone GAPDH3 10F4; Rat IgG2c | WB: 1:50 |
| Antibody | H4K20me1 (mouse monoclonal) | Diagenode | MAb-147-100 | ChIP: 2.5 µg |
| Antibody | H4K20me3 (rabbit polyclonal) | Diagenode | pAb-057-050, RRID:AB_2617145 | ChIP: 2.5 µg |
| Antibody | Rabbit-IgG (polyclonal) | Sigma | R2004, RRID:AB_261311 | ChIP: 10 µg |
| Antibody | Orc2 (rabbit polyclonal) | Ritzi et al., 2003 | SA93 | Whole serum; ChIP: 15 µl |
| Antibody | Orc3 (rabbit polyclonal) | Ritzi et al., 2003 | SA7976 | Whole serum; ChIP: 15 µl |
| Antibody | Mcm3 (rabbit polyclonal) | Ritzi et al., 2003 | SA8413 | Whole serum; ChIP: 15 µl |
| Antibody | Mcm7 (rabbit polyclonal) | Ritzi et al., 2003 | SA8496 | Whole serum; ChIP: 15 µl |
| Peptide, recombinant protein | Protein A Sepharose 4 Fast Flow | GE Healthcare | GE17-5280-11 | |
| Peptide, recombinant protein | Protein G Sepharose 4 Fast Flow | GE Healthcare | GE17-0618-06 | |
| Sequence-based reagent | oriP DS_fw | This paper | qPCR primers | 5′-AGTTCACTGCCCGCTCCT-3′ |
| Sequence-based reagent | oriP DS_rv | This paper | qPCR primers | 5′-CAGGATTCCACGAGGGTAGT-3′ |
| Sequence-based reagent | H4K20me1positive_fw | Eric Julien, personal communication | qPCR primers | 5′-ATGCCTTCTTGCCTCTTGTC-3′ |
| Sequence-based reagent | H4K20me1positive_rv | Eric Julien, personal communication | qPCR primers | 5′-AGTTAAAAGCAGCCCTGGTG-3′ |
| Sequence-based reagent | H4K20me3positive_fw | Eric Julien, personal communication | qPCR primers | 5′-TCTGAGCAGGGTTGCAAGTAC-3′ |
| Sequence-based reagent | H4K20me3positive_rv | Eric Julien, personal communication | qPCR primers | 5′-AAGGAAATGATGCCCAGCTG-3′ |
| Chemical compound, drug | Formaldehyde | Thermo Scientific | Prod# 28908 | 16% formaldehyde solution; methanol-free |
| Chemical compound, drug | Proteinase K | Roche | Cat. no. 03 115 852 001 | 1 mg/ml; 8 mg |
| Chemical compound, drug | RNase | Roche | Cat. no. 11 119 915 001 | 0.5 µg/µl; 2 µg |
| Commercial assay or kit | NucleoSpin Extract II Kit | Macherey-Nagel | Cat. no. 740609.50 | |
| Commercial assay or kit | Accel-NGS 1S Plus DNA Library Kit for Illumina | Swift Biosciences | Cat. no. 10096 | |
| Commercial assay or kit | Direct-zolTM RNA MiniPrep kit | Zymo Research | Cat. no. R2051 | |
| Commercial assay or kit | Encore Complete RNA-Seq Library Systems kit | NuGEN | Cat. no. 0333-32 | |
| Software, algorithm | Tophat2 | Kim et al., 2013 | RRID:SCR_013035 | |
| Software, algorithm | HTSeq-count | Anders et al., 2015 | RRID:SCR_011867 | |
| Software, algorithm | BWA (v.0.7.4) | Li and Durbin, 2009 | RRID:SCR_010910 | OK-seq mapping, default parameters |
| Software, algorithm | bowtie (v.1.1.1) | Langmead et al., 2009 | RRID:SCR_005476 | ChIP-seq mapping, bowtie -m one index file.fastq |
| Software, algorithm | deepTools (v.3.3.1) | Ramírez et al., 2016 | RRID:SCR_016366 | |
| Software, algorithm | MACS2 (v.2.2.5) | Zhang et al., 2008 | RRID:SCR_013291 | Default settings, --broad |
| Software, algorithm | R (v.3.2.3) | R Development Core Team, 2018 | RRID:SCR_001905 | |
| Software, algorithm | dplyr (v.0.8.5) | Wickham et al., 2020 | RRID:SCR_016708 | R package |
| Software, algorithm | ggplot2 (v.3.1.0) | Wickham, 2016 | RRID:SCR_014601 | R package |
| Software, algorithm | gplots (v.3.0.3) | Warnes et al., 2020 | R package | |
| Software, algorithm | Python 2.7 and Phyton 3 | van Rossum, 1995 | RRID:SCR_008394 | |
| Software, algorithm | numpy (v.1.18.5) | Harris et al., 2020 | RRID:SCR_008633 | Python library |
| Software, algorithm | matplotlib (v.3.2.3) | Hunter, 2007 | RRID:SCR_008624 | Python library |
| Software, algorithm | SciPy (v.1.5.0) | Virtanen et al., 2020 | RRID:SCR_008058 | Python library |
Additional files
Download links
A two-part list of links to download the article, or parts of the article, in various formats.
Downloads (link to download the article as PDF)
Open citations (links to open the citations from this article in various online reference manager services)
Cite this article (links to download the citations from this article in formats compatible with various reference manager tools)
Human ORC/MCM density is low in active genes and correlates with replication time but does not delimit initiation zones
eLife 10:e62161.
https://doi.org/10.7554/eLife.62161


