Thalamus and claustrum control parallel layer 1 circuits in retrosplenial cortex
- Department of Psychology, University of Michigan, United States
- Neuroscience Graduate Program, University of Michigan, United States
- Department of Mathematics, University of Michigan, United States
- Michigan Center for Integrative Research in Critical Care, University of Michigan, United States
- Kresge Hearing Research Institute, University of Michigan, United States
- Department of Biomedical Engineering, University of Michigan, United States
Figures
Figure 1 with 1 supplement

Anterior thalamic input controls LR, but not RS, neurons in superficial granular retrosplenial cortex.
(A) Representative example of the firing properties of LR neurons. Top trace: sustained high-frequency firing of action potentials with little spike frequency adaptation at high current inputs in response to 200 pA current injection. Bottom trace: Delay to first spike at threshold current inputs (50 pA) and little to no sag when hyperpolarized (−100 pA). Right inset is a zoomed in view of the first spike in response to a near-threshold current input. Cell is held at −65 mV resting potential. (B) Same as A, but for a representative RS neuron. Note the spike frequency adaptation with high current inputs, delay to first spike at near-threshold current inputs, and sag potential seen with hyperpolarization. Cell is held at −65 mV resting potential. (C) Population data comparisons between LR and RS neurons of the following intrinsic properties: input resistance (p=1.31e-26; Wilcoxon rank sum), rheobase (p=1.24e-17; Wilcoxon rank sum), and adaptation ratio (p=2.94e-24; Wilcoxon rank sum). Error bars are standard error of the mean (SEM). (D) Left: Schematic showing the injection of optogenetic viral construct into the anterodorsal/anteroventral (ADAV) nuclei of the anterior thalamus. Middle: DIC image of RSG. Right: EYFP fluorescence image of RSG showing expressing anterior thalamic axons and terminal arbors. (E) Schematic of optogenetic stimulation of TC axons and terminal arbors over the patched cell body in RSG L3. (F) LR (purple) and RS (blue) cell responses to 10 Hz light pulses (see Materials and methods) at maximum LED power. LR cell shows spiking responses, while the RS cell has very small EPSPs. Both cells were held at −65 mV before stimulation. Blue triangles indicate light pulses. (G) Optogenetic activation of thalamic axons in RSG increases the firing rate of the LR (purple) but not RS (blue) neuron in a simultaneously patched pair. Neurons were held in ACSF +picrotoxin at a constant firing rate of 10–30 Hz via a 2 s current injection, and a 1 ms LED pulse was delivered 500 ms into the spike train (see Materials and methods). Top: Raster plots for all sweeps of a representative LR (purple) and RS (blue) example. Middle: Firing trace of one sweep for that same LR and RS pair. Bottom: PSTH plots evaluating all sweeps for the same LR and RS example cells. (H) Population analysis of the spike ratio for all tested LR (n = 7) and RS (n = 6) cells showing a significant increase in firing rate post-LED pulse in LR cells compared to RS cells (p=0.0012; Wilcoxon rank sum test). Error bars are SEM.
See Figure 1—source code 1 and Figure 1—source data 1 for MATLAB code and source data used to plot bar graphs in panel C and associated supplements.
-
Figure 1—source data 1
Cell-type specific intrinsic physiology.
- https://cdn.elifesciences.org/articles/62207/elife-62207-fig1-data1-v1.zip
-
Figure 1—source code 1
Code to generate intrinsic physiology comparisons.
- https://cdn.elifesciences.org/articles/62207/elife-62207-fig1-code1-v1.zip
Figure 1—figure supplement 1
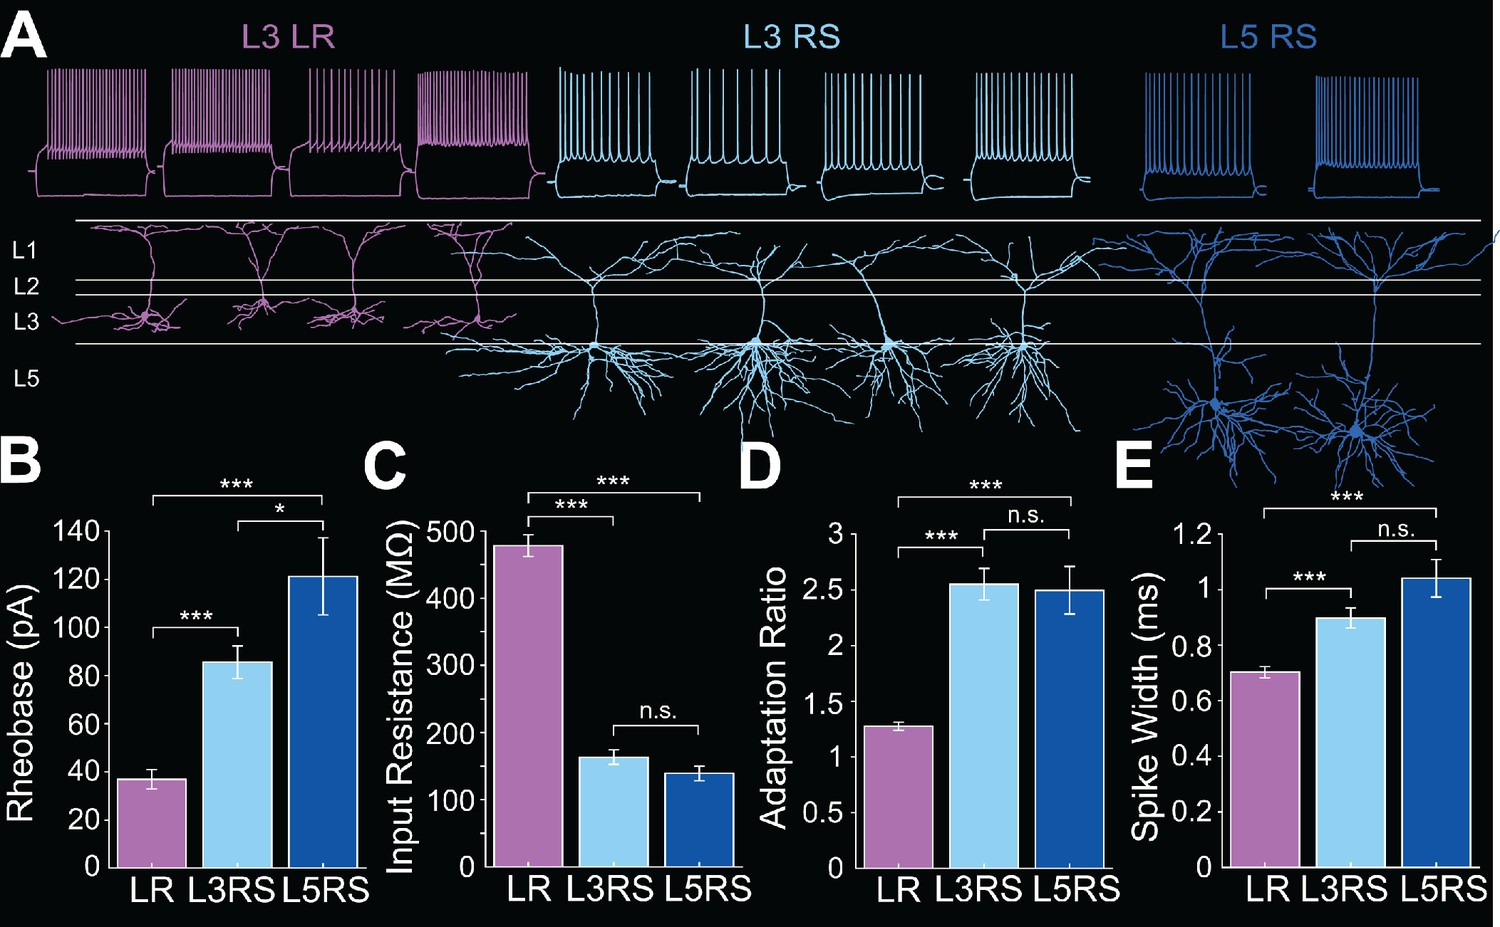
Intrinsic properties of RSG layer 3 LR, layer 3 RS, and layer 5 RS neurons.
(A) Top row shows intrinsic firing properties of layer three low-rheobase (LR) neurons (purple), layer three regular-spiking (RS) neurons (light blue), and layer 5 RS neurons (dark blue). Bottom row shows the matching reconstructions of L3 LR (purple), L3 RS (light blue), and L5 RS (dark blue) neurons. (B) Average rheobase for LR, L3 RS, and L5 RS neurons. Note the significantly lower rheobase in LR neurons compared to L3 RS (p=1.24e-17; Wilcoxon rank sum test) and L5 RS (p=9.33e-12; Wilcoxon rank sum test) neurons. Rheobase of L3 and L5 RS neurons is significantly different (p=0.0312; Wilcoxon rank sum test). Error bars are SEM. (C) Average input resistance (IR) for LR, L3 RS, and L5 RS neurons. Note the significantly larger IR in LR neurons compared to L3 RS (p=1.31e-26; Wilcoxon rank sum test) and L5 RS cells (p=3.07e-18; Wilcoxon rank sum test), while L3 and L5 RS cells do not differ (p=0.2798; Wilcoxon rank sum test). Error bars are SEM. (D) Average adaptation ratio for LR, L3 RS, and L5 RS neurons. Note the significantly lower adaptation ratio in LR neurons compared to L3 RS (p=2.94e-24; Wilcoxon rank sum test) and L5 RS cells (p=6.24e-15; Wilcoxon rank sum test), while L3 and L5 RS cells do not differ (p=0.5387; Wilcoxon rank sum test). Error bars are SEM. (E) Average spike half-width for LR, L3 RS, and L5 RS neurons. Note the significantly narrower spike width in LR neurons compared to L3 RS (p=3.71e-06; Wilcoxon rank sum test) and L5 RS cells (p=1.25e-06; Wilcoxon rank sum test), while L3 and L5 RS cells do not differ (p=0.0914; Wilcoxon rank sum test). Error bars are SEM. See Figure 1—source data 1 and Figure 1—source code 1 for source data and MATLAB code used to plot panels B-E.
Figure 2 with 1 supplement
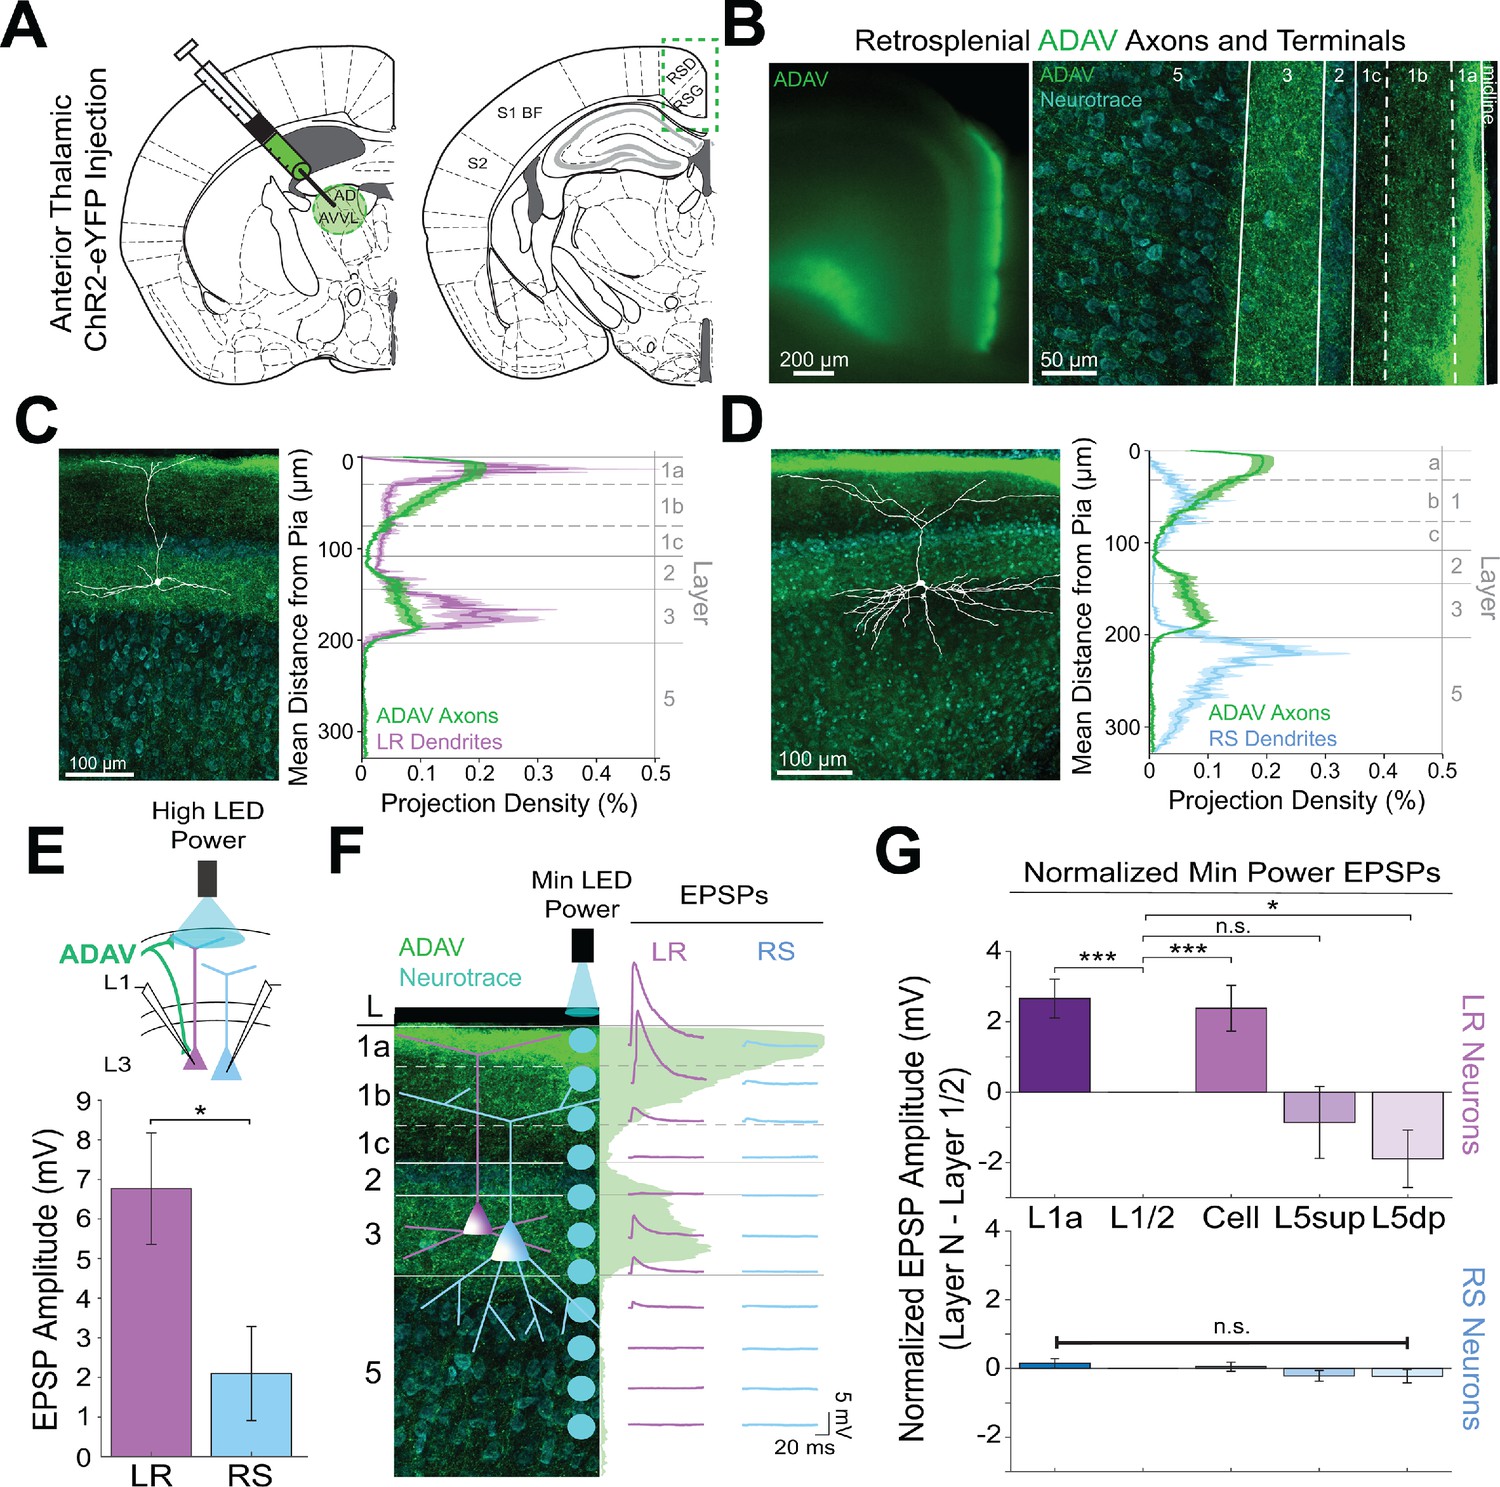
Thalamic control of LR neurons is explained by precise convergence of LR dendrites and anterior thalamic axons in layer 1a of granular retrosplenial cortex.
(A) Schematic of channelrhodopsin injection into anterior thalamus (left) and RSG target recording region (right). (B) Left: epifluorescent image of the retrosplenial cortex showing expression of anterior thalamic axons and terminal arbors in green. Right: confocal image of layers 1–5 of RSG showing lamination of anterior thalamic axons and terminal arbors (green) and cell membrane marker, NeuroTrace (cyan). (C) Left: LR reconstruction superimposed on patch location in an RSG slice with thalamic projections (green) and NeuroTrace (cyan). Right: Projection density plot showing density of LR dendrites (n = 10; mean ± SEM shaded) in purple and density of ADAV axon expression (n = 5; mean ± SEM shaded) in green plotted as distance from the pia (µm). (D) Same as C for RS cells with dendrites (n = 5) plotted in blue. (E) Top: Schematic of L1a-targeted optogenetic stimulation. Bottom: Significantly larger EPSP amplitude at high LED power for LR (n = 15) cells compared to RS (n = 8) cells (p=0.0185; Wilcoxon rank sum test). Error bars are SEM. (F) Left: Confocal image of RSG slice with anterior thalamic axons and terminal arbors (green). Layers are demarcated, and schematic LR and RS neurons are placed in their representative locations within the superficial layers. Blue circles indicate targeting of minimum LED power stimulations, beginning at midline and extending into layer 5, stimulating every 20–30 µm (see Materials and methods). Right: Representative trace examples of an LR (purple) and RS (blue) neurons’ responses to the LED stimulation at each location. Green shading is representative of the projection density of thalamic axons and terminal arbors across the shown layers. (G) Population analysis for LR and RS cells’ normalized EPSP responses to minimum LED power optogenetic stimulations at L1a, L1/2 boundary, cell body in L3, superficial L5 (L5sup), and deep L5 (L5dp) locations. Top: LR cells have significantly larger responses at L1a (n = 58, p=0.00001, paired t-test) and cell body (n = 53, p=0.0006) compared to L1/2 (n = 59). Responses at L5dp (n = 10, p=0.0462) are significantly smaller than L1/2, and responses at L5sup (n = 12, p=0.420) do not significantly differ from L1/2. Bottom: EPSP amplitude in RS cells does not significantly differ at any stimulation location compared to L1/2 stimulation (L1a: n = 27, p=0.289; cell body: n = 25, p=0.702; L5sup: n = 12, p=0.197; L5dp: n = 11, p=0.261; L1/2: n = 27). Error bars are SEM. The paired t-test was used for all statistical comparisons. See Figure 2—source data 1 for source data.
-
Figure 2—source data 1
Laminar-specific responses to ADAV input.
- https://cdn.elifesciences.org/articles/62207/elife-62207-fig2-data1-v1.xlsx
Figure 2—figure supplement 1
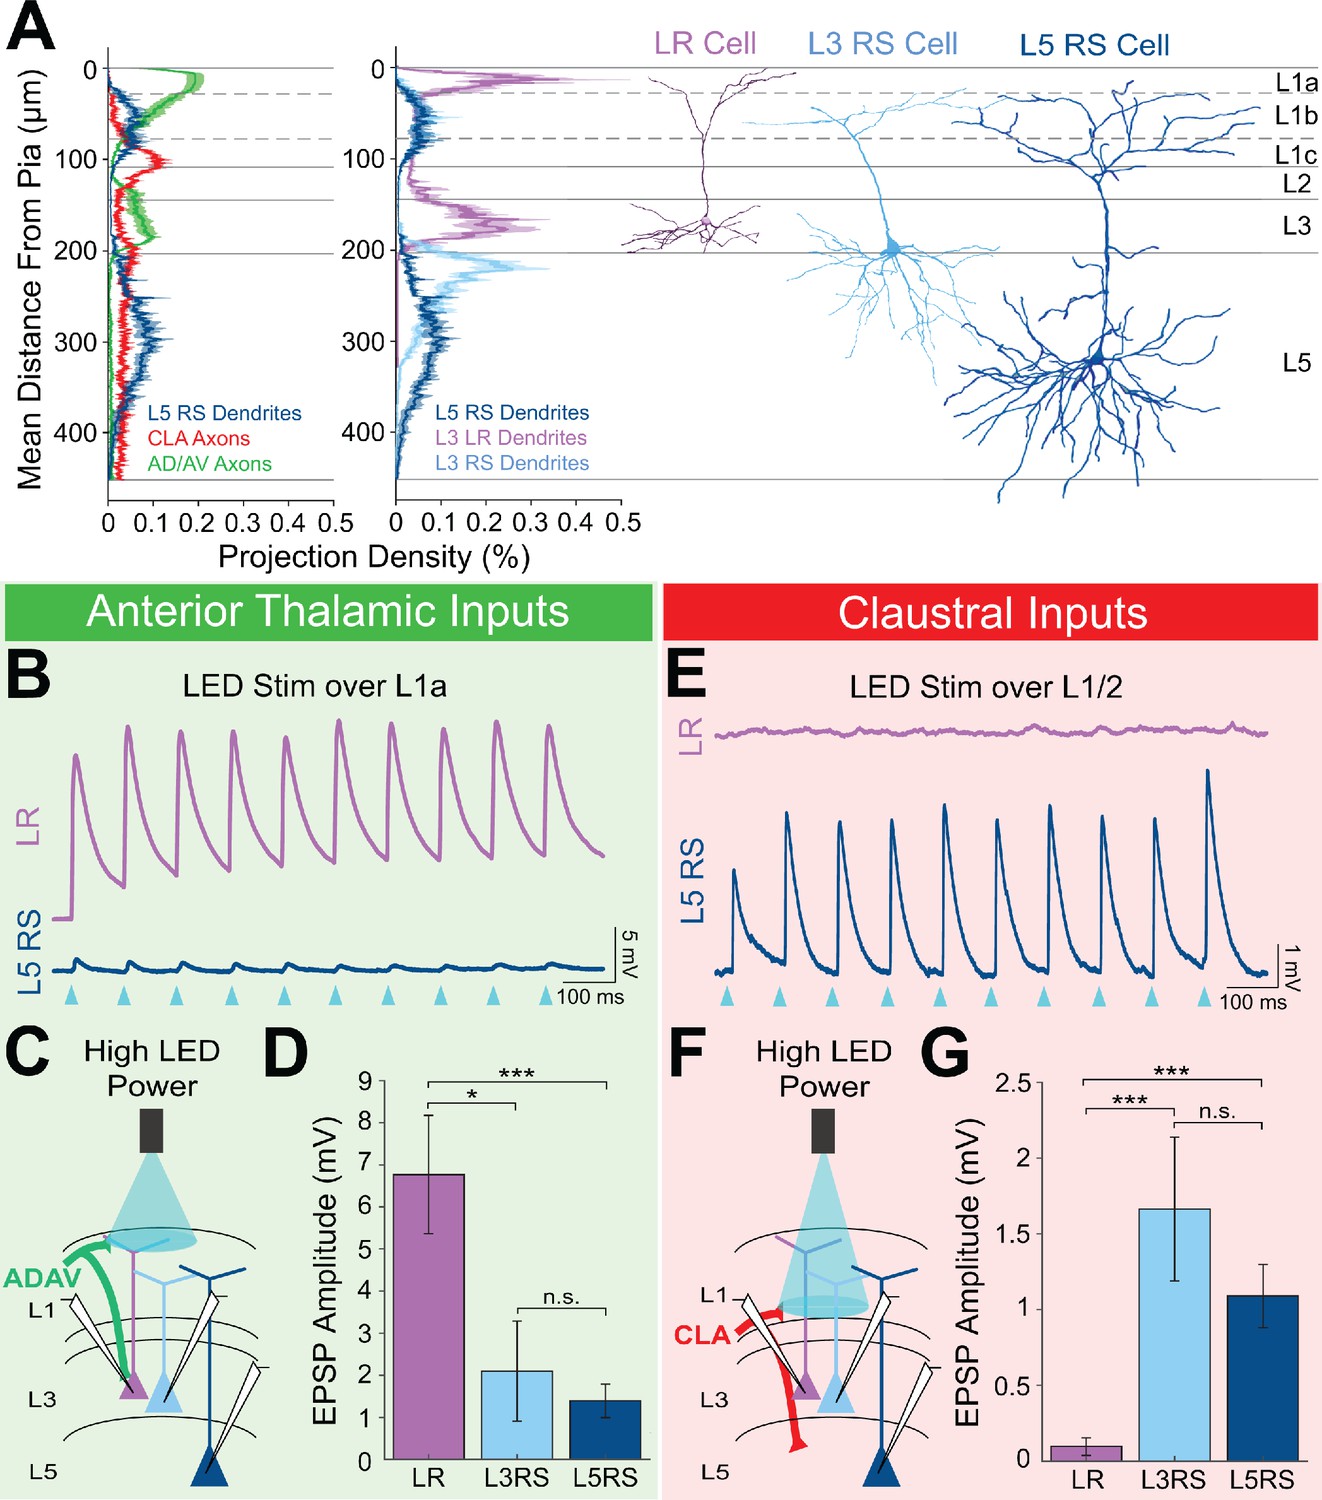
LR neuron responses to anterior thalamic and claustral inputs differ significantly from those of L5 RS cells.
(A) Left: Projection density plot of ADAV arbors (green, n = 5), CLA arbors (red, n = 6), and L5 RS neuron dendrites (navy, n = 5). Right: Projection density plot of LR (purple, n = 10), L3 RS (light blue, n = 5), and L5 RS neuron dendrites (navy, n = 5) showing an overlap in apical dendrites between L3 RS and L5 RS cells. Plots are mean ± SEM shaded. Representative reconstructions of LR (purple), L3 RS (blue), and L5 RS (navy) neurons are aligned in the cortical layers. (B) Trace example of a simultaneously patched LR (purple) and L5RS (navy) neuron pair showing responses to 10 Hz train of 1 ms wide optogenetic LED pulses. Blue triangles indicate each LED pulse. Cells were held at −65 mV. (C) Schematic showing TC inputs from ADAV to patched LR, L3 RS, and L5 RS neurons. LED stimulation is focused on L1a. (D) Bar graph of the population data for LR, L3 RS, and L5 RS neuron responses to TC input at L1a. LR responses are significantly larger than both L3 RS and L5 RS, while L3 RS and L5 RS responses do not differ. LR vs L3 RS: p=0.0185, LR vs L5 RS: p=0.00072, L3 RS vs L5 RS: p=0.9335; Wilcoxon rank sum test. Error bars are SEM. (E) Trace example of a same-slice sequential pair of LR (purple) and L5RS (navy) neurons showing responses to 10 Hz train of 1 ms wide optogenetic LED pulses. Blue triangles indicate each LED pulse. Cells were held at −65 mV. (F) Schematic showing CLA inputs to patched LR, L3 RS, and L5 RS neurons. LED stimulation is focused on L1/2 boundary. (G) Bar graph of the population data for LR, L3 RS, and L5 RS neuron responses to CLA input at L1/2. LR responses are significantly smaller than both L3 RS and L5 RS, while L3 RS and L5 RS responses do not differ. LR vs L3 RS: p=0.00000353, LR vs L5 RS: p=0.00000233, L3 RS vs L5 RS: p=0.7989; Wilcoxon rank sum test. Error bars are SEM.
Figure 3
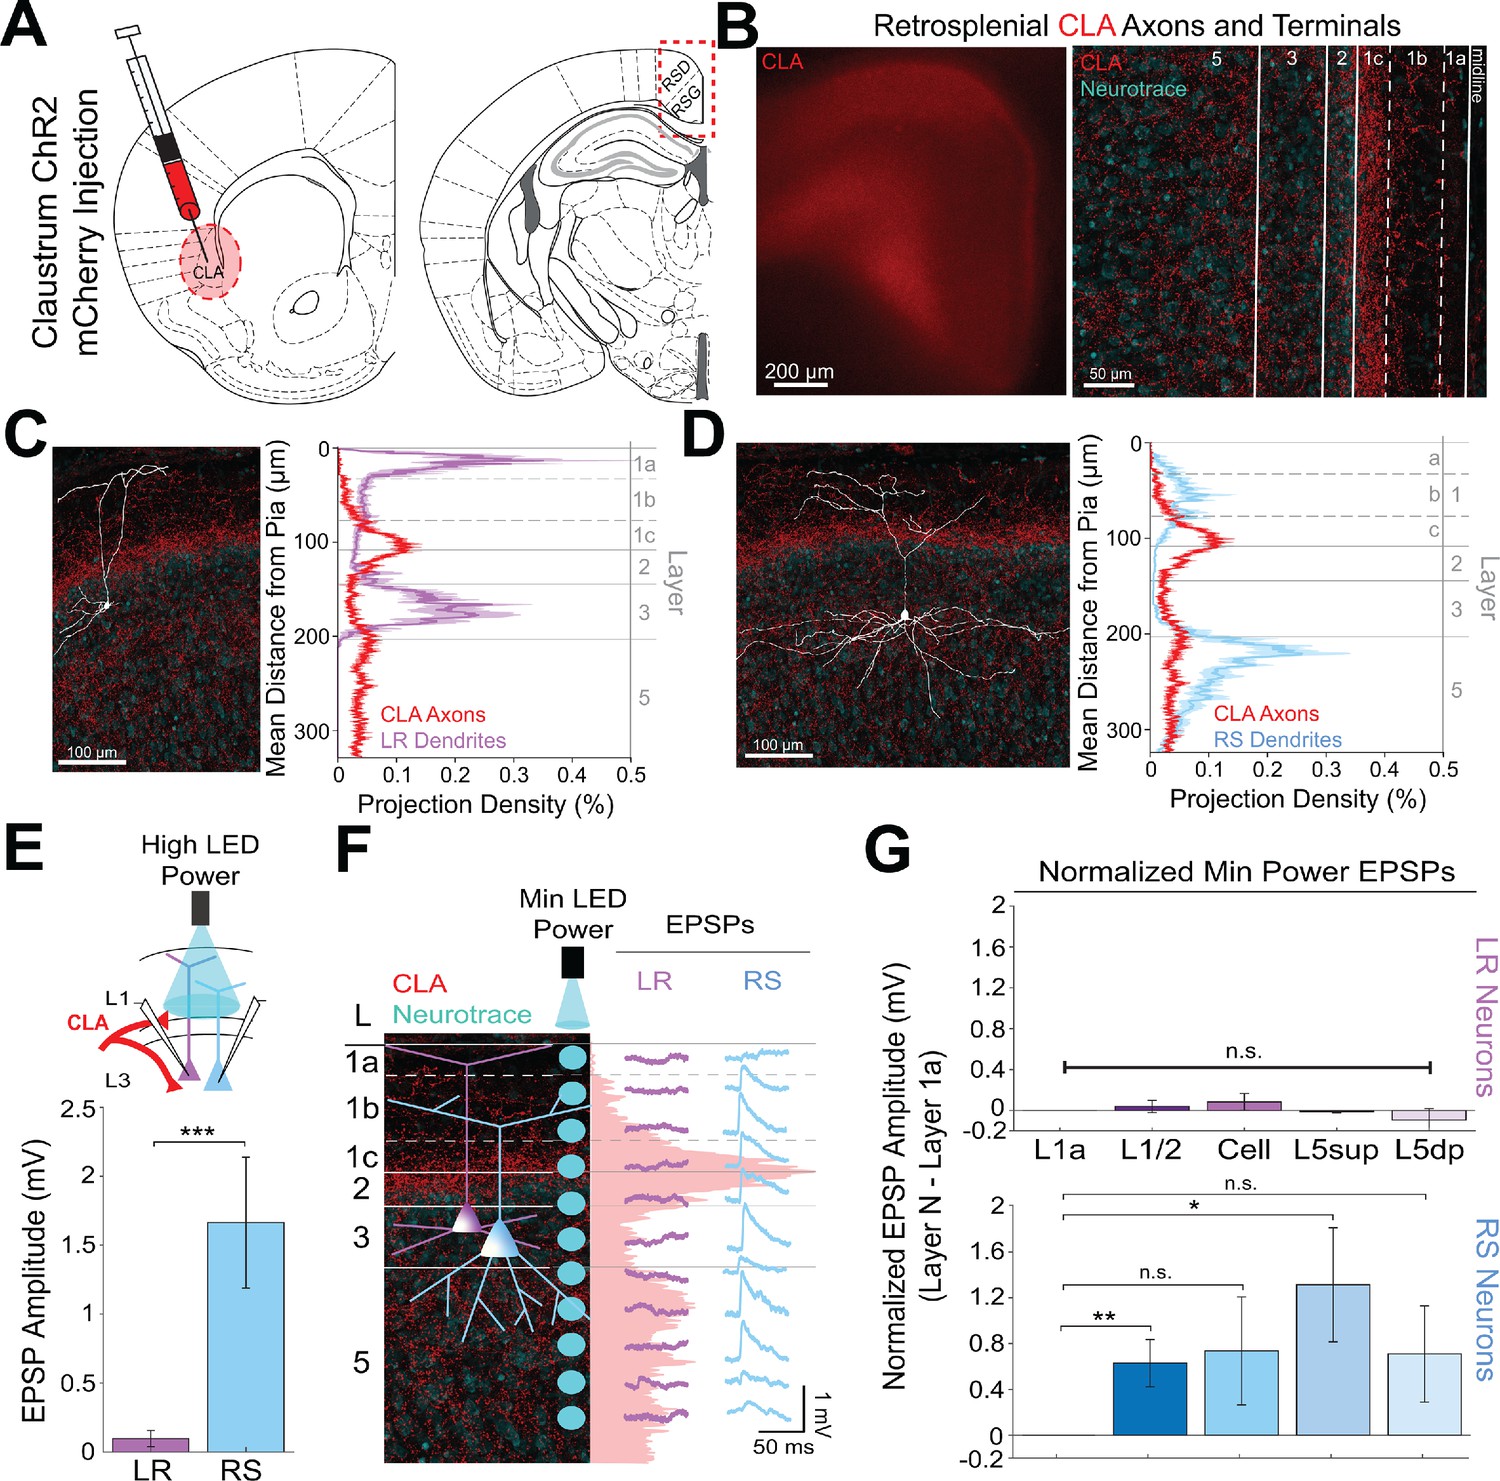
Claustral inputs to RSG selectively drive RS, not LR, neurons, consistent with stronger anatomical overlap of RS neuron dendrites with claustral axons.
(A) Schematic of channelrhodopsin injection into claustrum (CLA; left) and target recording region, RSG (right; see Materials and methods). (B) Left: Epifluorescent image of the RSG brain slice showing expressing ClaC arbors in red. Right: confocal image of layers 1–5 of RSG showing lamination of claustral axons and terminal arbors (red) and NeuroTrace (cyan). (C) Left: LR reconstruction superimposed on patch location in an RSG slice with claustral projections (red) and NeuroTrace (cyan). Right: Projection density plot showing density of LR dendrites in purple (n = 10; mean ± SEM shaded) and density of CLA axon expression in red (n = 6; mean ± SEM shaded) plotted as distance from pia (µm). (D) Same as C for RS cells with dendrites (n = 5) plotted in blue. (E) Top: Schematic of L1/2-targeted optogenetic stimulation. Bottom: Significantly larger EPSP amplitude at high LED power for the RS (n = 16) cells compared to LR (n = 26) cells (p=0.0000035; Wilcoxon rank sum test). Error bars are SEM. (F) Left: Confocal image of RSG slice with CLA axons and terminal arbors (red) and NeuroTrace (cyan). Layers are demarcated, and schematic LR and RS neurons are placed in their representative locations within the superficial layers. Blue circles indicate targeting of the minimum LED power stimulations, beginning at midline and extending into layer 5, stimulating every 20–30 µm (see Materials and methods). Right: Representative trace examples of an LR (purple) and RS (blue) neurons’ responses to the LED stimulation at each location. Red shading is representative of the projection density of CLA axons and terminal arbors across the layers. (G) Population analysis for LR and RS normalized EPSP responses to minimum LED power stimulations at L1a, L1/2, cell body, L5sup, and L5dp locations. Top: EPSP amplitude in LR cells does not significantly differ at any stimulation location compared to L1a stimulation (L1/2: n = 24, p=0.5151; L3: n = 23, p=0.3276; L5sup: n = 10, p=0.3434; L5dp: n = 7, p=0.4348; L1a: n = 24). Bottom: RS cells have significantly larger responses at L1/2 (n = 18, p=0.00725) and L5sup (n = 9, p=0.0301) compared to L1a (n = 18), while normalized response amplitudes at cell body (n = 17, p=0.1377) and L5dp (n = 8, p=0.1355) did not differ from responses at L1a. The paired t-test was used for all statistical analyses. Error bars are SEM. See Figure 3—source data 1 for source data.
-
Figure 3—source data 1
Laminar-specific responses to CLA input.
- https://cdn.elifesciences.org/articles/62207/elife-62207-fig3-data1-v1.xlsx
Figure 4
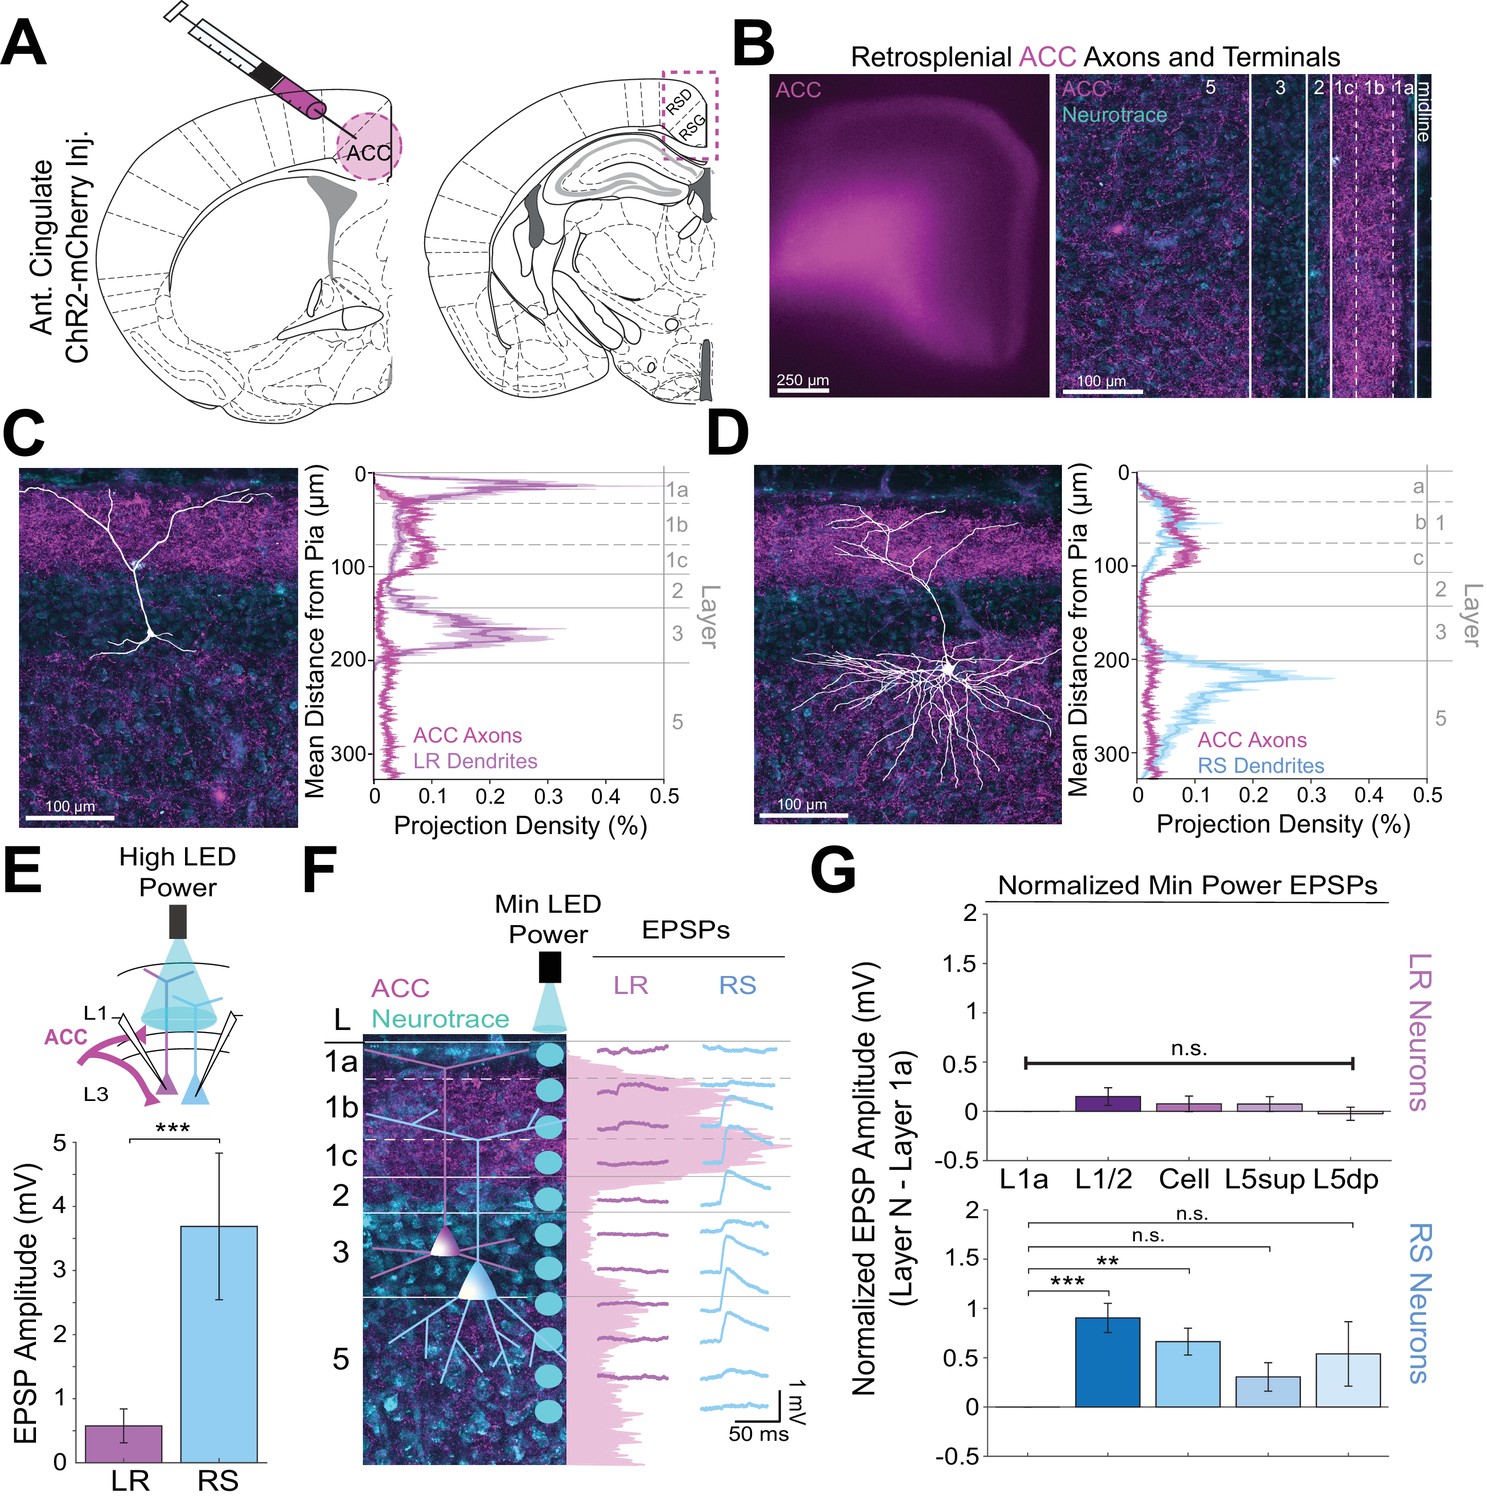
Anterior cingulate inputs to RSG selectively drive RS, not LR, neurons, consistent with anatomical overlap of RS neuron dendrites with anterior cingulate axons.
(A) Schematic of channelrhodopsin injection into anterior cingulate (ACC; left) and target recording region, RSG (right; see Materials and methods). (B) Left: Epifluorescent image of the RSG brain slice showing expressing ACC arbors in magenta. Right: confocal image of layers 1–5 of RSG showing lamination of cingulate axons and terminal arbors (magenta) and NeuroTrace (cyan). (C) Left: LR reconstruction superimposed on patch location in an RSG slice with ACC projections (magenta) and NeuroTrace (cyan). Right: Projection density plot showing density of LR dendrites (n = 10; mean ± SEM shaded) in purple and density of ACC axon expression (n = 4; mean ± SEM shaded) in magenta plotted as distance from the pia (µm). (D) Same as C for RS cells with dendrites (n = 5) plotted in blue. (E) Top: Schematic of L1/2-targeted optogenetic stimulation. Bottom: Significantly larger EPSP amplitude at high LED power for the RS (n = 10) cells compared to LR (n = 16) cells (p=0.0019; Wilcoxon rank sum test). Error bars are SEM. (F) Left: Confocal image of RSG slice with ACC axons and terminal arbors (magenta) and NeuroTrace (cyan). Layers are demarcated, and schematic LR and RS neurons are placed in their representative locations within the superficial layers. Blue circles indicate targeting of the minimum LED power stimulations, beginning at midline and extending into layer 5, stimulating every 20–30 µm (see Materials and methods). Right: Representative trace examples of an LR (purple) and RS (blue) neurons’ responses to the LED stimulation at each location. Magenta shading is representative of the projection density of ACC axons and terminal arbors across the layers. (G) Population analysis for LR and RS normalized EPSP responses to minimum LED power stimulations at L1a, L1/2, cell body, L5sup, and L5dp locations. Top: EPSP amplitude in LR cells does not significantly differ at any stimulation location compared to L1a stimulation (L1/2: n = 19, p=0.1126; cell body: n = 19, p=0.35; L5sup: n = 13, p=0.3423; L5dp: n = 13, p=0.7166; L1a: n = 19). Bottom: RS cells have significantly larger responses at L1/2 (n = 14, p=0.000037) and cell body (n = 14, p=0.000525) compared to L1a (n = 14) and did not significantly differ at L5sup (n = 11, p=0.0607) or L5dp (n = 10, p=0.1340) compared to L1a. The paired t-test was used for all statistical analyses. Error bars are SEM. See Figure 4—source data 1 for source data.
-
Figure 4—source data 1
Laminar-specific responses to ACC input.
- https://cdn.elifesciences.org/articles/62207/elife-62207-fig4-data1-v1.xlsx
Figure 5
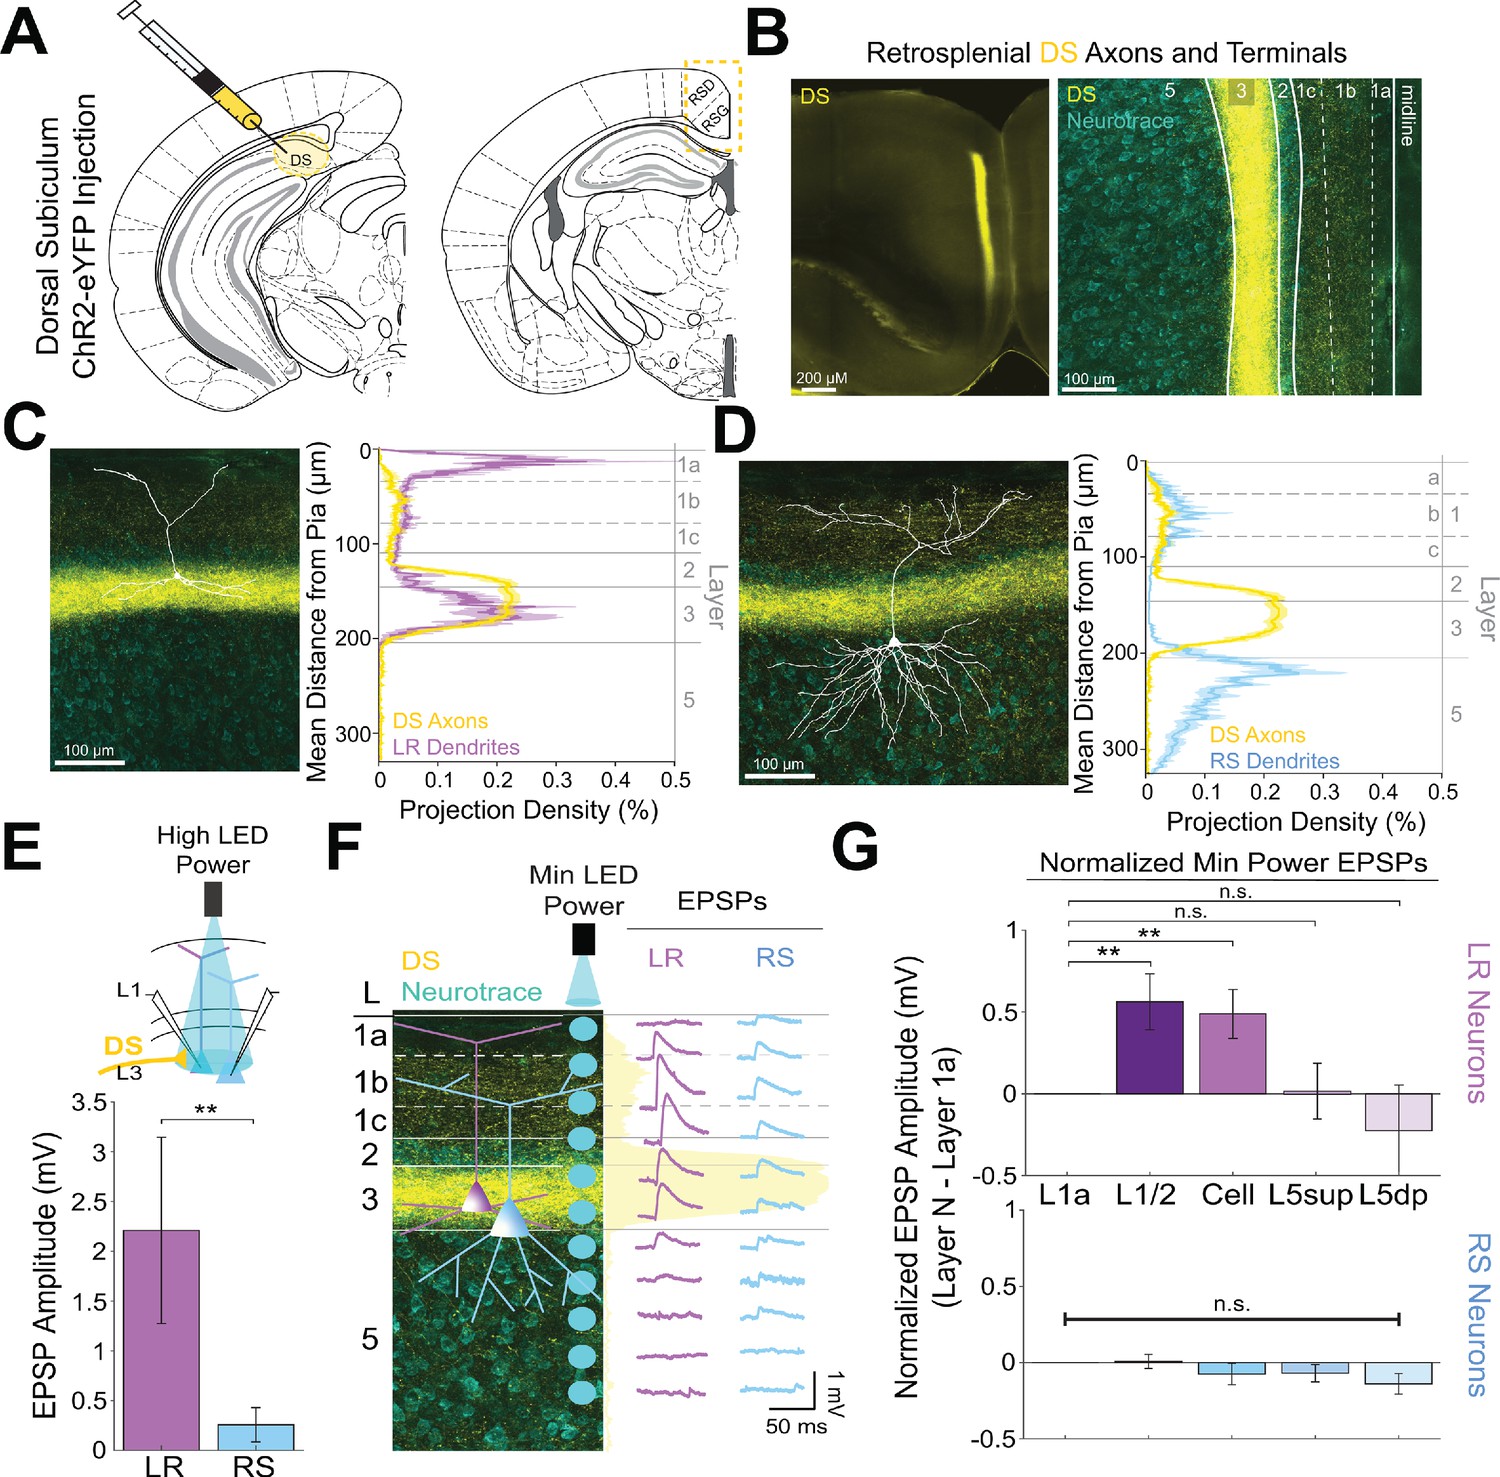
Dorsal subiculum inputs to RSG selectively drive LR, not RS, neurons, consistent with anatomical overlap of LR neuron dendrites with subicular axons.
(A) Schematic of channelrhodopsin injection into dorsal subiculum (DS; left) and target recording region, RSG (right; see Materials and methods). (B) Left: Epifluorescent image of the RSG brain slice showing expressing DS arbors in yellow. Right: confocal image of layers 1–5 of RSG showing lamination of DS axons and terminal arbors (yellow) and NeuroTrace (cyan). (C) Left: LR reconstruction superimposed on patch location in an RSG slice with DS projections (yellow) and NeuroTrace (cyan). Right: Projection density plot showing density of LR dendrites (n = 10; mean ± SEM shaded) in purple and density of DS axon expression (n = 4; mean ± SEM shaded) in yellow plotted as distance from the pia (µm). (D) Same as C for RS cells with dendrites (n = 5) plotted in blue. (E) Top: Schematic of cell body-targeted optogenetic stimulation at high LED power (see Materials and methods) conducted in standard ACSF. Bottom: Bar graph showing significantly larger EPSP amplitude at high LED power for the LR (n = 9) cells compared to RS (n = 8) cells (p=0.004; Wilcoxon rank sum test). Error bars are SEM. (F) Left: Confocal image of RSG slice with DS axons and terminal arbors (yellow) and NeuroTrace (cyan). Layers are demarcated, and schematic LR and RS neurons are placed in their representative locations within the superficial layers. Blue circles indicate targeting of the minimum LED power stimulations, beginning at midline and extending into layer 5, stimulating every 20–30 µm (see Materials and methods). Right: Representative trace examples of an LR (purple) and RS (blue) neurons’ responses to the LED stimulation at each location. Yellow shading is representative of the projection density of DS axons and terminal arbors across the layers. (G) Population analysis for LR and RS normalized EPSP responses to minimum LED power stimulations at L1a, L1/2, cell body, L5sup, and L5dp locations. Top: LR cells have significantly larger responses at L1/2 (n = 8, p=0.0132) and cell body (n = 8, p=0.0135) compared to responses at L1a (n = 8), while responses at L5sup (n = 8, p=0.9146) and L5dp (n = 7, p=0.4902) do not differ from those at L1a. Bottom: EPSP amplitude in RS cells does not significantly differ at any stimulation location compared to L1a stimulation (L1/2: n = 7, p=0.8811; cell body: n = 7, p=0.3304; L5sup: n = 7, p=0.2260; L5dp: n = 6, p=0.0816; L1a: n = 7). The paired t-test was used for all statistical analyses. Error bars are SEM. See Figure 5—source data 1 for source data.
-
Figure 5—source data 1
Laminar-specific responses to DS input.
- https://cdn.elifesciences.org/articles/62207/elife-62207-fig5-data1-v1.xlsx
Figure 6 with 2 supplements
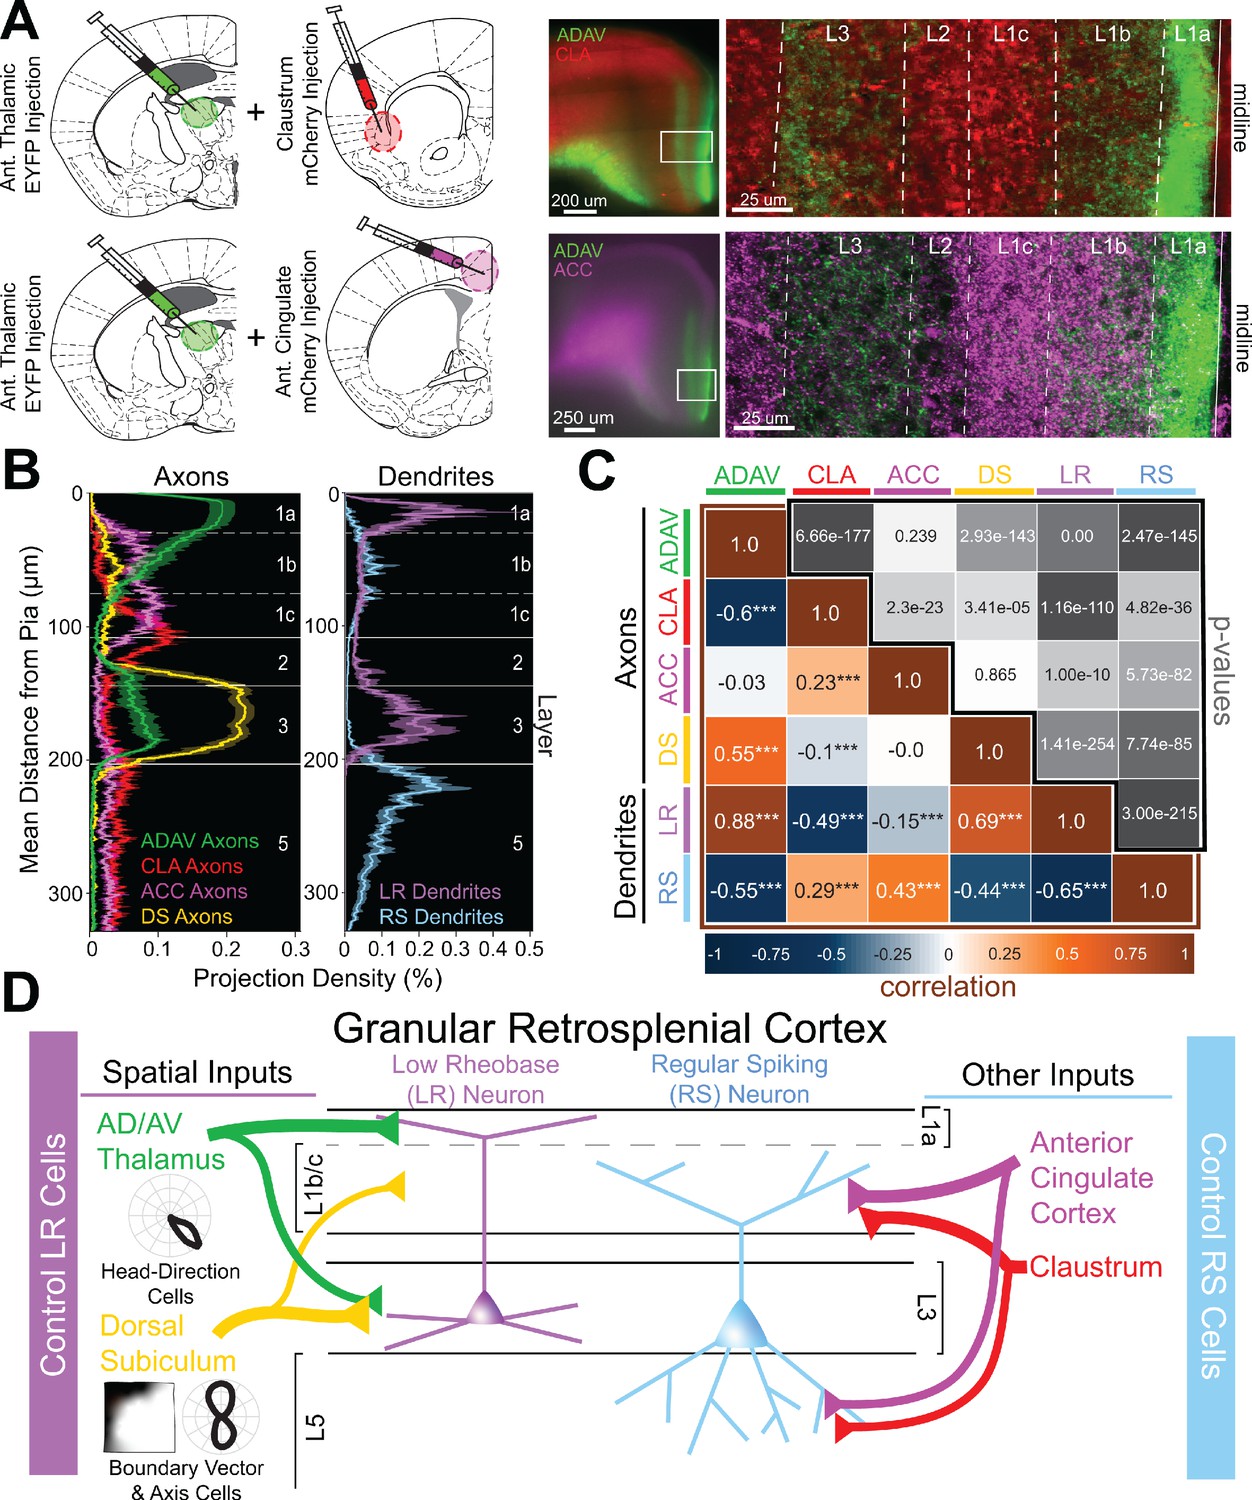
Two parallel circuits in superficial granular retrosplenial cortex.
(A) Left: Schematics of dual injections into anterior thalamus (ADAV) and claustrum (CLA; top) or anterior cingulate (ACC; bottom). Right: Resulting dual expression of ADAV (green) and CLA (red; top) or ACC (magenta; bottom) axons with zoomed-in confocal view of layers, demarcated by white lines. (B) Left: Projection density of anterior thalamus (ADAV; green; n = 5), claustrum (CLA; red; n = 6), anterior cingulate (ACC: magenta; n = 4), and dorsal subiculum (DS; yellow; n = 4; mean ± SEM shaded for all) axons and terminal arbors in RSG. Note distinct sublaminar distribution of axons from ADAV, ACC, and CLA in layer 1. Right: Projection density of LR (purple; n = 10) and RS (blue; n = 5; mean ± SEM shaded for all) neurons. Note the distinct difference between LR and RS dendrite lamination across the layers. (C) Correlation matrix of means for all axon-axon, axon-dendrite, and dendrite-dendrite comparisons. Note that LR dendrites are significantly positively correlated with ADAV and DS axons but negatively correlated with CLA and ACC axons, while RS dendrites are significantly positively correlated with CLA and ACC axons but negatively correlated with ADAV and DS axons. (D) Summary schematic showing selective control of LR neurons by inputs from ADAV and DS, including head direction signals. In contrast, RS neurons are preferentially controlled by inputs from the CLA and ACC. This precise organization of principal cell dendrites and afferent axons forms two parallel circuits in superficial RSG.
Figure 6—figure supplement 1
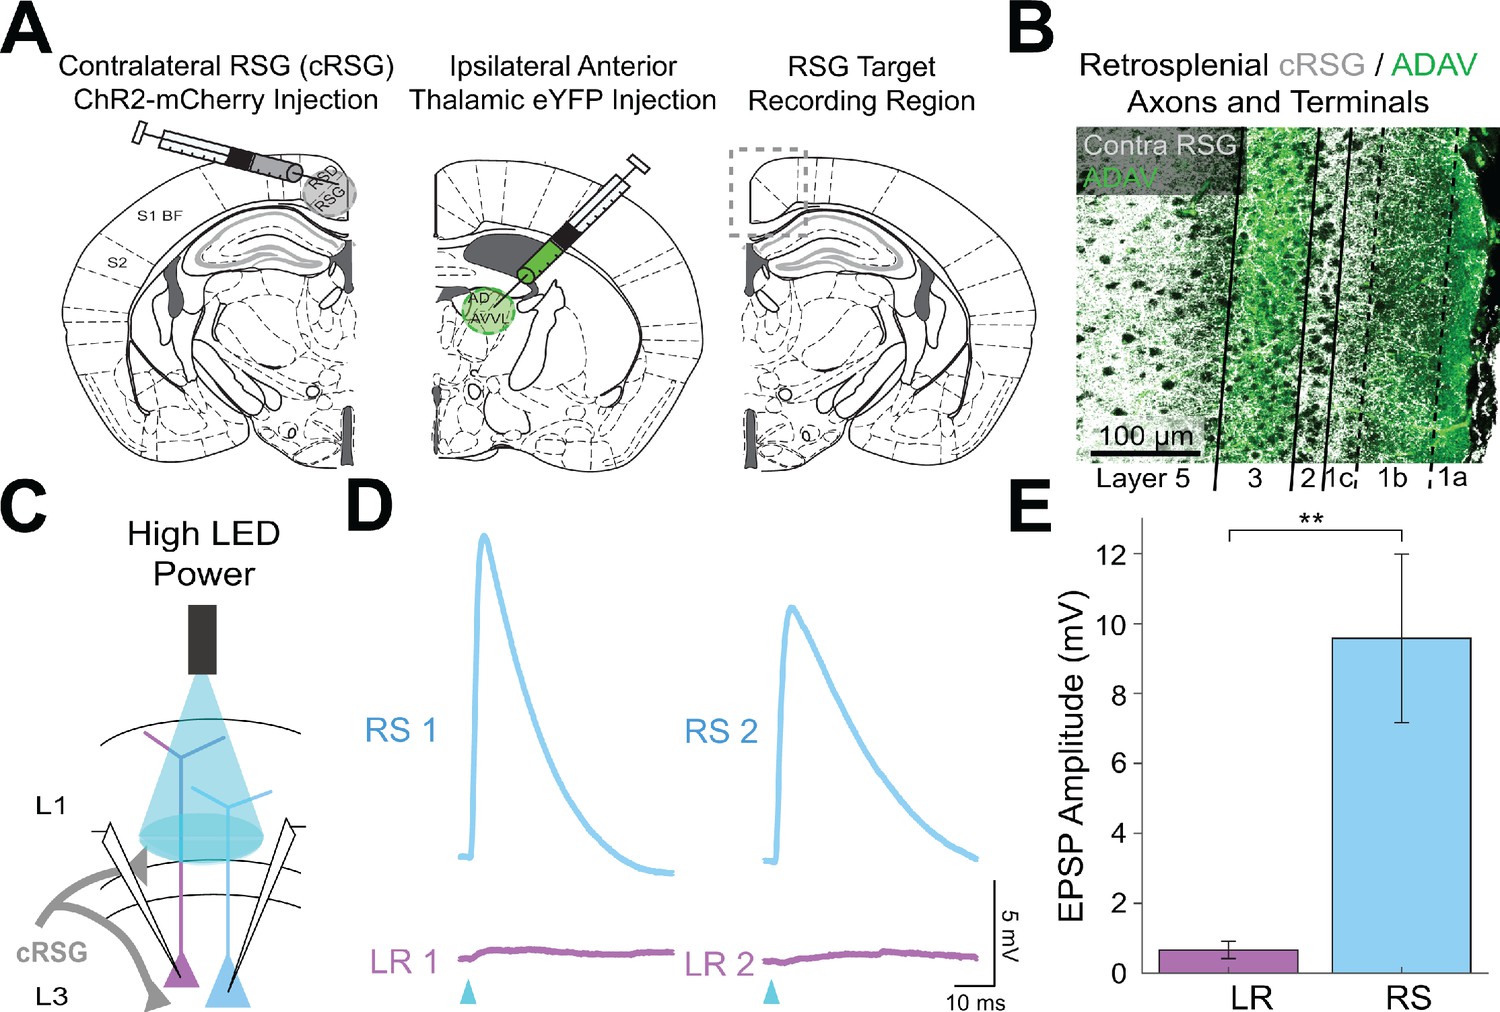
Contralateral RSG projections drive RS, but not LR, neurons.
(A) Left: Schematic of contralateral RSG (cRSG) ChR2-mCherry injection (opposite hemisphere compared to recordings). MCherry is pseudo colored as gray. Middle: Schematic of ipsilateral ADAV eYFP injection (same hemisphere as recordings). Right: Schematic of target recording region in RSG. (B) Confocal image of dual-injection expression with cRSG axons and terminal arbors in gray and ADAV axons and terminal arbors in green. Layers are demarcated by black lines. Note the precise targeting of L1c, L2, and L5 by cRSG axons and terminal arbors (gray) in contrast to the L1a and L3 targeting of anterior thalamic arbors (green). (C) Schematic showing cRSG inputs to patched LR and RS neurons being stimulated at L1/2 boundary. (D) Example traces of two sequential pairs of RS (blue) and LR (purple) neuron responses to the high power LED pulse. (E) Significantly larger EPSP amplitudes in RS (n = 5) cells compared to LR (n = 7) cells (p=0.0051; Wilcoxon rank sum test). Error bars are SEM.
Figure 6—figure supplement 2
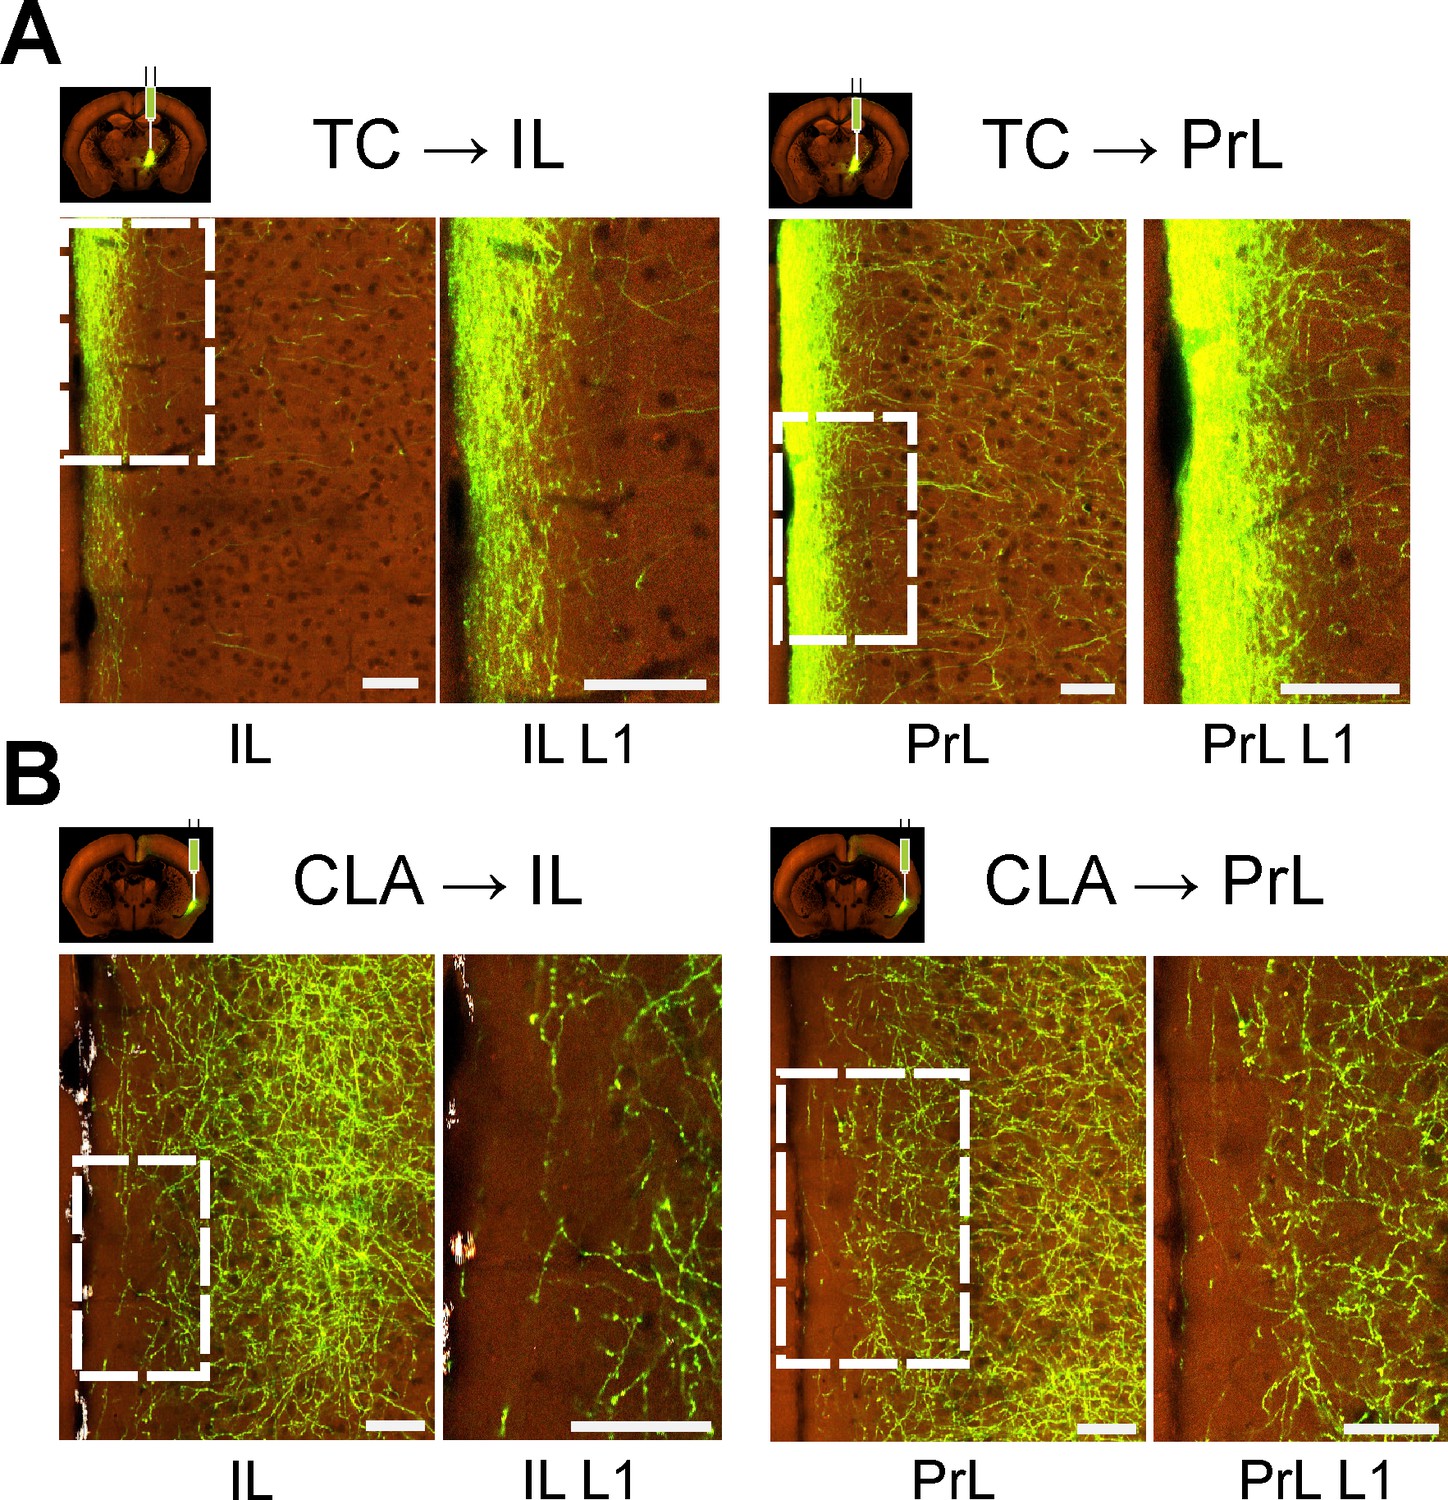
Sublaminar differences in thalamic vs claustral projections to medial prefrontal cortex.
Each panel shows overview of expression in a cortical area (left) and its layer 1 only (right). Images of axonal projection patterns were obtained from the Allen Mouse Brain Connectivity Atlas (https://connectivity.brain-map.org; Oh et al., 2014). The following images, as numbered in high resolution image viewer, were used: for TC, ventromedial nucleus (VM; experiment #127797441), image #69 for injection and #36 for PrL/IL; for CLA (experiment #485903475), image #56 for injection and #31 for PrL/IL. Abbreviations: PrL - prelimbic cortex and IL - infralimbic cortex. Scale bar is 70 μm. (A) Axonal projection expression in infralimbic and prelimbic cortices from anterograde injection into ventromedial thalamus. Projections show strong preference for superficial parts of layer 1. (B) Axonal projection expression in infralimbic and prelimbic cortices from anterograde injection into claustrum. Higher density of projections can be observed at deep layer 1, while very few axons reach superficial-most parts.
Figure 7 with 1 supplement
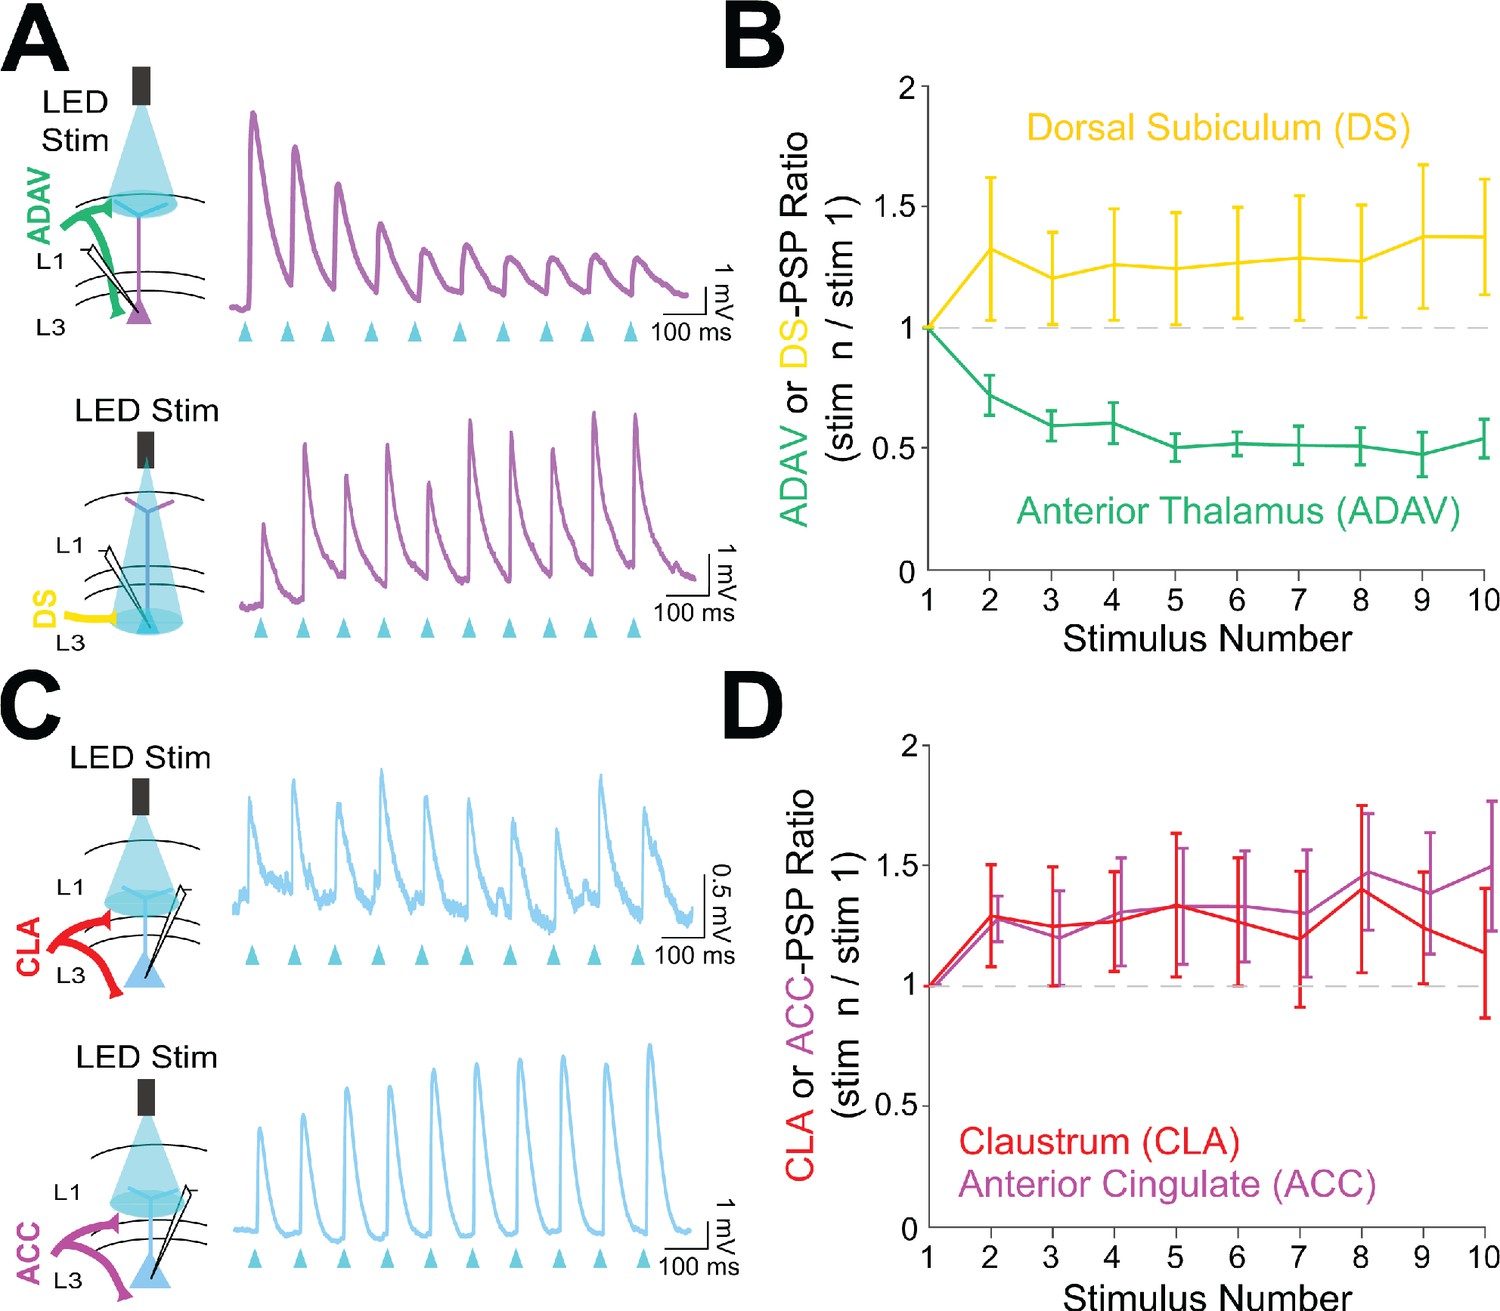
Anterior thalamic inputs to LR neurons evoke robust synaptic depression.
(A) Top: Schematic showing anterior thalamic (ADAV) inputs to an LR neuron being optically stimulated at L1a (left). Example trace from a representative LR cell in response to 10 Hz ADAV stimulation shows clear synaptic depression (purple). Blue triangles represent light pulses (right). Bottom: As above, but now for dorsal subicular (DS) input to an LR cell showing that LR responses to DS synaptic inputs are weakly facilitating. (B) Group synaptic dynamics for LR neurons in response to ADAV (green; n = 9) and DS (yellow; n = 9) inputs. ADAV synapses are strongly depressing, while DS synapses are weakly facilitating. (C) Top: Schematic showing claustral (CLA) inputs to an RS neuron being optically stimulated at L1/2 (left). Example trace from a representative RS cell in response to 10 Hz CLA stimulation shows weak synaptic facilitation (blue). Blue triangles represent light pulses (right). Bottom: As above, but now for anterior cingulate (ACC) input to an RS cell showing that RS responses to ACC synaptic inputs are weakly facilitating. (D) Group synaptic dynamics for RS neurons in response to CLA (red; n = 8) and ACC (magenta; n = 7) inputs. Both CLA and ACC synapses are weakly facilitating. See Figure 7—source data 1 for source data.
-
Figure 7—source data 1
Short-term dynamics of postsynaptic responses.
- https://cdn.elifesciences.org/articles/62207/elife-62207-fig7-data1-v1.xlsx
Figure 7—figure supplement 1
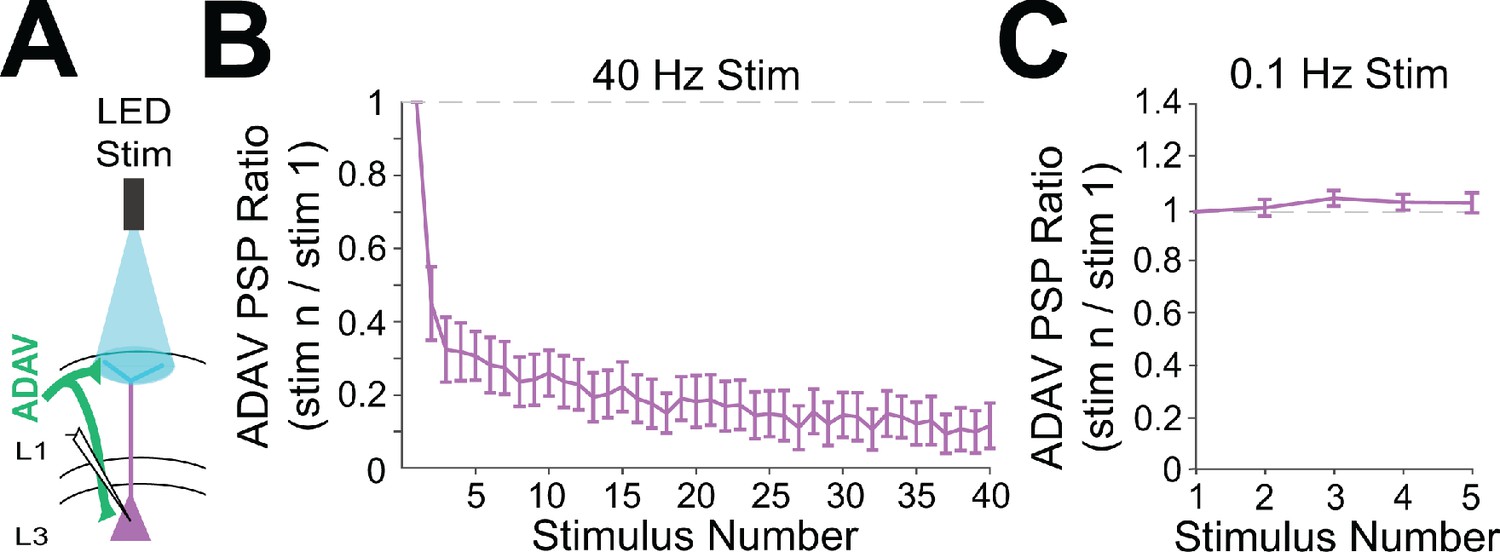
Anterior thalamic inputs to LR neurons are strongly depressing at higher frequencies.
(A) Schematic showing anterior thalamic (ADAV) inputs to a patched LR neuron. Thalamic axons and terminal arbors are being stimulated by the LED at L1a. (B) Group synaptic dynamics for LR neurons (n = 8) in response to 40 Hz ADAV inputs show synaptic depression. (C) Group synaptic dynamics for LR neurons (n = 9) in response to 0.1 Hz ADAV inputs do not show synaptic depression.
Figure 8 with 2 supplements
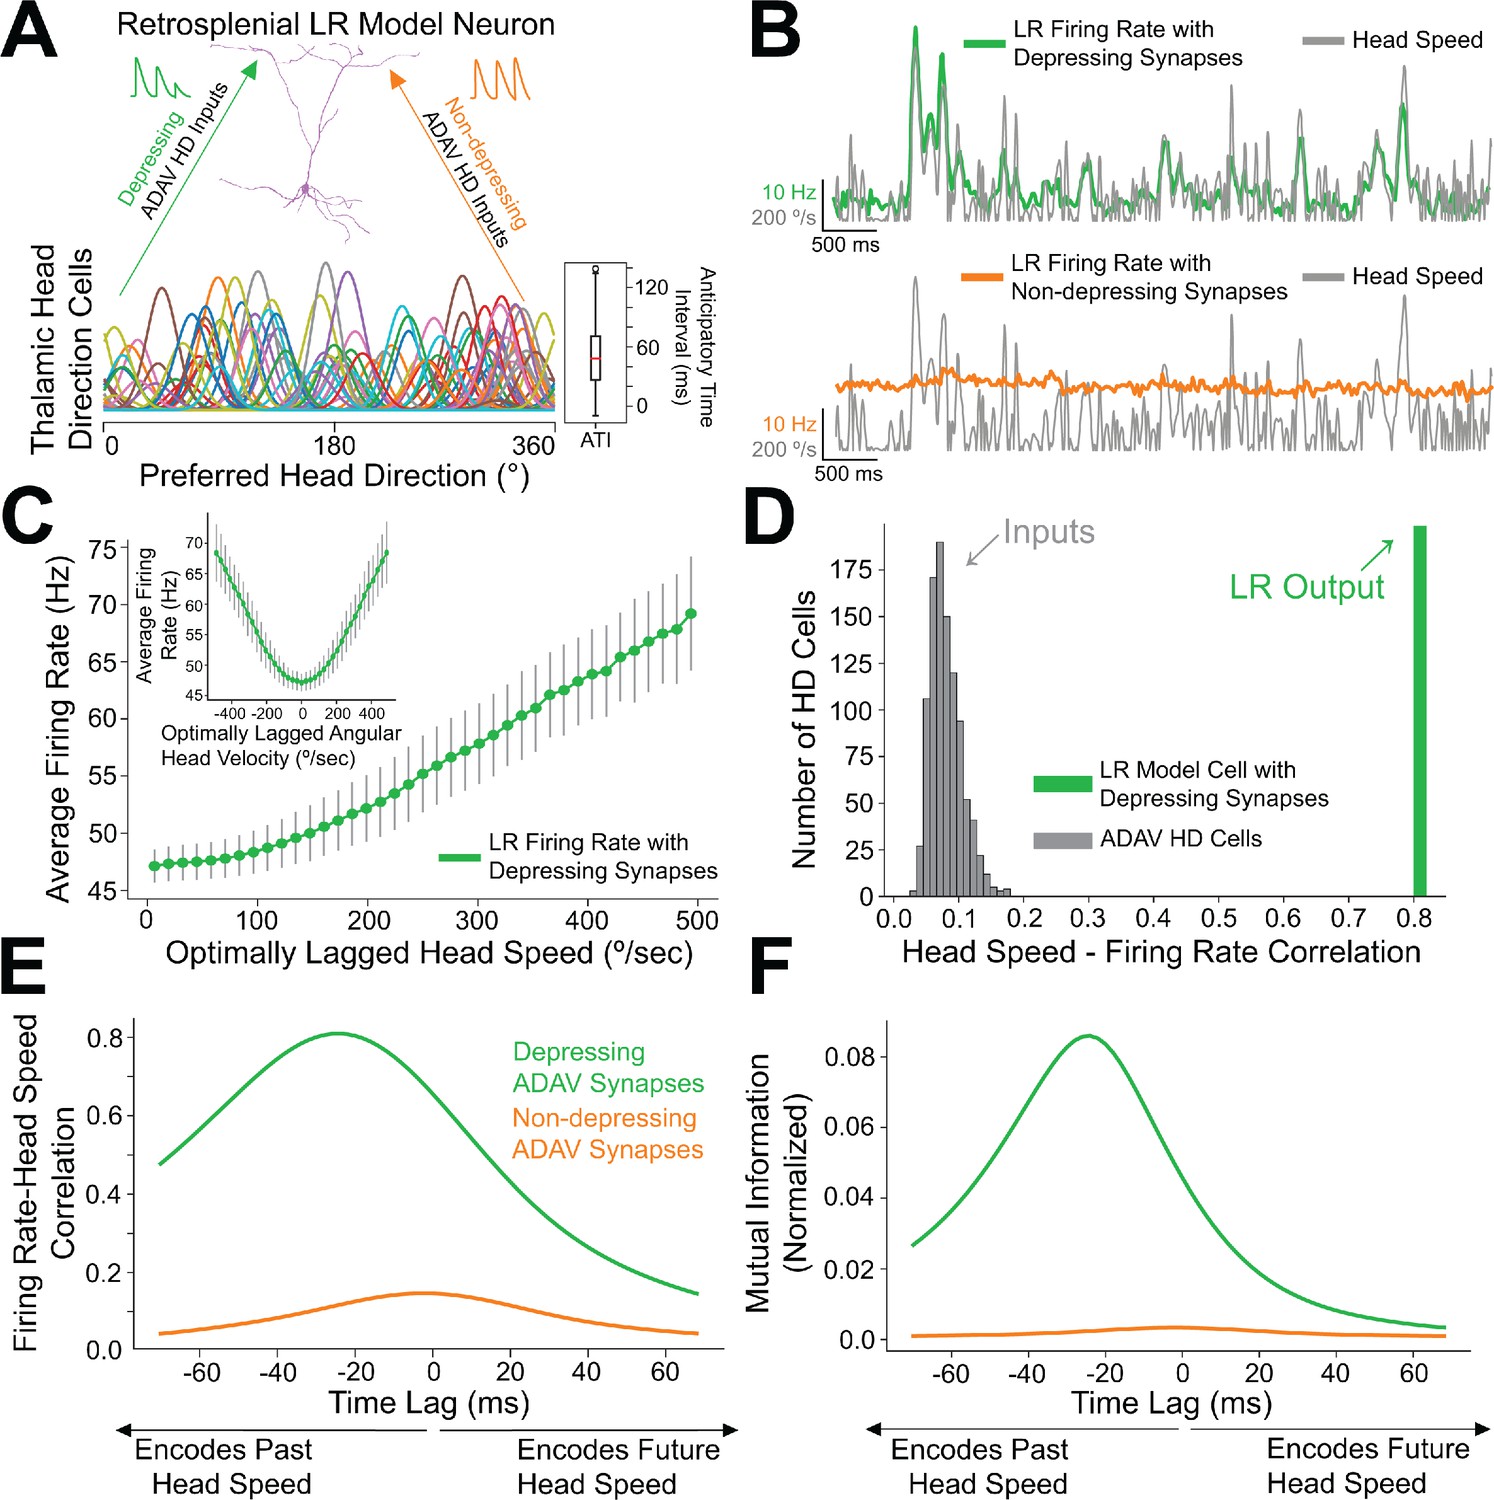
Depressing thalamocortical synapses allow LR cells to compute head speed from directional inputs.
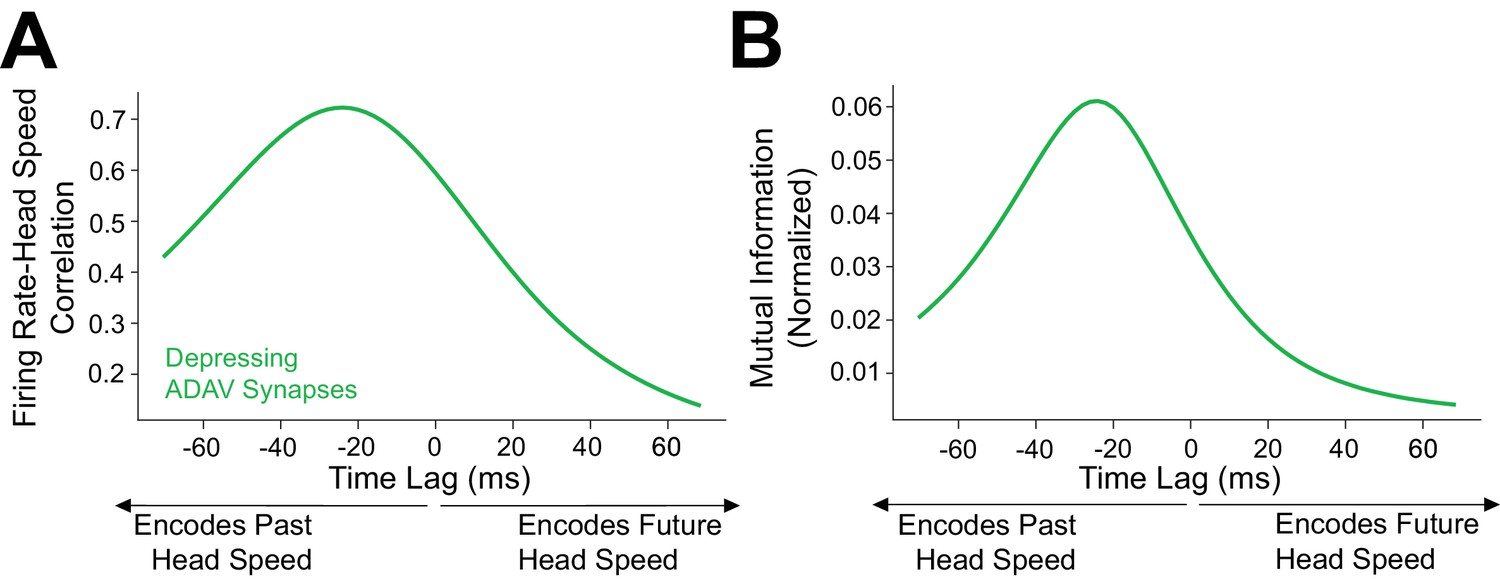
(A) We modeled a heterogeneous population of HD cells providing input to a single LR neuron via either depressing (green) or non-depressing (orange) synapses. Presynaptic HD cells varied in their tuning width, maximum firing rate, background firing rate, and anticipatory time interval (ATI). Tuning curves of a randomly selected subset of 100 (out of 7500) HD cells in the simulated ensemble are depicted here. Boxplot on the right depicts the empirical distribution of ATIs of all HD cells in the presynaptic population, with the mean ATI chosen as 50 ms in accordance with Taube, 2010. (B) Sample traces spanning ten seconds of simulation time. Green: firing rate of postsynaptic LR cell receiving HD input via depressing synapses; Orange: firing rate of postsynaptic LR cell receiving HD input via non-depressing synapses; Gray: head turning speed. Note that for the non-depressing inputs, the firing rate of the LR cell remains approximately constant throughout. In contrast, depressing synapses produce a firing rate whose fluctuations visibly reflect fluctuations in the angular head speed. (C) Firing rate of postsynaptic LR cell plotted against head speed 24 ms in the past shows a clear monotonic relationship. A similar relationship exists between firing rate and current angular head speed (see panels E, F). The inset shows firing rate as a function of angular head velocity. The error bars indicate the standard deviation of all firing rates in each AHV bin; note that these variabilities are low, emphasizing the consistency and reliability of this code. (D) The gray histogram depicts the correlations between input HD cell firing rate and angular head speed during active (>10 Hz firing) windows. Since presynaptic firing rate was only explicitly modulated by head direction and not head speed, these values are low, with a mean value of 0.08. The green bar depicts correlation between postsynaptic firing rate and head speed at the optimal time lag (24 ms, see panels E, F). Hence, LR cells can utilize depressing inputs from HD cells to compute de novo head speed. (E) Cross-correlation between LR cell firing rate and head speed. We computed the Pearson correlation between the firing rate of the postsynaptic LR cell and the head speed L ms in the future for varying values of L, ranging from −70 to 70 ms. Postsynaptic firing rate was maximally correlated with head speed 24 ms in the past. (F) Same as E but for cross-mutual information. Cross-mutual information identifies the same optimal lag as cross-correlation.
Figure 8—figure supplement 1
Angular head speed coding by LR cells is robust regardless of presynaptic thalamic head direction cell count.
Speed tuning of postsynaptic LR cells is robust to the number of inputs they receive from thalamic HD cells. In these plots, we depict the mean correlation (A) and MI values (B) of LR firing rate and head speed from simulations using only 2500 presynaptic HD inputs.
Figure 8—figure supplement 2
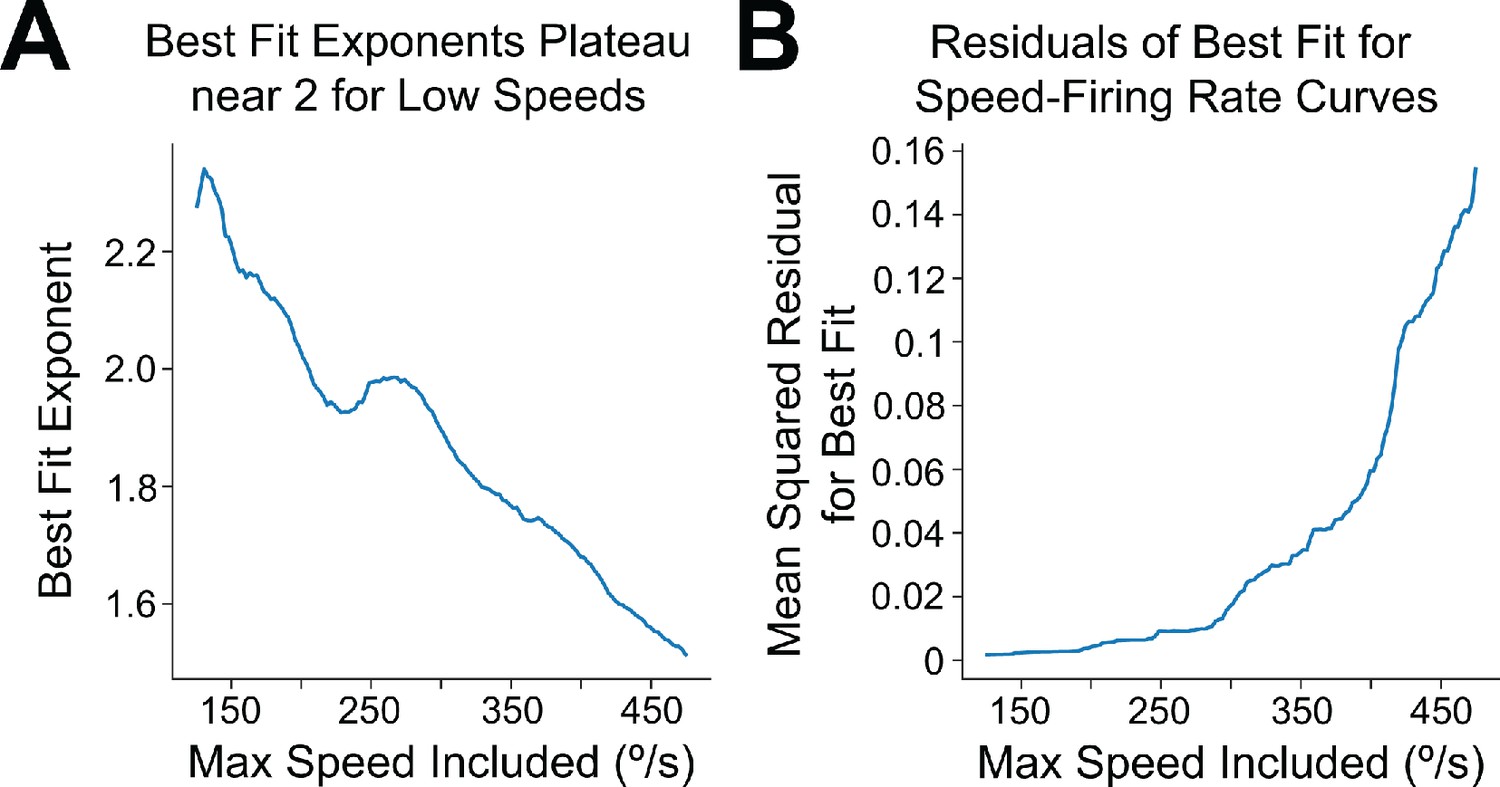
LR firing rate exhibits approximately quadratic scaling for low speeds.
(A) Using data from the spiking simulations, we binned the speed-postsynaptic firing rate curve at high resolution (2.5°/bin) and computed, for varying values of y, the best-fit power law exponent when considering only data points corresponding to speeds less than or equal to y deg/s. For values of y less than 300 deg/s, we find exponents in the range 1.8–2.2, approximately matching the analytical prediction of quadratic scaling at low speeds for Gaussian tuning curves. (B) Same as A but mean squared residuals of the best-fit power law for each value of y. Smallest residuals are obtained with the approximately quadratic fits for y less than 300 deg/s. The fits become increasingly poor when including higher speeds, suggesting that at high speeds the scaling exponent changes; this is apparent visually in Figure 8C and expected from our analysis.
Figure 9 with 1 supplement
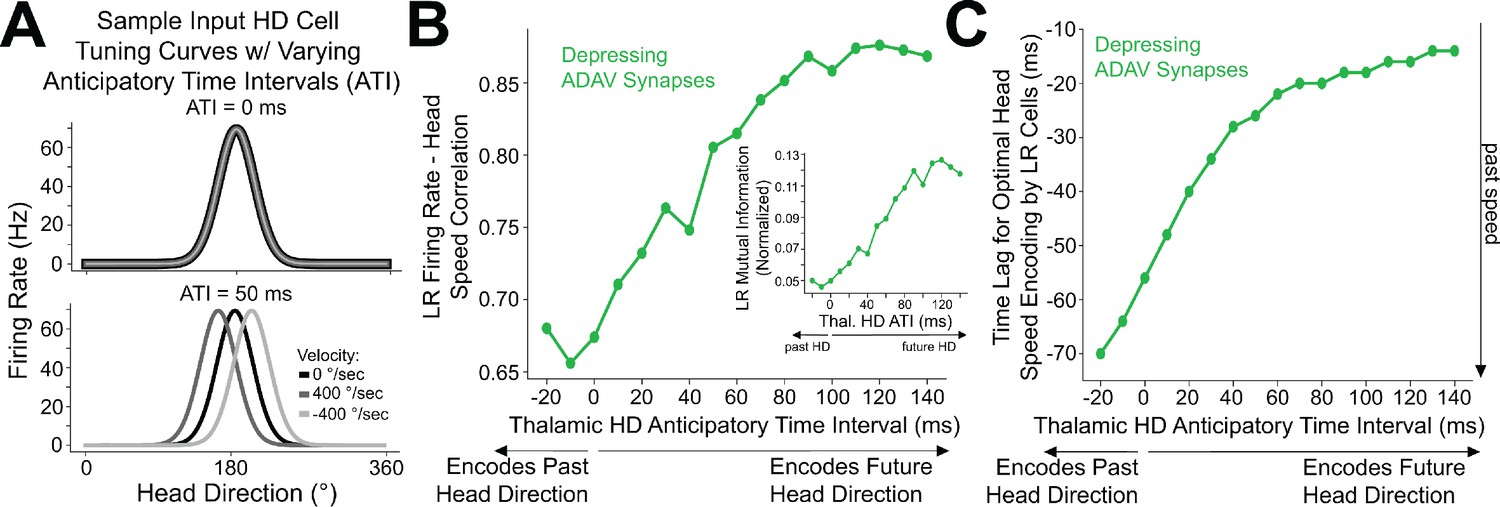
Encoding of future head direction in thalamus helps to better encode present head speed in retrosplenial LR cells.
(A) The schematic depicts tuning curves for an HD cell with a preferred direction of 180 degrees. Top: the tuning curves of this cell if it displayed no anticipatory firing (ATI = 0 ms). Note that clockwise and counterclockwise turns produce identical tuning curves in this case. Bottom: the tuning curves of this cell if it had an ATI = 50 ms. Note that now, during head turns in either direction, the cell will fire 50 ms prior to when the animal faces 180 degrees. Our convention takes positive angular head velocity to denote counterclockwise turning. (B) Anticipatory firing of presynaptic HD cells improves speed coding in the postsynaptic LR cell. To quantify strength of speed coding independent of latency between head speed and postsynaptic firing rate, we used the maximum correlation between head speed and postsynaptic firing rate across all time lags. Inset shows a similar relationship, now for the maximum of cross-mutual information. (C) Anticipatory firing of presynaptic HD cells improves the latency between current head speed and postsynaptic firing rate, enabling more temporally precise speed coding.
Figure 9—figure supplement 1
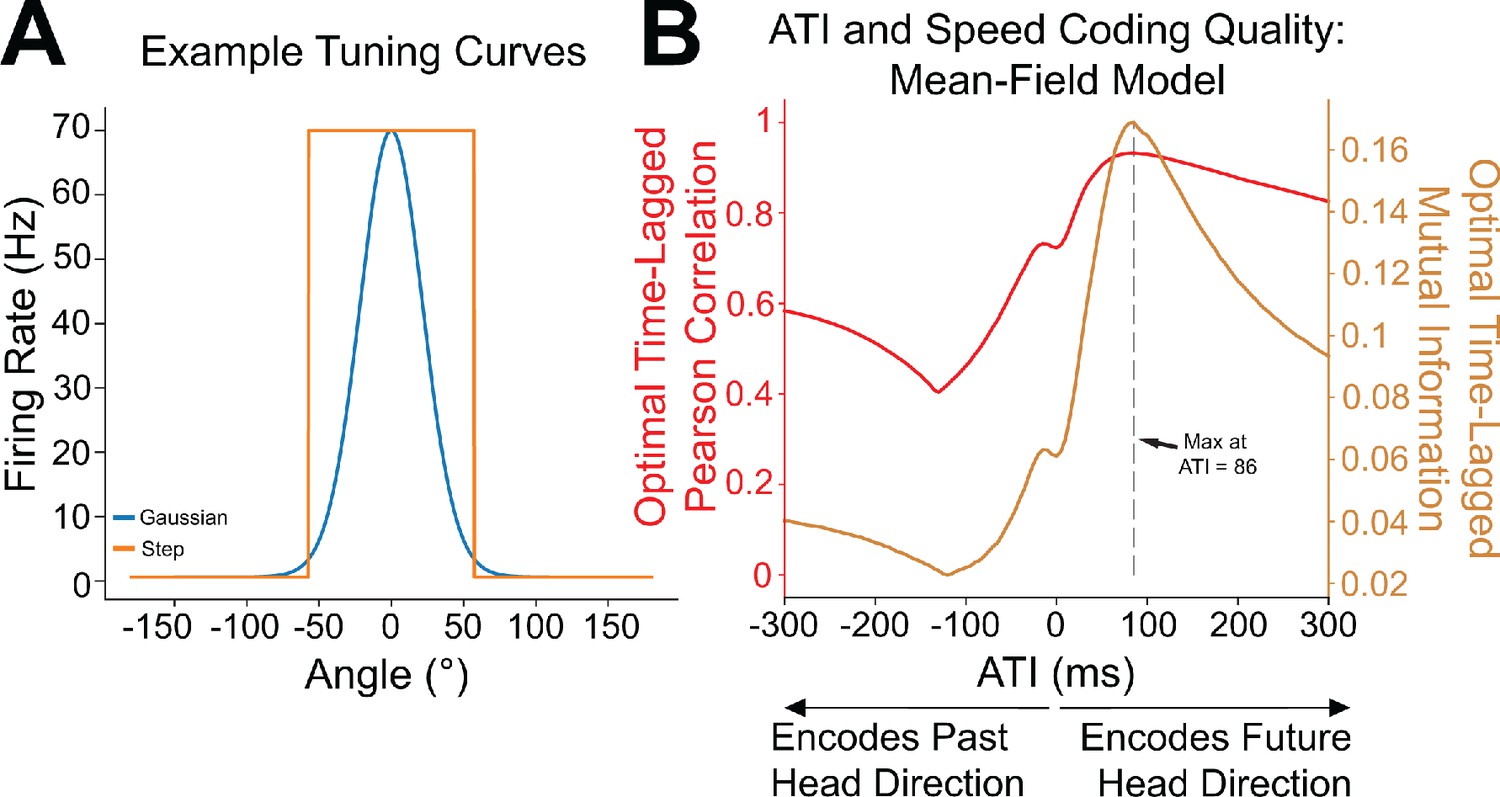
Analytical calculations independently confirm the improvement of head speed coding with anticipatory firing of head direction inputs.
(A) Simulations utilized the continuously varying Gaussian tuning curves, but our mean-field analysis employed the more analytically tractable, but discontinuous, step-function tuning curves. (B) The mean-field model replicates the behavior observed in the spiking simulations, including improvement of postsynaptic speed coding with the introduction of anticipatory firing. Moreover, analytical calculations enabled us to compute the optimal value of anticipatory time interval (ATI) for this parameter set, which came out to 86 ms; the dotted gray line shows that mean-field simulation results indeed agree with the calculation.
Figure 10
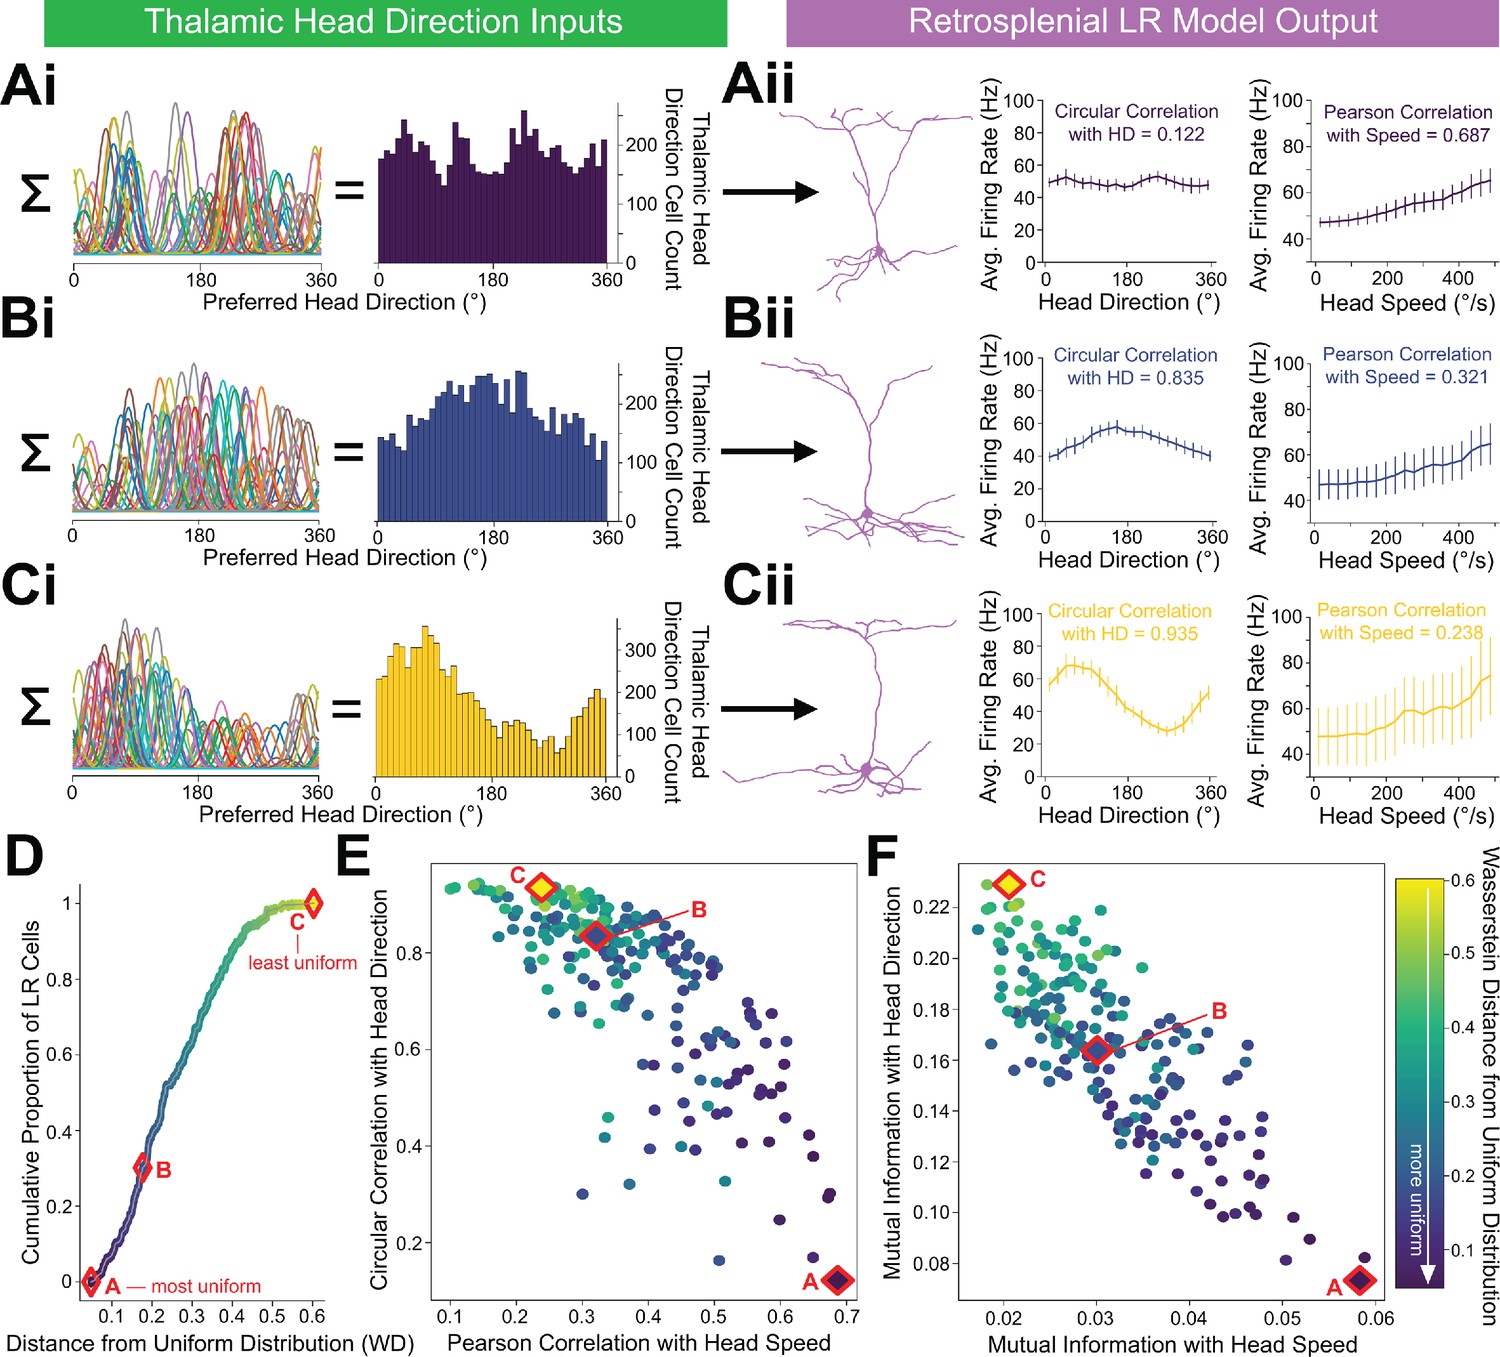
LR cells can conjunctively encode both head direction and speed, with a tradeoff.
(A, B, C) (i) Sample presynaptic preferred HD distributions for three simulated LR cells with distinct heterogeneity among their inputs. A is most uniform, and C is least uniform. Left: schematic depiction of the tuning curves of HD cells synapsing onto the LR cell. Right: calculated histogram of preferred directions of all HD cells synapsing onto the given LR cell. (ii) Response properties of the three LR cells whose preferred direction distributions are depicted in Ai,Bi,Ci. As the preferred direction distribution becomes less uniform (from A to C), directional encoding improves (left graph) while speed coding becomes less precise (right graph). (D) For each simulated LR cell, we quantified the heterogeneity of its input HD distribution using the standard metric for this measure (Wasserstein distance from a uniform distribution; WD). Plot shows the cumulative distribution of WD values over the entire simulated LR population. Markers A,B,C correspond to the three example LR cells shown above. (E) Scatterplot showing each LR cell’s correlation with angular head speed versus its correlation with head direction. Both individually and as a population, LR cells can show conjunctive encoding of head direction and speed, with a clear tradeoff between the two. The color-coded WD is also shown for each cell. (F) Same as E but for mutual information.
Tables
Key resources table
| Reagent type (species) or resource | Designation | Source or reference | Identifiers | Additional information |
|---|---|---|---|---|
| Strain background (Mus musculus) | PvalbCre (PV-IRES-Cre) | Jackson Laboratories | Stock# 008069 RRID:IMSR_JAX:008069 | |
| Strain background (Mus musculus) | Camk2αCre | Jackson Laboratories | Stock# 005359 RRID:IMSR_JAX:005359 | |
| Strain background (Mus musculus) | PvalbCre (PV-IRES-Cre) x Ai14 | Jackson Laboratories | Stock# 008069 Stock# 005359 | Mouselines originally from Jackson Laboratories; in-house cross |
| Strain background (Mus musculus) | Tg(GrpCre)KH288Gsat | Jackson Laboratories | MGI:4367023 RRID:MMRRC_037585-UCD | |
| Strain background (Mus musculus) | PvalbCre (PV-IRES-Cre) x Ai32 | Jackson Laboratories | Stock# 008069 Stock# 024109 | In-house cross |
| Strain background (Mus musculus) | Ai32 | Jackson Laboratories | Stock# 024109 RRID:IMSR_JAX:024109 | |
| Strain background (Mus musculus) | Ai14 | Jackson Laboratories | Stock# 007914 RRID:IMSR_JAX:007914 | |
| Peptide, recombinant protein | NeuroTrace 45/455 | Thermo Fisher Scientific | Cat#N21479 | 1:200 |
| Peptide, recombinant protein | Streptavidin, Alexa Fluor 488 Conjugate | Thermo Fisher Scientific | Cat#S11223 | 1:250 |
| Peptide, recombinant protein | Streptavidin, Alexa Fluor 594 Conjugate | Thermo Fisher Scientific | Cat#S11227 | 1:250 |
| Peptide, recombinant protein | Streptavidin, Alexa Fluor 647 Conjugate | Thermo Fisher Scientific | Cat#S21374 | 1:250 |
| Chemical compound, drug | Picrotoxin | Sigma | CAS # 124-87-8, P1675-1Q | 50 µL solution made in house daily from powder |
| Chemical compound, drug | Tetrodotoxin citrate | Alomone Labs | CAS # 18660-81-6 | 1 µL solution made in house daily |
| Chemical compound, drug | 4-Aminopyridine | Alomone Labs | CAS # 504-24-5 | 100 µL solution made in house daily |
| Antibody | Anti-GFP (Chicken polyclonal) | Abcam | ab13970 RRID:AB_300798 | 1:2000 |
| Antibody | Anti-mCherry (Rabbit polyclonal) | Abcam | ab167453 RRID:AB_2571870 | 1:2000 |
| Antibody | Anti-Chicken (Donkey polyclonal), biotin conjugated | Jackson Immuno Research | RRID:AB_2313596 | 1:300 |
| Antibody | Anti-Rabbit (Donkey polyclonal), biotin conjugated | Jackson Immuno Research | RRID:AB_2340593 | 1:300 |
| Software, algorithm | Python 3.7.6 | Python | RRID:SCR_008394 | https://www.python.org/ |
| Software, algorithm | MATLAB R2020a | MATLAB | RRID:SCR_001622 |
Additional files
-
Supplementary file 1
Supplemental Tables.
contains Table 1, Table 2, and Table 3. Table 1 presents mean ± SEM values of intrinsic properties of LR, L3 RS, and L5 RS cells. Table 2 presents the exact p-values evaluating differences between the three cell types for each intrinsic property examined. Source data files for these intrinsic properties are found in Figure 1—source data 1. Table 3 presents exact parameter distributions used for the model (see ‘Modeling the Presynaptic HD Population’).
- https://cdn.elifesciences.org/articles/62207/elife-62207-supp1-v1.docx
-
Transparent reporting form
- https://cdn.elifesciences.org/articles/62207/elife-62207-transrepform-v1.pdf
Download links
A two-part list of links to download the article, or parts of the article, in various formats.
Downloads (link to download the article as PDF)
Open citations (links to open the citations from this article in various online reference manager services)
Cite this article (links to download the citations from this article in formats compatible with various reference manager tools)
Thalamus and claustrum control parallel layer 1 circuits in retrosplenial cortex
eLife 10:e62207.
https://doi.org/10.7554/eLife.62207


