Proteomic analysis of young and old mouse hematopoietic stem cells and their progenitors reveals post-transcriptional regulation in stem cells
- Institute for Stem Cell Biology and Regenerative Medicine, Stanford University School of Medicine, United States
- Ludwig Center for Cancer Stem Cell Research and Medicine, Stanford University School of Medicine, United States
- Baxter Laboratory, Department of Microbiology and Immunology and Department of Pathology, Stanford University School of Medicine, United States
- Department of Chemistry, Stanford University, United States
- Department of Developmental Biology and the Stanford UC-Berkeley Stem Cell Institute, United States
- Department of Pathology, Stanford University School of Medicine, United States
Figures
Figure 1 with 6 supplements
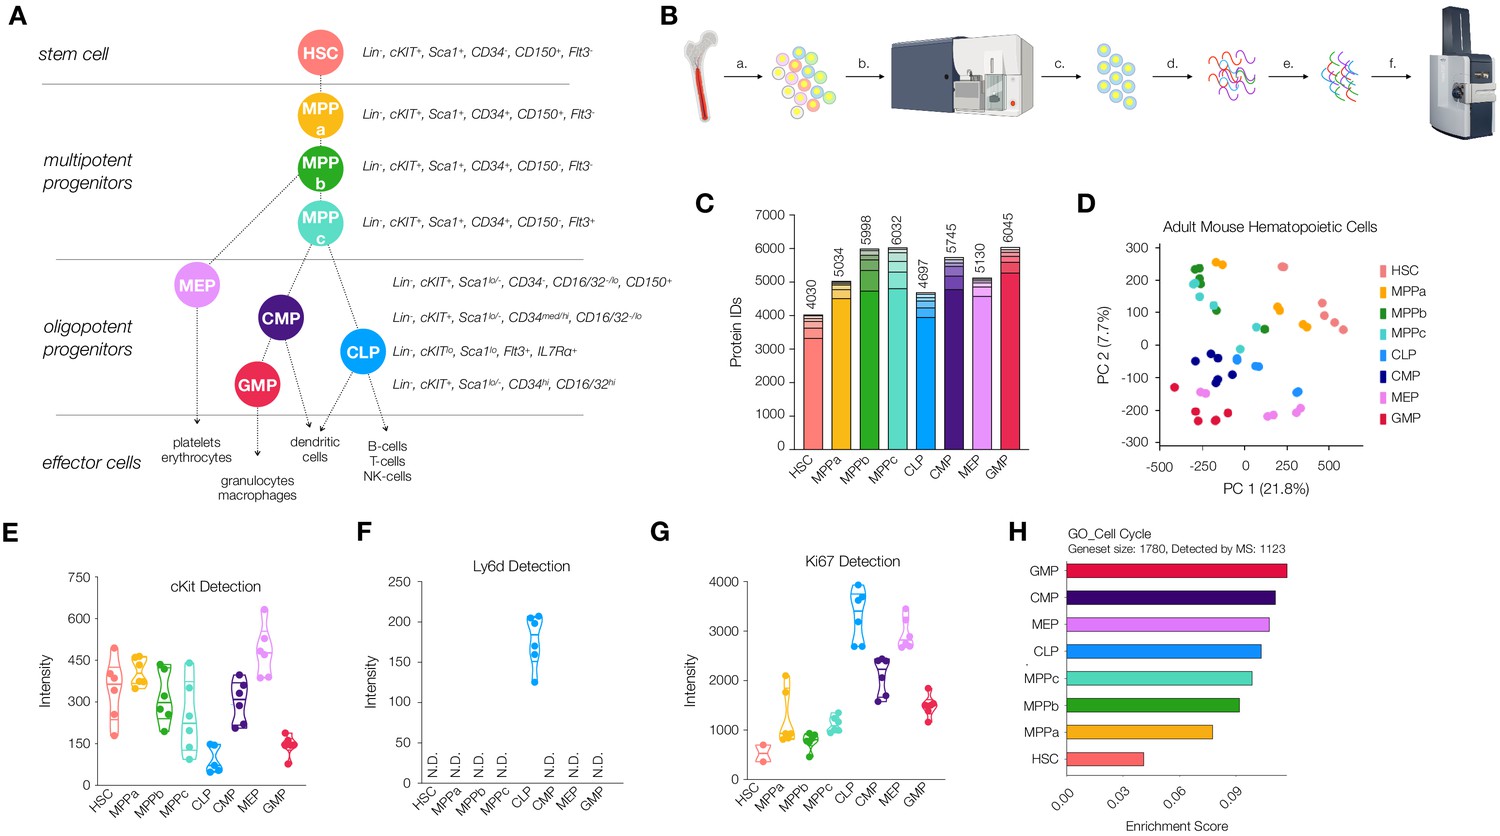
Workflow and validation of proteomics in various hematopoietic stem and progenitor cells.
(A) Hierarchy of hematopoietic differentiation. Hematopoietic stem cells (HSCs) give rise to multipotent progenitors (MPPs). Fate commitment arises in the oligopotent progenitor (OPP) compartment: megakaryocyte/erythrocyte progenitors (MEPs), common myeloid progenitors (CMPs), common lymphoid progenitors (CLPs) and granulocyte/macrophage progenitors (GMPs). (B) Proteomic sample preparation workflow: (a) Bone marrow cells are isolated as single-cell suspensions, (b) stained with a panel of antibodies, (c) sorted by FACS, and (d) lysed. After normalizing protein amounts, (e) the lysate is digested and desalted, and (f) peptides are subjected to mass spectrometry analysis. (C) The number of proteins identified in each cell type (N = 6). Each segment represents new proteins discovered as a result of each additional replicate. (D) Principal component analysis of all replicates of all cell types. (E) Normalized cKit protein intensity. (F) Normalized Ly6d protein intensity. (G) Normalized Ki67 protein intensity. (H) Single sample gene set enrichment analysis (ssGSEA) for GO cell-cycle-associated genes. P-adj = 0.00002. Enrichment scores were averaged across replicates for each cell type. FDR = 0.05. All violin plots show only non-zero intensity values. N.D. = not detected in any replicate.
Figure 1—figure supplement 1
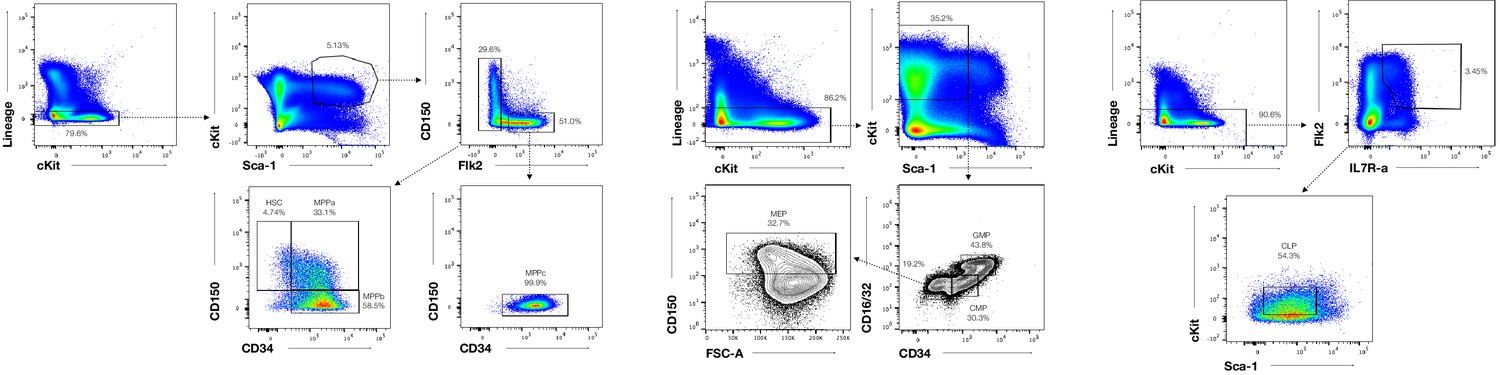
Representative sorting scheme for HSCs and MPPs.
HSC (Lin-, cKIT+, Sca1+, CD34-, CD150+, Flt3-) MPPa (Lin-, cKIT+, Sca1+, CD34+, CD150+, Flt3-) MPPb (Lin-, cKIT+, Sca1+, CD34+, CD150-, Flt3-) MPPc (Lin-, cKIT+, Sca1+, CD34+, CD150-, Flt3-). Representative sorting scheme for GMPs (Lin-, cKIT+, Sca1lo/-, CD34hi, CD16/32hi), CMPs (Lin-, cKIT+, Sca1lo/-, CD34med/hi, CD16/32-/lo) and MEPs (Lin-, cKIT+, Sca1lo/-, CD34-, CD16/32-/lo, CD150+). Representative sorting scheme for CLPs (Lin-, CD34med/hi, Flt3+, IL7Rα+, cKITlo, Sca1lo).
Figure 1—figure supplement 2

Panther Protein Class analysis of data compiled for each cell type.
Figure 1—figure supplement 3

Protein intensity ratios of the housekeeping protein Hprt1 in stem and progenitor cells.
Violin plots show intensity ratios of abundance from replicates per cell type where protein was detected by mass spectrometry (MS). Replicates for each cell type are only shown if detected. N.D. - not detected in any replicate.
Figure 1—figure supplement 4

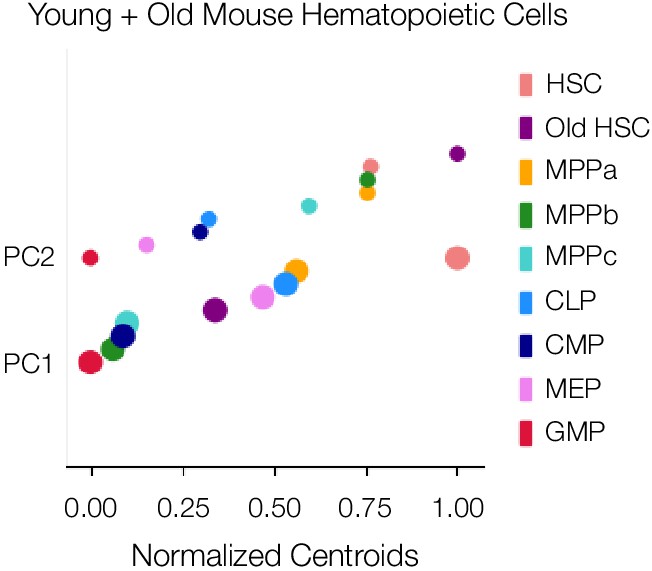
One-dimensional PCA plots show which components are key drivers of segmentation between cell types and cell compartments.
Centroids are normalized representatives of all six replicates and are scaled in size with respect to number of proteins associated with each component.
Figure 1—figure supplement 5

Relative detection of proteins used for FACS purification of cell types by flow cytometry (dark gray) and MS (light gray).
Error bars represent standard error to the mean. For MS, replicates for each cell type are only shown if detected. N.D. - not detected in any replicate.
Figure 1—figure supplement 6
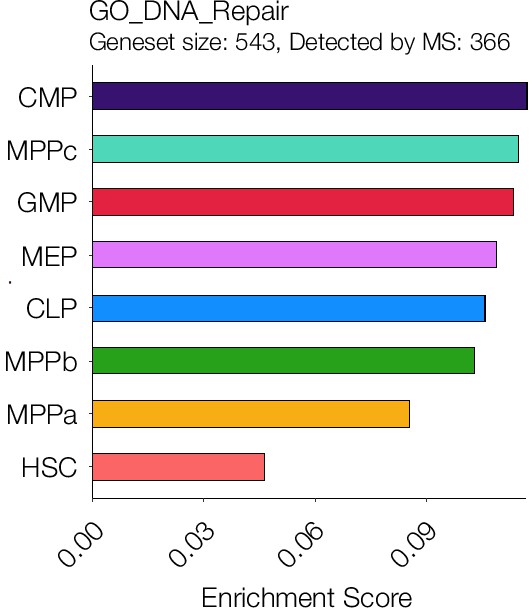
Single sample gene set enrichment analysis for GO DNA Repair.
P-adj. = 0.00015.
Figure 2 with 4 supplements
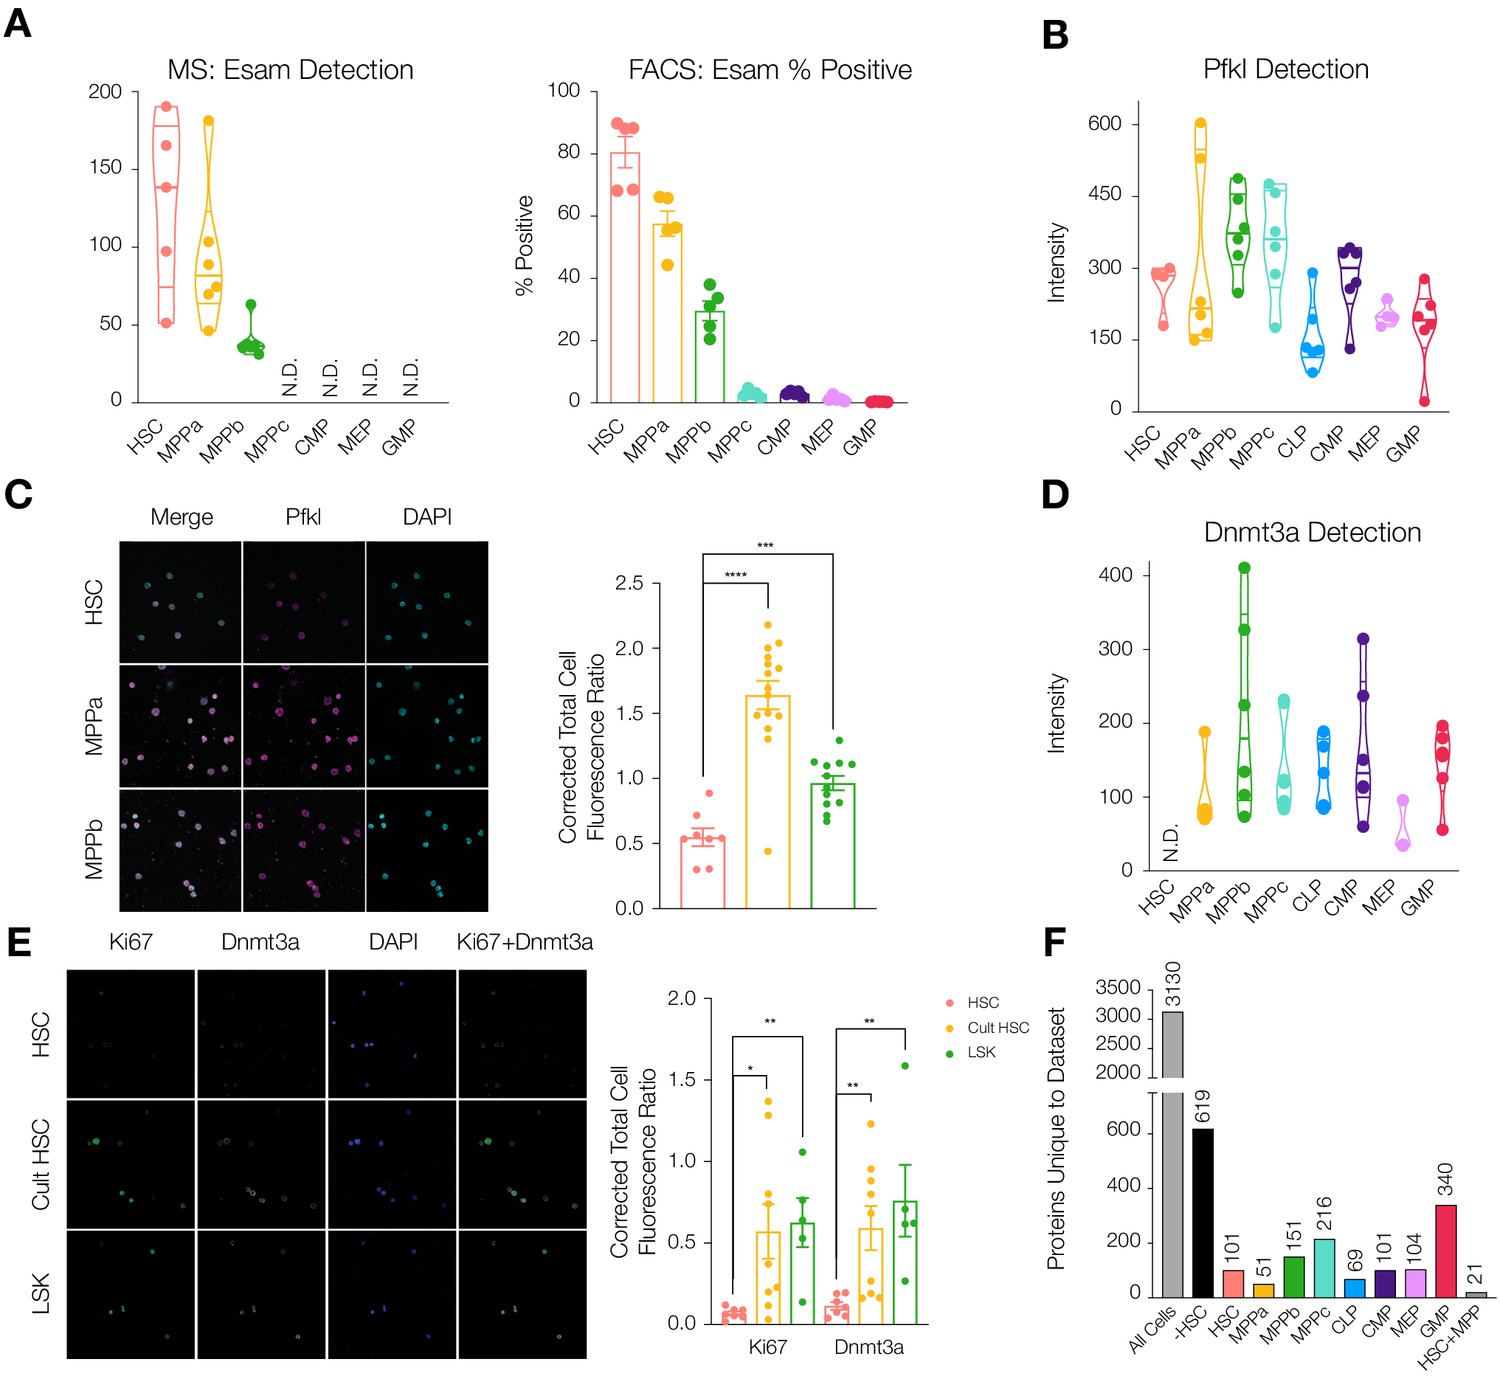
Differential protein levels throughout early hematopoiesis.
(A) Normalized Esam protein intensity (left) and % Esam+ cells as determined by flow cytometry analysis (right). N = 5 mice (three male, two female). (B) Normalized Pfkl protein intensity values. (C) Fluorescence microscopy of HSC, MPPa and MPPb stained with anti-Pfkl (left) and Corrected Total Cell Fluorescence (CTCF) ratio of Pfkl/DAPI (right). N = 5 mice (three male, two female). P-values: ***=0.0002, ****<0.0001. (D) Normalized Dnmt3a protein intensity values. (E). Fluorescence microscopy of fresh HSCs (HSC), cultured HSCs (Cult HSC) and stem and progenitor cells Lin-, Sca1+, cKit+ (LSK) stained with anti-Ki67 and anti-Dnmt3a (left) and CTCF ratio of Ki67/DAPI and Dnmt3a/DAPI (right). N = 5 mice (three male, two female). P-values: Ki67: *=0.0202, **=0.0013 Dnmt3a: HSC vs Cult HSC **=0.0080, HSC vs LSK **=0.0057. F. Number of proteins uniquely detected in each subset of cell type(s). –HSC: proteins detected in all cell types except HSCs. HSC+MPP: proteins detected in HSCs and MPPs. All violin plots show only non-zero intensity values. N.D. = not detected in any replicate. Fluorescence was quantified using ImageJ.
Figure 2—figure supplement 1

FMOs and gating strategy for ESAM staining.
N = 5 mice.
Figure 2—figure supplement 2

Enrichment ratios between HSCs vs. MPP1 or MPPa (log2) for Igf2bp2 and Hmga2.
Ratio maximums was set at 10, log2(10)=3.32. Violin plots for intensity ratios across replicates for each cell type are only shown if detected.
Figure 2—figure supplement 3
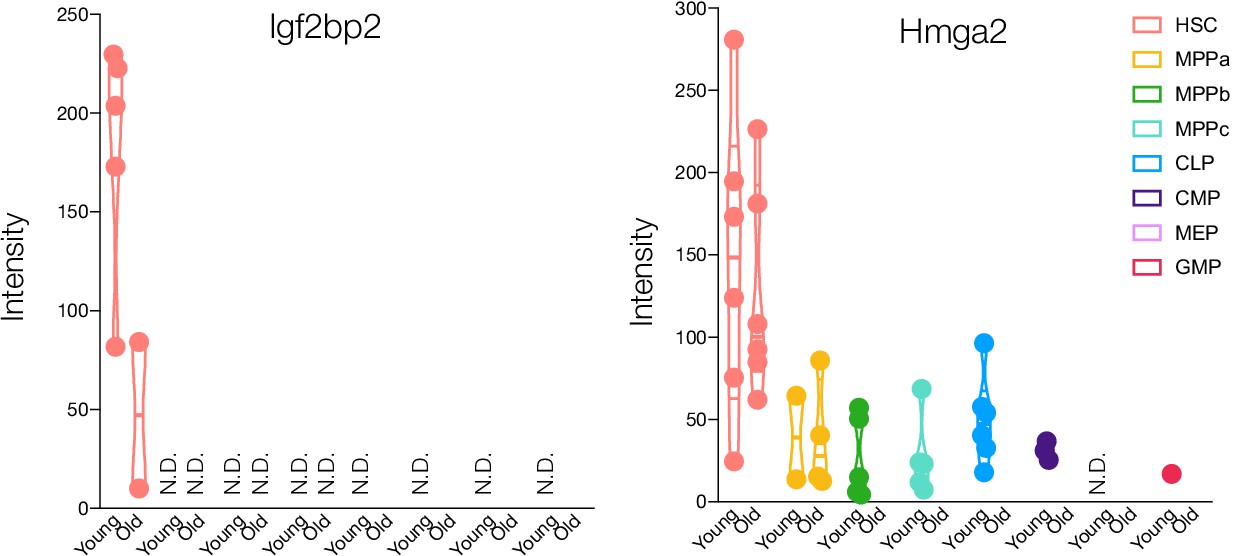
Protein expression of Igf2bp2 and Hmga2 in young and old adult mouse HSCs and progenitors.
Violin plots for intensity ratios across replicates for each cell type are only shown if detected. N.D. - not detected in any replicate.
Figure 2—figure supplement 4

Overlap of proteomic dataset compared to Cabezas-Wallsheid et al. and unique proteins detected in each study.
Figure 3 with 3 supplements
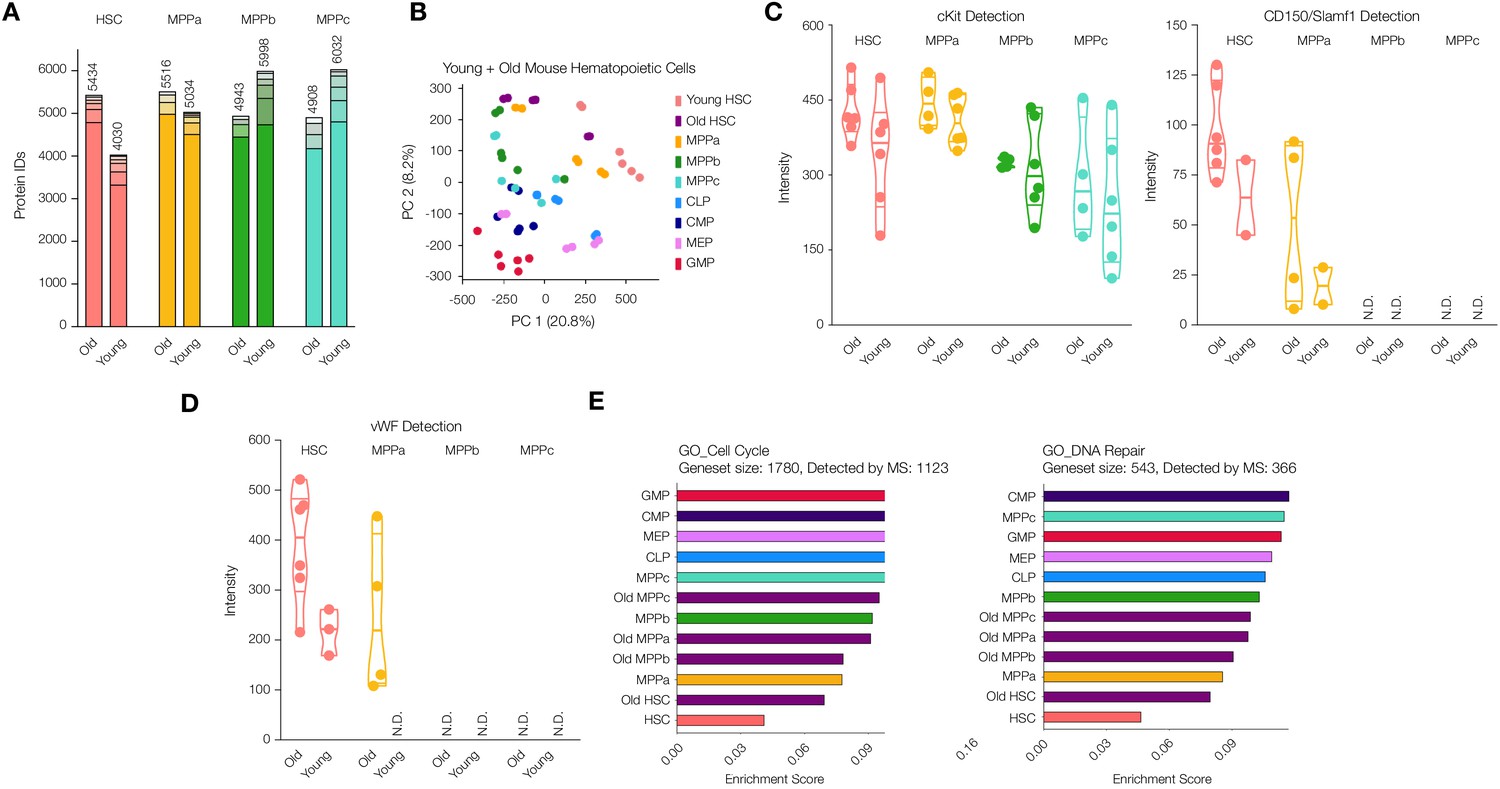
Proteomic comparison between young and old mouse HSCs and MPPs.
(A) Total number of proteins identified across experimental replicates for old HSCs (N = 6) and old MPPs (N = 4) in comparison to young adult mouse HSCs and MPPs (N = 6). Each segment represents new proteins discovered as result of each additional replicate. (B) Principal component analysis of all replicates of all young adult cell types and old mouse HSCs. (C) Protein intensity values for known markers of stem and early progenitor cells, cKit, and CD150. (D) Protein intensity values of von Wilebrand factor (vWF). (E) ssGSEA of GO Cell Cycle and DNA Repair-associated genes including young and old adult mouse HSCs and progenitors. P-adj = 0.00002, 0.00015 and 0.00002, respectively. Enrichment scores were averaged across replicates for each cell type. FDR = 0.05 All violin plots show only non-zero intensity values. N.D. = not detected in any replicate.
Figure 3—figure supplement 1
One-dimensional PCA plots show, which components are key drivers of segmentation between cell types and cell compartments.
Centroids are normalized representatives of all replicates and are scaled in size with respect to number of proteins associated with each component.
Figure 3—figure supplement 2

Protein abundance of Ki67 in young and old adult mouse HSCs and progenitors.
Violin plots for intensity ratios across replicates for each cell type are only shown if detected. N = 6 for young adult cells and old mouse HSCs. N = 4 for old MPPs.
Figure 3—figure supplement 3

Protein abdundance of the age-associated protein Itgb3 in young and old adult mouse HSCs and progenitors.
Violin plots for intensity ratios across replicates for each cell type are only shown if detected. N.D. - not detected in any replicate. N = 6 for young adult cells and old mouse HSCs. N = 4 for old MPPs.
Figure 4 with 4 supplements

Comparison between the proteome and transcriptome of HSCs and MPPs.
(A). Within the transcriptome, count of genes detected as mRNA only (Green), mRNA only uniquely to a given cell type (Yellow), or both protein and mRNA (Orange). T = total count of genes detected across proteome and transcriptome (sum of all bars) per cell type. U = mRNA only uniquely to a given cell type (yellow bar). (B) Log2 normalized protein intensity vs Log2 mRNA TPM for all genes detected in young adult mouse HSCs. 0.0001 was added to normalized data to account for zeroes. (C) Protein vs mRNA Spearman correlation value for each cell type. (D) Pearson correlations between combinations of HSC and MPPs for Log2 normalized protein intensity/mRNA TPM fold-change values of genes detected in proteome and transcriptome across all four cell types. (E) Log2 normalized protein intensity/mRNA TPM fold-change values of HSC vs MPPa for genes detected in proteome and transcriptome of both cell types. Top 2.5% genes with highest MPP fold-change/HSC fold-change ratios (Yellow), identifying genes where there is reduced protein per mRNA in the HSC compartment compared to MPPs. (F) Relative mRNA TPM value and protein intensity value of the genes Adnp, Dnmt3a and Hprt1 (housekeeping gene) across HSC and MPPs. To determine the relative values, average intensity and average TPM was calculated across all experimental replicates across all cell types, for MS and RNA-sequencing, respectively. The percentage with respect to the average was calculated and graphed for each replicate. Error bars represent standard error to the mean. For B-E, proteomic replicates were averaged across non-zero values. Transcriptome values were averaged across all values. N.D. = not detected in any replicate; TPM = transcripts per million.
Figure 4—figure supplement 1

Protein detection vs. mRNA expression (log2) for MPPs.
Figure 4—figure supplement 2

Principal component analysis (PCA) of Protein/mRNA fold-change for each cell type.
Figure 4—figure supplement 3
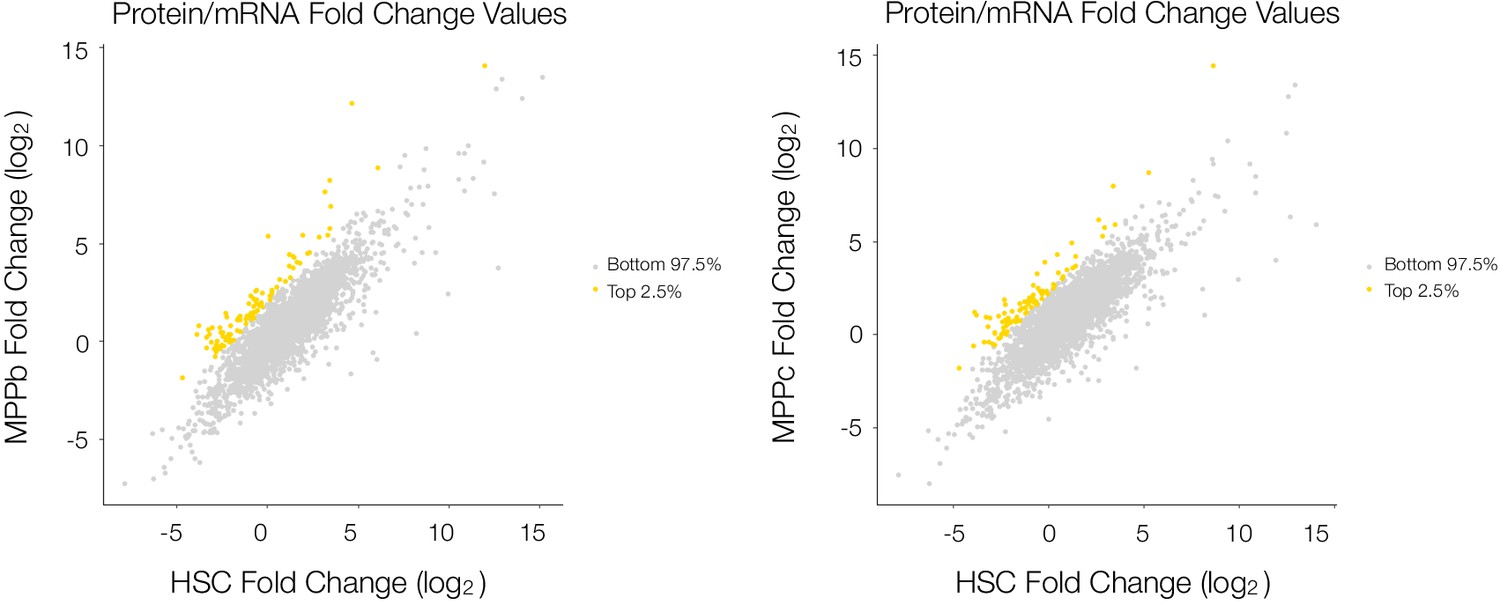
Log2-fold change in Protein vs. mRNA values for each cell type for proteins detected in all 4 cell types MPPb vs. HSC and MPPc vs. HSC.
Figure 4—figure supplement 4

Null distribution analysis to validate significance.
Protein and mRNA coverage and overlap comparison in HSCs and MPPs. mRNAs for which no protein is detected in at least two cell types (Green), mRNAs for which no protein is detected uniquely in that cell type (Unique, Yellow), mRNAs for which protein is detected (Orange). U = total number of mRNA for which no protein is detected uniquely in that cell type.
Figure 5 with 6 supplements
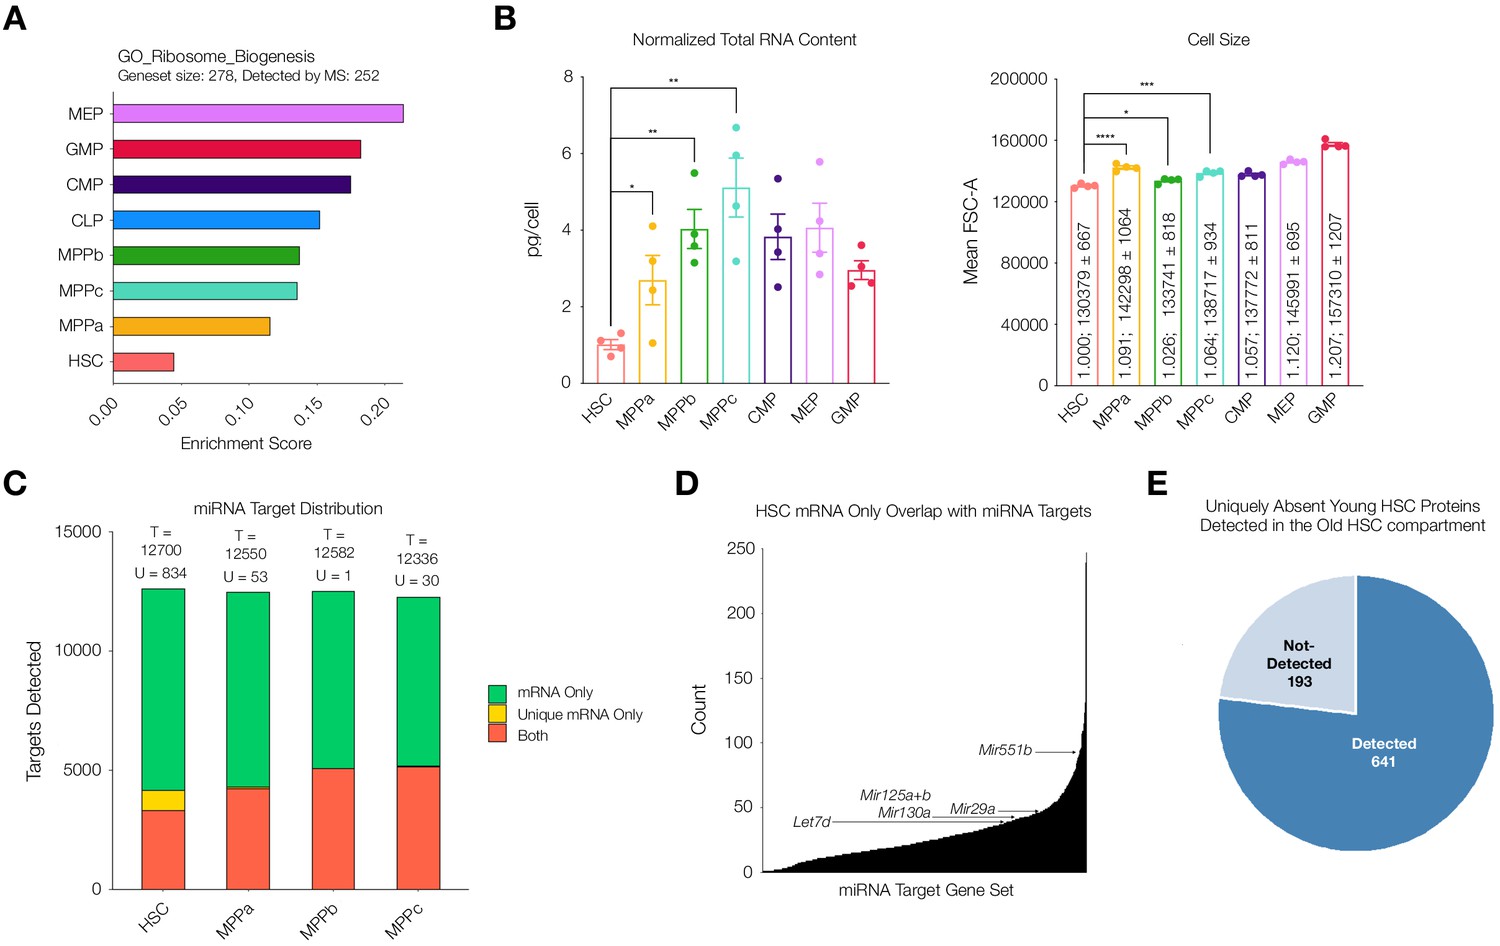
Potential mechanisms of regulation responsible for uniquely discordant protein to mRNA relationship in young adult mouse HSCs.
(A) ssGSEA of proteins associated with GO Ribosome Biogenesis. P-adj = 0.00003. Enrichment scores were averaged across replicates for each cell type. FDR = 0.05 (B) Total RNA content normalized with respect to cell size in each cell type. N = 4 from 5 pooled mice (3 males, 2 females). P-values: HSC vs. MPPa * = 0.0432, HSC vs. MPPb ** = 0.0012, HSC vs MPPc ** = 0.0019. Forward Scatter Area (FSC-A) for each cell type used for normalization. Relative size and mean ± standard error to the mean (SEM) FSC-A values are denoted in the bars. N = 4 mice (2 male, 2 female). P-values: HSC vs. MPPa **** < 0.0001, HSC vs MPPb * = 0.0190, HSC vs. MPPc *** = 0.0003 Error bars represent SEM. (C) Within putative miRNA targets, count of genes detected as mRNA only (Green), mRNA only uniquely to a given cell type (Yellow), or both protein and mRNA (Orange). T = total count of putative miRNA targets. U = mRNA only uniquely to a given cell type (yellow bar). (D) Count of genes that are uniquely mRNA only for young adult mouse HSCs within a given miRNA’s putative target list. Examples of potential or previously-implicated miRNAs are denoted. (E) Proteomic detection profile in old adult HSC of putative targets of miRNAs that are uniquely mRNA only in young adult mouse HSCs.
Figure 5—figure supplement 1

Ribosomal proteins that are uniquely very low or absent in each cell type.
Figure 5—figure supplement 2
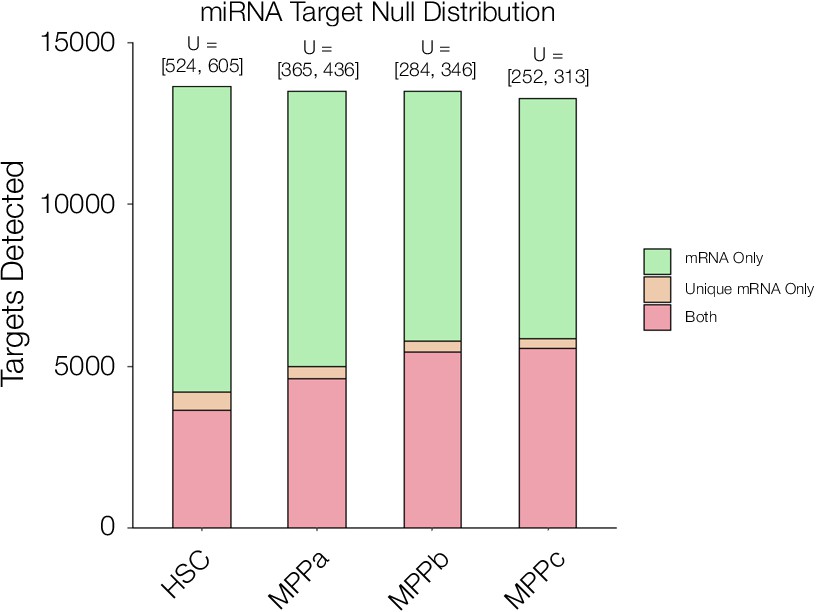
miRNA target null distribution analysis.
Figure 5—figure supplement 3
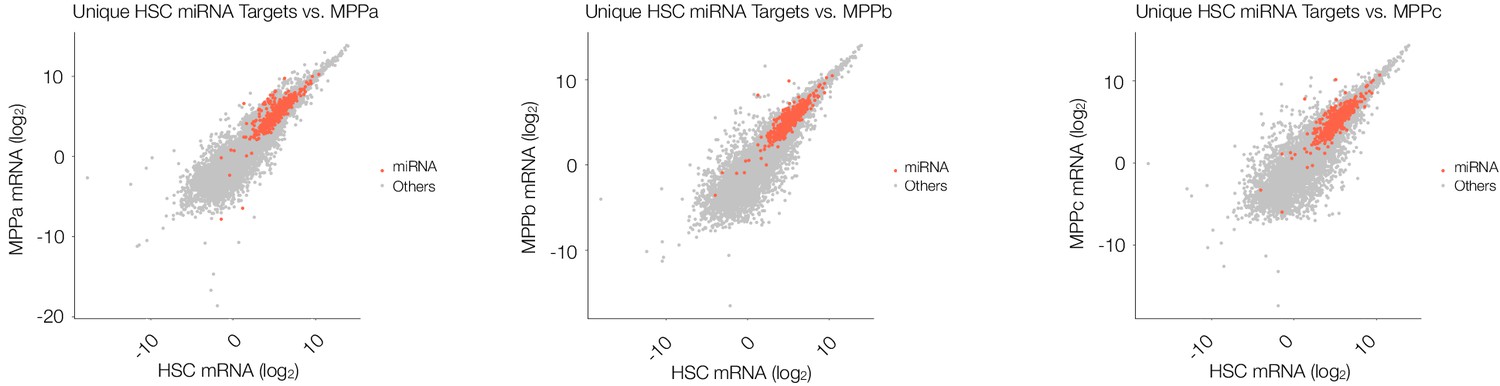
Comparison of mRNA levels of miRNA protein targets that are uniquely missing in the young adult HSC compartment to MPPs reveal comparable mRNA levels between cells types.
Figure 5—figure supplement 4

Percent of genes for each miRNA target list uniquely expressed as mRNA only in young adult mouse HSCs detected as protein in old adult mouse HSCs.
Figure 5—figure supplement 5

ssGSEA of proteins associated with GO Epigenetic Regulation, and Ribosome Biogenesis including young and old adult mouse HSCs and progenitors.
P-adj = 0.00007 and 0.00003 respectively. Enrichment scores were averaged across replicates for each cell type. FDR = 0.05.
Figure 5—figure supplement 6

ssGSEA of proteins associated with GO Protein Monoubiquitination.
P-adj = 0.00447.Enrichment scores were averaged across replicates for each cell type. FDR = 0.05.
Figure 6
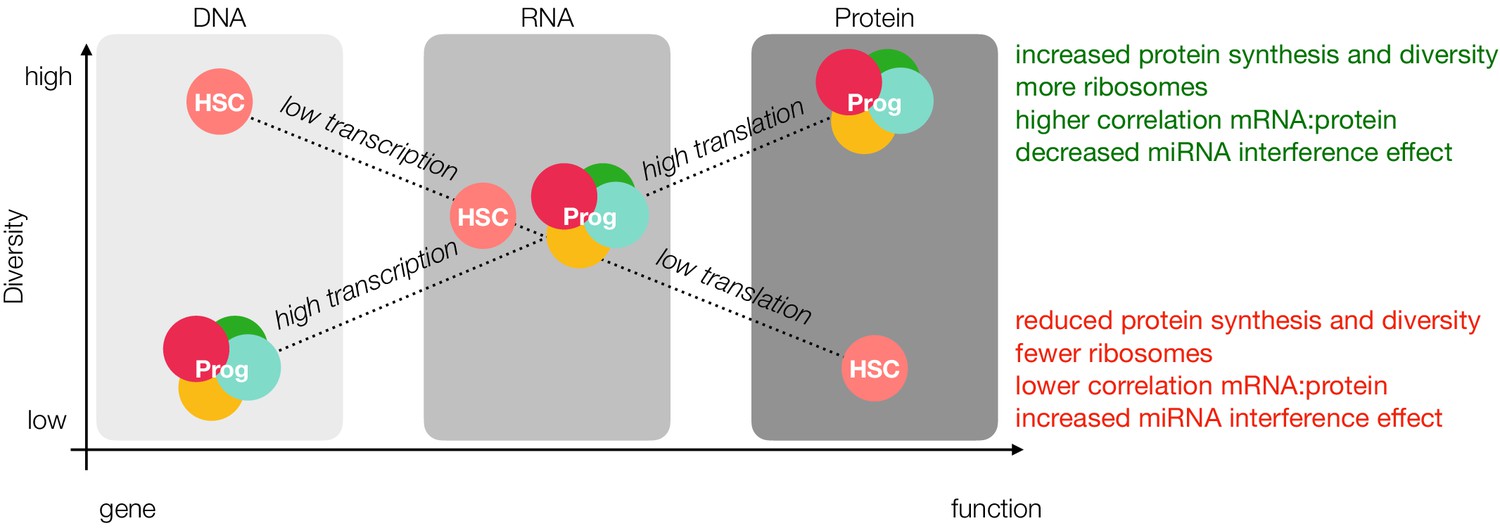
Loss of diversity hypothesis.
In our model, young adult mouse HSCs have more open chromatin than progenitor cells; however, lower rates of transcription result in comparable levels of message diversity at the mRNA level. Decreased rates of translation due to fewer ribosomes and reduced ribosomal activity, miRNA interference and sensitivity towards the unfolded protein response result in less protein diversity as detected by mass spectrometry. Prog = Progenitor.
Tables
Key resources table
| Reagent type (species) or resource | Designation | Source or reference | Identifiers | Additional information |
|---|---|---|---|---|
| Antibody | Rat monoclonal anti-mouse CD34 (RAM34) FITC | ThermoFisher Scientific | Cat# 11-0341-82, RRID:AB_465021 | FC (5 ug/mL) |
| Antibody | Rat monoclonal anti-mouse Lineage cocktail A700 (anti-mouse CD3, clone 17A2; anti-mouse Ly-6G/Ly-6C, clone RB6-8C5; anti-mouse CD11b, clone M1/70; anti-mouse CD45R/B220, clone RA3-6B2; anti-mouse TER-119/Erythroid cells, clone Ter-119) | Bio-Legend | Cat# 133313, RRID:AB_2715571 | FC (5 uL/mouse) |
| Antibody | Rat monoclonal anti-mouse cKIT (2B8) APC-eFluor780 | ThermoFisher Scientific | Cat# 47-1171-82, RRID:AB_1272177 | FC (2 ug/mL) |
| Antibody | Rat monoclonal anti-mouse Sca1 (D7) PE-Cy7 | Bio-Legend | Cat# 108114, RRID:AB_493596 | FC (2 ug/mL) |
| Antibody | Rat monoclonal anti-mouse CD150 (TC15-12F12.2) APC | Bio-Legend | Cat# 115910, RRID:AB_493460 | FC (2 ug/mL) |
| Antibody | Rat monoclonal anti-mouse Flt3 (A2F10) PerCP-eFluor710 | ThermoFisher Scientific | Cat# 46-1351-82, RRID:AB_10733393 | FC (2 ug/mL) |
| Antibody | Rat monoclonal anti-mouse CD16/32 (2.4G2) BUV395 | BD Biosciences | Cat# 740217, RRID:AB_2739965 | FC (2 ug/mL) |
| Antibody | Rat monoclonal anti-mouse IL7Ra (A7R34) APC | Bio-Legend | Cat# 135012, RRID:AB_1937216 | FC (2 ug/mL) |
| Antibody | Rat monoclonal anti-mouse CD150 (TC15-12F12.2) BV421 | Bio-Legend | Cat# 115925, RRID:AB_10896787 | FC (2 ug/mL) |
| Antibody | Rat monoclonal anti-mouse IL7Ra (SB/199) BV711 | BD Biosciences | Cat# 565490, RRID:AB_2732059 | FC (2 ug/mL) |
| Antibody | Rat monoclonal anti-mouse ESAM (1G8) APC | Bio-Legend | Cat# 136207, RRID:AB_2101658 | FC (2 ug/mL) |
| Antibody | Rat monoclonal anti-mouse CD16/32 (93) PE | Bio-Legend | Cat# 101307, RRID:AB_312806 | FC (2 ug/mL) |
| Antibody | Rabbit monoclonal anti-mouse Pfkl (EPR11904) | Abcam | Cat# ab181064, RRID | IF (1:100) |
| Antibody | Cy3 AffiniPure F(ab')2 Fragment Donkey Anti-Rabbit IgG | Jackson ImmunoResearch | Cat# 711-166-152, RRID:AB_2313568 | IF (1:500) |
| Commercial assay or kit | iST NHS 96x | PreOmics | iSTNHS96x | |
| Commercial assay or kit | Pierce Quantitative Colorimetric Peptide Assay | ThermoFisher Scientific | 23275 | |
| Commercial assay or kit | RNAeasy minelute CleanUp Kit | QIAGEN | 74204 | |
| Commercial assay or kit | NEBNext Ultra DNA Library Prep Kit for Illumina | New England BioLabs | E7103 | |
| Other | TRIzol | Invitrogen | 15596018 | |
| Other | RQ1 RNase free DNase | Promega | M6101 | |
| Other | Agencourt Ampure XP | Beckman Coulter | A63881 |
Additional files
-
Supplementary file 1
Data tables.
(1) Mass spectrometry individual runs for all cell types. (2) Mass spectrometry runs combined by cell type. (3) Contributions to the first two components of Principal Component Analysis (PCA) for young adult mass spectrometry data. (4) Proteins uniquely detected in select subsets of cell types. (5) Comparison of mass spectrometry data to data published by Cabezas-Wallscheid et al. (6) Contributions to the first two components of PCA for young and old adult mass spectrometry data. (7) Proteins either detected in old HSCs but not in young adult HSCs or within the top 2.5% of old/young fold-change in HSCs. (8) RNA-sequencing individual and combined runs for HSCs and MPPs. (9) Proteins uniquely decoupled from mRNA levels in HSCs compared to MPPs. (10) Number of overlaps between each miRNA’s predicted target list with the list of proteins uniquely absent by protein but present by mRNA in HSCs compared to MPPs.
- https://cdn.elifesciences.org/articles/62210/elife-62210-supp1-v1.xlsx
-
Transparent reporting form
- https://cdn.elifesciences.org/articles/62210/elife-62210-transrepform-v1.pdf
Download links
A two-part list of links to download the article, or parts of the article, in various formats.
Downloads (link to download the article as PDF)
Open citations (links to open the citations from this article in various online reference manager services)
Cite this article (links to download the citations from this article in formats compatible with various reference manager tools)
Proteomic analysis of young and old mouse hematopoietic stem cells and their progenitors reveals post-transcriptional regulation in stem cells
eLife 9:e62210.
https://doi.org/10.7554/eLife.62210


