A Bayesian approach to dynamic homology of morphological characters and the ancestral phenotype of jawed vertebrates
- Naturalis Biodiversity Center, Netherlands
Figures
Figure 1
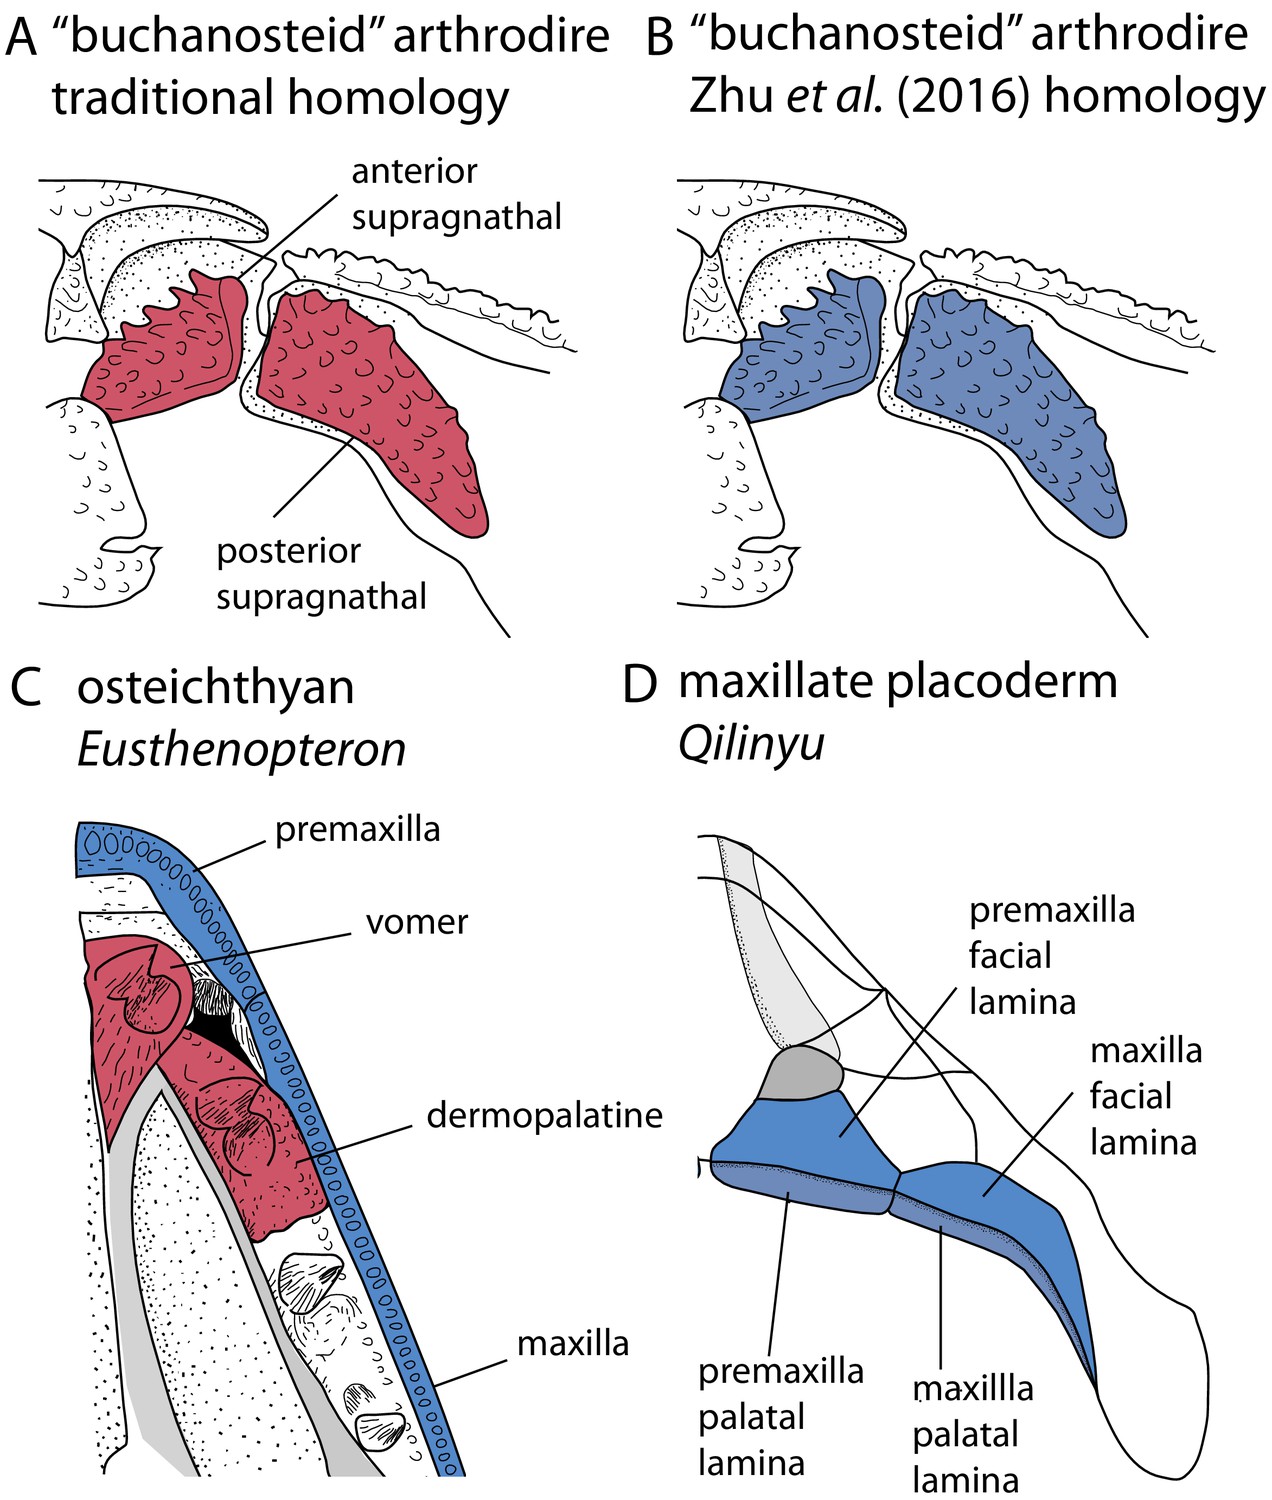
Upper jaw bones in arthrodire placoderms, maxillate placoderms and osteichthyans, showing alternative homology assignments for the arthrodiran supragnathals.
(A–B) Arthrodire in palatal view, showing anterior and posterior supragnathals. Based on Hu et al., 2017. (C) Osteichthyan Eusthenopteron in palatal view, based on Jarvik, 1980. (D) Maxillate placoderm Qilinyu in palatal view, based on Zhu et al., 2016. Blue coloration indicates the premaxilla-maxilla series, red coloration indicates the vomer-dermopalatine series. The alternative coloration of arthrodire supragnathals in A and B represents the alternative homology statements for these bones (homology states 0 and 1 respectively).
Figure 2
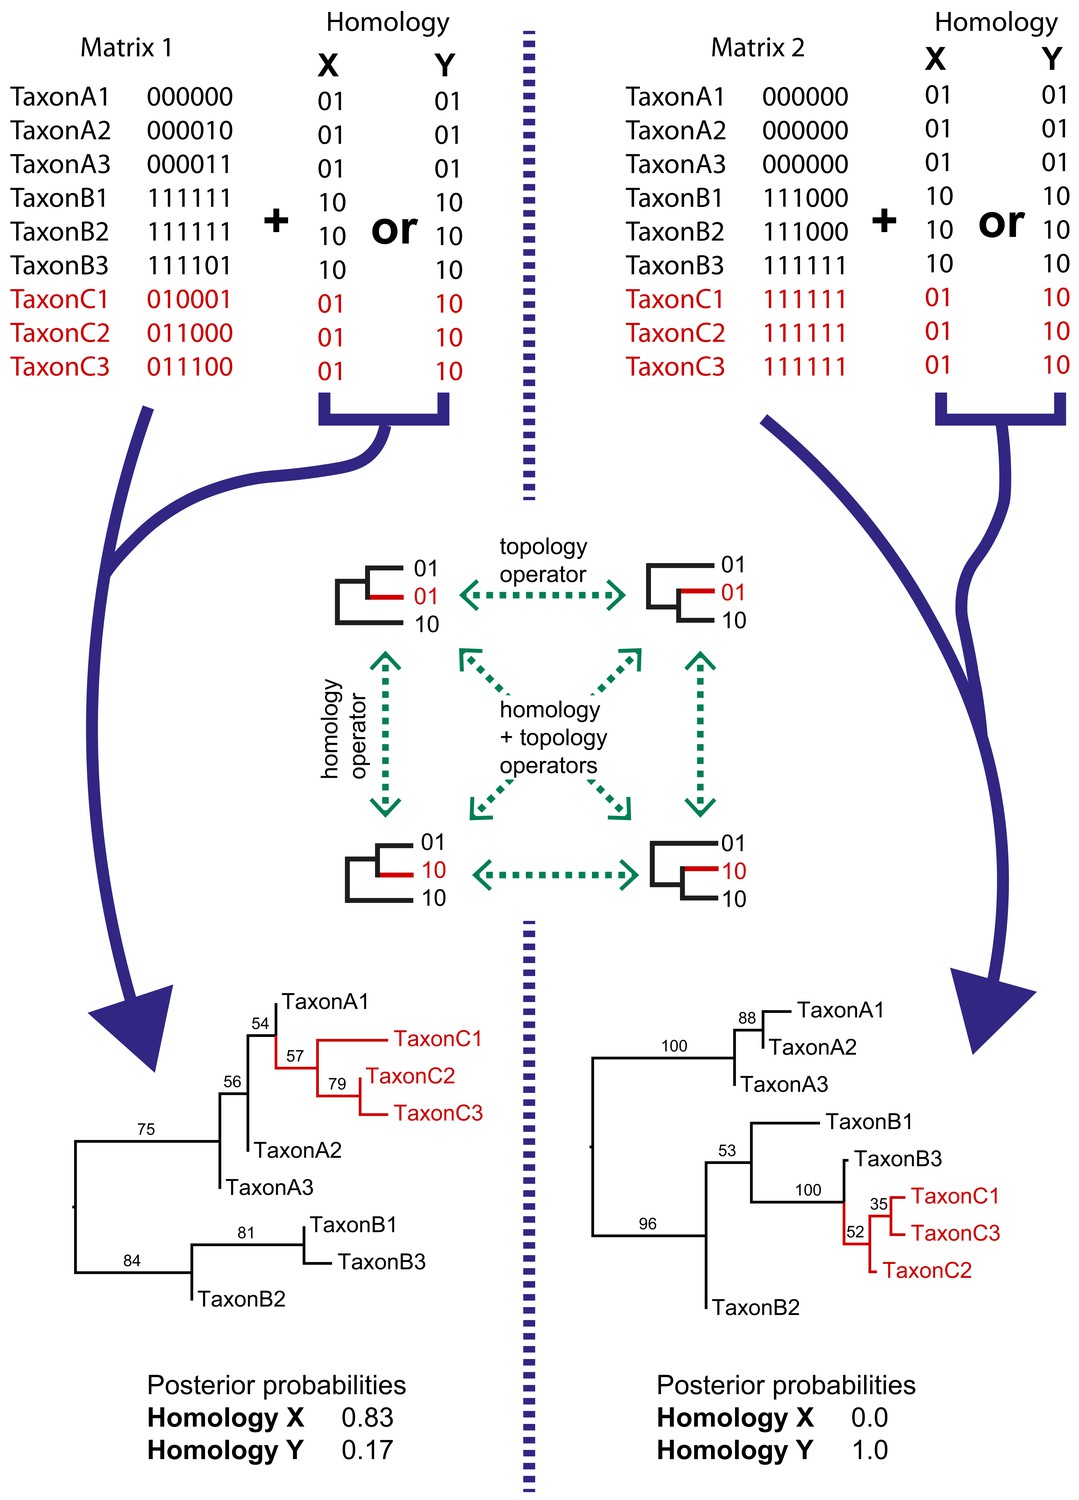
Simple examples of dynamic homology applied to matrices with six characters with fixed homology and two with estimated homology.
Taxa C1–3 have alternative homologies (homology X and Y). For matrix1, there is moderate support for group C to fall within group A, leading to a higher posterior probability for homology X than homology Y. In matrix 2, there is strong support for taxon group C to fall within group B, leading in turn to strong support for homology Y.
Figure 3
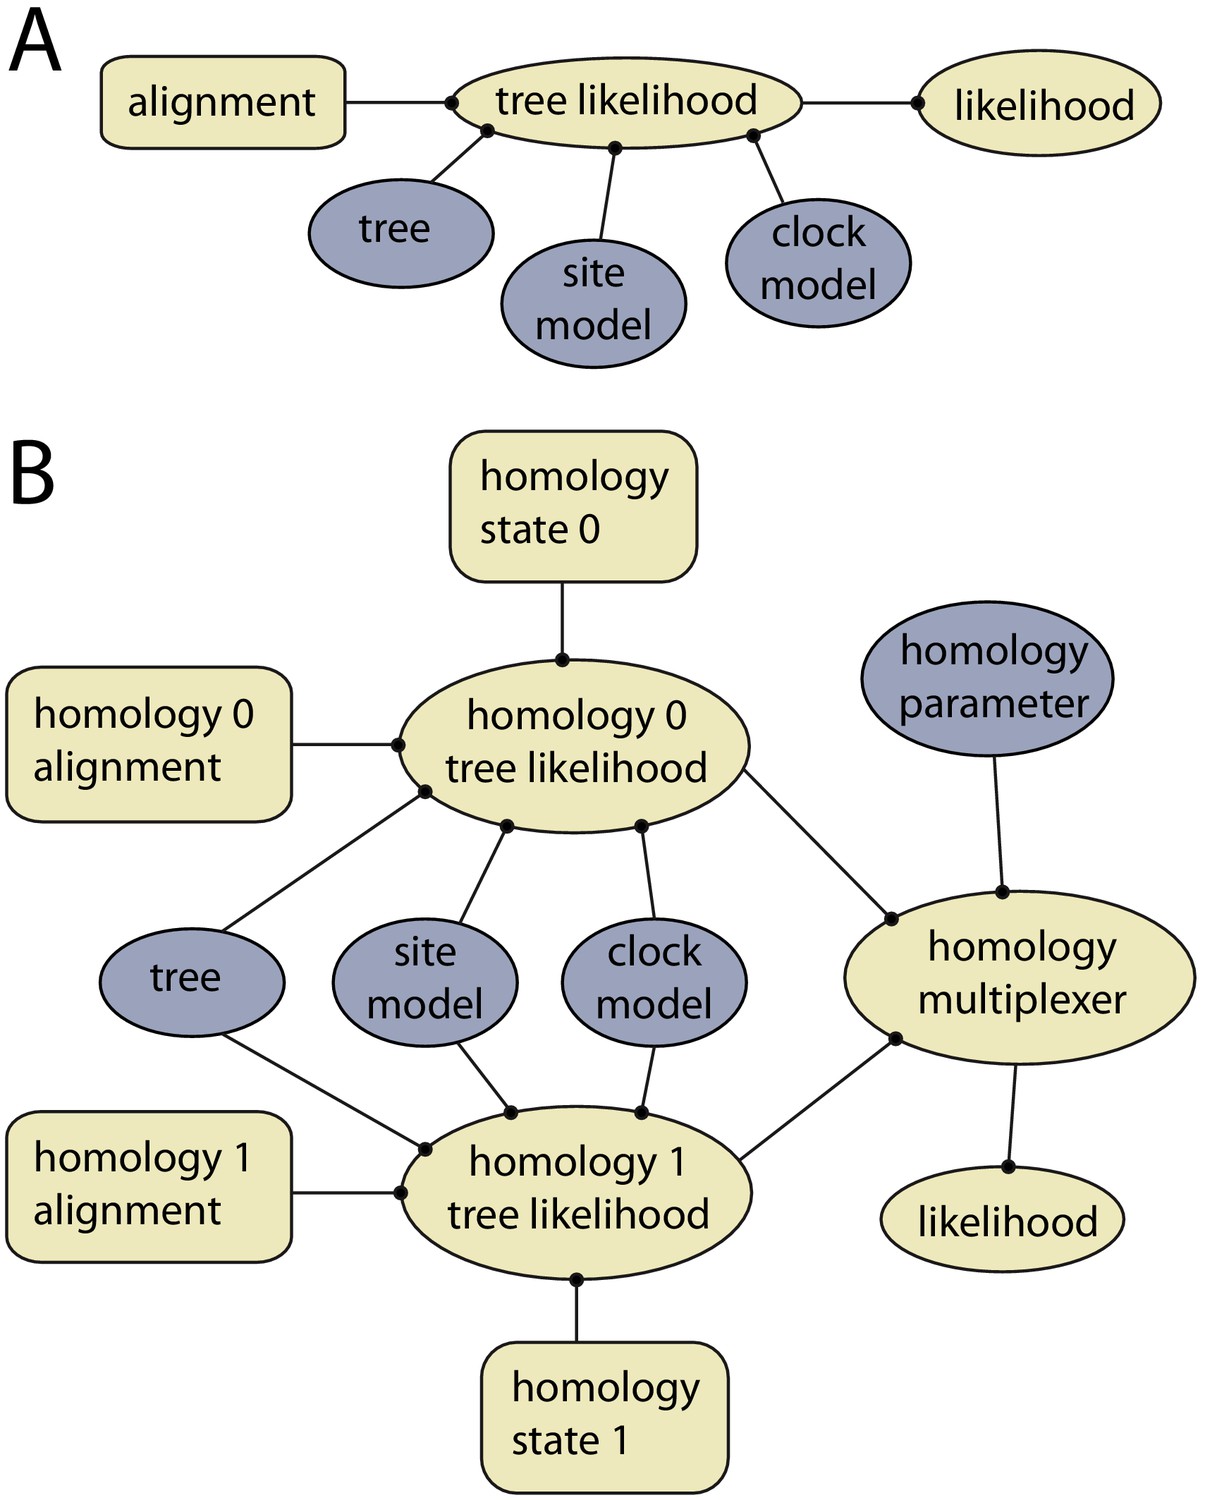
Example of models with and without dynamic homology of morphological characters.
(A) Model diagram of a fixed homology partition. Tree likelihood takes as input a data alignment, tree, site model and clock model, and the calculated tree likelihood is passed to the likelihood, where it is combined with other partitions. Rectangles indicate fixed inputs, whereas ovals are model components that change during the MCMC. Blue shaded components are changed by operators, either directly (tree) or indirectly (site model, clock model). (B) Model diagram for a partition with dynamic homology with two homology states. The homology-multiplexer passes either the value of homology tree likelihood 0 or homology tree likelihood 1 to the likelihood, depending on the current value of the homology parameter.
Figure 4
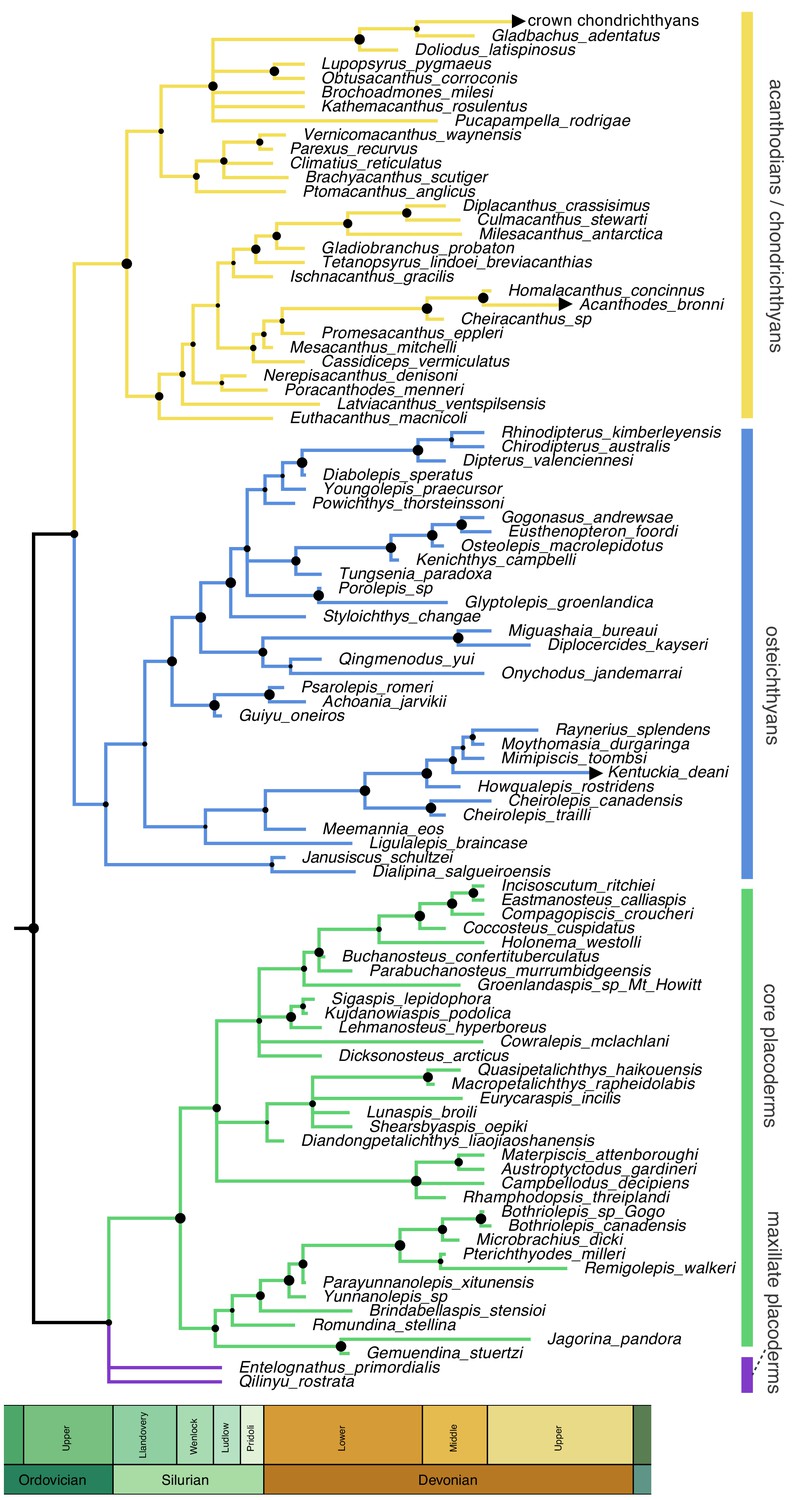
Time-scaled 50% majority-rule consensus tree from tip-dated homoplasy-partitioned analysis of gnathostome fossils, with dynamic homology of upper jaw bones in placoderms.
Node circles indicate posterior probabilities. Branches with arrowheads (crown chondrichthyans, Acanthodes, Kentuckia) indicate tip age(s) are younger than the range displayed in the figure.
Figure 5
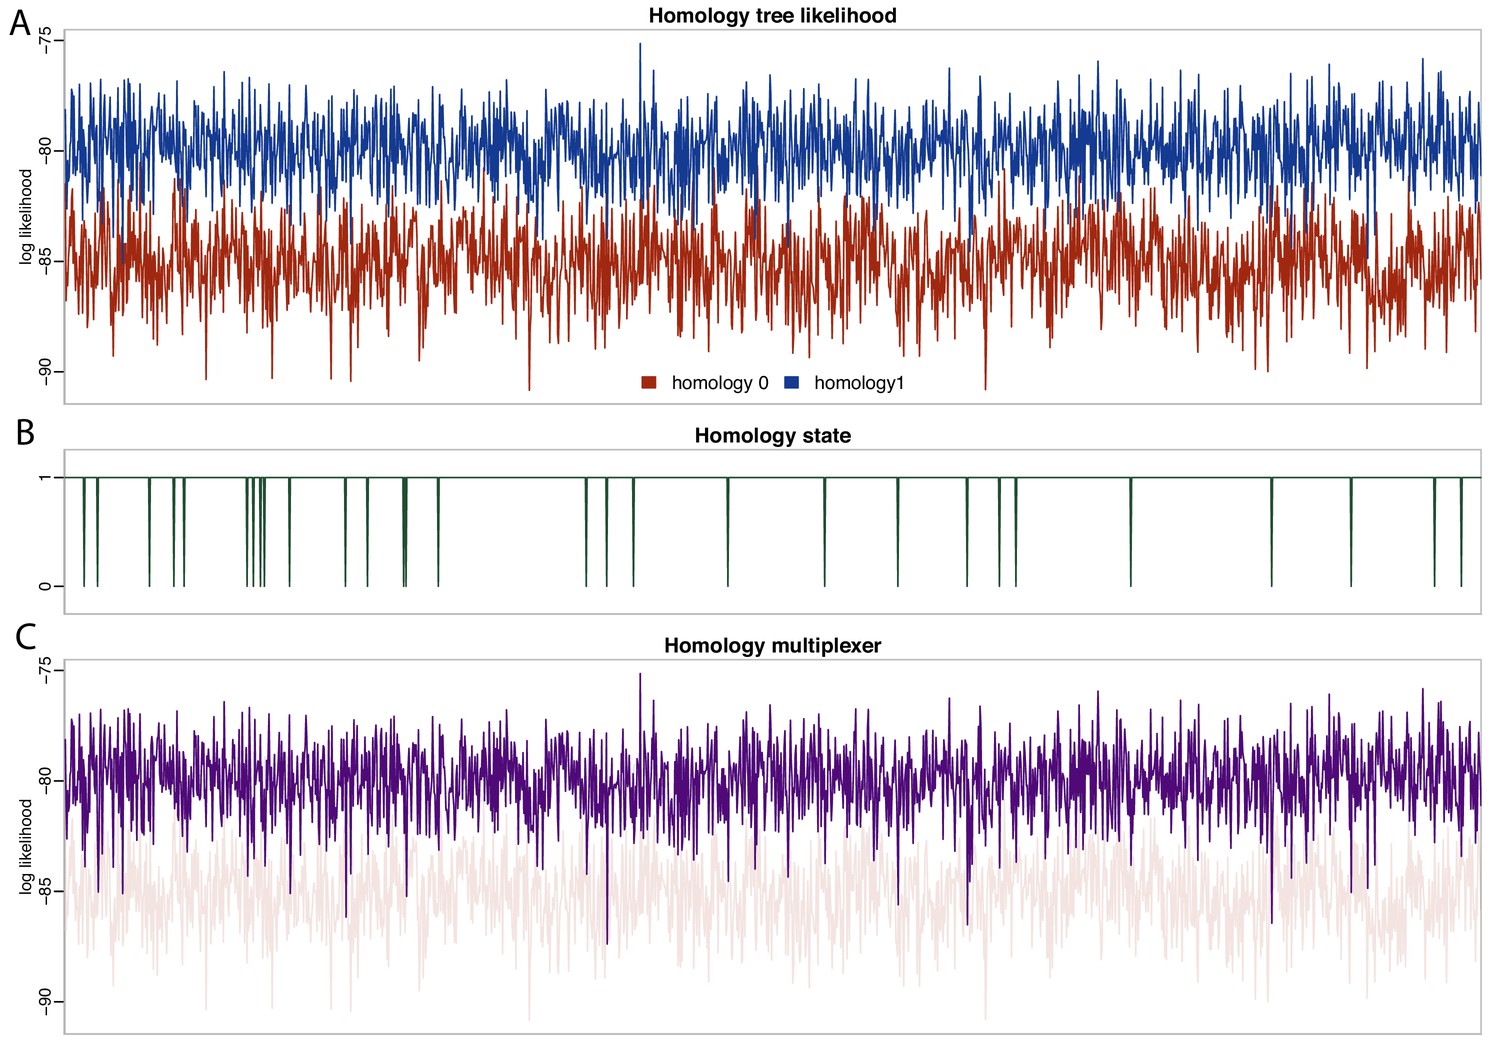
Likelihood and parameter traces during BEAST2 MCMC, with dynamic homology of placoderm jaw bones.
(A) Tree likelihoods using homology alignment 0 (placoderm supragnathals are vomers/dermopalatines) are lower than those for homology alignment 1 (placoderm supragnathals are premaxillae/maxillae). (B) The MCMC only rarely samples homology state 0. (C) The homology-multiplexer therefore largely returns the tree likelihood of homology alignment 1 (homology tree likelihood 0 is replotted with transparency for reference).
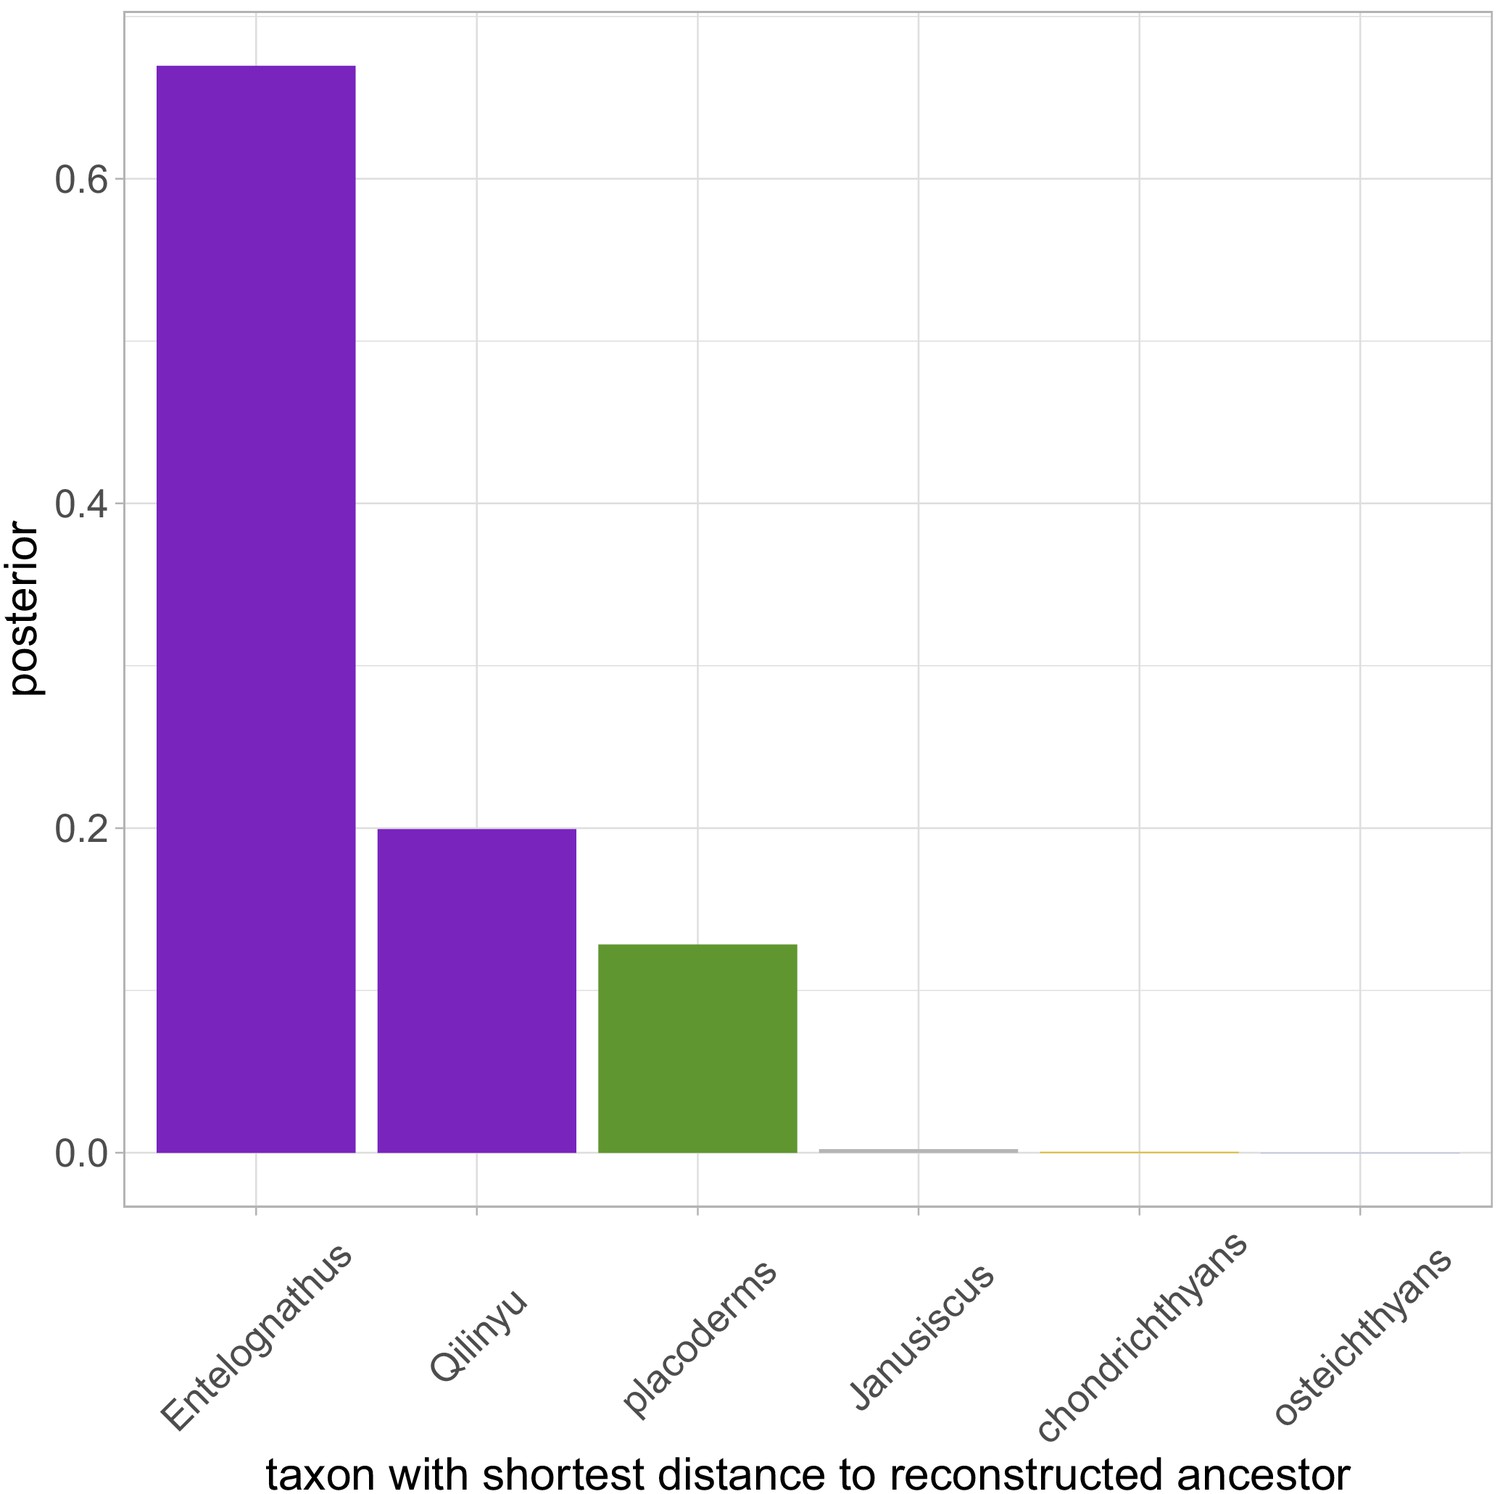
Figure 6
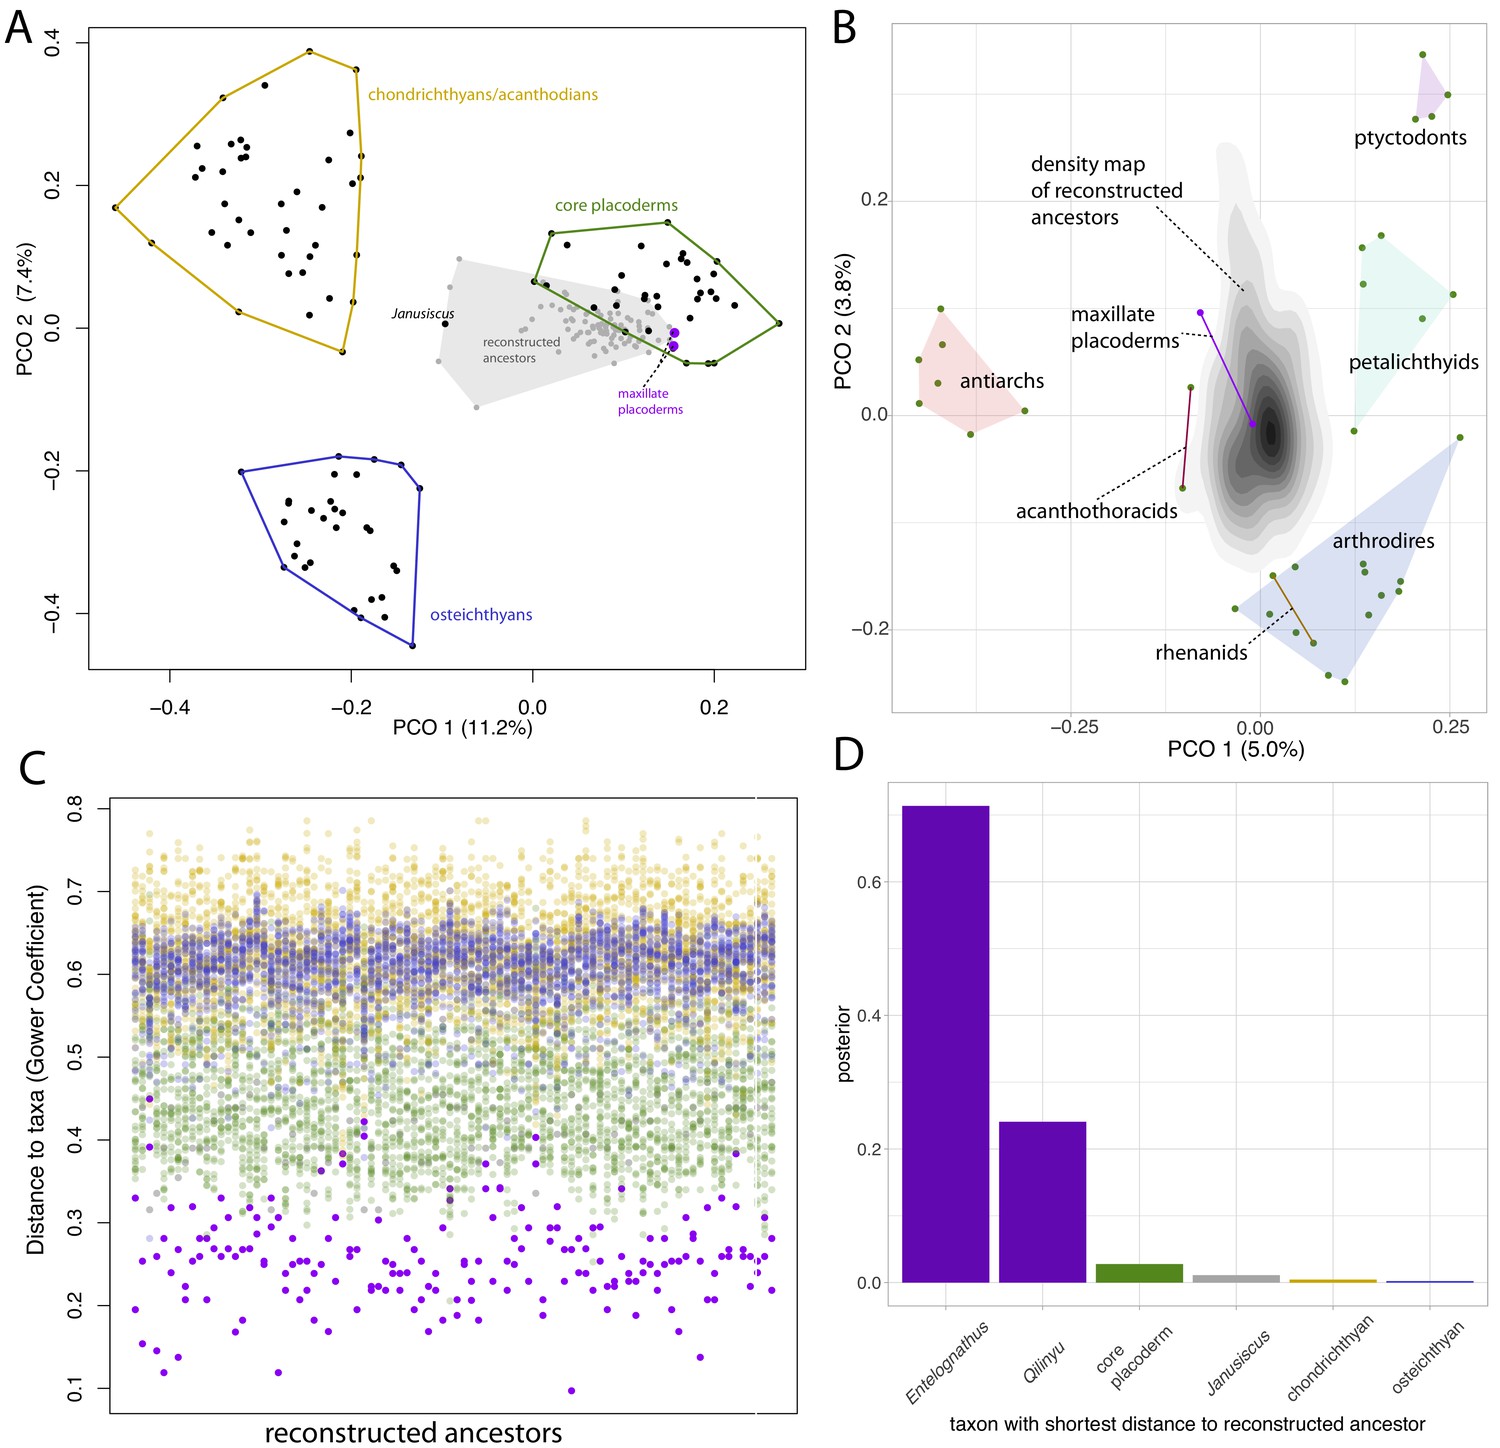
Distance plots suggest placoderms, and particularly maxillate placoderms are the gnathostomes least divergent from the gnathostome ancestor.
(A) PCO plot of all gnathostome taxa in the matrix (black points) and a sample of 90 reconstructed ancestors (gray points and shaded convex hull). (B) PCO plot of placoderm taxa and reconstructed ancestors, with the latter point cloud converted to a density plot. (C) Each column represents a reconstructed ancestor (n = 90), with gnathostome fossils plotted with y-axis coordinates corresponding to distance from each reconstructed ancestor. (D) Frequency plot of the taxon with the shortest distance to the reconstructed ancestor across the whole posterior sample (n = 1801). Core placoderm, osteichthyan and chondrichthyan (including acanthodian) taxa are combined into single bins.
Figure 7

Scenario for the evolution of upper jaw bones in gnathostomes (jawed vertebrates).
Red arrow indicates change to the palatal (vomer-dermopalatine) series of dermal jaw bones, blue arrows indicate changes to the marginal (premaxilla-maxilla) series.
Appendix 1—figure 1
Frequency plot of the taxon with the shortest distance to the reconstructed ancestor across the whole posterior sample (n = 1801), when data is analysed with a Silurian age for Yunnanolepis.
Tables
Table 1
Character states reconstructed at the common ancestor of apomorphy-defined gnathostomes.
| Character | Reconstructed ancestral state | Posterior probability |
|---|---|---|
| Premaxilla | Present | 1.0 |
| Maxilla | Present | 0.96 |
| Facial laminae | Present | 0.96 |
| Palatal laminae | Present | 0.93 |
| Vomer | Absent | 0.93 |
| Dermopalatine | Absent | 0.95 |
| Nasal capsules | Anterior/ventral | 0.94 |
| Orbit dorsal, surrounded by neurocranium | Absent | 0.96 |
| Claspers | Absent | 0.79 |
| Optic fissure | Absent | 0.78 |
Appendix 1—table 1
Probabilities of key character states at the gnathostome node, when data is analysed with a Silurian age for Yunnanolepis.
| Character | Reconstructed ancestral state | Posterior probability |
|---|---|---|
| Premaxilla | Present | 0.97 |
| Maxilla | Present | 0.92 |
| Facial laminae | Present | 0.89 |
| Palatal laminae | Present | 0.97 |
| Vomer | Absent | 0.96 |
| Dermopalatine | Absent | 0.88 |
| Nasal capsules | Anterior/ventral | 0.85 |
| Orbit dorsal, surrounded by neurocranium | Absent | 0.96 |
| Claspers | Absent | 0.76 |
| Optic fissure | Absent | 0.69 |
Additional files
-
Source data 1
Character state probabilities at the (apomorphy-defined) gnathostome node for all characters.
- https://cdn.elifesciences.org/articles/62374/elife-62374-data1-v2.xlsx
-
Supplementary file 1
Data matrix in nexus format.
- https://cdn.elifesciences.org/articles/62374/elife-62374-supp1-v2.zip
-
Supplementary file 2
Beast2 xml file.
- https://cdn.elifesciences.org/articles/62374/elife-62374-supp2-v2.zip
-
Transparent reporting form
- https://cdn.elifesciences.org/articles/62374/elife-62374-transrepform-v2.docx
Download links
A two-part list of links to download the article, or parts of the article, in various formats.
Downloads (link to download the article as PDF)
Open citations (links to open the citations from this article in various online reference manager services)
Cite this article (links to download the citations from this article in formats compatible with various reference manager tools)
A Bayesian approach to dynamic homology of morphological characters and the ancestral phenotype of jawed vertebrates
eLife 9:e62374.
https://doi.org/10.7554/eLife.62374


