fMRI-based detection of alertness predicts behavioral response variability
- Department of Biomedical Engineering, Vanderbilt University, United States
- Vanderbilt University Institute of Imaging Science, Vanderbilt University Medical Center, United States
- Department of Electrical Engineering and Computer Science, Vanderbilt University, United States
- Advanced MRI Section, National Institute of Neurological Disorders and Stroke, National Institutes of Health, United States
- Department of Neurological Surgery, Vanderbilt University Medical Center, United States
- Department of Radiology and Radiological Sciences, Vanderbilt University Medical Center, United States
Figures
Figure 1
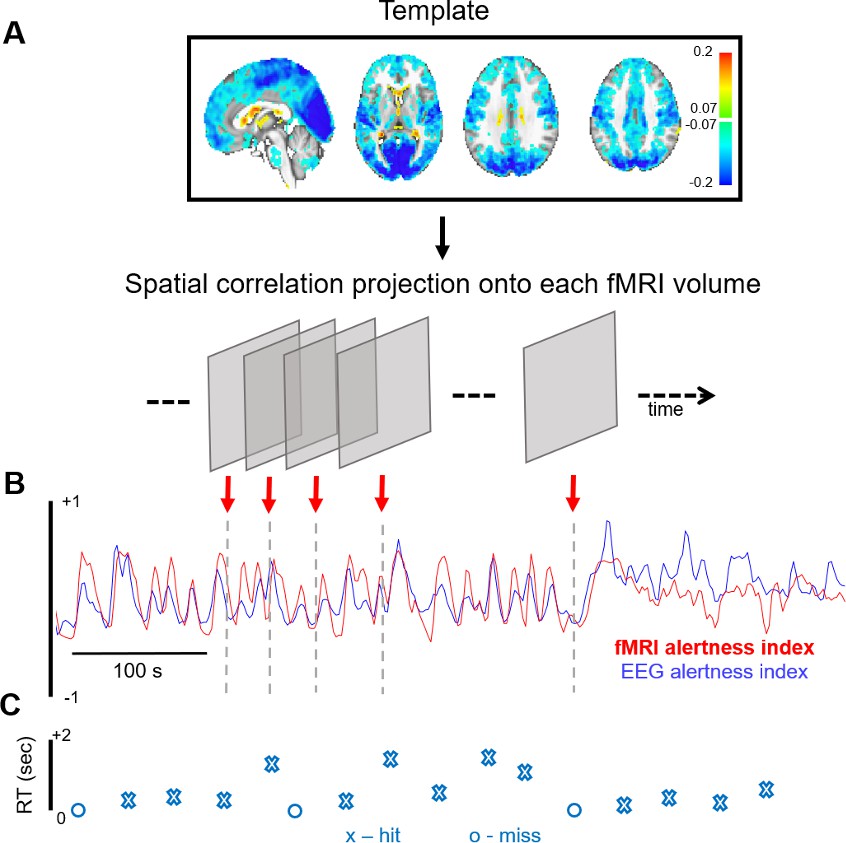
fMRI-based inference of alertness fluctuation.
(A) A spatial template, created a priori (here, using resting-state scans with simultaneous EEG–fMRI), is projected onto each successive volume of a different, auditory task fMRI scan (not used in the template creation) via spatial correlation. These correlation values trace out a time course of estimated arousal fluctuation, which we refer to as the ‘fMRI alertness index’. (B) To assess the ability to predict electrophysiological alertness in the task scan, the estimated fMRI alertness index (red) is compared with an established EEG vigilance index that was collected simultaneously (the alpha/theta power ratio, convolved with a hemodynamic response function; blue). (C) The reaction time (RT) to each auditory stimulus is represented by an ‘X’ when the subject responded to a given trial and ‘O’ when they missed.
Figure 2 with 3 supplements
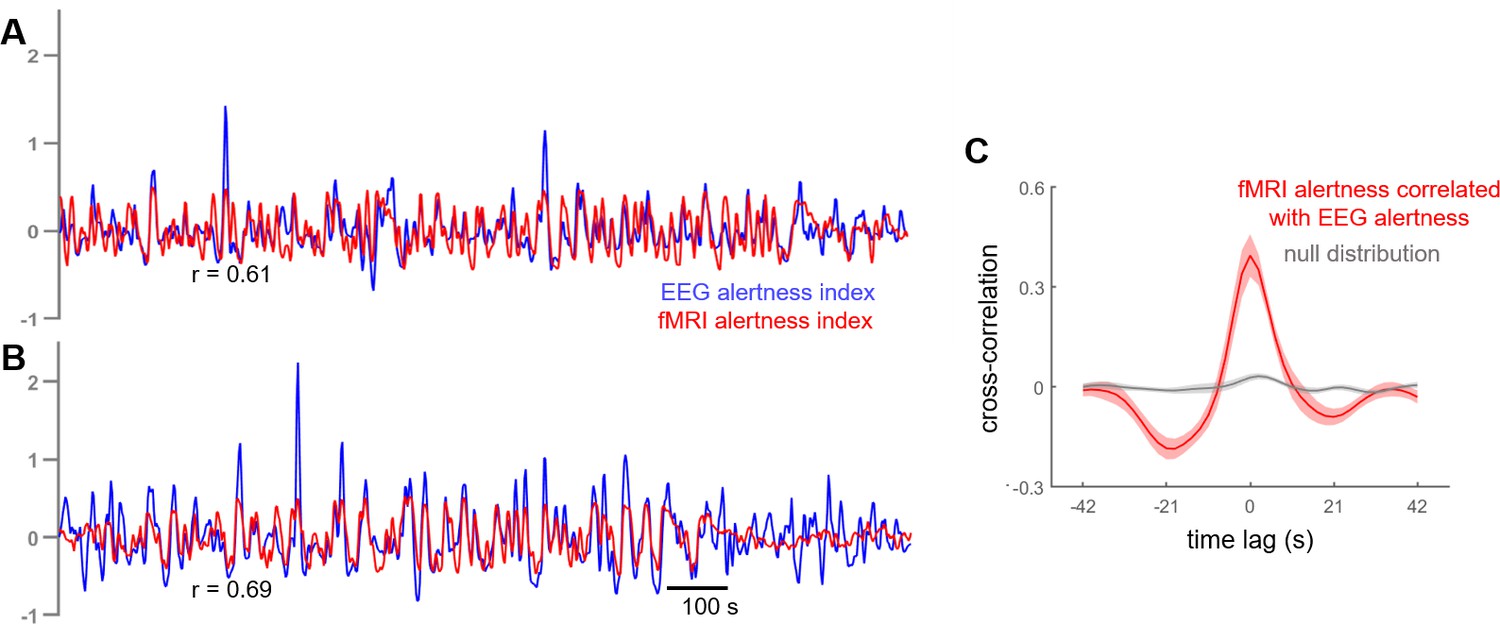
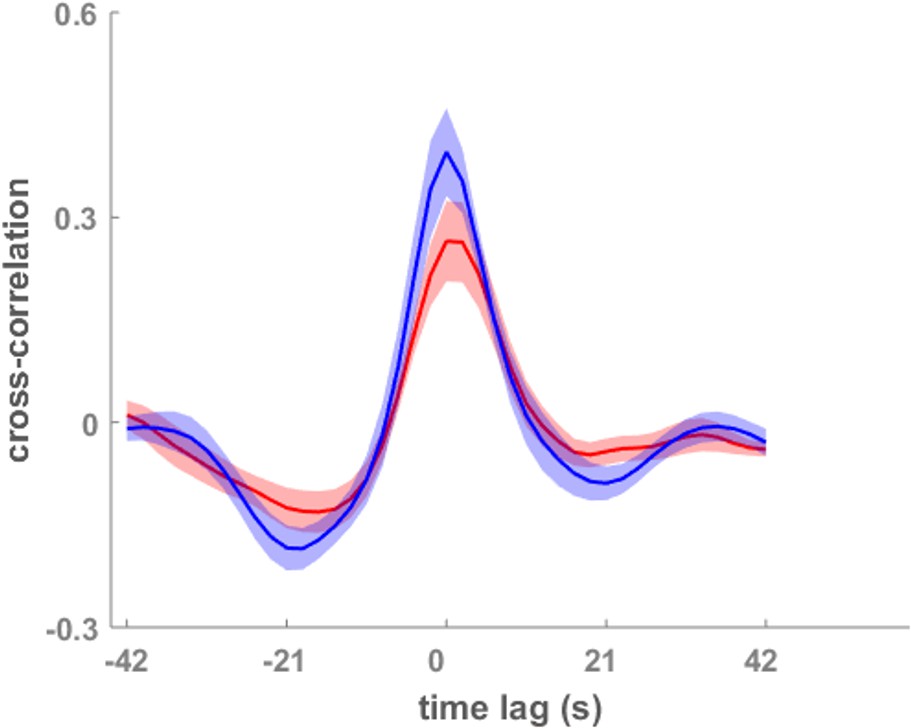
Cross-correlation between estimated fMRI alertness index and measured EEG alertness index.
(A, B) fMRI alertness index (red), superimposed on the EEG alertness index (blue), for two example scans. Note that the EEG data from these scans was not used in the creation of their fMRI alertness time courses, and are only used to evaluate the ability of the fMRI alertness index to track electrophysiological arousal. (C) Temporal cross-correlation between the fMRI alertness index and EEG alertness index (mean ± SE, n = 12 scans; red) together with a null distribution (gray) constructed for statistical comparison (see Materials and methods).
Figure 2—figure supplement 1
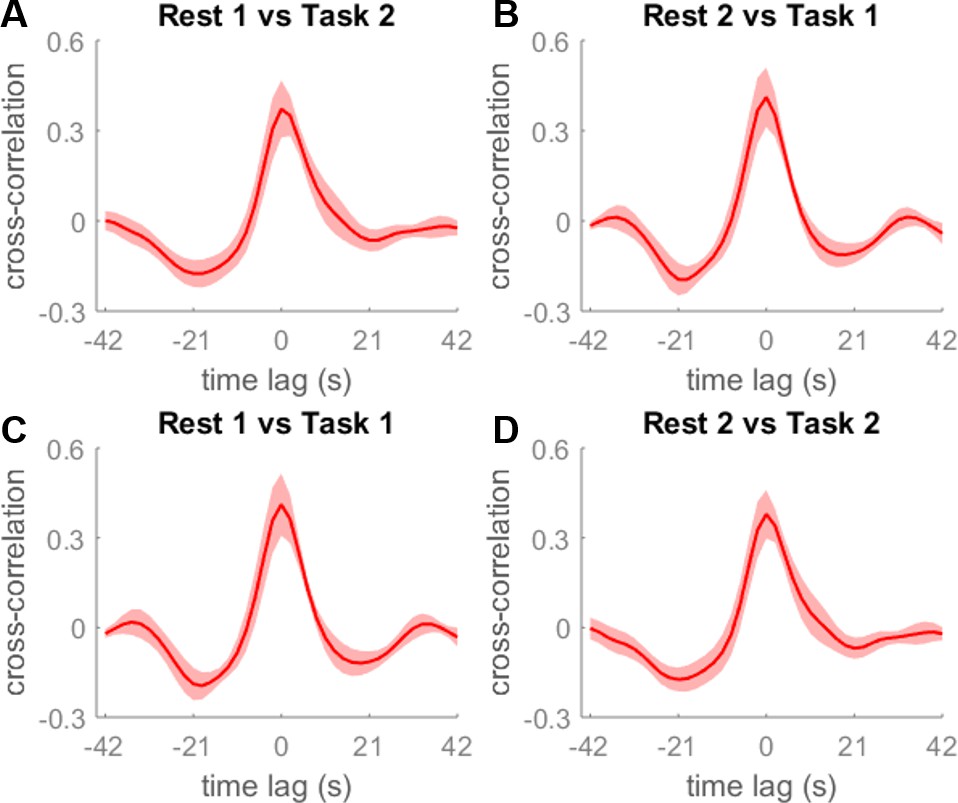
Further analysis of the reliability and across-subject generalizability of the alertness estimation approach.
Subjects were broken into sub-groups (Supplementary file 2) such that the two train/test comparisons shown in (A, B) involved disjoint sets of subjects in training and testing.(A, B) Across-subject testing of temporal cross-correlation between the fMRI alertness index and EEG alertness index, across subjects in different groups (mean ± SE, n = 6 scans). (C, D) Between-subject testing of temporal cross-correlation between the fMRI alertness index and EEG alertness index from subjects in the same groups (mean ± SE, n = 6 scans).
Figure 2—figure supplement 2
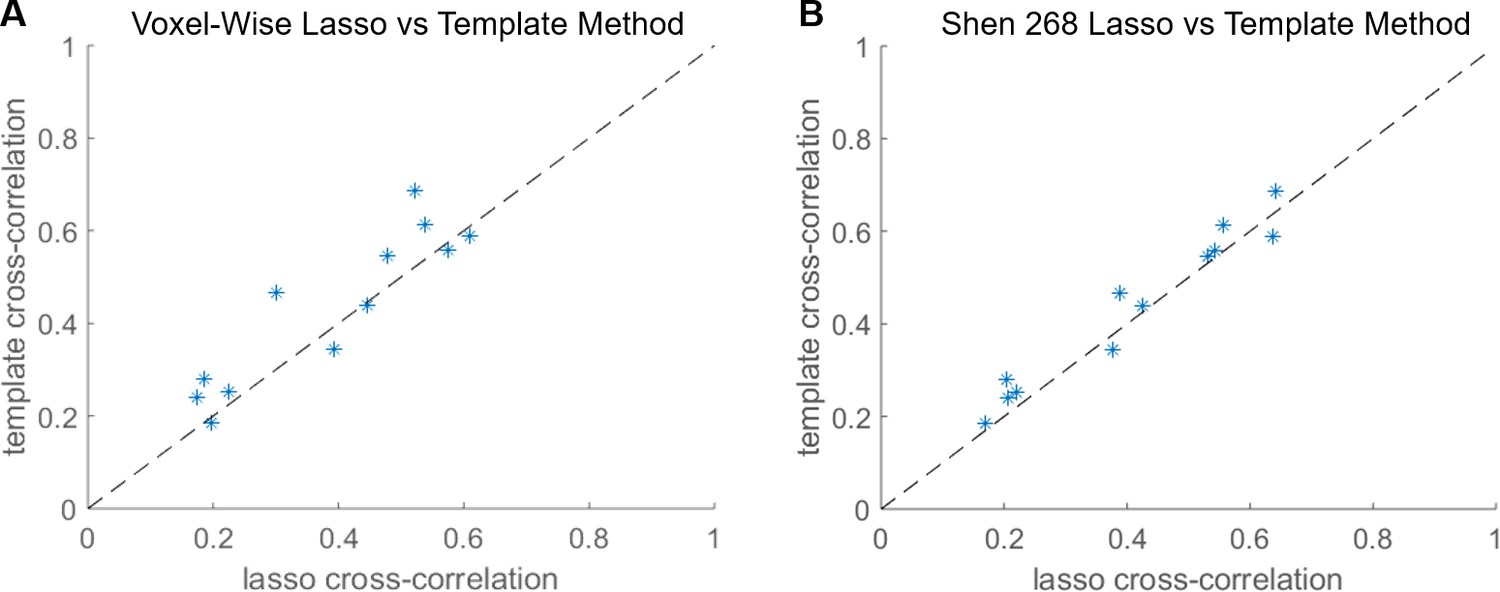
Lasso regression model for alertness prediction.
Maximum temporal cross-correlation of the EEG alertness index with the fMRI alertness index, where the latter is predicted from lasso regression models (x-axis of each plot) or the template approach (y-axis). For the lasso, results are shown for models whose input consisted of (A) voxelwise fMRI time courses and (B) ROI time courses extracted from the Shen 268 atlas.
Figure 2—figure supplement 3
Model performance when trained on task data and tested on resting-state data.
A template map derived from the task fMRI scans was applied to the resting-state data, where the cross-correlation with the EEG alertness index was calculated (red). For reference, the original analysis (in which the template is trained on resting-state data and applied to the task data, also shown in Figure 2C, is superimposed in blue).
Figure 3
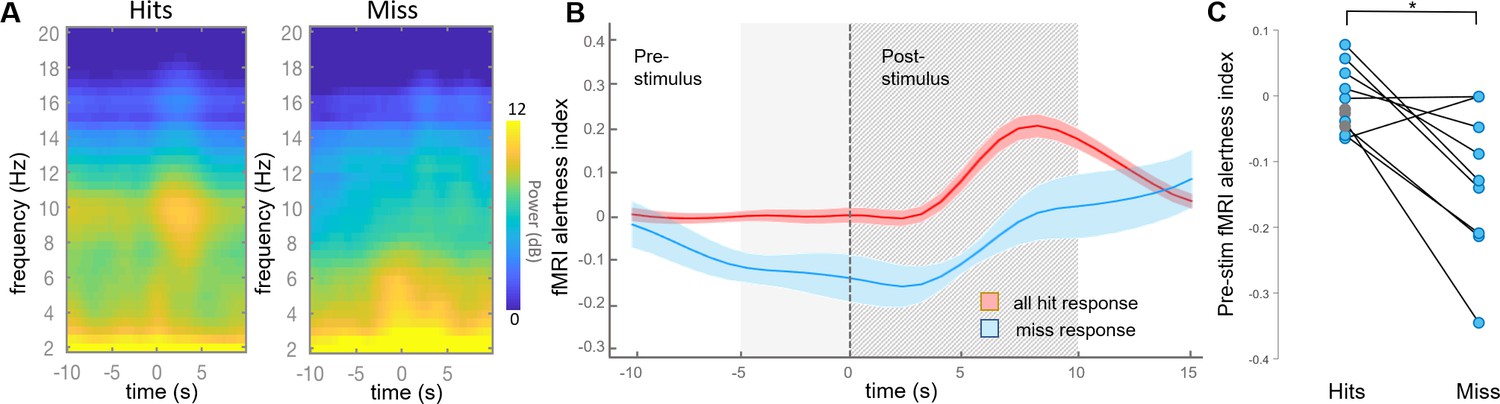
fMRI alertness index differentiates between auditory task response (hit) and misses.
(A) Event-locked EEG spectrogram for hits and misses. During hits, the elevated power in the alpha band may signify higher alertness; during misses, lower levels of alpha and increased power in lower frequencies suggest lower alertness. Time = 0 corresponds to stimulus onset. (B) Event-locked fMRI alertness index. Within each subject, the fMRI alertness index surrounding each stimulus was averaged across trials with hits (red) and misses (blue), and the across-subject means are represented by solid lines (shaded area is standard error; n = 12 scans for hits, n = 9 scans for misses). Across subjects, the fMRI alertness index predicted significantly greater levels of alertness in hits compared to misses, both within the pre-stimulus interval (5 s prior to stimulus onset; light gray region) and post-stimulus interval (10 s after stimulus onset; striped gray region). A wider time interval is shown for more complete visualization. (C) Visualization of individual subjects’ effects. Within individual scans, the fMRI alertness index was averaged within the 5 s pre-stimulus interval of each trial. Scans with only ‘hits’ are marked as gray circles; no scans had only misses. Within subjects who had both hits and misses, a significant difference in the pre-stimulus fMRI alertness index was found (p=0.01, paired t-test; d = 1.11).
Figure 4 with 5 supplements
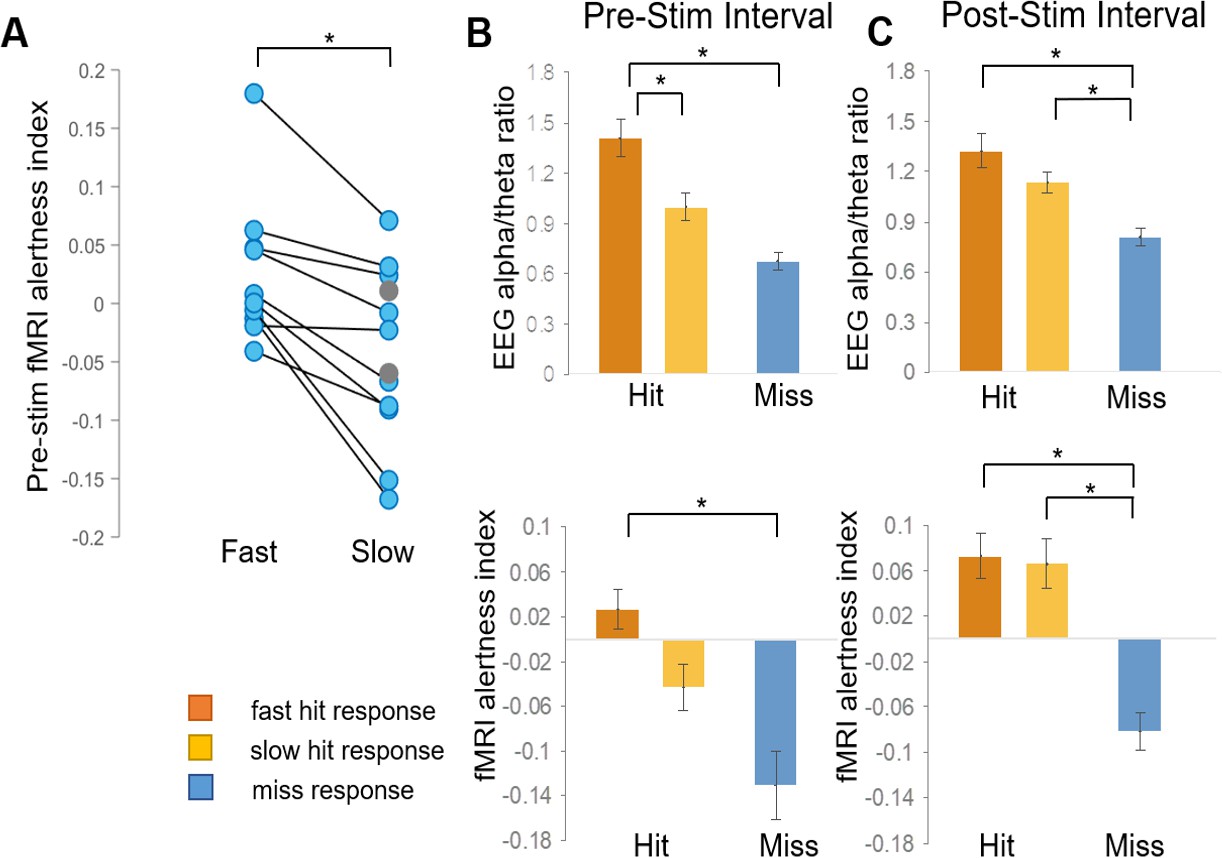
fMRI alertness index differentiates between trials with fast and slow reaction times.
(A) Within individual subjects, the pre-stimulus fMRI alertness index was averaged across fast and slow reaction-time trials. Subjects with only ‘slow hits’ are marked as gray circles (none had only fast hits). There was a significant difference between fast and slow hits within subjects who exhibited both fast and slow responses (p=0.001, paired t-test; d = 1.43). (B) Three types of behavioral responses (fast hit, slow hit, and miss) were examined for the fMRI alertness index, as well as the EEG alpha/theta ratio for comparison. In the pre-stimulus interval, both the EEG alpha/theta ratio and the fMRI alertness index showed a main effect of behavioral response across subjects; p<0.05, (one-way ANOVA). Tukey–Kramer post hoc tests, controlled for multiple comparisons, indicated pairwise differences for fast hits (orange) versus slow hits (yellow) for EEG and between fast hits and misses (blue) for both EEG and fMRI (*p<0.05). (C) In the post-stimulus interval, a main effect of behavioral response was also found for both EEG and fMRI, and post-hoc tests indicated significant differences in both fast hits and slow hits versus misses (*p<0.05). Error bars represent standard error.
Figure 4—figure supplement 1
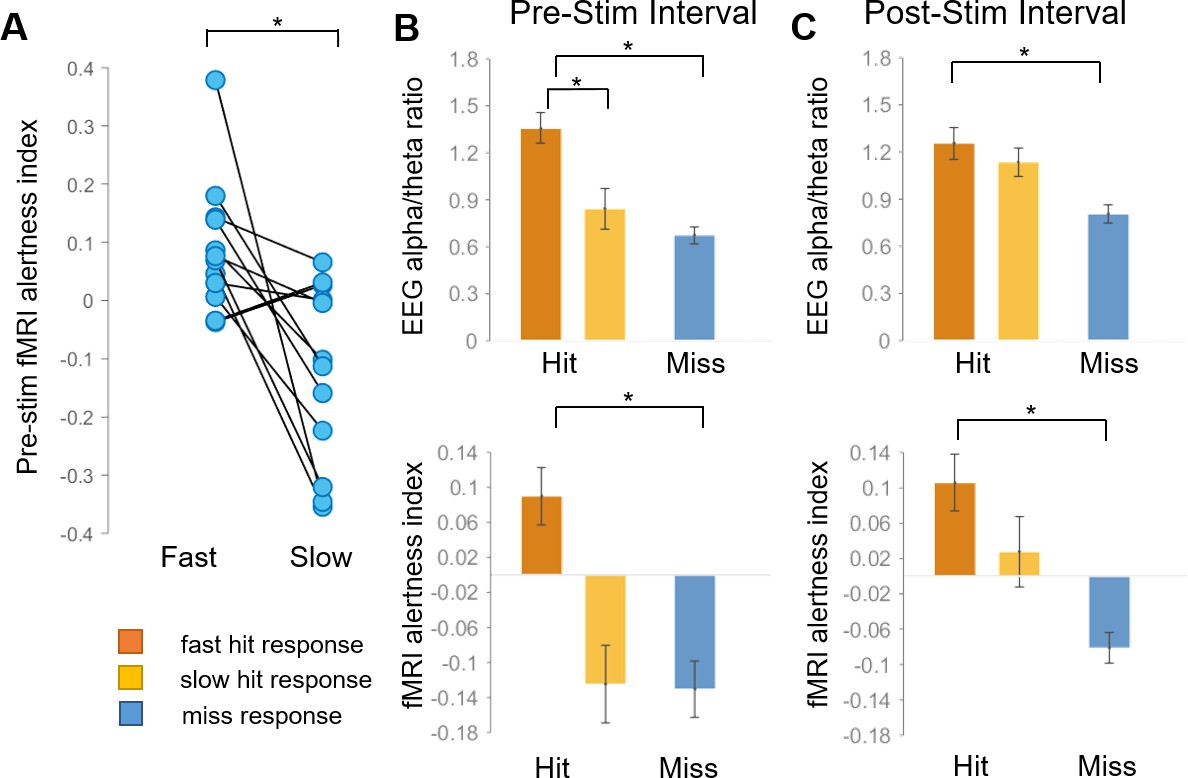
fMRI alertness index differentiates between the 10% fastest and slowest reaction times in each individual subject.
(A) Within individual scans, the fMRI alertness index was averaged within the pre-stimulus interval, and separately within the 10% of each subject’s fastest and slowest response-time trials. Within scans, significant differences were found in the pre-stimulus fMRI alertness index between these fast vs. slow responses (*p=0.007; paired t-test; d = 0.95). (B, C) The analysis of Figure 4B,C was repeated using the 10% of subjects’ slowest and fastest responses to define the ‘fast hit’ (orange) and ‘slow hit’ (yellow) trials.
Figure 4—figure supplement 2
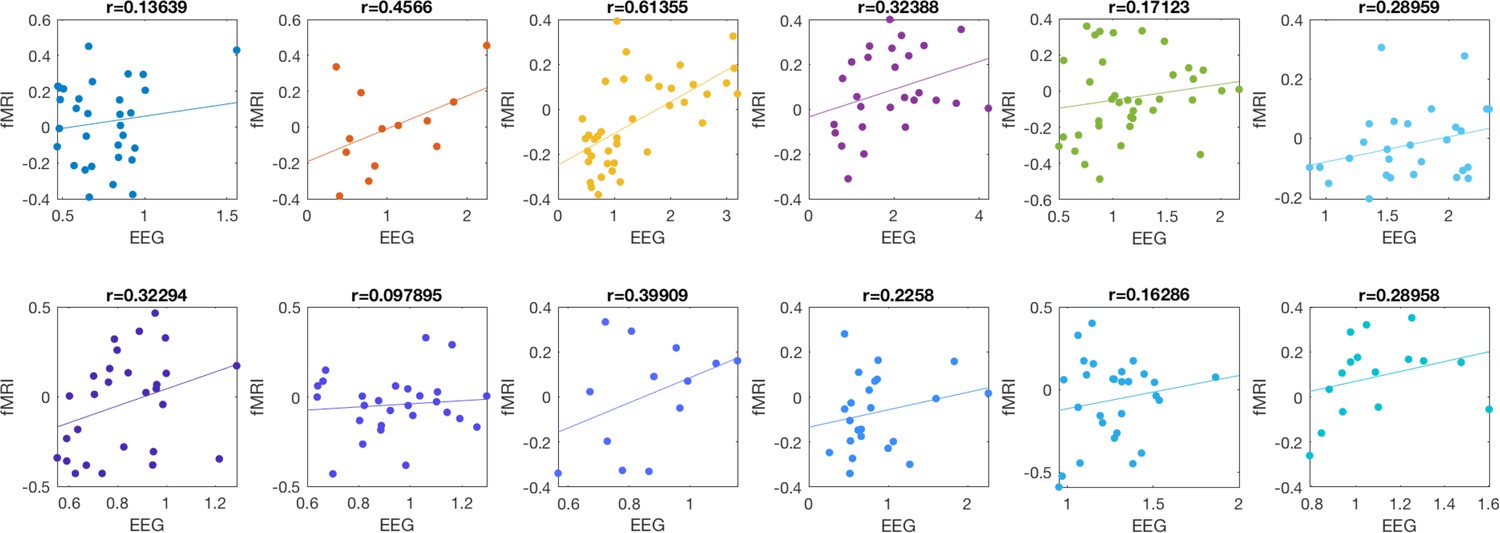
Trial-by-trial correspondence between EEG alpha/theta power and fMRI alertness index during pre-stimulus interval.
To account for hemodynamic delays, the EEG alpha/theta power and fMRI alertness index were calculated in time-interval offset from one another: (−5.16 s to 2.64 s for EEG and −1.8 s to +0.72 s for fMRI, where t = 0 represents stimulus onset). Each plot corresponds to a subject, and each datapoint corresponds to a trial. Only trials with behavioral responses (hits) are shown. Here, the EEG alpha/theta ratio was not convolved with a hemodynamic response function and is presented in its original units.
Figure 4—figure supplement 3
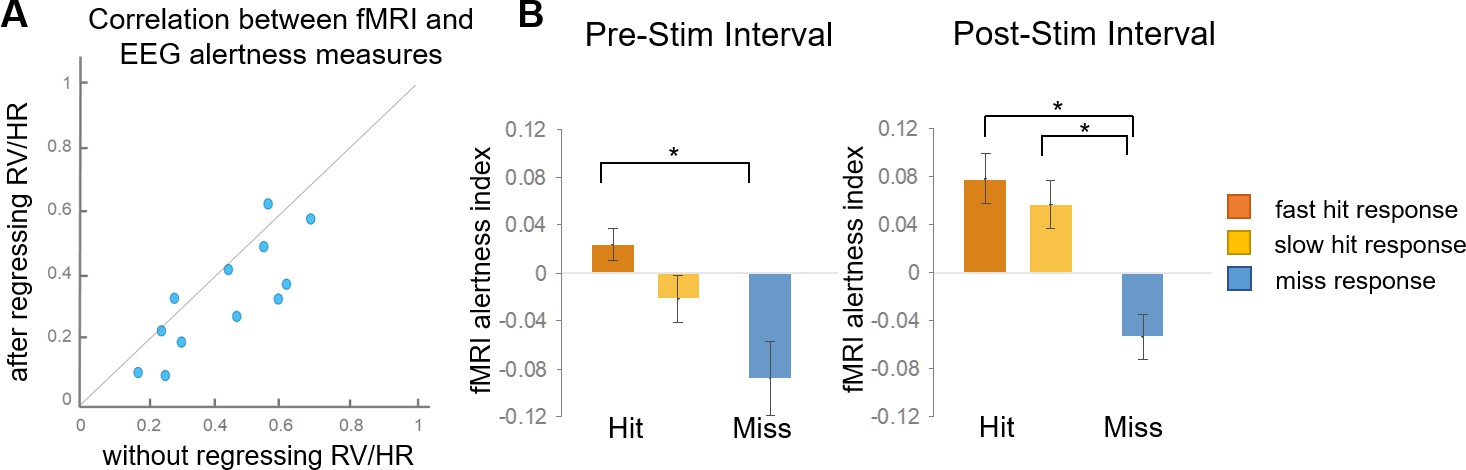
Effects of regressing out low-frequency respiratory and cardiac fluctuations from the fMRI signal.
(A) For each scan, the agreement between the fMRI alertness index and the EEG alertness index was quantified before and after regressing out variations linked with low-frequency RV and HR. (B) After regressing out physiology (RV and HR), the fMRI alertness index still differed significantly between trial types in both the pre-stimulus (F(2) = 4.58, p=0.02) and post- stimulus (F(2) = 8.92, p=0.1e-2) intervals. Post hoc analyses were performed using Tukey–Kramer method for multiple comparisons (*p<0.05). Error bars shown represent standard error. (Compare to Figure 4B for results from data from which physiological waveforms were not removed.)
Figure 4—figure supplement 4
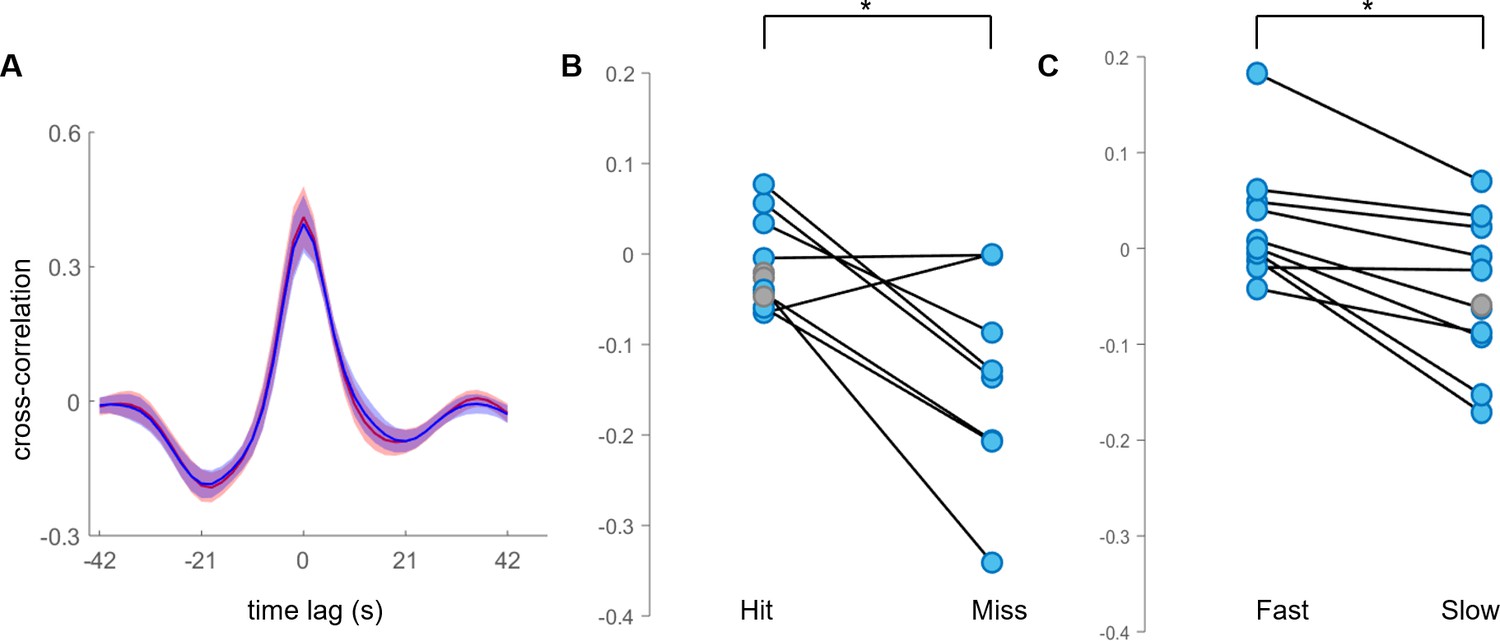
Evaluation of fMRI alertness index with high-motion subjects removed.
(A) Temporal cross-correlation between the fMRI alertness index and EEG alertness index in all subjects (mean ± SE, n = 12 scans; blue) and only those subjects without high motion (mean ± SE, n = 11 scans; red). (B) Within individual scans, the fMRI alertness index was averaged within the 5 s pre-stimulus interval of each trial. At the group level, significant differences were found between hits and misses (p=0.015; paired t-test, d = 1.29). (C) Within individual subjects, the pre-stimulus fMRI alertness index was averaged across fast and slow reaction-time trials. There was a significant difference between fast and slow hits across subjects (p=0.002; paired t-test, d = 0.94).
Figure 4—figure supplement 5
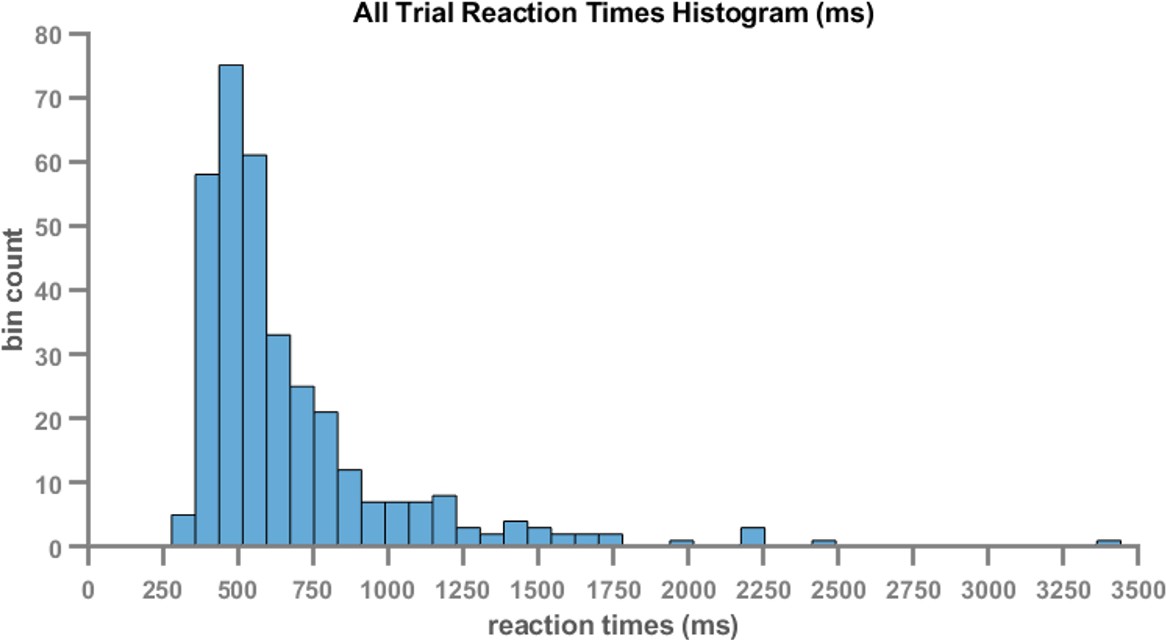
Reaction time histogram.
Histogram across all subjects’ reaction times, pooled across all trials. We then additionally examined whether the fMRI alertness index is modulated across all three trial types (fast, slow, and missed trials), performing an identical analysis on the EEG alpha/theta ratio for comparison. This was calculated using one-way ANOVA, with post hoc pairwise tests controlled for multiple comparisons (Tukey–Kramer method). In the pre-stimulus interval, both fMRI and EEG had a main effect of behavioral response (EEG: F(2) = 13.60, p=7.45e-05; fMRI: F(2) = 8.31, p=0.15e-02; Figure 4B). Post hoc analyses indicated a significantly elevated alpha/theta ratio (corresponding to higher electrophysiological alertness) in ‘fast hits’ versus ‘misses’, and ‘fast hits’ versus ‘slow hits’ with EEG, and for ‘fast hits’ versus ‘misses’ with fMRI.
Figure 5
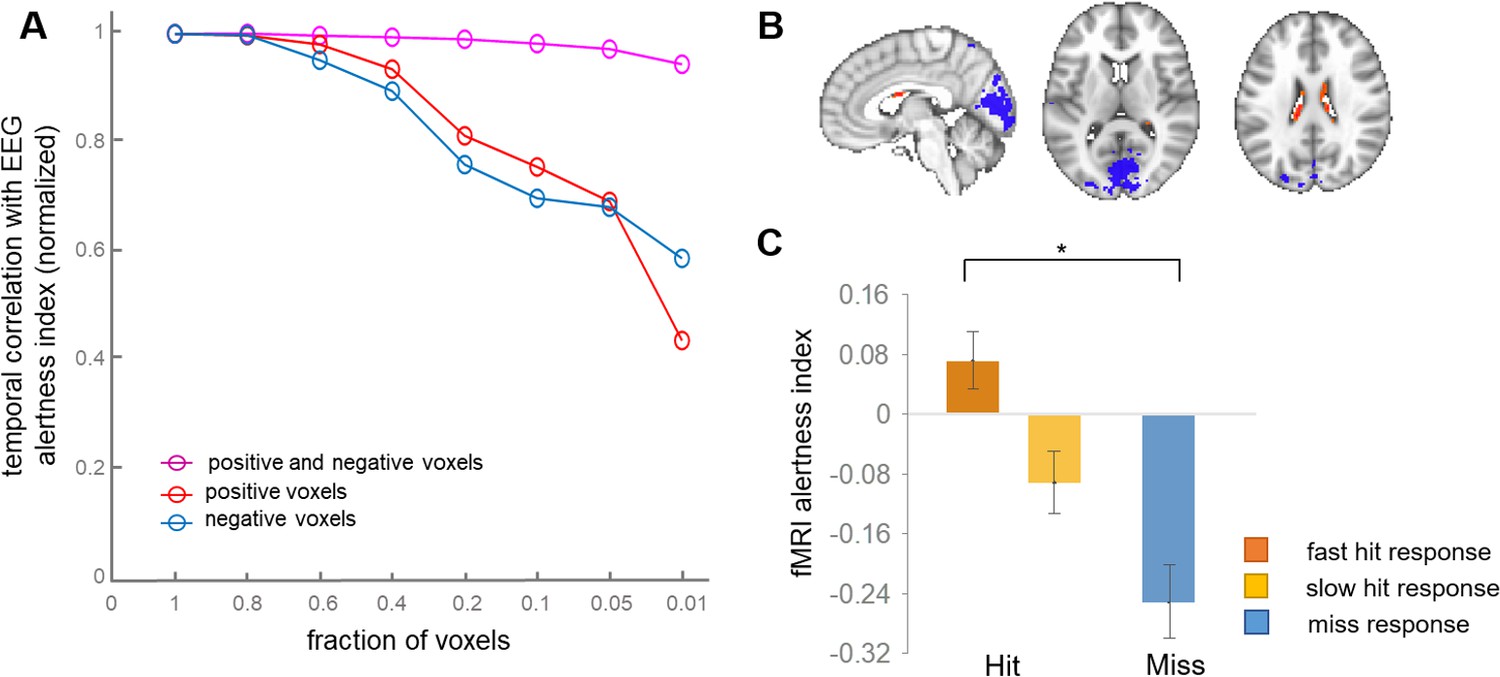
Effects of spatially reducing the vigilance template.
(A) The template was successively reduced to retain the indicated fraction of highest-magnitude voxels drawn from the set of negative, positive, or both negative- and positive-signed voxels. These reduced voxel sets were used as templates for calculating the fMRI alertness index in each scan. The x-axis indicates the fraction of voxels relative to the whole-brain template; that is, at x = 0.2, we used the highest 20% of positive values (red) and the highest 20% of negative voxels (blue), then combined them to make a joint positive and negative template (magenta). To focus on relative effects, all three lines were normalized to their value at the fraction of 1.0. (B) Template map produced by retaining only the top 1% of positive and negative voxels of the original whole-brain template, respectively. (C) The pre-stimulus fMRI alertness index, generated from this reduced (‘1%”) template, for fast, slow, and missed trials (see Figure 4B for analogous results using the whole-brain template).
Figure 6 with 1 supplement
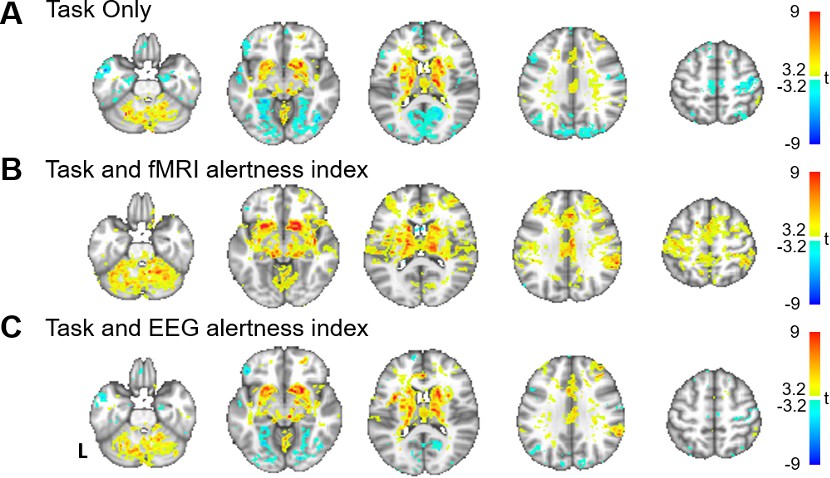
Modeling alertness fluctuations in fMRI analysis impacts statistical inference of task-evoked activation.
General linear model analyses of responses to event-related auditory task. For each subject, beta maps were calculated for event-related responses to the auditory stimuli, resulting in group-level t-statistics (voxelwise one-sample t-test) for (A) a model that includes regressors only for the task stimuli; (B) a model that includes task regressors along with the fMRI alertness index as a covariate; and (C) a model that includes task regressors along with the EEG alertness index as a covariate.
Figure 6—figure supplement 1
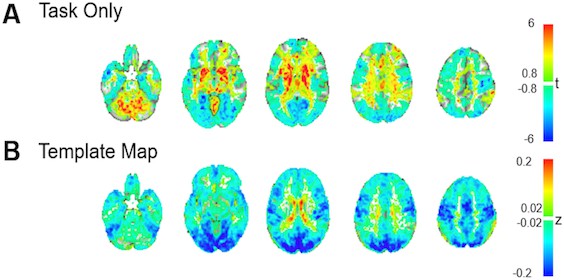
Comparison between event-related task response and vigilance template.
General linear model analysis of the event-related task responses (A) was accompanied by negative BOLD signal changes in a number of cortical regions, resembling the pattern of correlations with an EEG index of alertness (B).
Additional files
-
Supplementary file 1
Scan details.
‘x’ indicates whether a subject contributed an eyes-closed resting state (ECR) scan and/or an eyes-closed auditory task (ECT) scan. Some subjects did not complete both ECR and ECT scans.
- https://cdn.elifesciences.org/articles/62376/elife-62376-supp1-v1.xlsx
-
Supplementary file 2
Data subsets for cross-validation of template reproducibility.
Resting- state scans and task scans were broken down into two non-overlapping subgroups so that one subject’s rest and task scans did not cross into a different group.
- https://cdn.elifesciences.org/articles/62376/elife-62376-supp2-v1.xlsx
-
Supplementary file 3
Maximum frame-to-frame displacement for each subject’s rest and task scans, as calculated during the motion coregistration pre-processing step.
- https://cdn.elifesciences.org/articles/62376/elife-62376-supp3-v1.xlsx
-
Transparent reporting form
- https://cdn.elifesciences.org/articles/62376/elife-62376-transrepform-v1.pdf
Download links
A two-part list of links to download the article, or parts of the article, in various formats.
Downloads (link to download the article as PDF)
Open citations (links to open the citations from this article in various online reference manager services)
Cite this article (links to download the citations from this article in formats compatible with various reference manager tools)
fMRI-based detection of alertness predicts behavioral response variability
eLife 10:e62376.
https://doi.org/10.7554/eLife.62376


