Runx2-Twist1 interaction coordinates cranial neural crest guidance of soft palate myogenesis
- Center for Craniofacial Molecular Biology, University of Southern California, Los Angeles, United States
- USC Libraries Bioinformatics Services, University of Southern California, Los Angeles, United States
Figures
Figure 1 with 3 supplements
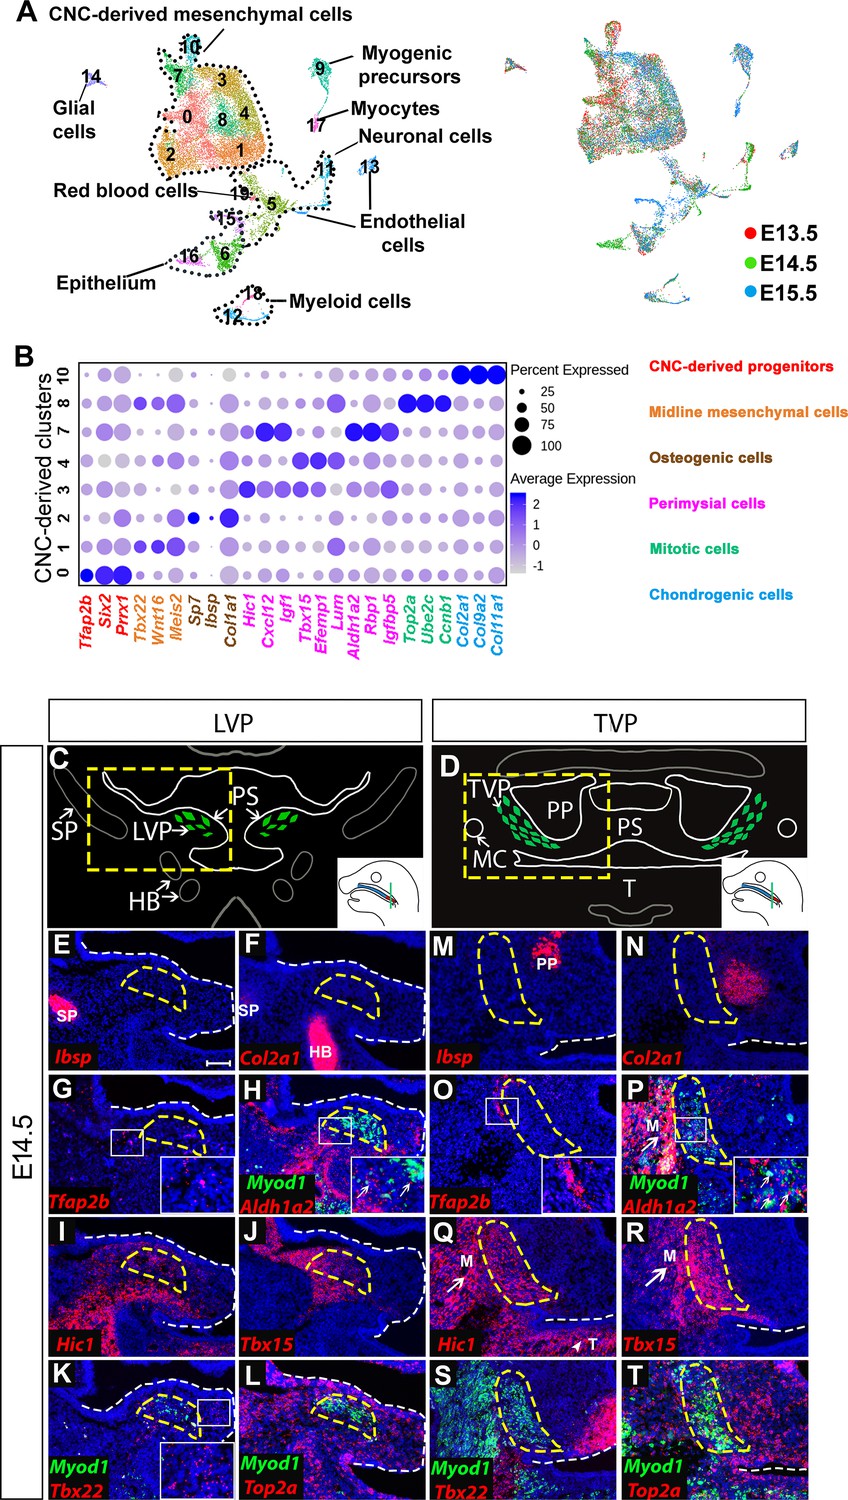
Analysis of distinct populations of cranial neural crest (CNC)-derived mesenchymal cells in the soft palate during development.
(A) UMAP plot integration analysis of mouse soft palate cells from E13.5, E14.5, and E15.5 based on clusters (left) and different developmental stages (right). (B) DotPlot of signature genes in CNC-derived clusters. The color code of signature genes corresponds to the colors of the names of distinct cell populations in the right panel. (C) Schematic drawings of Myod1 (green), styloid process of temporal bone (SP) and hyoid bone (HB) on coronal sections of the levator veli palatini (LVP) region and (D) Myod1 (green), tongue (T), pterygoid plate (PP), and Meckel’s cartilage (MC) on coronal sections of the tensor veli palatini (TVP) region of E14.5 control mice. PS, Palatal shelves. Yellow dashed boxes in (C) and (D) are enlarged and analyzed for expression patterns of cluster-specific markers in (E–L) and (M–T), respectively. (E–L) RNAscope in situ hybridization for Myod1 and selected marker genes from each cluster of CNC-derived cells on coronal sections of the LVP region. (M–T) RNAscope in situ hybridization for Myod1 and selected marker genes from each cluster of CNC-derived cells in the TVP region. White arrows point to masseter muscles (M) in (P, Q, R). White arrowhead points to tongue (T) in (Q). Yellow dashed lines outline the myogenic sites (LVP in E-L; TVP in M-T). White dashed lines outline the palatal shelf. Boxed areas are enlarged in the insets. Scale bar in E indicates 100 μm for E-T.
Figure 1—figure supplement 1
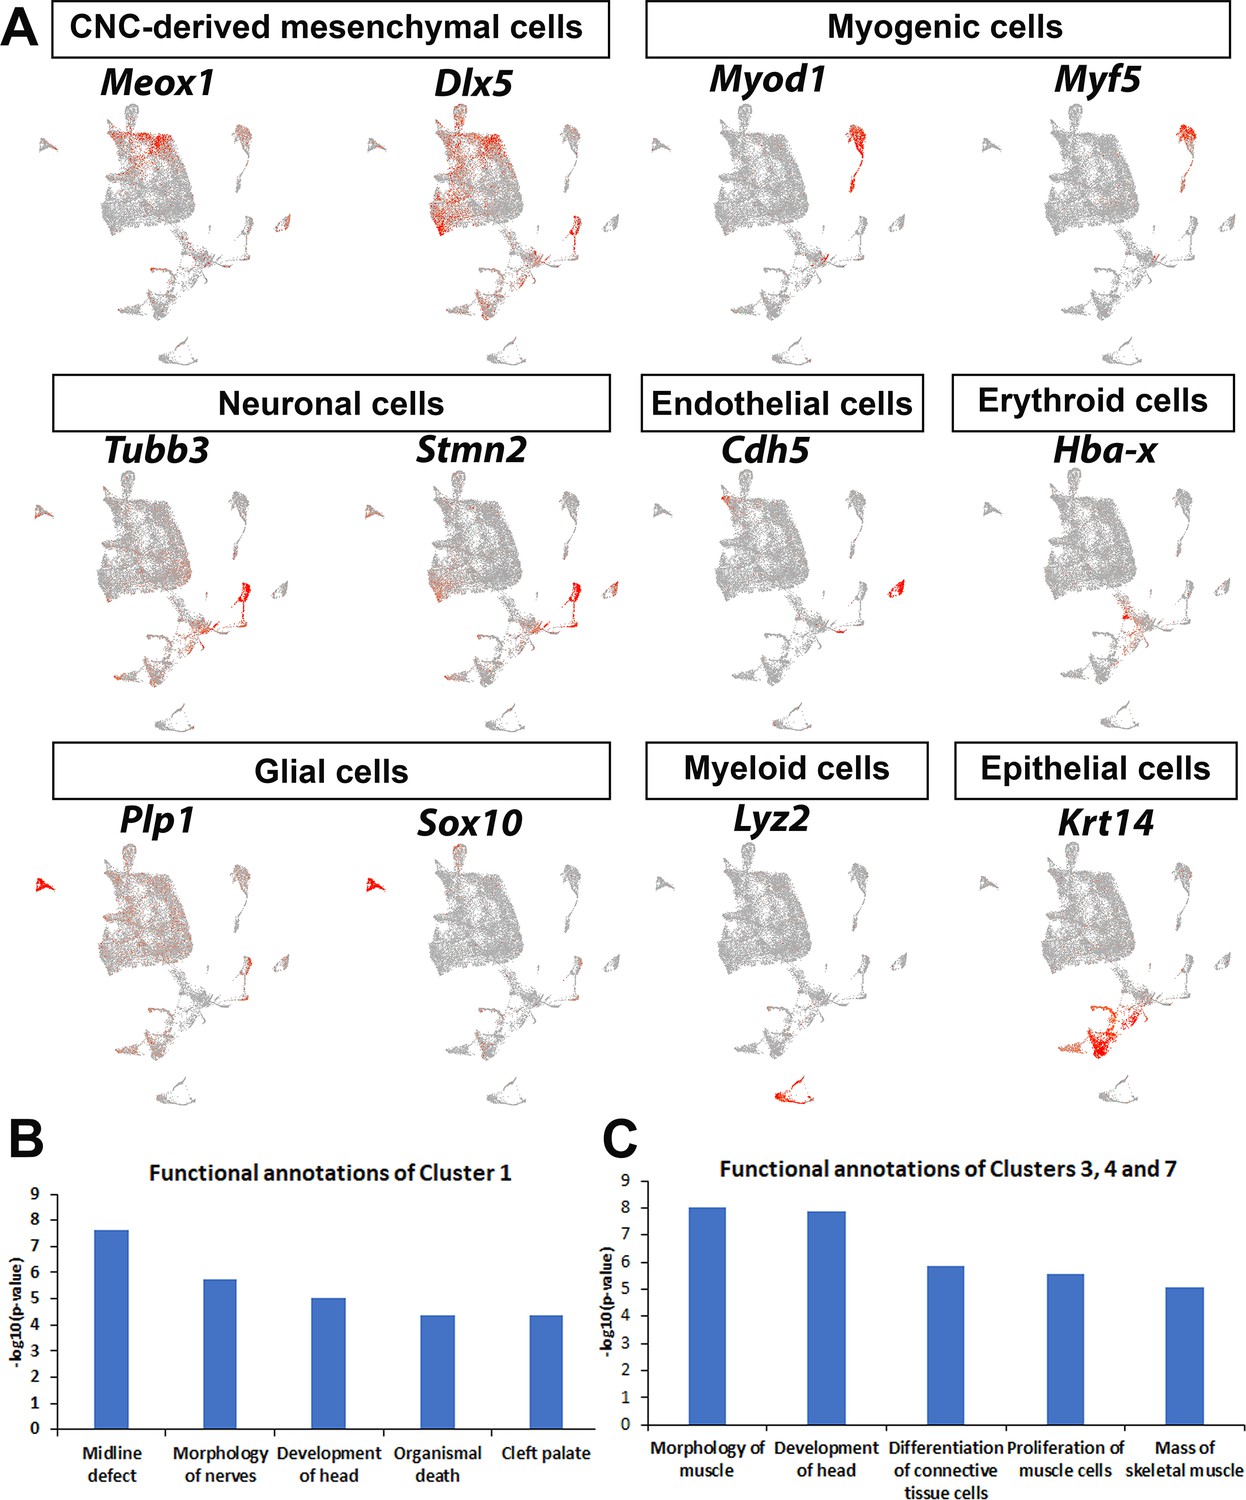
Identification and characterization of different cellular populations in the soft palate from E13.5 to E15.5.
(A) Different types of cells were identified in the soft palate region, including cranial neural crest (CNC)-derived mesenchymal cells (Meox1+, Dlx5+), myogenic cells (Myod1+, Myf5+), neuronal cells (Tubb3+, Stmn2+), endothelial cells (Cdh5+), erythroid cells (Hba-x+), glial cells (Plp1+, Sox10+), myeloid cells (Lyz2+), and epithelial cells (Krt14+). (B–C) Functional annotations of previously unidentified CNC-derived cell populations in the soft palate mesenchyme, B for Cluster 1 and C for Clusters 3, 4, and 7.
Figure 1—figure supplement 2
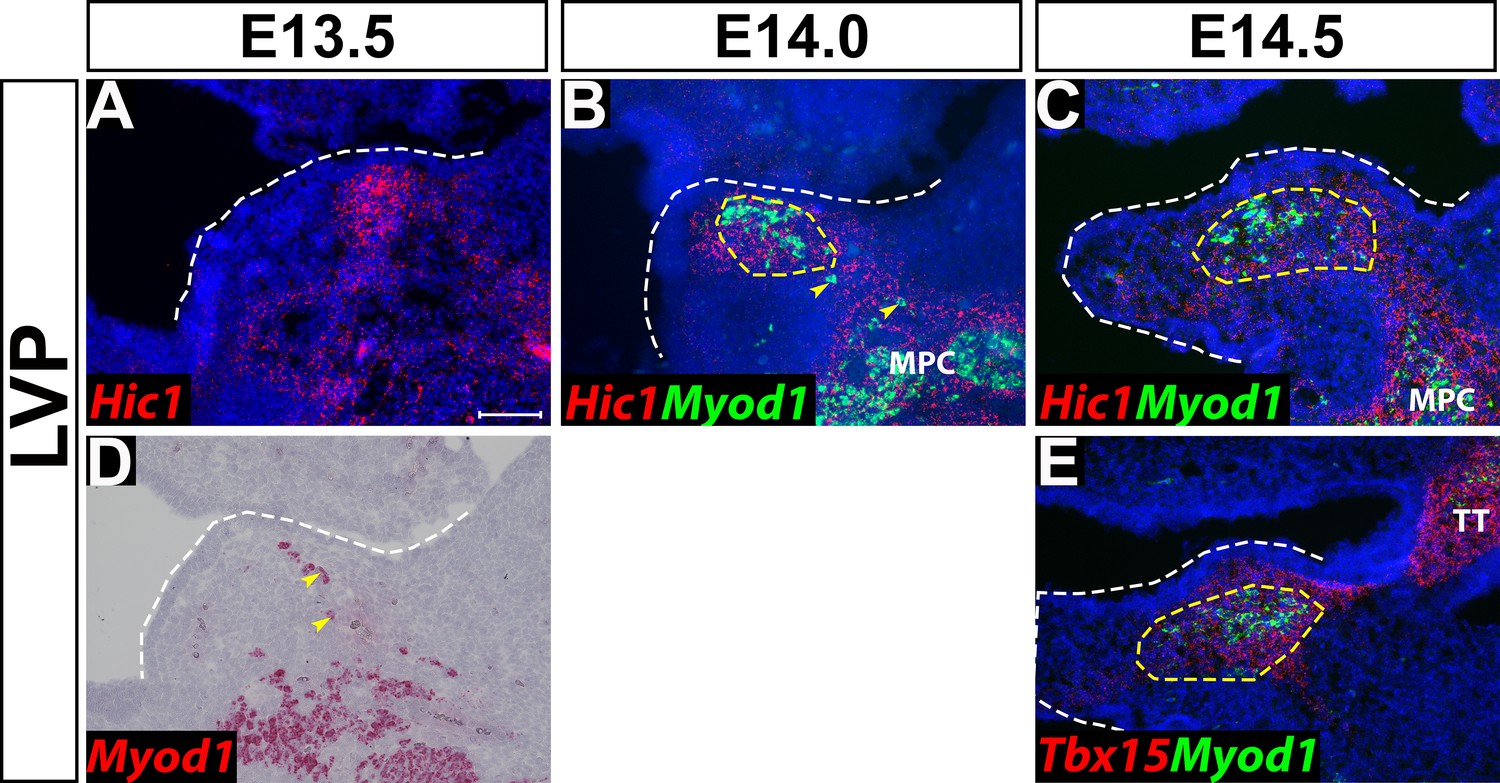
Hic1 and Tbx15 are expressed in cells surrounding other craniofacial muscles adjacent to the levator veli palatini (LVP) region.
(A–E) RNAscope in situ analysis of Myod1 and perimysial markers Hic1 and Tbx15 on coronal sections of the LVP region from E13.5 to E14.5. MPC: Middle pharyngeal constrictor. TT: Tensor tympani muscle. Yellow dashed lines outline the myogenic sites of the LVP. White dashed lines outline the palatal shelf. Yellow arrowheads point to migrating myogenic precursors. Scale bar in A indicates 100 µm for A-E.
Figure 1—figure supplement 3
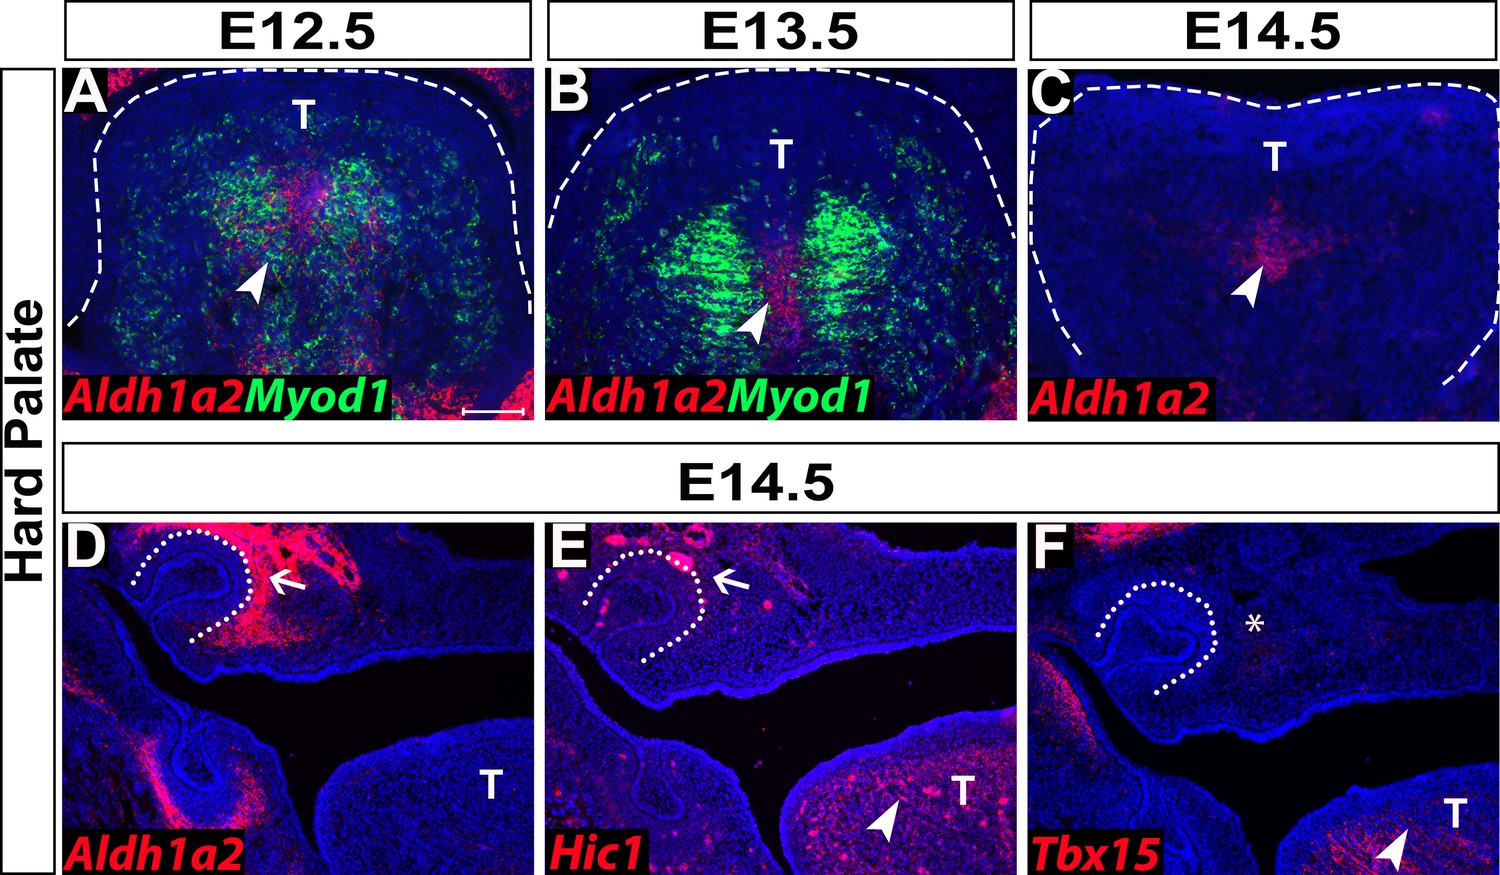
Expression of perimysial markers in the hard palate region.
(A–C) RNAscope in situ analysis of Myod1 and early perimysial marker Aldh1a2 on coronal sections of the tongue of control mice from E12.5 to E14.5. (D–F) RNAscope in situ analysis of perimysial markers Aldh1a2, Hic1, and Tbx15 on E14.5 coronal sections from the hard palate of control mice. White dashed lines outline the tongue. White dotted lines outline the tooth germ. White arrowheads point to expression of perimysial markers in the tongue. White arrows point to the expression of perimysial markers surrounding the tooth germ. White asterisk indicates the missing expression of Tbx15 in the hard palate region. T: Tongue. Scale bar in A indicates 100 µm for A-F.
Figure 2 with 1 supplement
Runx2 is expressed in cranial neural crest (CNC)-derived progenitors and perimysial cells during soft palate development.
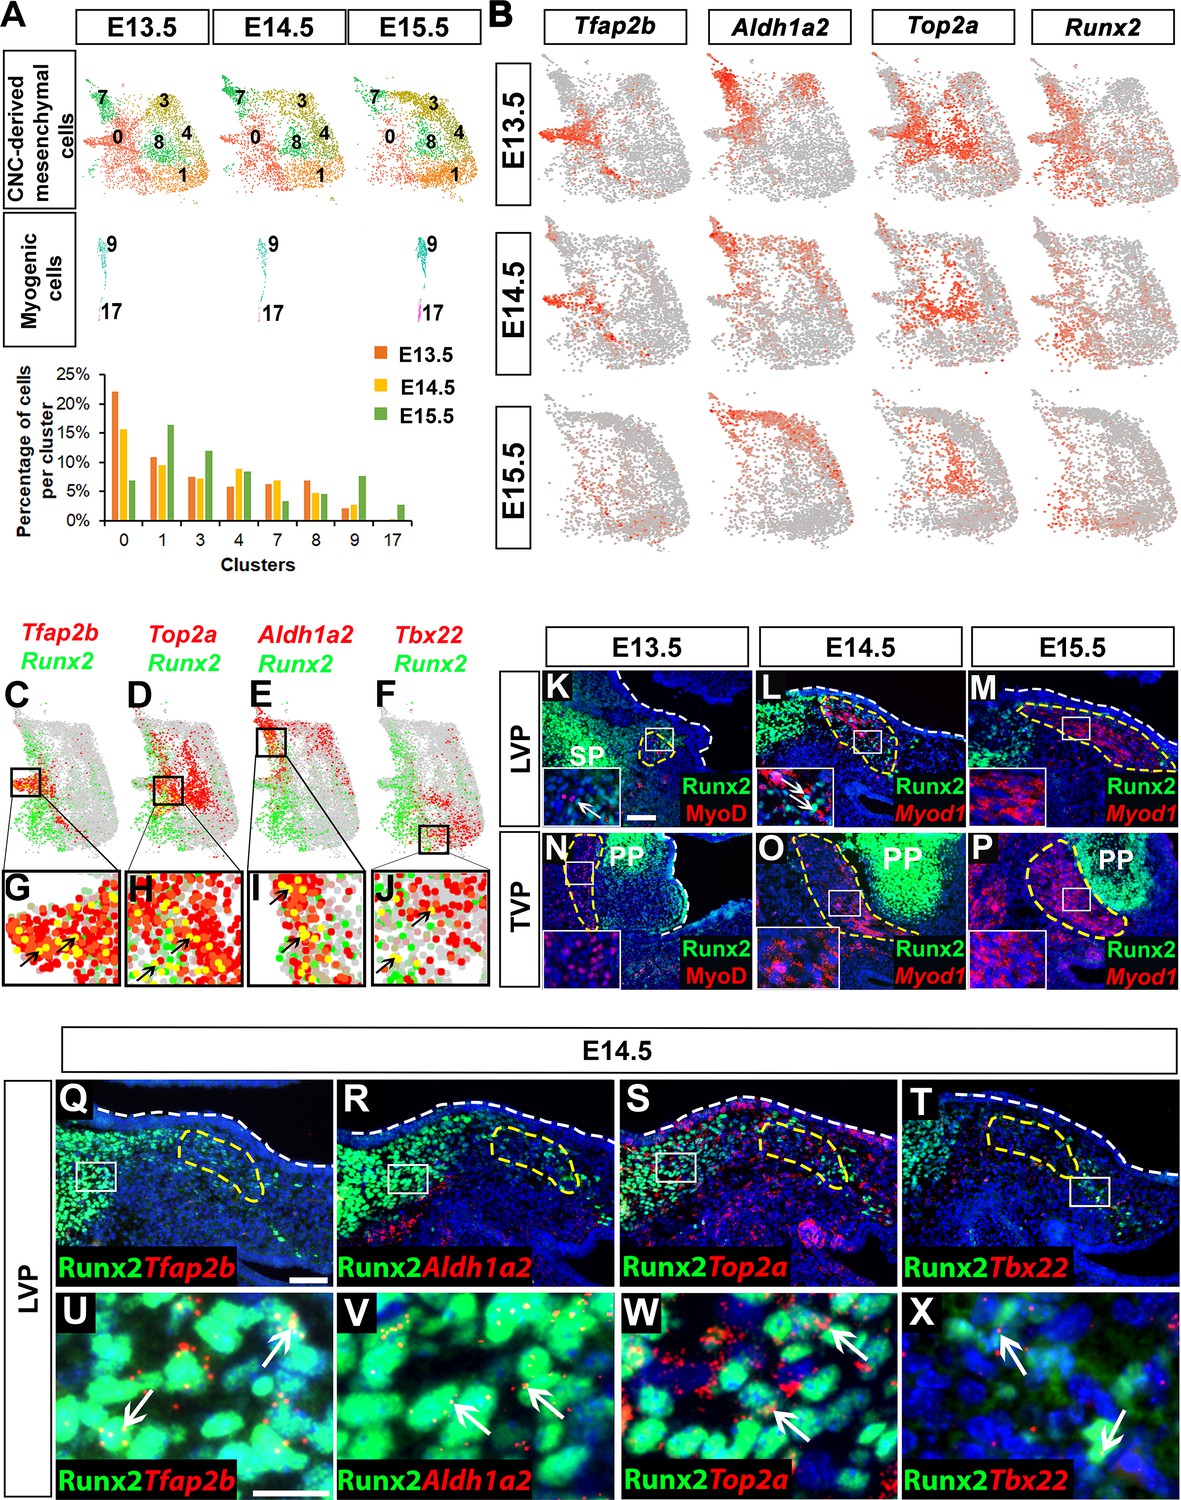
(A) Individual UMAP clustering of CNC-derived mesenchymal and myogenic cells at three different embryonic stages (E13.5, E14.5, and E15.5) from integration analysis (top and middle panel). Percentages of cells in different CNC-derived and myogenic clusters in control soft palates at E13.5, E14.5, and E15.5 based on the integrated analysis (bottom panel). (B) Expression patterns of marker genes that are expressed transiently during early stages of soft palate development. (C–J) Co-expression of Runx2 with cluster-specific markers Tfap2b, Top2a, Aldh1a2, Tbx22 in E13.5-E15.5 soft palate integration analysis. Boxed areas in (C–F) are enlarged in (G–J). Black arrows point to cells co-expressing Runx2 with individual cluster-specific markers. (K–P) Runx2 with myogenic markers MyoD or Myod1 on coronal sections of the tensor veli palatini (TVP) and levator veli palatini (LVP) regions of control mice at E13.5, E14.5, and E15.5. Boxes indicate regions shown at higher magnification in the insets. (Q–X) Co-localization of Runx2 with cluster-specific marker genes Tfap2b, Aldh1a2, Top2a, and Tbx22 on coronal sections of the LVP region of E14.5 control mice. Boxed areas in Q-T are enlarged in U-X. Yellow dashed lines in (K–T) outline the myogenic cells. White dashed lines outline the palatal shelf. Scale bars in K and Q indicate 100 μm for K-P and Q-T. Scale bar in U indicates 30 μm for U-X.
Figure 2—figure supplement 1
Cranial neural crest (CNC)-derived cells are heterogeneous and dynamic during soft palate development from E13.5 to E15.5.
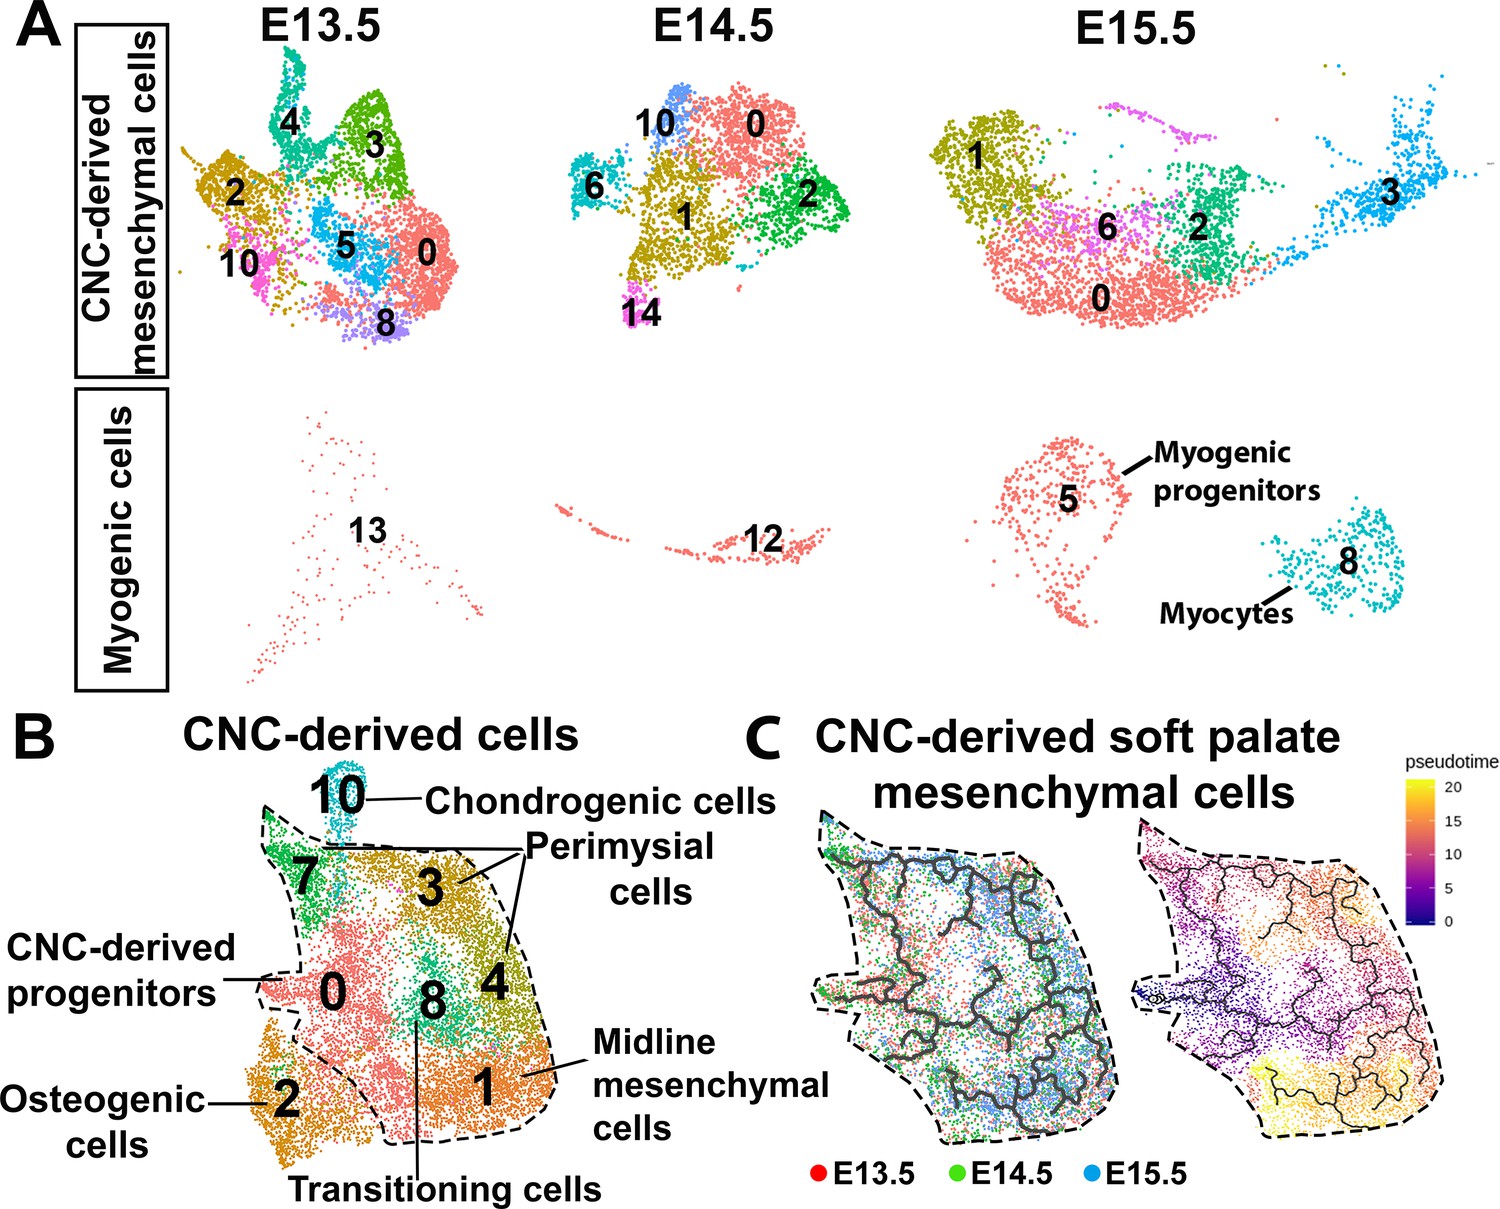
(A) UMAP plots of CNC-derived cells from soft palate mesenchyme and myogenic cells at E13.5, E14.5, and E15.5. (B) UMAP clustering of CNC-derived cells from E13.5-E15.5 in the soft palate. Black dashed line outlines the non-osteochondrogenic CNC-derived soft palate mesenchymal clusters. (C) Monocle three pseudotime trajectory analysis of CNC-derived soft palate mesenchymal cells showing the sequential fate determinations of CNC-derived cells. Left panel: pseudotime trajectory colored by stage; Right panel: pseudotime trajectory colored by timeline.
Figure 3 with 4 supplements
Deletion of Runx2 in cranial neural crest (CNC)-derived cells leads to craniofacial defects in the soft palate.
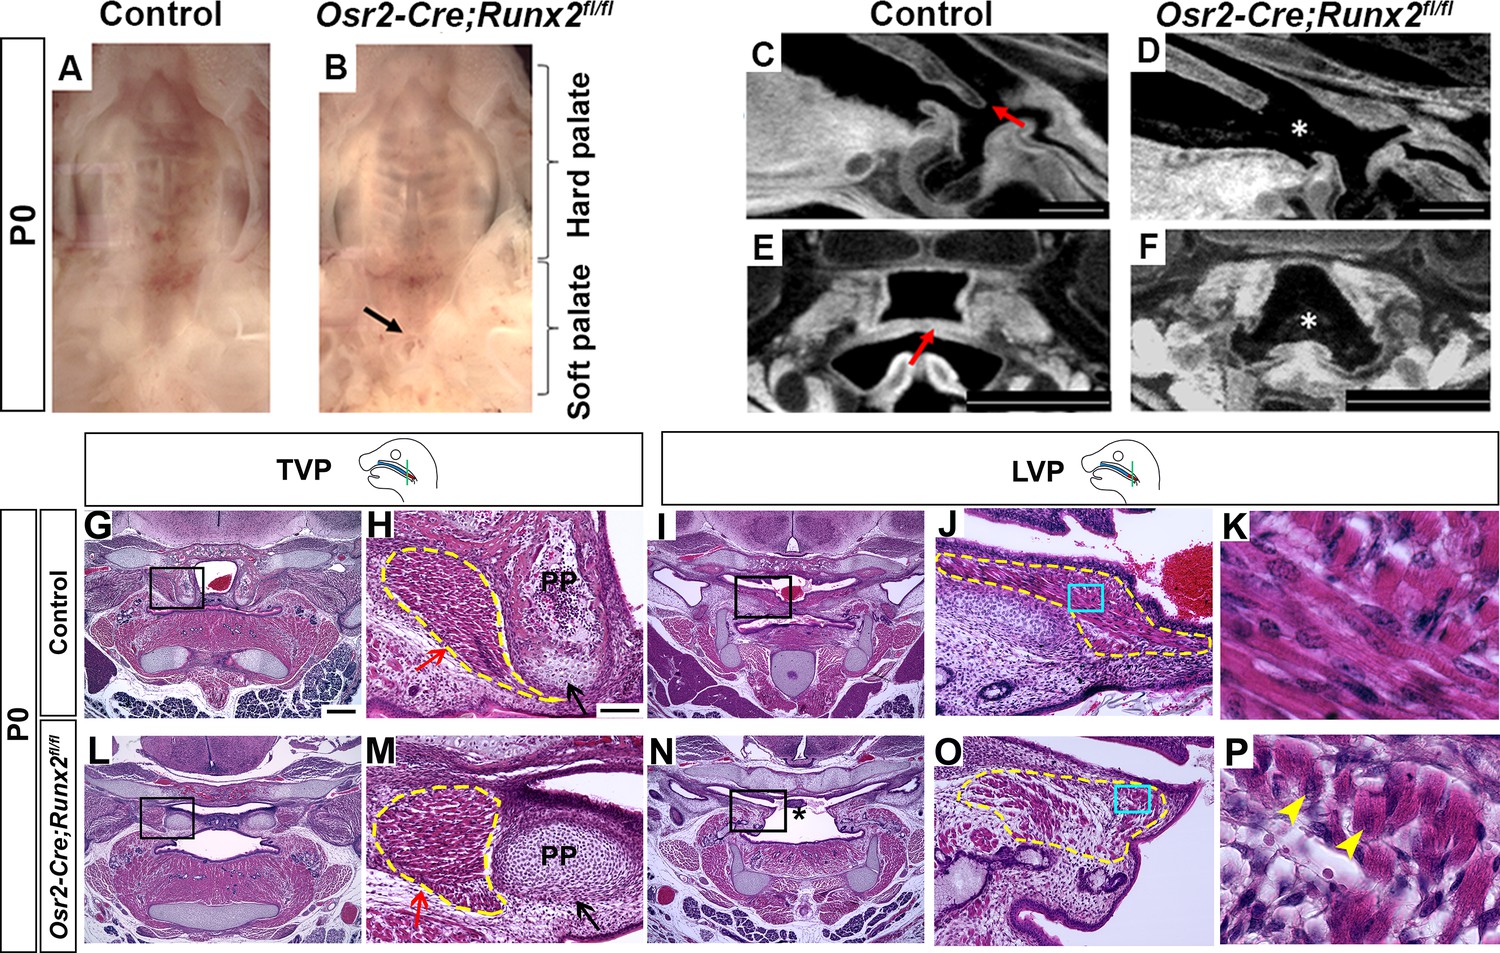
(A, B) Intraoral views of palates from control and Osr2-Cre;Runx2fl/fl mice at newborn stage (P0). Arrow indicates the cleft in the posterior part of the soft palate. (C–F) Sagittal (C–D) and coronal (E–F) views of microCT scans of newborn control and Osr2-Cre;Runx2fl/fl mice (N = 3). Red arrows indicate the normal soft palate, and asterisks indicate the cleft in the posterior part of soft palate. (G–P) H and E staining of soft palate coronal sections from control and Osr2-Cre;Runx2fl/fl mice at P0 (N = 5). Yellow dashed lines outline the soft palate muscles. Black and red arrows in H and M show the pterygoid plate and tensor veli palatini (TVP) defects, respectively, of Osr2-Cre;Runx2fl/fl mice. Asterisks in N indicate the cleft soft palate in the levator veli palatini (LVP) region of Osr2-Cre;Runx2fl/fl mice. Boxed areas in G, I, L, and N are enlarged in H, J, M, and O, respectively. Boxed areas in J and O are enlarged in K and P, respectively. Scale bars in C-D and E-F indicate 0.5 mm and 0.9 mm, respectively. Scale bar in G indicates 400 µm for G, I, L, and N. Scale bar in H indicates 100 µm for H, J, M, and O. Yellow arrowheads in P indicate the centralized nuclei in mutant muscle cells.
Figure 3—figure supplement 1
Osr2-Cre specifically deletes Runx2 in the soft palate region.
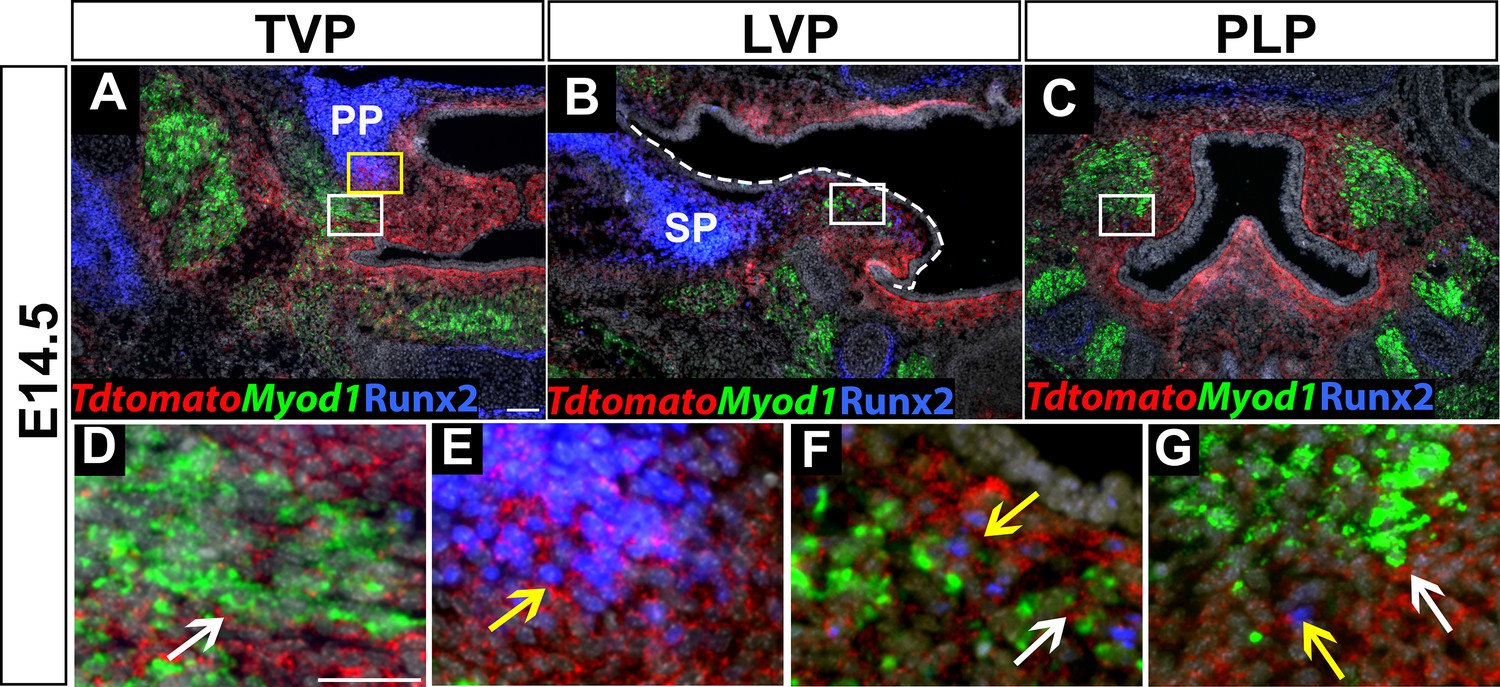
(A–G) Immunostaining of Runx2 and RNAscope in situ hybridization of tdTomato with myogenic marker Myod1 on coronal sections of tensor veli palatini (TVP), levator veli palatini (LVP), and palatopharyngeus (PLP) regions at E14.5. White dashed line outlines the palatal shelf in B. White and yellow boxes in A are enlarged in D and E. White boxes in B and C are enlarged in F and G, respectively. White arrows show the tdTomato+ cells surround all soft palatal muscles in Osr2-Cre;tdTomato mice in D, F, and G. Yellow arrows show colocalization of Runx2 and tdTomato in E, F, and G. Scale bar in A indicates 100 µm in A-C. Scale bar in D indicates 50 µm in D-G.
Figure 3—figure supplement 2

Deletion of Runx2 in cranial neural crest (CNC)-derived cells gives rise to hard tissue defects in Osr2-Cre;Runx2fl/fl mice.
(A, C, E, G) Isolated palatine bones and sphenoid bones from control (A,E) and Osr2-Cre;Runx2fl/fl (C, G) mice. (B, D, F, H) Coronal views of soft tissue microCT scans of newborn control (B,F) and Osr2-Cre;Runx2fl/fl mice (D,H). (I): Quantification of the size (length and height) of the pterygoid plate from control (red bars) and Osr2-Cre;Runx2fl/fl (blue bars) mice. ***p<0.001; ****p<0.0001. (J): Quantification of the size (length, width and height) of the palatine bone and the size (length and height) of the pterygoid plate from control (red bars) and Osr2-Cre;Runx2fl/fl (blue bars) mice. **p<0.01. PB: Palatine bone; PP: Pterygoid plate. Red dashed lines outline the palatine bone. Blue dashed lines outline the pterygoid plate. White asterisk indicates the missing palatine bone or cleft. Red arrows indicate the normal soft palate. Scale bars in A and B indicate 0.6 mm for A, C, E, G and B, D, F, H, respectively.
-
Figure 3—figure supplement 2—source data 1
Source data for Figure 3—figure supplement 2I.
- https://cdn.elifesciences.org/articles/62387/elife-62387-fig3-figsupp2-data1-v1.xlsx
-
Figure 3—figure supplement 2—source data 2
Source data for Figure 3—figure supplement 2J.
- https://cdn.elifesciences.org/articles/62387/elife-62387-fig3-figsupp2-data2-v1.xlsx
Figure 3—figure supplement 3
Deletion of Runx2 in cranial neural crest (CNC)-derived cells gives rise to soft palate defects in Osr2-Cre;Runx2fl/fl mice.
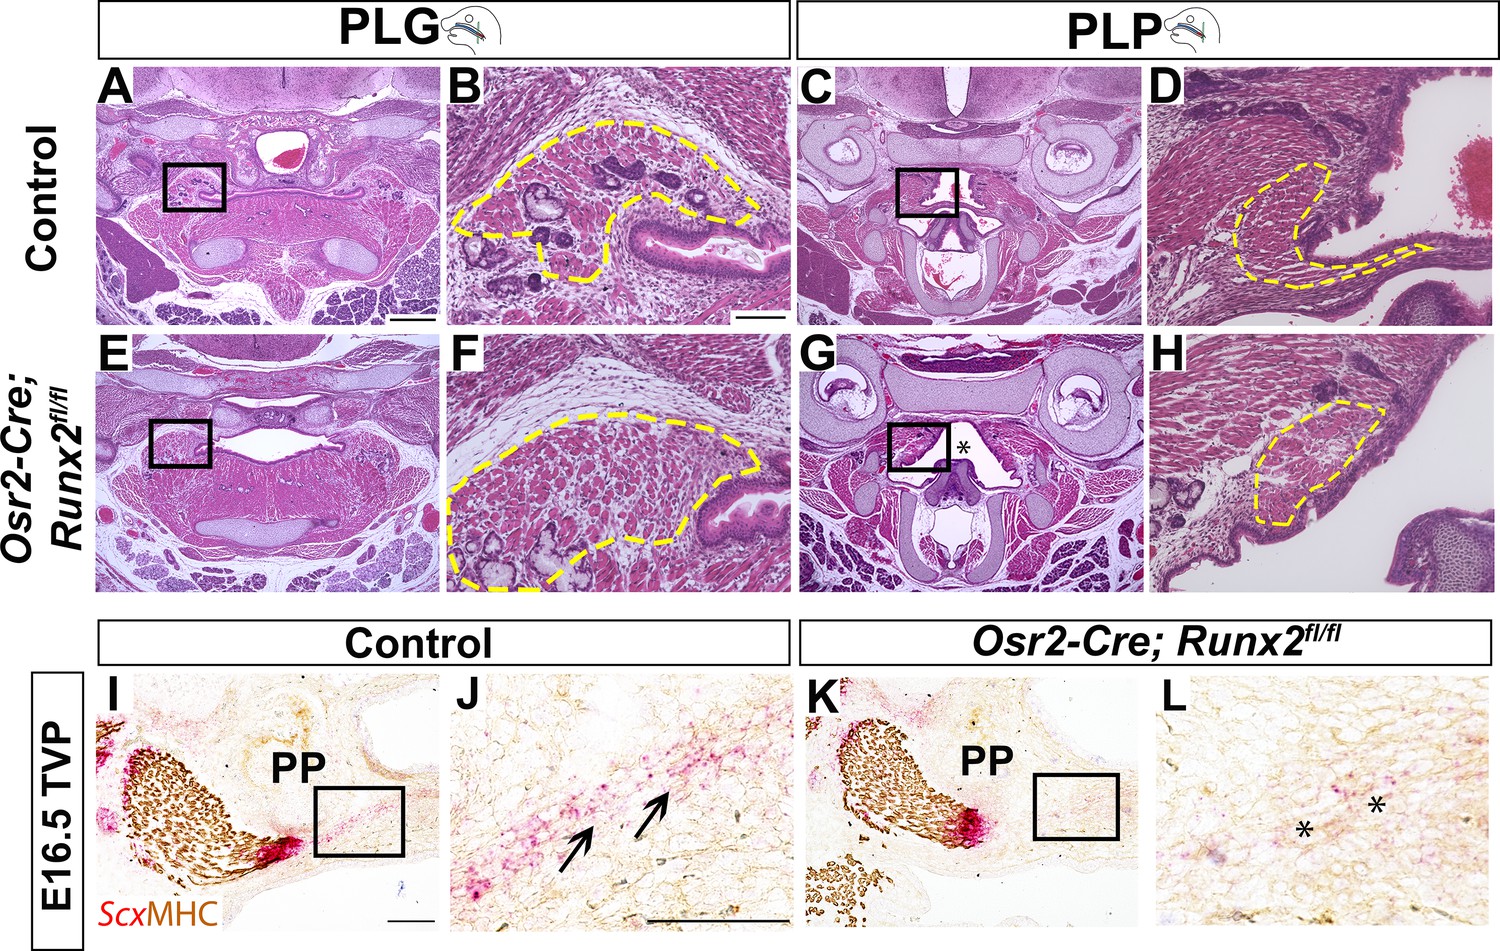
(A–H) H and E staining of soft palate coronal sections from control and Osr2-Cre;Runx2fl/fl mice at P0. Yellow dashed lines outline the soft palatal muscles. Asterisks in G indicate the cleft soft palate in the PLP region of Osr2-Cre;Runx2fl/fl mice. Boxed areas in A, C, E, and G are enlarged in B, D, F, and H, respectively. (I–L) RNAscope in situ hybridization of Scx and immunostaining of MHC in the tensor veli palatini (TVP) regions of coronal sections of E16.5 control and Osr2-Cre;Runx2fl/fl mice. Asterisks indicate the altered tendon structure in Osr2-Cre;Runx2fl/fl mice. Scale bar in A indicates 400 µm for A, C, E, G. Scale bar in B indicates 100 µm for B, D, F, H. Scale bars in I and J indicate 100 µm for I, K and J, L, respectively.
Figure 3—figure supplement 4

Deletion of Runx2 in cranial neural crest (CNC)-derived cells gives rise to aponeurosis defects in Osr2-Cre;Runx2fl/fl mice.
(A–D) RNAscope in situ hybridization of Scx of coronal sections in the tensor veli palatini (TVP) region of P0 control and Osr2-Cre;Runx2fl/fl mice. Scale bar in A indicates 100 µm for A and C. Scale bar in B indicates 25 µm for B and D.
Figure 4 with 1 supplement
Loss of Runx2 in cranial neural crest (CNC)-derived cells results in myogenic proliferation and differentiation defects of the levator veli palatini (LVP).
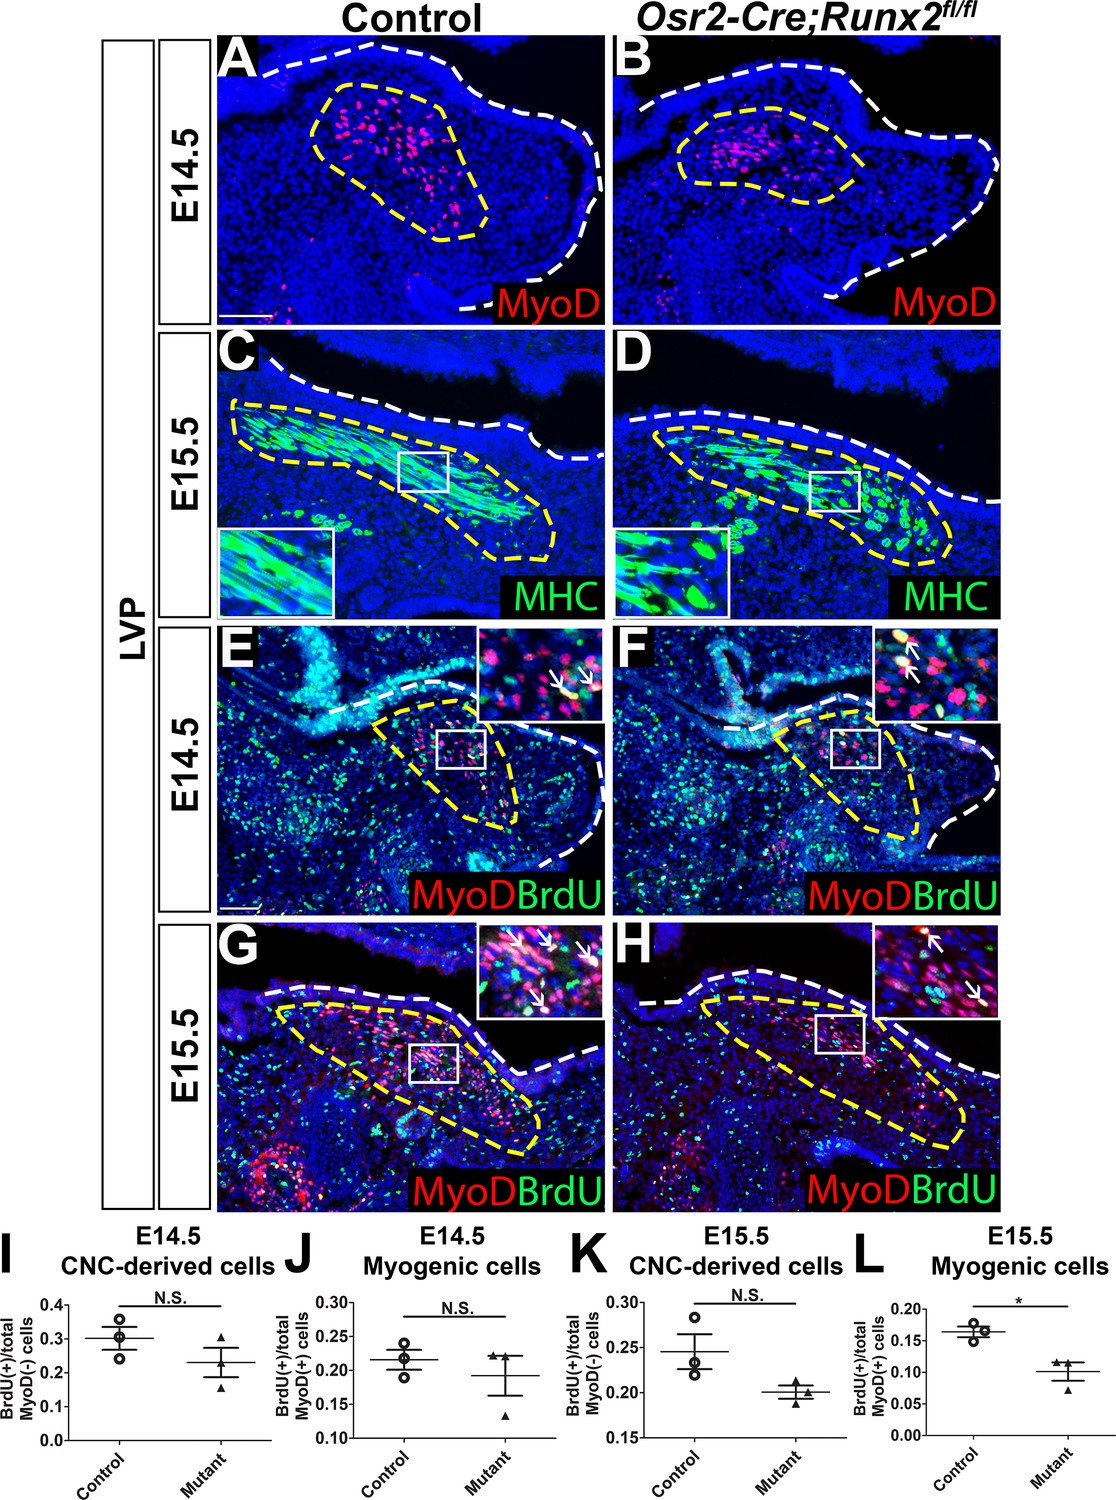
(A–B) MyoD and (C–D) MHC immunostaining on coronal sections of the LVP regions of control and Osr2-Cre;Runx2fl/fl mice at E14.5 and E15.5. Yellow dashed lines outline the myogenic cells. Boxed areas are enlarged as insets in the same image. (E–H) Immunostaining of BrdU and MyoD on coronal sections from the LVP regions of control and Osr2-Cre;Runx2fl/fl mice at E14.5 and E15.5. Yellow dashed lines outline the location of myogenic cells in the LVP regions. Boxed areas are enlarged as insets in the same image. White arrows in the insets indicate BrdU+ myogenic cells. (I–L) Quantitation of proliferation rates of CNC-derived and myogenic cells in E14.5 (I–J) and E15.5 (K–L) coronal sections of the LVP regions of control (E, G) and Osr2-Cre;Runx2fl/fl (F, H) mice (N = 3 mice, four sections per region per mouse). White dashed lines outline the palatal shelf. * indicates p value = 0.02. Scale bars in A and E indicate 100 µm for A-D and E-H, respectively.
-
Figure 4—source data 1
Source data for Figure 4I–L.
- https://cdn.elifesciences.org/articles/62387/elife-62387-fig4-data1-v1.xlsx
Figure 4—figure supplement 1
Loss of Runx2 in cranial neural crest (CNC)-derived cells results in myogenic differentiation but no apoptotic defects of the levator veli palatini (LVP).
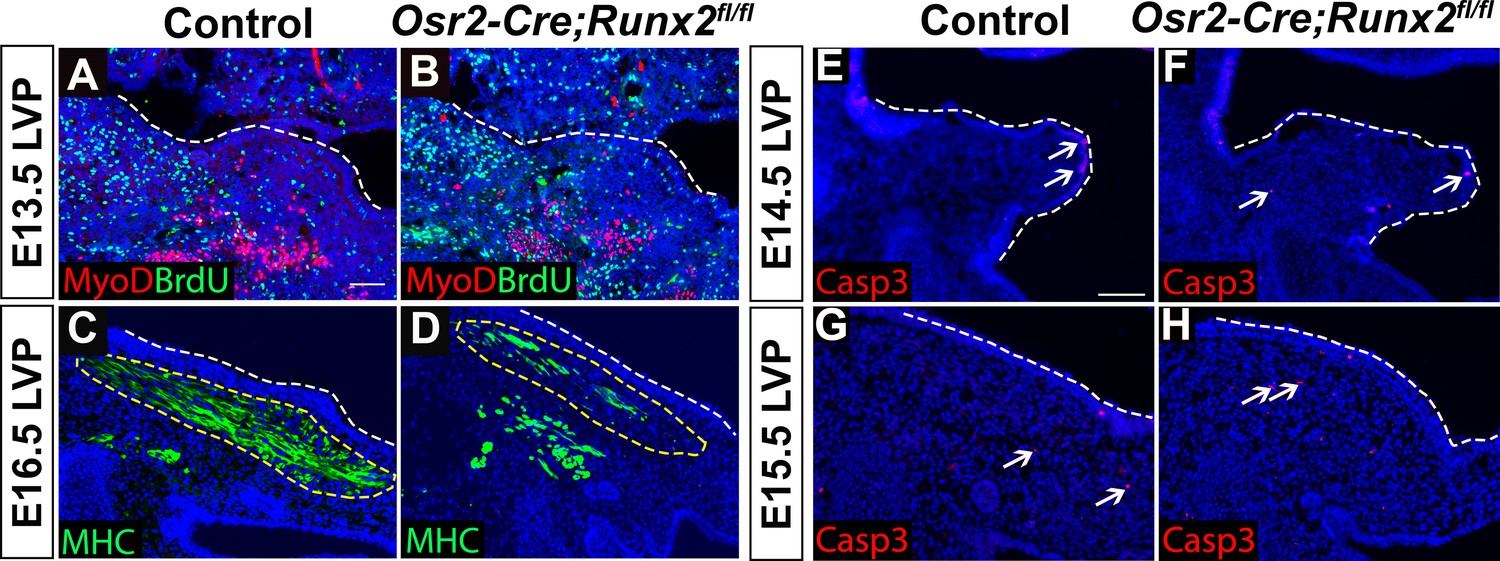
(A–B) Immunostaining of BrdU and MyoD on coronal sections of the LVP regions of control and Osr2-Cre;Runx2fl/fl mice at E13.5. (C–D) Immunostaining of MHC on coronal sections of the LVP regions of control and Osr2-Cre;Runx2fl/fl mice at E16.5. (E–H) Immunostaining of Caspase three on coronal sections of the LVP regions of control and Osr2-Cre;Runx2fl/fl mice at E14.5 (E–F) and E15.5 (G–H). White arrows indicate Caspase3+ cells in E-H. Yellow dotted lines outline the location of myogenic cells in the LVP regions. White dashed lines outline the palatal shelf primordium or the palatal shelf. Scale bars in A and E indicate 100 µm for A-D and E-H, respectively.
Figure 5 with 2 supplements

Loss of Runx2 results in altered cell fate of cranial neural crest (CNC)-derived mesenchymal cells in the soft palate.
(A) Integration analysis of the soft palate regions of control and Osr2-Cre;Runx2fl/fl mice at E14.5. Left panel shows the integration analysis of control and Osr2-Cre;Runx2fl/fl at E14.5. Right panels show the split UMAP clustering views of CNC-derived mesenchymal cells from control and Osr2-Cre;Runx2fl/fl mice based on the integration analysis. Black dotted lines outline the different subtypes of CNC-derived mesenchymal cells in the soft palate. (B) Percentages of cells in different CNC-derived non-osteochondrogenic clusters in control and Osr2-Cre;Runx2fl/fl soft palates based on the integration analysis in (A). Red boxes and green boxes indicate the clusters with an increased and decreased percentages of cells, respectively, in Osr2-Cre;Runx2fl/fl mice compared to controls. (C) Violin plots show the comparative expression levels of Runx2 and Twist1 in different CNC-derived non-osteochondrogenic clusters. Red box highlights the differences in Runx2 and Twist1 expression in perimysial cell clusters. (D–K) Co-expression of Runx2 and Twist1 on coronal sections of the levator veli palatini (LVP)regions of control and Osr2-Cre;Runx2fl/fl mice at E14.5. Yellow dashed lines outline the myogenic sites. Red, yellow and blue boxes in D and H are enlarged in E, F, G and I, J, K, respectively. White dashed lines outline the palatal shelf. Scale bar in D indicates 100 µm for D and H. Scale bar in E indicates 20 µm for E-G and I-K.
Figure 5—figure supplement 1
Expression of lineage-specific and general markers is altered in Osr2-Cre;Runx2fl/fl mice.
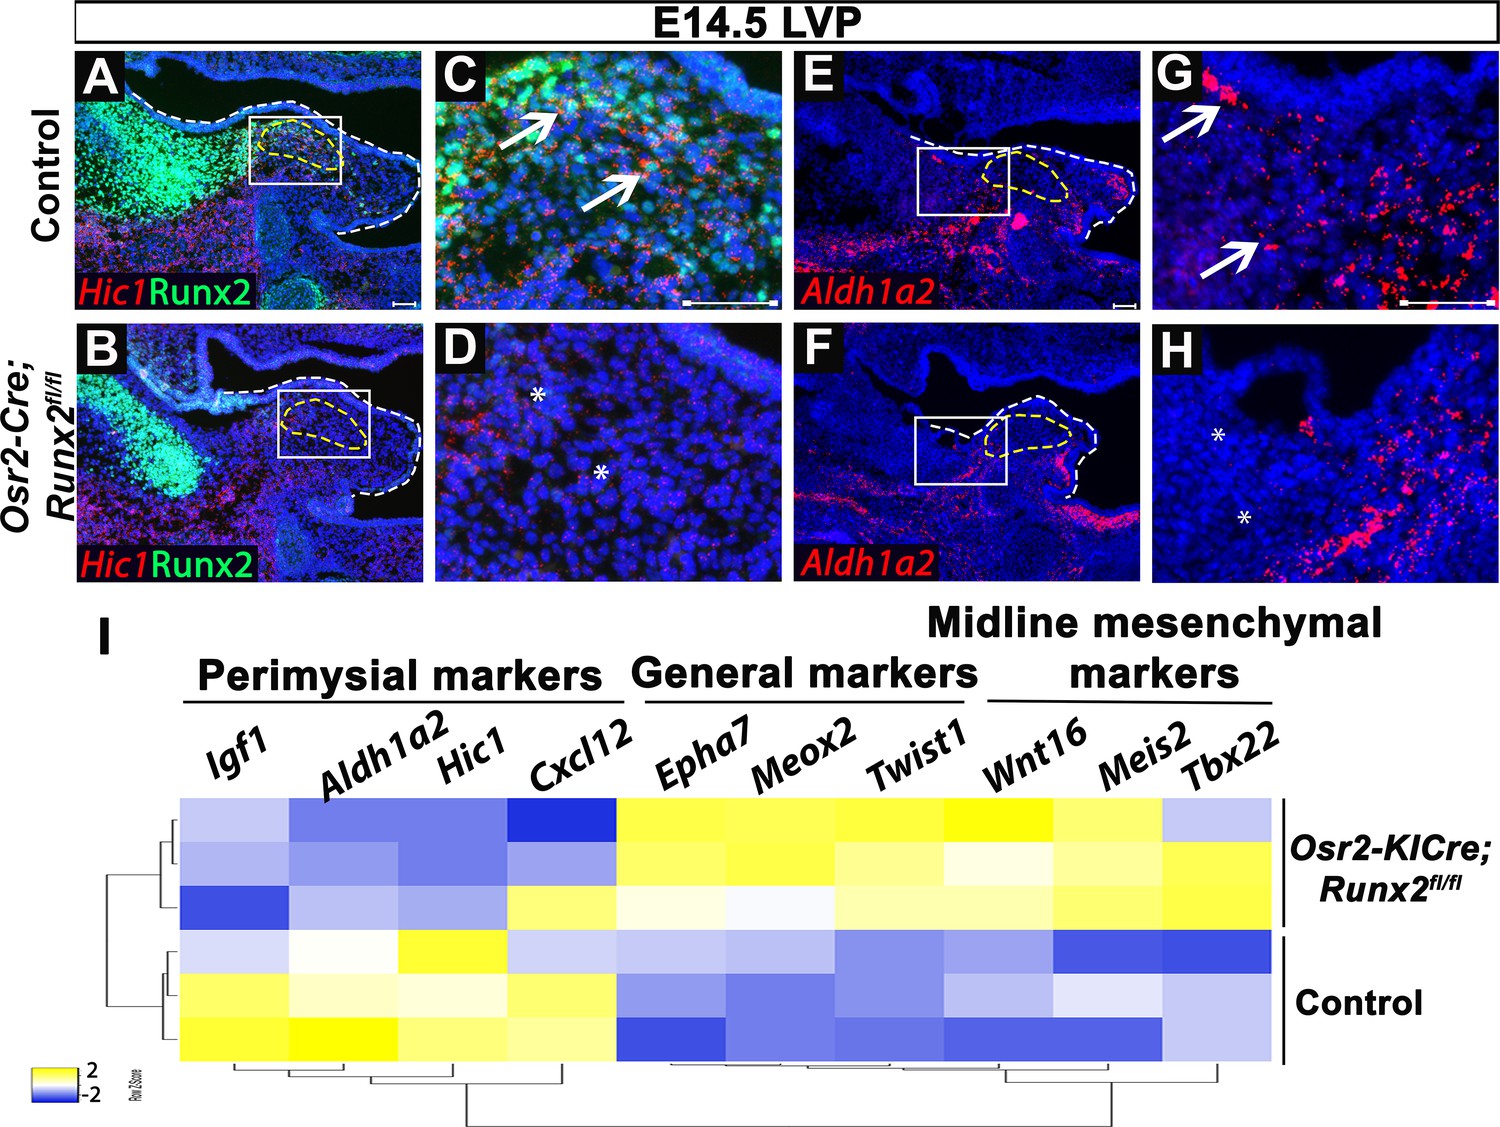
(A–H) Expression of Runx2 and perimysial markers Hic1 (A–D) and Aldh1a2 (E–H) on coronal sections of the levator veli palatini (LVP) regions of control and Osr2-Cre;Runx2fl/fl mice at E14.5. Yellow dotted lines outline the myogenic sites. White boxes in A, B, E, and F are enlarged in C, D, G, and H, respectively. (I) Heatmap comparison of expression profiles of lineage-specific and general cranial neural crest (CNC)-derived cell markers between control and Osr2-Cre;Runx2fl/fl mice at E14.5 by bulk RNA-seq. White dashed lines outline the palatal shelf. Scale bars in A, C, E, and G indicate 100 µm for A-B, C-D, E-F, and G-H, respectively.
Figure 5—figure supplement 2

Twist1 is expressed in the soft palate in a spatiotemporally specific manner.
(A) Co-expression of Twist1 and candidate progenitor marker Tfap2b, perimysial-specific marker Aldh1a2 and midline mesenchymal-specific marker Tbx22 in the integrated E13.5-E15.5 cranial neural crest (CNC)-derived cells of the soft palate mesenchyme. (B–G) Expression of Twist1 (B, D, F) and MyoD or Myod1 (C, E, G) on the coronal sections of the levator veli palatini (LVP) regions of control mice from E13.5 to E15.5. Yellow dashed lines show the location of myogenic cells in the soft palate. White dashed lines outline the palatal shelf. Scale bar in B indicates 100 µm for B-G.
Figure 6 with 1 supplement

Twist1 antagonizes Runx2 to regulate soft palate development.
(A) ATAC-seq peaks showing Twist1- and Runx2-binding sites are present in the opened regulatory regions near the Aldh1a2 locus in the soft palate tissue. (B–G) H and E staining of tensor veli palatini (TVP) and levator veli palatini (LVP) coronal sections in P0 control, Osr2-Cre;Runx2fl/fl and Osr2-Cre;Runx2fl/fl;Twist1fl/+ mice (N = 5). Yellow dashed lines outline the location of myogenic cells. Arrows indicate comparable structures in the pterygoid plates (PP) of control and Osr2-Cre;Runx2fl/fl;Twist1fl/+ mice. Asterisk indicates defective pterygoid plate, palate and LVP muscles in Osr2-Cre;Runx2fl/fl. (H) Quantification of the height of the palatine bone from control (red bars), Osr2-Cre;Runx2fl/fl (blue bars) mice and Osr2-Cre;Runx2fl/fl;Twist1fl/+ (yellow bars) mice (N = 5). (I) Schematic drawings of Myod1 (green), styloid process of temporal bone (SP) and hyoid bone (HB) on coronal sections in the LVP region of E14.5 control mice. (J–R) Aldh1a2 RNAscope in situ hybridization (J–L), Runx2 immunostaining (M–O) and Twist1 RNAscope in situ hybridization (P–R) in E14.5 LVP coronal sections of control, Osr2-Cre;Runx2fl/fl and Osr2-Cre;Runx2fl/fl;Twist1fl/+ mice. White dashed lines outline the palatal shelf. Scale bars in B and J indicate 100 µm for B-G and J-R, respectively.
-
Figure 6—source data 1
Source data for Figure 6H.
- https://cdn.elifesciences.org/articles/62387/elife-62387-fig6-data1-v1.xlsx
Figure 6—figure supplement 1
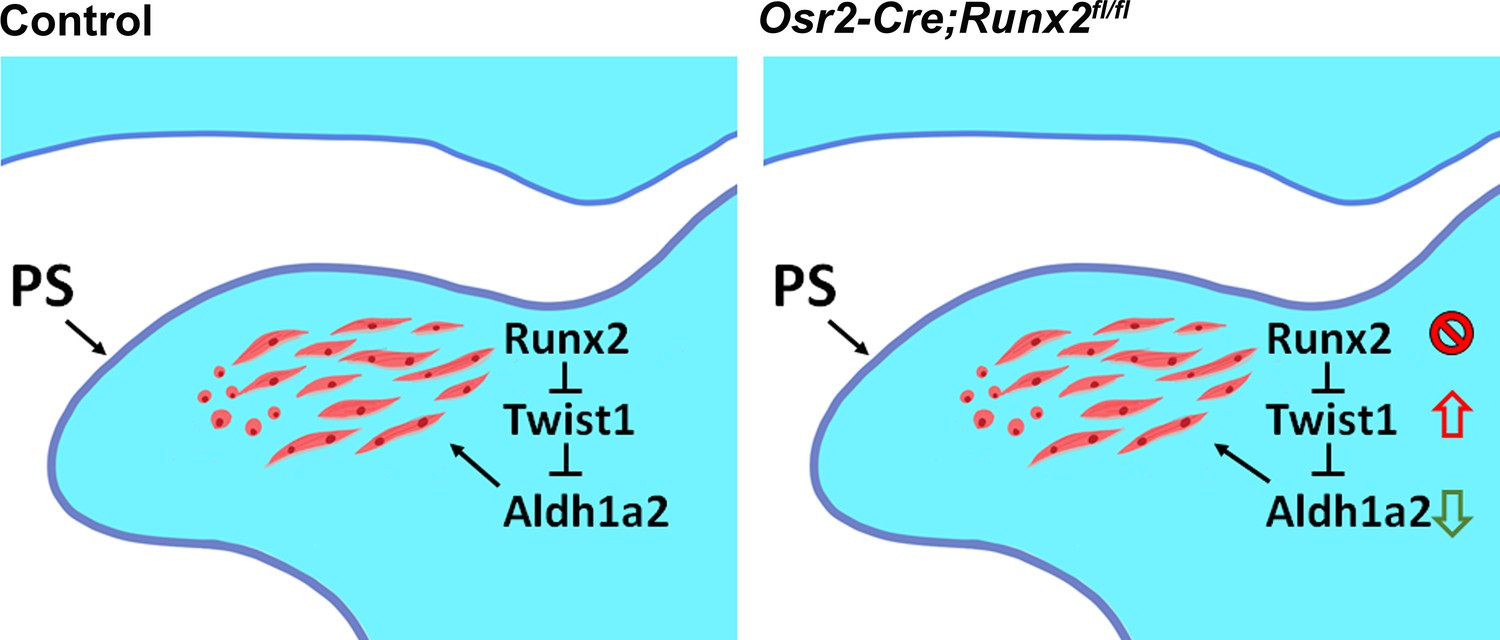
Schematic depicts our model of the mechanism of soft palate development in control (left panel) and Osr2-Cre;Runx2fl/fl mice (right panel).
Loss of Runx2 results in upregulated expression of Twist1 and inhibits Aldh1a2 regulating retinoic acid secretion in the palatal mesenchyme, resulting in muscle defects. PS: Palatal shelf.
Author response image 1
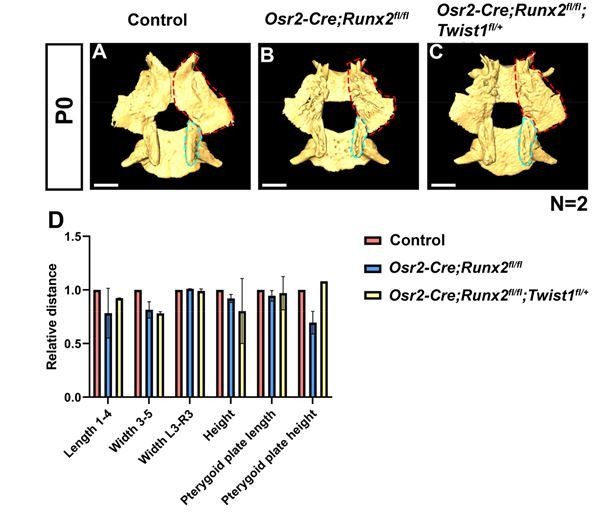
Deletion of Runx2 in CNC-derived cells gives rise to hard tissue defects in Osr2-Cre;Runx2fl/fl mice.
(A-C) Isolated palatine bones and sphenoid bones from control (A), Osr2-Cre;Runx2fl/fl (B) and Osr2-Cre;Runx2fl/fl;Twist1fl/+ mice (C). Red dashed lines outline the pterygoid plate. Blue dashed lines outline the pterygoid plate. (D) Quantification of the size (length, width and height) of the palatine bone and of the pterygoid plate (length and height) from control (red bars), Osr2-Cre;Runx2fl/fl (blue bars) and Osr2-Cre;Runx2fl/fl;Twist1fl/+ (yellow bars) mice (N=2). Scale bars in A-C: 0.6 mm.
Tables
Key resources table
| Reagent type (species) or resource | Designation | Source or reference | Identifiers | Additional information |
|---|---|---|---|---|
| Strain, strain background (M. musculus) | Runx2flox/flox | Takarada et al., 2013 | ||
| Strain, strain background (M. musculus) | Twist1flox/flox | Bildsoe et al., 2009 | RRID:MMRRC_016842-UNC | |
| Strain, strain background (M. musculus) | ROSA26loxp-STOP-loxp-tdTomato | Jackson Laboratory | Stock No. 007905; RRID:IMSR_JAX:007905 | |
| Strain, strain background (M. musculus) | Osr2-Cre | Rulang Jiang, Cincinnati Children’s Hospital | ||
| Sequence-based reagent | Mm-Myod1 probe | Advanced Cell Diagnostics | Cat# 316081 | |
| Sequence-based reagent | Mm-Scx probe | Advanced Cell Diagnostics | Cat# 439981 | |
| Sequence-based reagent | Mm-Twist1 probe | Advanced Cell Diagnostics | Cat# 414701 | |
| Sequence-based reagent | Mm-Aldh1a2 probe | Advanced Cell Diagnostics | Cat# 447391 | |
| Sequence-based reagent | Mm-Hic1 probe | Advanced Cell Diagnostics | Cat# 464131 | |
| Sequence-based reagent | Mm-Tfap2b probe | Advanced Cell Diagnostics | Cat# 536371 | |
| Sequence-based reagent | Mm-Tbx22 probe | Advanced Cell Diagnostics | Cat# 426511 | |
| Sequence-based reagent | Mm-Ibsp probe | Advanced Cell Diagnostics | Cat# 415501 | |
| Sequence-based reagent | Mm-Col2a1 probe | Advanced Cell Diagnostics | Cat# 407221 | |
| Sequence-based reagent | Mm-Tbx15 probe | Advanced Cell Diagnostics | Cat# 558761 | |
| Sequence-based reagent | Mm-Top2a probe | Advanced Cell Diagnostics | Cat# 491221 | |
| Sequence-based reagent | Mm-tdTomato probe | Advanced Cell Diagnostics | Cat# 317041 | |
| Antibody | Rabbit monoclonal anti-Runx2 | Cell Signaling Technology | RRID:AB_2732805 Cat# 12556S | (1:100) |
| Antibody | Rabbit monoclonal anti-active Caspase 3 | Cell Signaling Technology | RRID:AB_2341188 Cat# 9661S | (1:100) |
| Antibody | Rat monoclonal anti-BrdU | Abcam | RRID:AB_305426 Cat# ab6326 | (1:100) |
| Antibody | Mouse monoclonal anti-MyoD | DAKO | RRID:AB_2148874 Cat# M3512 | (1:20) |
| Antibody | Mouse monoclonal anti-MHC | DSHB | Cat# P13538 | (1:10) |
| Antibody | Goat polyclonal anti-Mouse Alexa Fluor 488 | Life Technologies | RRID:AB_2534069 Cat# A11001 | (1:200) |
| Antibody | Goat polyclonal anti-Mouse Alexa Fluor 568 | Life Technologies | RRID:AB_2534072 Cat# A-11004 | (1:200) |
| Antibody | Goat polyclonal anti-Rat Alexa Fluor 488 | Life Technologies | RRID:AB_141373 Cat# A-11006 | (1:200) |
| Antibody | Goat polyclonal anti-Rabbit Alexa Fluor 488 | Life Technologies | RRID:AB_143165 Cat# A-11008 | (1:200) |
| Antibody | Goat polyclonal anti-Rabbit Alexa Fluor 568 | Life Technologies | RRID:AB_10563566 Cat# A-11036 | (1:200) |
| Commercial assay or kit | Alexa Fluor 488 Tyramide SuperBoost Kit, goat anti-mouse IgG | ThermoFisher Scientific | Cat# B40912 | (1:200) |
| Commercial assay or kit | RNAscope Multiplex Fluorescent Kit v2 | Advanced Cell Diagnostics | Cat# 323110 | |
| Commercial assay or kit | RNAscope 2.5 HD Assay – RED | Advanced Cell Diagnostics | Cat# 322350 | |
| Commercial assay or kit | TSA Plus Cyanine 3 System | Perkin Elmer | Cat# NEL744001KT | |
| Commercial assay or kit | TSA Plus Fluoresceine System | Perkin Elmer | Cat# NEL771B001KT | |
| Commercial assay or kit | RNeasy Micro Kit | QIAGEN | Cat# 74004 | |
| Commercial assay or kit | DAB Peroxidase (HRP) Substrate Kit (With Nickel) | Vector Laboratories | RRID:AB_2336382 Cat# SK4100 | |
| Commercial assay or kit | Chromium Single Cell 30 GEM, Library and Gel Bead Kit v3 | 10x Genomics Inc | Cat#1000092 | |
| Software, algorithm | ImageJ | NIH | RRID:SCR_003070 | |
| Software, algorithm | Ingenuity Pathway Analysis | Qiagen.Inc | RRID:SCR_008653 | |
| Software, algorithm | GraphPad Prism | GraphPad Software | RRID:SCR_002798 | |
| Software, algorithm | Seurat | Satija lab | RRID:SCR_016341 | |
| Software, algorithm | Monocle3 | Trapnell lab | RRID:SCR_018685 | |
| Software, algorithm | Cell ranger | 10X Genomics.Inc | RRID:SCR_017344 | |
| Software, algorithm | BWA | PMID:19451168; PMID:20080505 | RRID:SCR_010910 | |
| Software, algorithm | MACS | PMID:18798982 | RRID:SCR_013291 |
Additional files
Download links
A two-part list of links to download the article, or parts of the article, in various formats.
Downloads (link to download the article as PDF)
Open citations (links to open the citations from this article in various online reference manager services)
Cite this article (links to download the citations from this article in formats compatible with various reference manager tools)
Runx2-Twist1 interaction coordinates cranial neural crest guidance of soft palate myogenesis
eLife 10:e62387.
https://doi.org/10.7554/eLife.62387


