Distinct temporal difference error signals in dopamine axons in three regions of the striatum in a decision-making task
- Department of Molecular and Cellular Biology, Center for Brain Science, Harvard University, United States
- Department of Physiology, Osaka City University Graduate School of Medicine, Japan
Figures
Figure 1 with 1 supplement
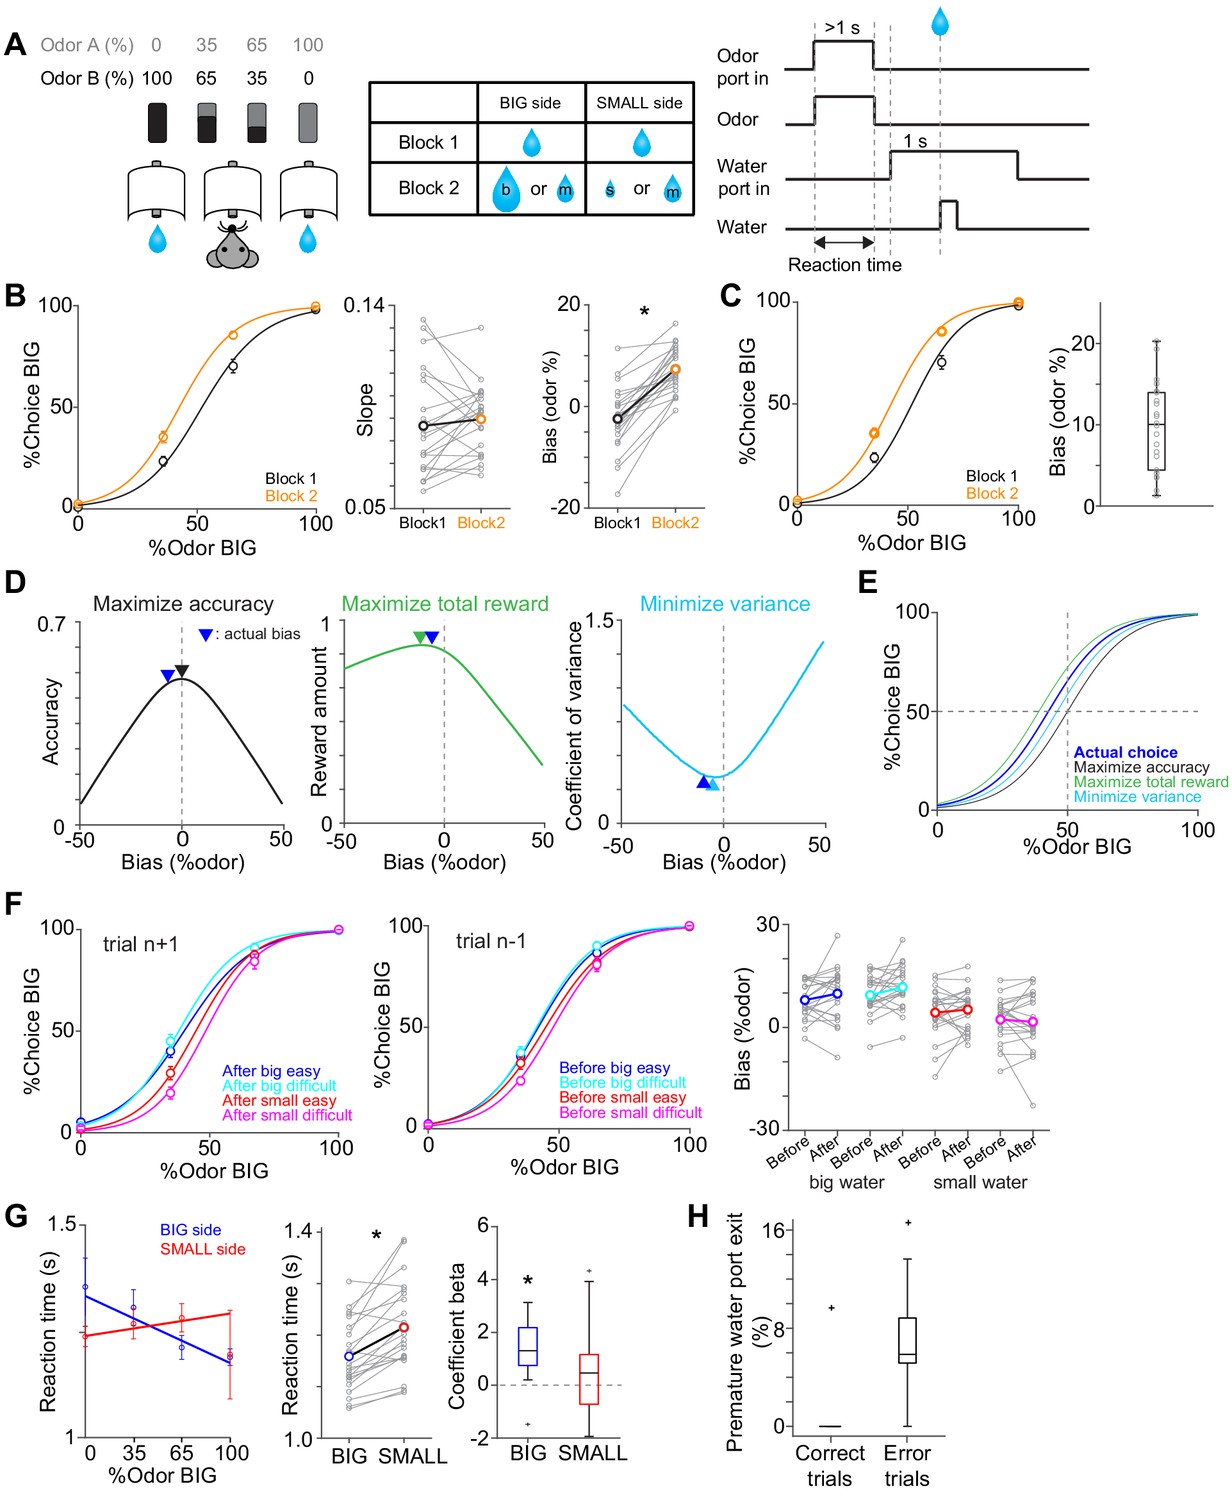
Perceptual choice paradigm with probabilistic reward conditions.
(A) A mouse discriminated a dominant odor in odor mixtures that indicates water availability in either the left or right water port. Correct choice was rewarded by a drop of water. In each session, an equal amount of water was assigned at both water ports in the first block, and in the second block, big/medium water (50%–50%, randomized) was assigned at one water port (BIG side) and medium/small water (50%–50%, randomized) was assigned at another port (SMALL side). The BIG or SMALL side was assigned to a left or right water port in a pseudorandom order across sessions. (B) Left, % of choice of the BIG side in block 1 and 2 (mean ± SEM) and the average psychometric curve for each block. Center, slope of the psychometric curve was not different between blocks (t(21) = 0.75, p=0.45, paired t-test). Right, choice bias at 50/50 choice, expressed as 50 - odor (%). Choice biased toward BIG side in block 2 (t(21) = 8.5, p=2.8 × 10⁻⁸, paired t-test). (C) Left, % of choice of the BIG side in block 1 and 2 (mean ± SEM) and the average psychometric curve with a fixed slope across blocks. Right, all the animals showed choice bias toward BIG side in block two compared to block 1 (z = 4.1, p=4.0 × 10⁻⁵, Wilcoxon signed rank test). The choice bias was expressed by a lateral shift of a psychometric curve with a fixed slope across blocks. (D) Average reward amounts, accuracy, and coefficients of variance were examined with different levels of choice bias with a fixed slope (average slope of all animals). (E) Optimal choice patterns with different strategies in D (bias −11, 0, and −4, respectively) and the actual average choice pattern (mean bias −7.3). (F) Trial-by-trial choice updating was examined by comparing choice bias before (center, trial n−1) and after (left, trial n+1) specific trial types. Choice updating in one trial was not significant for reward acquisition of either small or big water in easy or difficult trials (right, big easy, z = −1.1, p=0.24; big difficult, z = −1.6, p=0.10; small easy, z = −0.95, p=0.33; small difficult, z = 0.081, p=0.93, Wilcoxon signed rank test). (G) Left, animal's reaction time was modulated by odor types. Center, for easy trials (pure odors, correct choice), reaction time was shorter when animals chose the BIG side (t(21) = −5.0, p=4.9 × 10⁻⁵, paired t-test). Right, the reaction time was negatively correlated with sensory evidence for choice of the BIG side (t(21) = −4.7, p=1.2 × 10⁻⁴, one sample t-test), whereas the modulation was not significant for choice of the SMALL side (t(21) = −1.5, p=0.13, one sample t-test). (H) Animals showed more premature exit of water port (<1 s) in trials with error choice than trials with correct choice (t(21) = −7.9, p=9.5 × 10⁻⁸, paired t-test). n = 22 animals.
-
Figure 1—source data 1
Summary statistics.
- https://cdn.elifesciences.org/articles/62390/elife-62390-fig1-data1-v2.xlsx
Figure 1—figure supplement 1

Average psychometric curve in odor manipulation blocks.
% of choice of a left port when a left port is the BIG side or when a right port is the BIG side (mean ± SEM) and the average psychometric curve for each case. n = 22 animals.
Figure 2 with 1 supplement
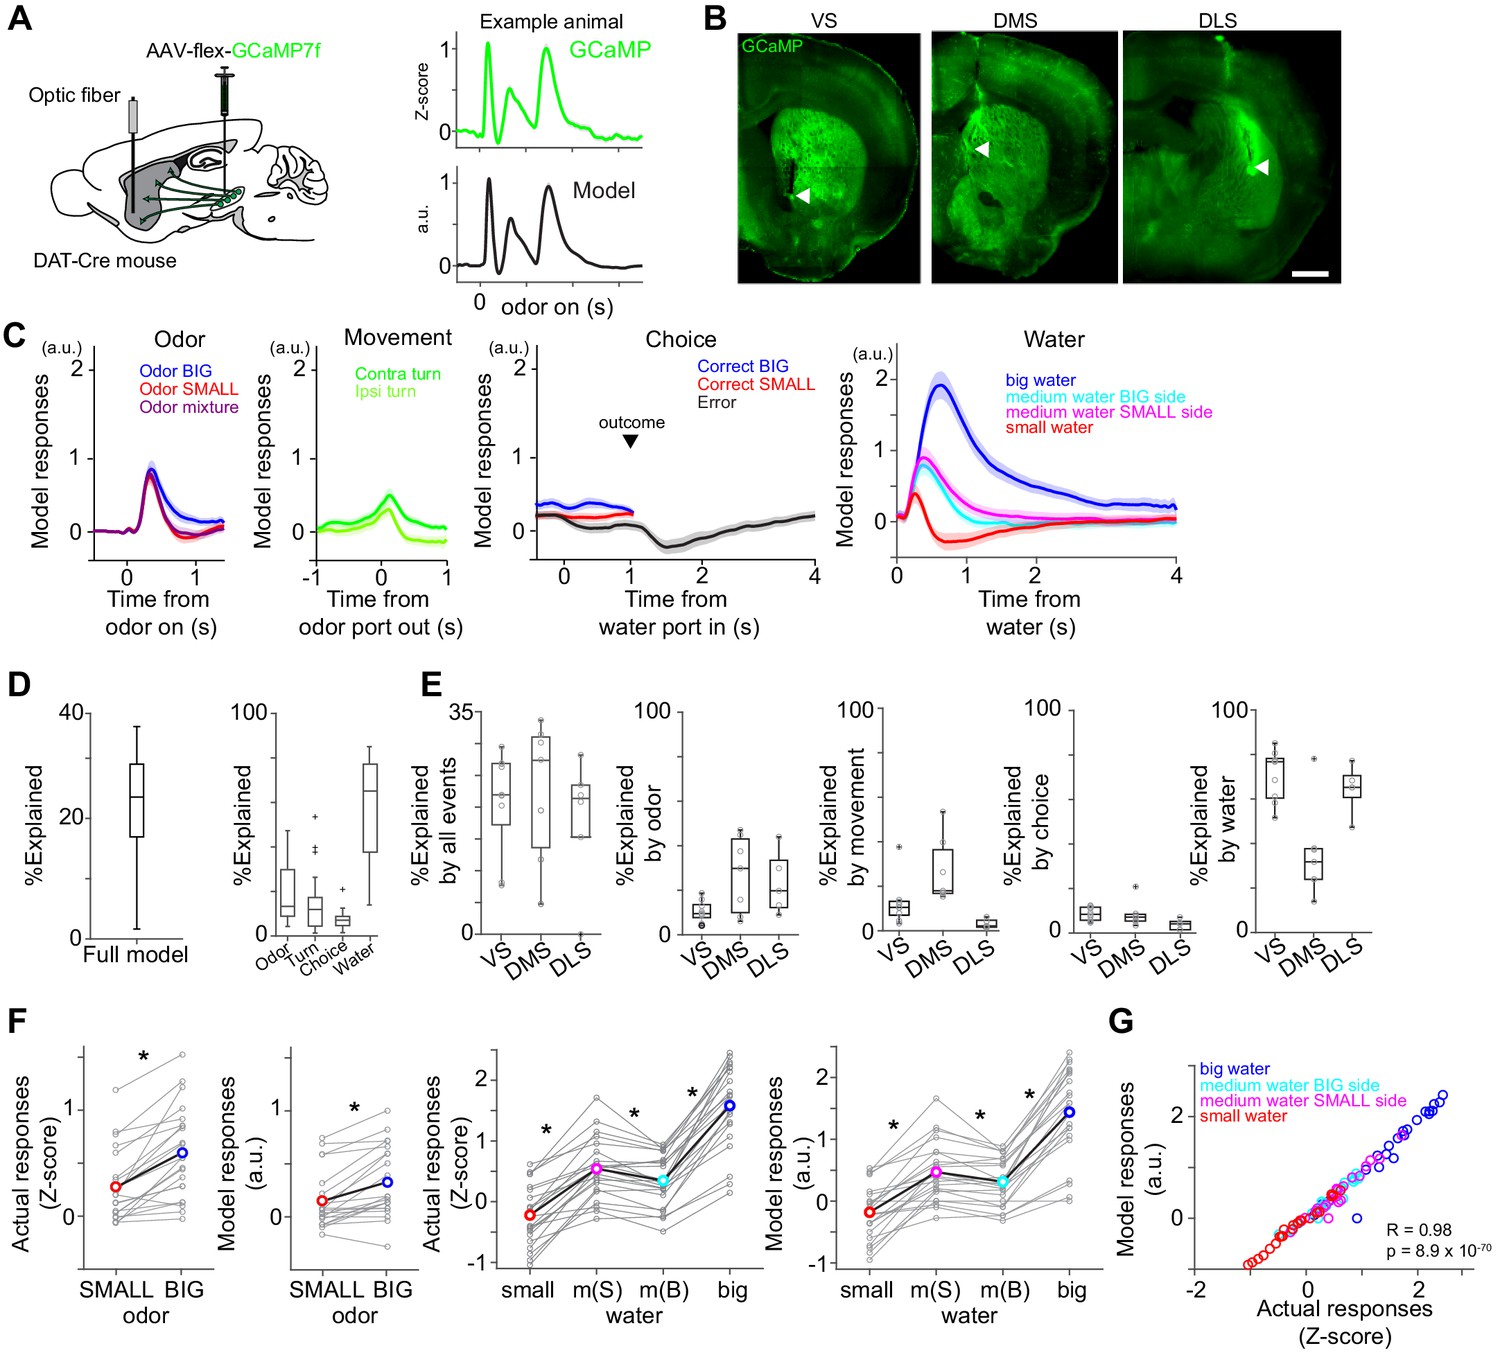
Dopamine axons in the striatum show characteristics of RPE.
(A) AAV-flex-GCaMP7f was injected in VTA and SNc, and dopamine axon activity was measured with an optic fiber inserted in the striatum. Right top, dopamine axon activity in all the valid trials (an animal chose an either water port after staying in odor port for required time,>1 s) in an example animal, aligned at odor onset (mean ± SEM). Right bottom, average responses using predicted trial responses in a fitted model of the same animal (mean ± SEM). (B) Location of an optic fiber in example animals. Arrow heads, tips of fibers. Green, GCaMP7f. Bar = 1 mm. (C) Odor-, movement-, choice-, and water-locked components in the model of all the animals (mean ± SEM). (D) Contribution of each component in the model was measured by reduction of deviance in the full model compared to a reduced model excluding the component. (E) Contribution of each component in the model in each animal group. (F) Left, comparison of dopamine axon responses to an odor cue that instructs to choose BIG and SMALL side in easy trials (pure odor, correct choice, −1–0 s before odor port out). t(21) = 5.8, p=8.1 × 10⁻⁶ for actual signals and t(21) = 4.8, p=9.5 × 10⁻⁵ for models. Paired t-test, n = 22 animals. Right, comparison of dopamine axon responses to different sizes of water (big versus medium water with BIG expectation, and medium versus small water with SMALL expectation) and to medium water with different expectation (BIG versus SMALL expectation) (0.3–1.3 s after water onset). t(21) = 12.9, p=1.6 × 10⁻¹¹, t(21) = 9.7, p=2.9 × 10⁻⁹, and t(21) = −3.8, p=9.3 × 10⁻⁴, respectively for actual signals, and t(21) = 10.3, p=1.0 × 10⁻⁹, t(21) = 7.9, p=9.2 × 10⁻⁸, and t(21) = −3.3, p=0.0033, respectively for models. Paired t-test, n = 22 animals. m(B), medium water with BIG expectation; m(S), medium water with SMALL expectation. (G) Comparison between actual dopamine axon responses and model responses to water. Arbitrary unit (a.u.) was determined by model-fitting with z-score of GCaMP signals.
-
Figure 2—source data 1
Summary statistics.
- https://cdn.elifesciences.org/articles/62390/elife-62390-fig2-data1-v2.xlsx
Figure 2—figure supplement 1

Dopamine axon activity outside of the task.
(A) Labeling of body parts by DeepLabCut. (B) Verification of tracking. Disconnected tracking was detected by 5.5 cm displacement with one frame (Whole session). Nose tracking was verified in frames when a mouse stays at a water port for <1 s (Wait water). Trials when the tracked nose positions stayed within 2 cm were used for further analyses in later sections. n = 43 videos. (C) GCaMP and tdTom signals when a mouse starts or stops movement (>3 cm/s) for >0.5 s (mean ± SEM, n = 22 animals) outside of the task. (D) Responses to big water in the same videos as C are shown for comparison. (E) Left, GCaMP signals were decreased when a mouse moves (t(21) = 3.4, p=2.3 × 10⁻³ for start; t(21) = 3.0, p=5.6 × 10⁻³ for stop, n = 22 animals, paired t-test), whereas tdTom did not show consistent modulation (t(21) = 0.6, p=0.51 for start; t(21) = −0.6, p=0.54 for stop, n = 22 animals, paired t-test). Right, Pearson's correlation coefficients of GCaMP signals and body speed of random frames (5000 frames per video) are slightly but significantly negative (t(42) = −3.2, p=0.0021, n = 43 videos, one sample t-test). Whereas tdTom and body speed did not show consistent correlation (t(42) = 0.5, p=0.56, n = 43 videos, one sample t-test), signals in each video showed significant correlation, indicating motion artifacts in recording. Red circle indicates significant correlation coefficient for each video. (F) GCaMP signals in all three striatal areas showed similar modulation by movement (F(2,19) = 0.35, p=0.71, ANOVA).
Figure 3 with 1 supplement
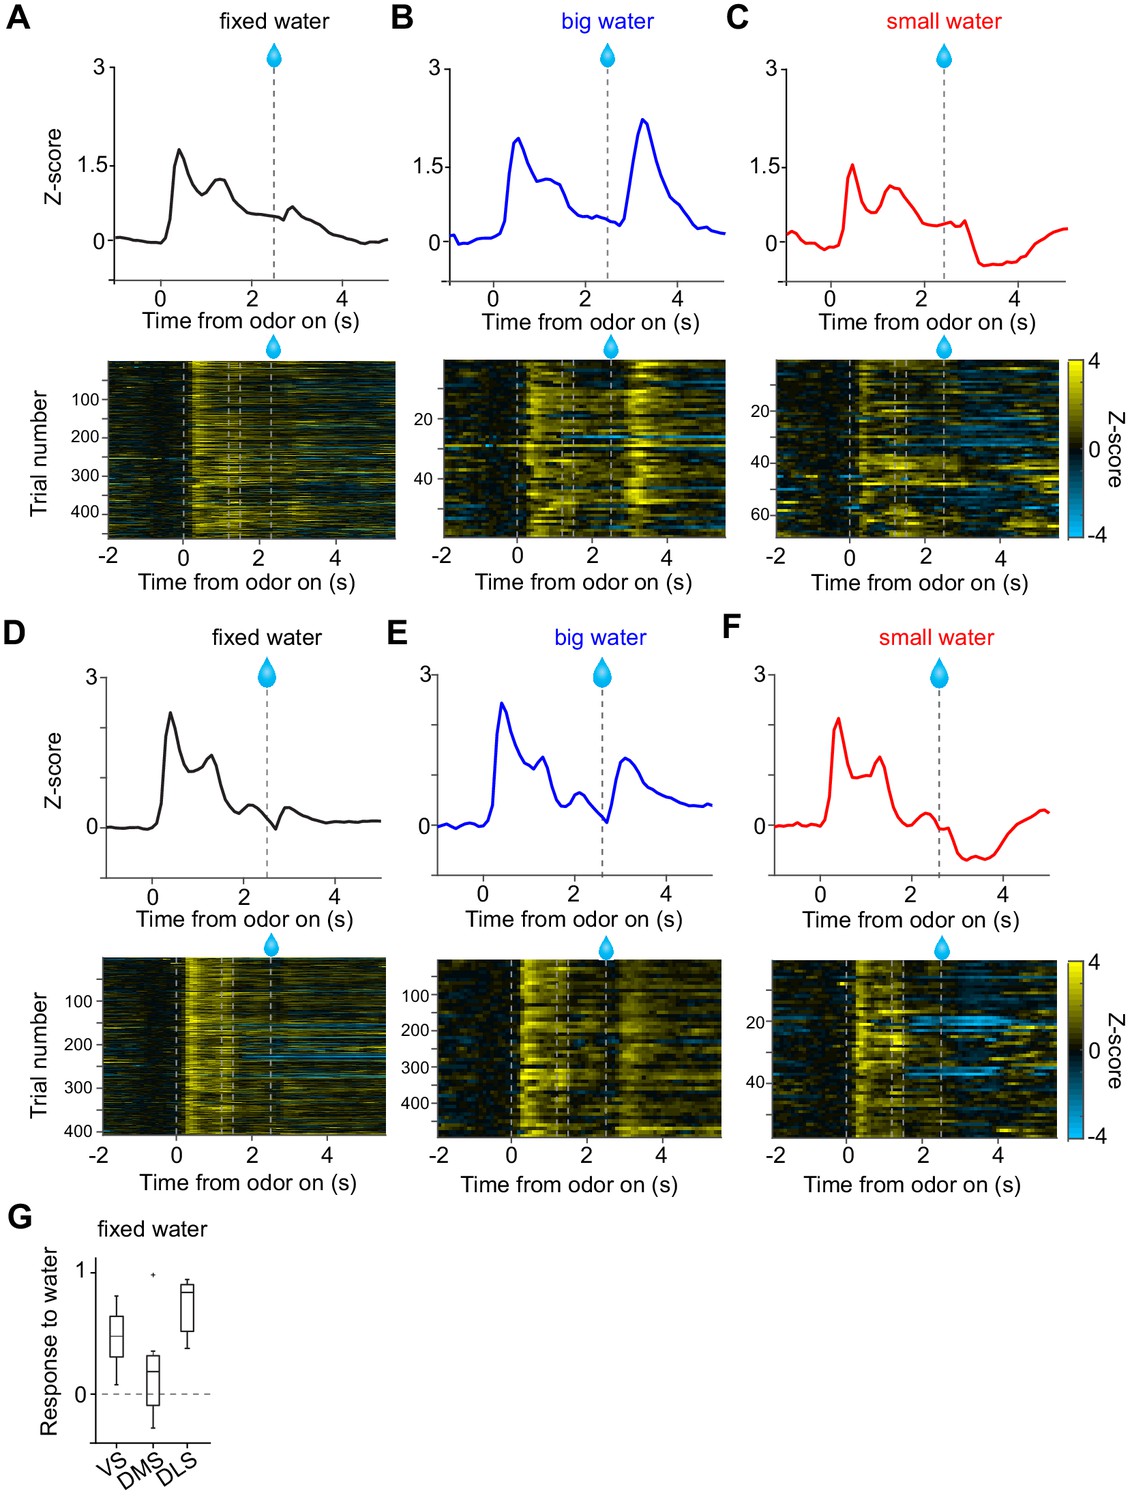
Small responses to fixed amounts of water in dopamine axons in DMS.
(A, D) Dopamine axon responses to water in a fixed reward amount task (pure odor, correct choice). (B, E) Dopamine axon responses to a big amount of water in a variable reward amount task (pure odor, correct choice). (C, F) Dopamine axon responses to a small amount of water in a variable reward amount task (pure odor, correct choice). A-C, dopamine axon activity in an example animal; D-F, another example animal. (G) Responses to water (0.3–1.3 s after water onset) were significantly modulated with striatal location (F(2,19) = 5.1, p=0.016, ANOVA; t(11) = 2.9, p=0.013, DMS versus DLS; t(14) = 1.2, p=0.21, VS versus DMS; t(13) = −2.6, p=0.021, VS versus DLS, two sample t-test; t = 2.4, p=0.023, dorsal-ventral; t = −1.3, p=0.18, anterior-posterior; t = 1.6, p=0.10, medial-lateral, linear regression). The water responses were significantly positive in VS (t(8) = 4.7, p=0.0015) and in DLS (t(5) = 9.7, p=1.9 × 10⁻⁴), but not in DMS (t(6) = 1.2, p=0.26). one sample t-test, n = 9, 7, six animals for VS, DMS, DLS.
-
Figure 3—source data 1
Summary statistics.
- https://cdn.elifesciences.org/articles/62390/elife-62390-fig3-data1-v2.xlsx
Figure 3—figure supplement 1
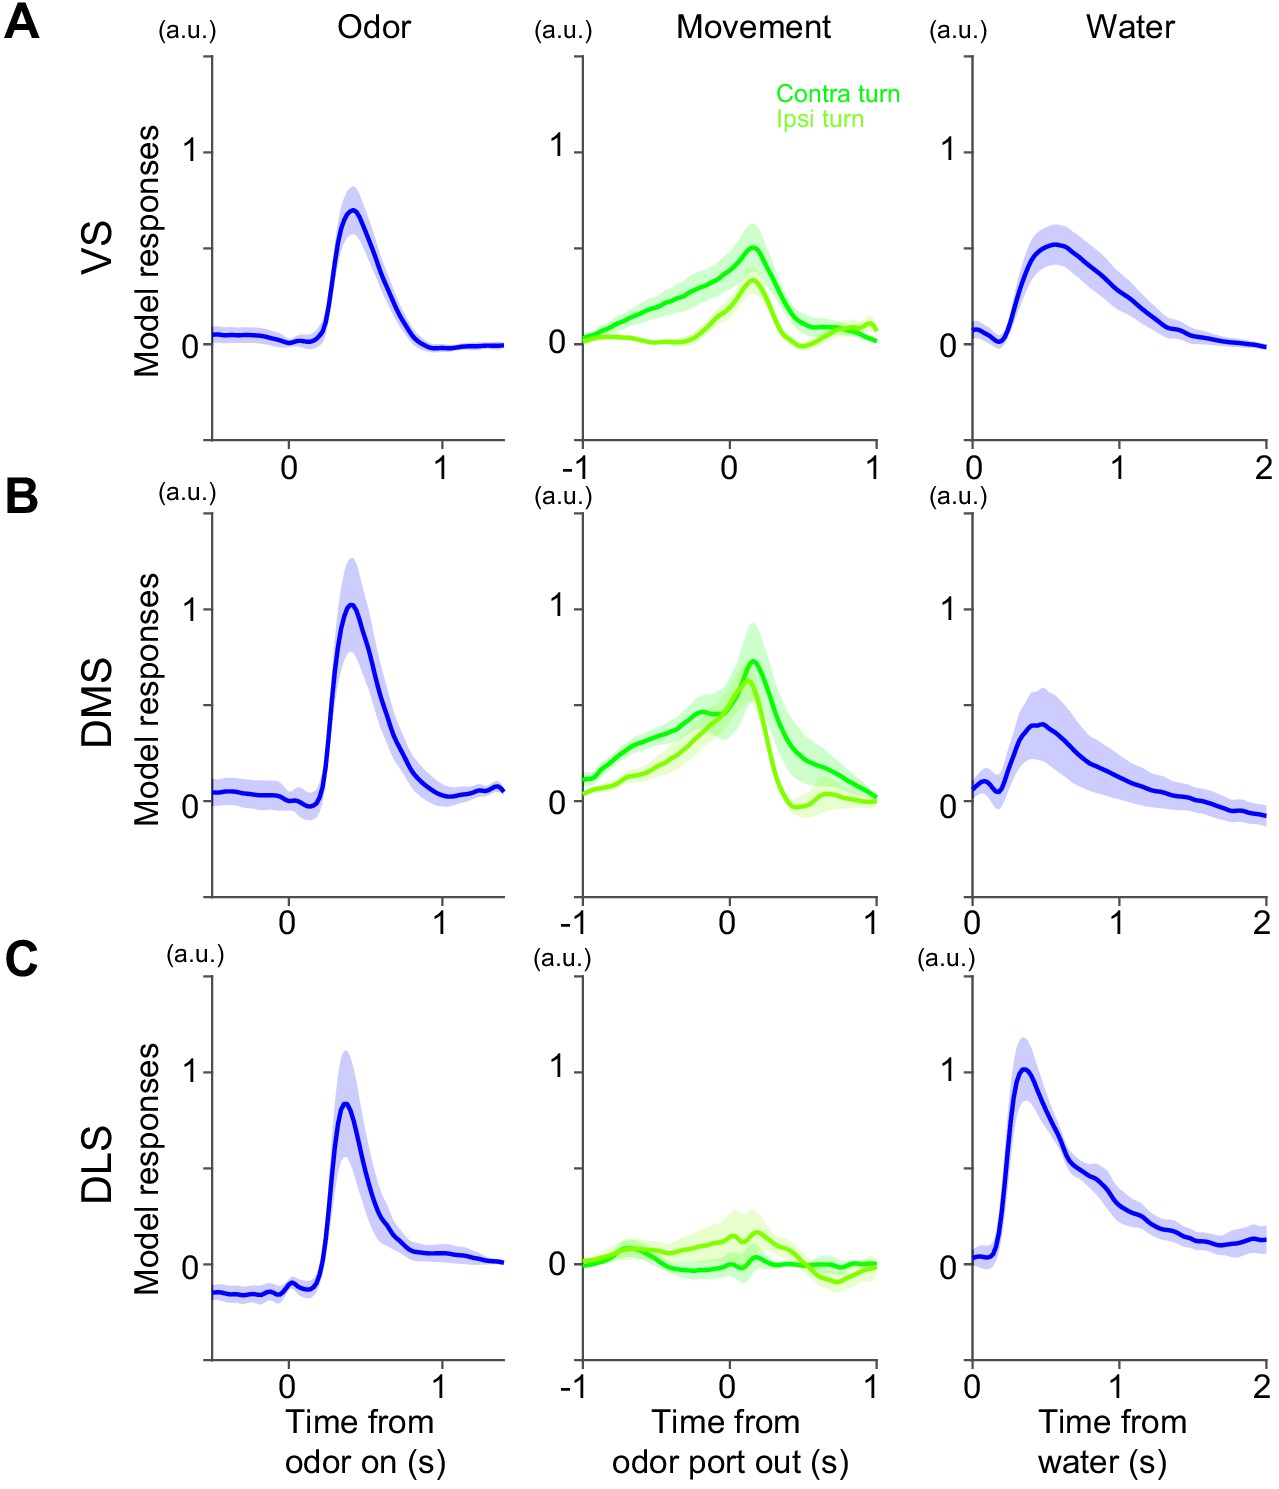
Model responses in a task with fixed amounts of reward.
Responses at odor onset, odor port out (choice movement onset) and water onset in Kernel models fitted with dopamine axon responses in VS (A), DMS (B) and DLS (C). Arbitrary unit (a.u.) was determined by model-fitting with z-score of GCaMP signals. n = 9,7,6 animals for VS, DMS, DLS. mean ± SEM.
Figure 4 with 1 supplement
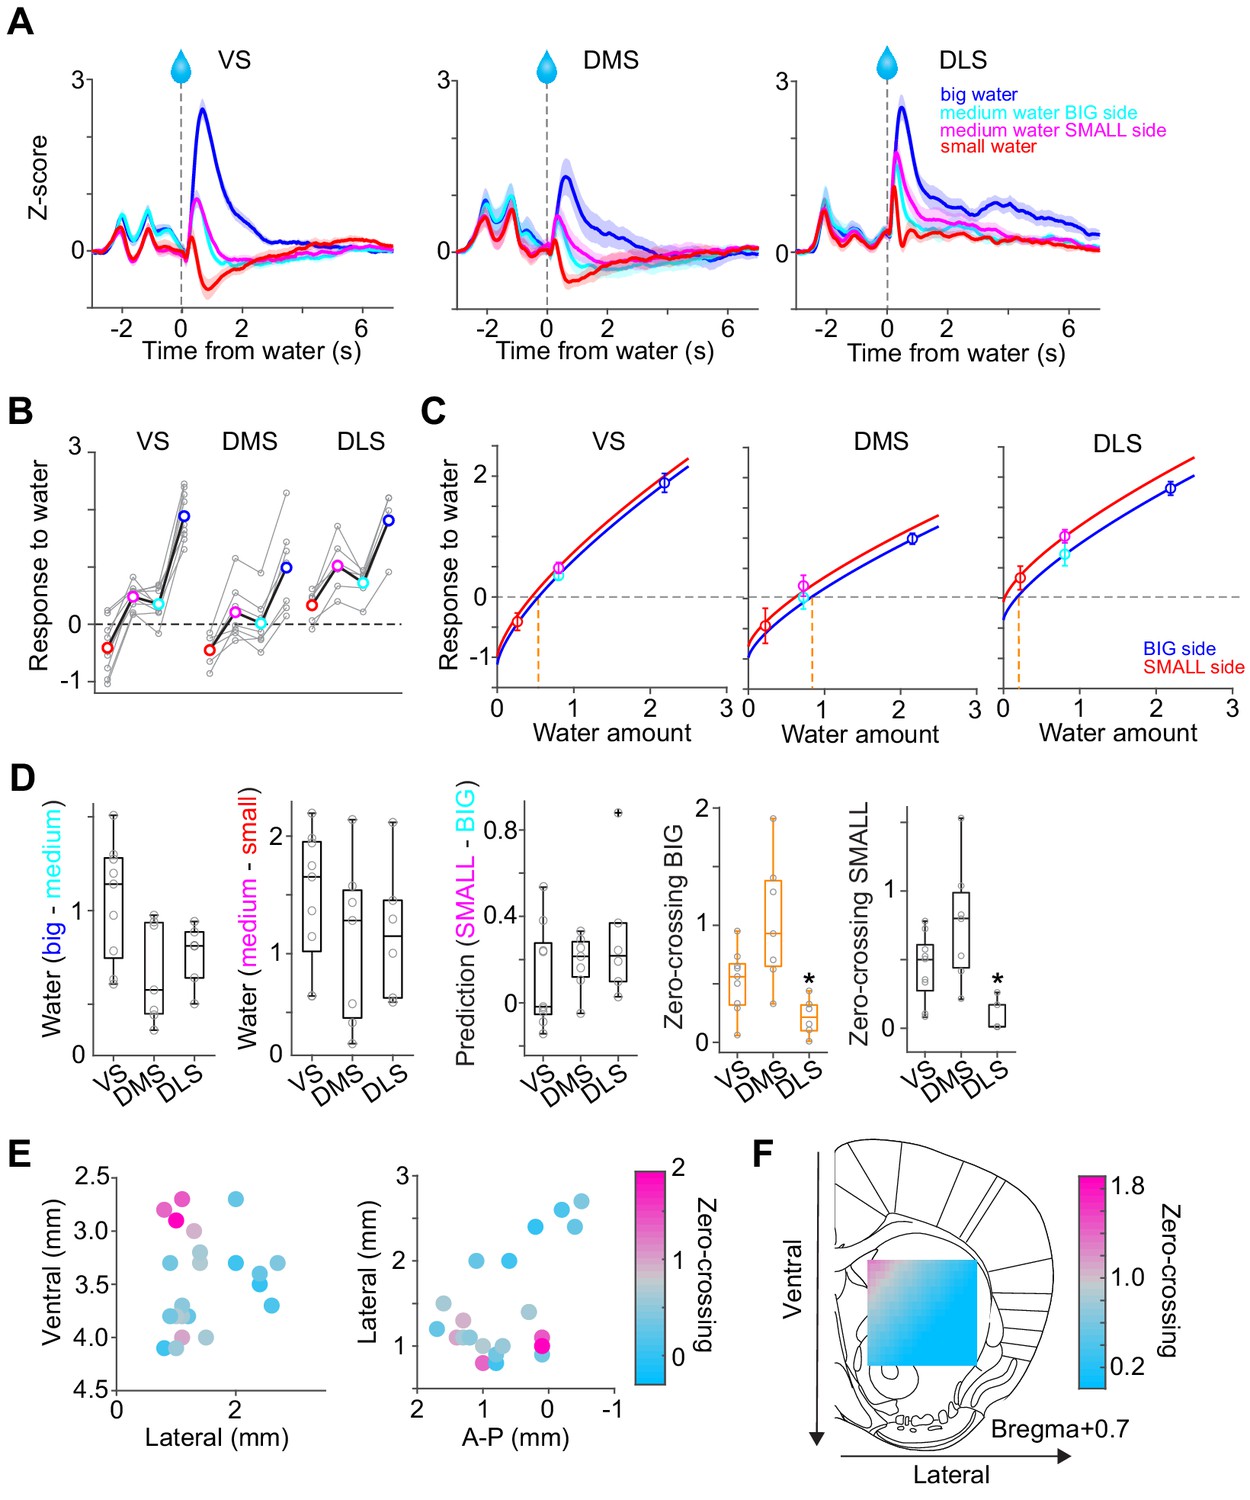
Responses to water in dopamine axons in the striatum.
(A) Activity patterns per different striatal location, aligned at water onset (mean ± SEM, n = 9 for VS, n = 7 for DMS, n = 6 for DLS). (B) Average responses to each water condition in each animal grouped by striatal areas. (C) Average response functions of dopamine axons in each striatal area. (D) Comparison of parameters for each animal grouped by striatal areas. ‘Water big-medium’ is responses to big water minus responses to medium water at the BIG side and ‘Water medium-small’ is responses to medium water minus responses to small water at the SMALL side, normalized with difference of water amounts (2.2 minus 0.8 for BIG and 0.8 minus 0.2 for SMALL). ‘Prediction SMALL-BIG’ is responses to medium water at SMALL side minus responses to medium water at BIG side. ‘Zero-crossing BIG’ is the water amount when the dopamine response is zero at BIG and side, which was estimated by the obtained response function. ‘Zero-crossing SMALL’ is the water amount when the dopamine response is zero at SMALL side, which was estimated by the obtained response function. Response changes by water amounts (BIG or SMALL) or prediction was not significantly modulated by the striatal areas (F(2,19) = 4.33, p=0.028, F(2,19) = 0.87, p=0.43, F(2,19) = 1.11, p=0.34, ANOVA), whereas zero-crossing points (BIG or SMALL) were significantly modulated (F(2,19) = 8.6, p=0.0021, F(2,19) = 8.5, p=0.0023, ANOVA; t(11) = 3.6, p=0.0039, DMS versus DLS; t(14) = −2.4, p=0.028, VS versus DMS; t(13) = 2.4, p=0.030, VS versus DLS for BIG side; t(14) = −1.8, p=0.085, VS versus DMS; t(13) = 3.1, p=0.0076, VS versus DLS; t(11) = 3.88, p=0.0026, DMS versus DLS for SMALL side, two sample t-test). (E) Zero-crossing points were plotted along anatomical location in the striatum. Zero-crossing points were correlated with medial-lateral positions (t = −2.8, p=0.011) and with dorsal-ventral positions (t = −2.7, p=0.014) but not with anterior-posterior positions (t = −0.3, p=0.72). Linear regression. (F) Zero-crossing points were fitted with recorded location, and the estimated values in the striatal area were overlaid on the atlas for visualization (see Materials and methods). Trials with all odor types (pure and mixture) were used in this figure. t-test, n = 9, 7, six animals for VS, DMS, DLS.
-
Figure 4—source data 1
Summary statistics.
- https://cdn.elifesciences.org/articles/62390/elife-62390-fig4-data1-v2.xlsx
Figure 4—figure supplement 1
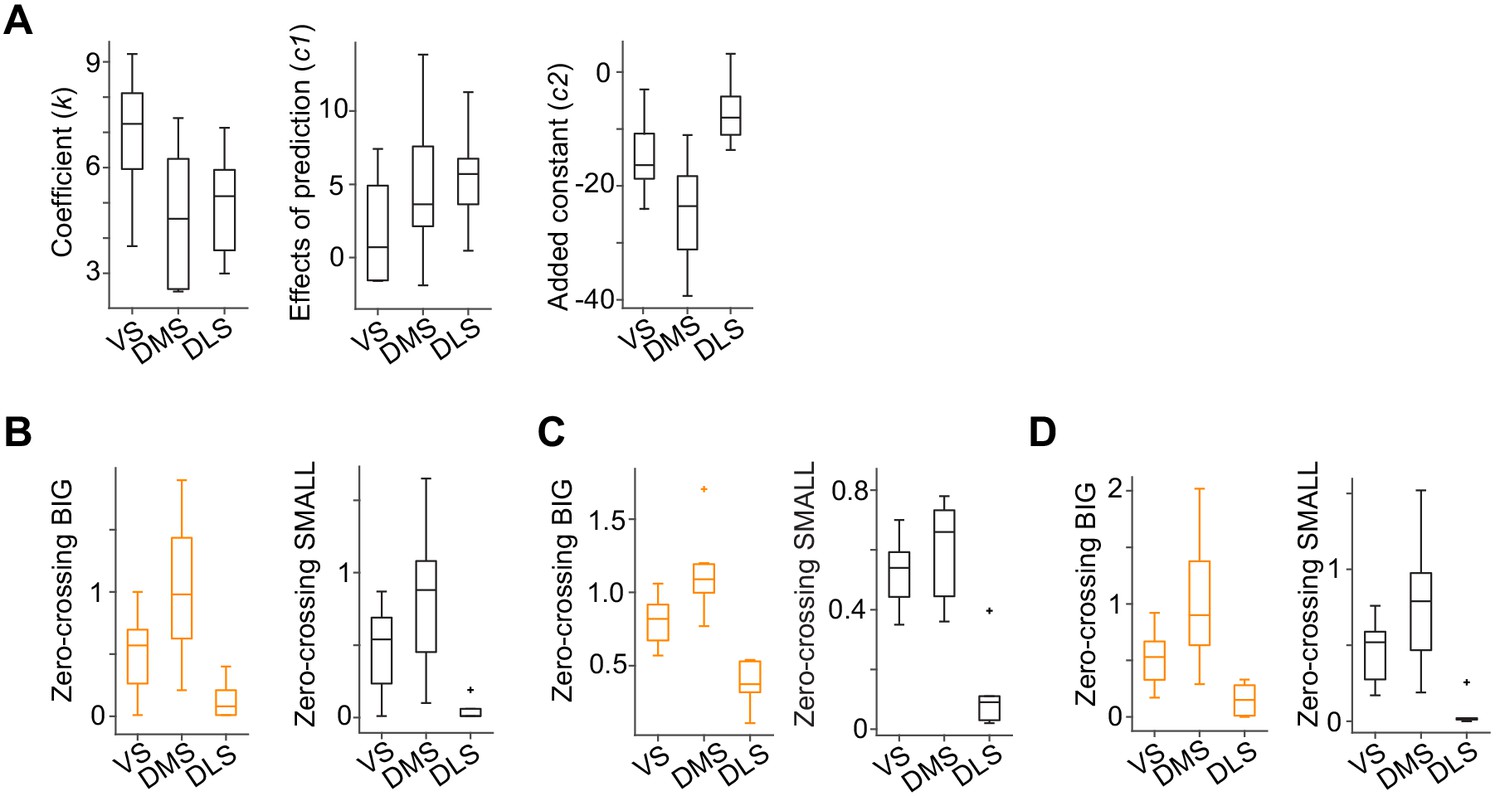
Zero-crossing points across the striatum with different methods.
(A) Each regression coefficient in the response function shown in Figure 4C. Fitting was performed by response , where R is the water amount, S is SMALL side (see Materials and methods). (B) Zero-crossing points with linear function (F(2,19) = 8.7, p=0.0021 for BIG; F(2,19) = 7.5, p=0.0038 for SMALL, ANOVA). (C) Zero-crossing points with power function using a before-water time window (−1 to −0.2 s before water) as baseline. (F(2,19) = 20.5, p=1.7 × 10⁻⁵ for BIG; F(2,19) = 21.6, p=1.2 × 10⁻⁵ for SMALL, ANOVA). (D) Zero-crossing points using kernel models with power function (F(2,19) = 9.4, p=0.0014 for BIG; F(2,19) = 10.1, p=0.0011, ANOVA). n = 9, 7, six animals for VS, DMS, DLS.
Figure 5
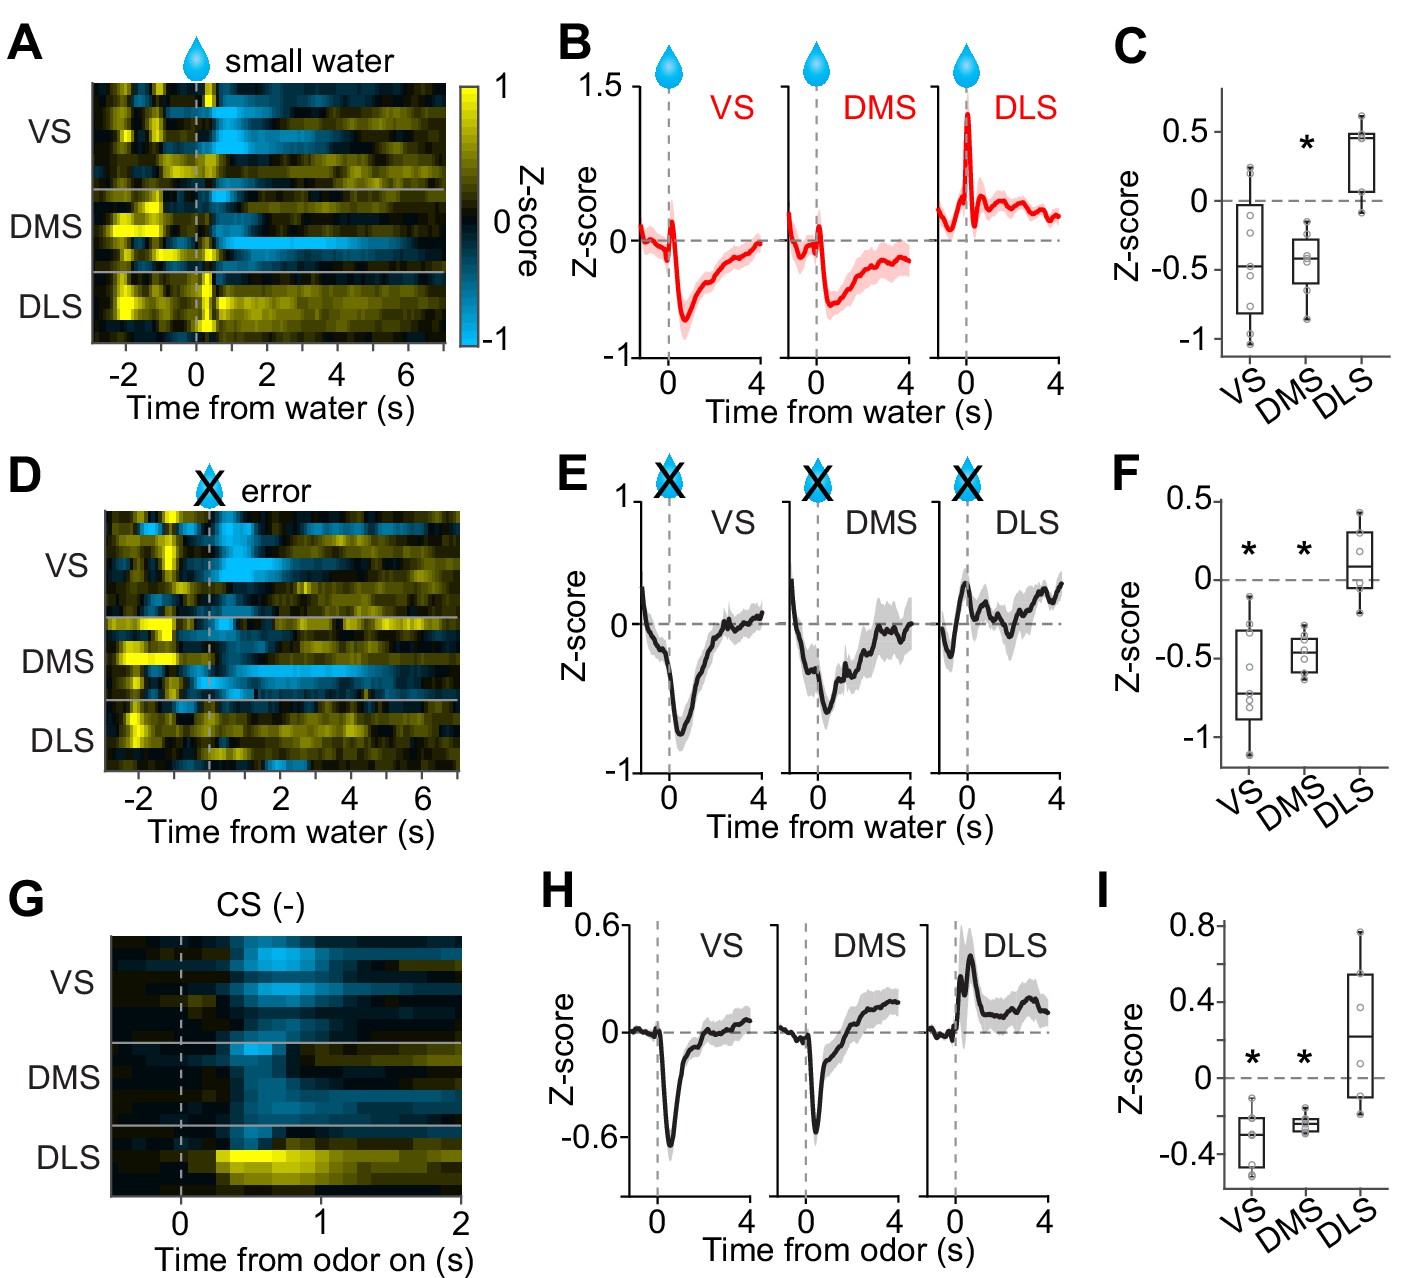
No inhibition by negative prediction error in dopamine axons in DLS.
(A) Activity pattern in each recording site aligned at small water. (B) Average activity pattern in each brain area (mean ± SEM). (C) Mean responses to small water (0.3–1.3 s after water onset) were negative in VS and DMS (t(8) = −2.3, p=0.044; t(6) = −4.5, p=0.0040, responses versus baseline, one sample t-test), but not in DLS (t(5) = 3.3, p=0.020 responses versus baseline, one sample t-test). The responses were different across striatal areas (F(2,19) = 9.62, p=0.0013, ANOVA; t(13) = −3.4, p=0.0041, VS versus DLS; t(11) = −5.5, p=1.8 × 10⁻⁴, DMS versus DLS: t(14) = 0.20, p=0.83, VS versus DMS, two sample t-test). (D) Activity pattern aligned at water timing in error trials. (E) Average activity pattern in each brain areas (mean ± SEM). (F) Mean responses in error trials (0.3–1.3 s after water timing) were negative in VS and DMS (t(8) = −5.4, p=6.2 × 10⁻⁴; t(6) = −10.9, p=3.5 × 10⁻⁵, responses versus baseline, one sample t-test), but not in DLS (t(5) = 1.1, p=0.30, responses versus baseline, one sample t-test). The responses were different across striatal areas (F(2,19) = 14.7, p=1.3 × 10⁻⁴, ANOVA; t(13)=−4.5, p=5.6 × 10⁻⁴, VS versus DLS; t(11)=-5.7, p=1.2 × 10⁻⁴, DMS versus DLS; t(14) = −1.1, p=0.25, VS versus DMS, two sample t-test). (G) Activity pattern aligned at CS(-) in a fixed reward amount task. (H) Average activity pattern in each brain area (mean ± SEM). (I) Mean responses at CS(-) (−1–0 s before odor port out) were negative in VS and DMS (t(8) = −6.7, p=1.4 × 10⁻⁴, VS; t(6) = −13.4, p=1.0 × 10⁻⁵, DMS, responses versus baseline, one sample t-test), but not in DLS (t(5) = 1.5, p=0.17, responses versus baseline, one sample t-test). Responses were different across striatal areas (F(2,19) = 13.1, p=2.5 × 10⁻⁴, ANOVA; t(13) = −4.1, p=0.0012, VS versus DLS; t(11) = −3.3, p=0.0065, DMS versus DLS; t(14) = −1.4, p=0.16, VS versus DMS, two sample t-test). n = 9, 7, six animals for VS, DMS, DLS.
-
Figure 5—source data 1
Summary statistics.
- https://cdn.elifesciences.org/articles/62390/elife-62390-fig5-data1-v2.xlsx
Figure 6 with 1 supplement
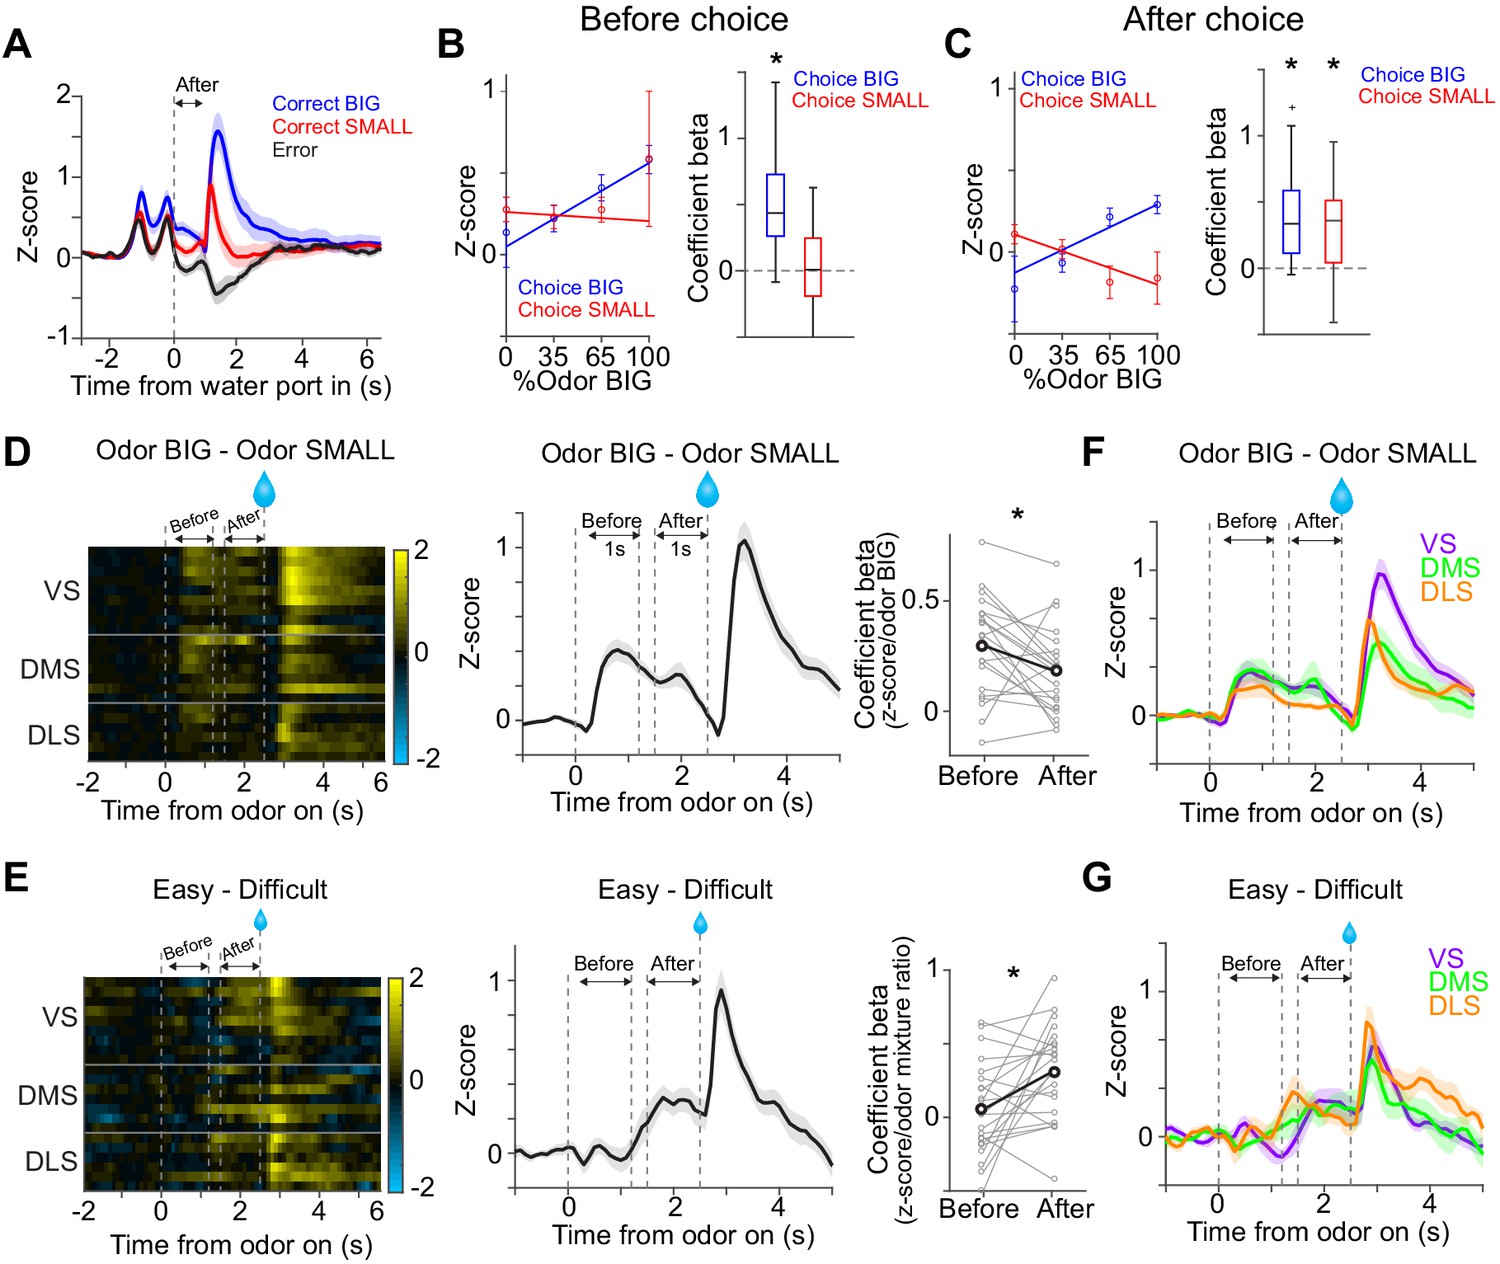
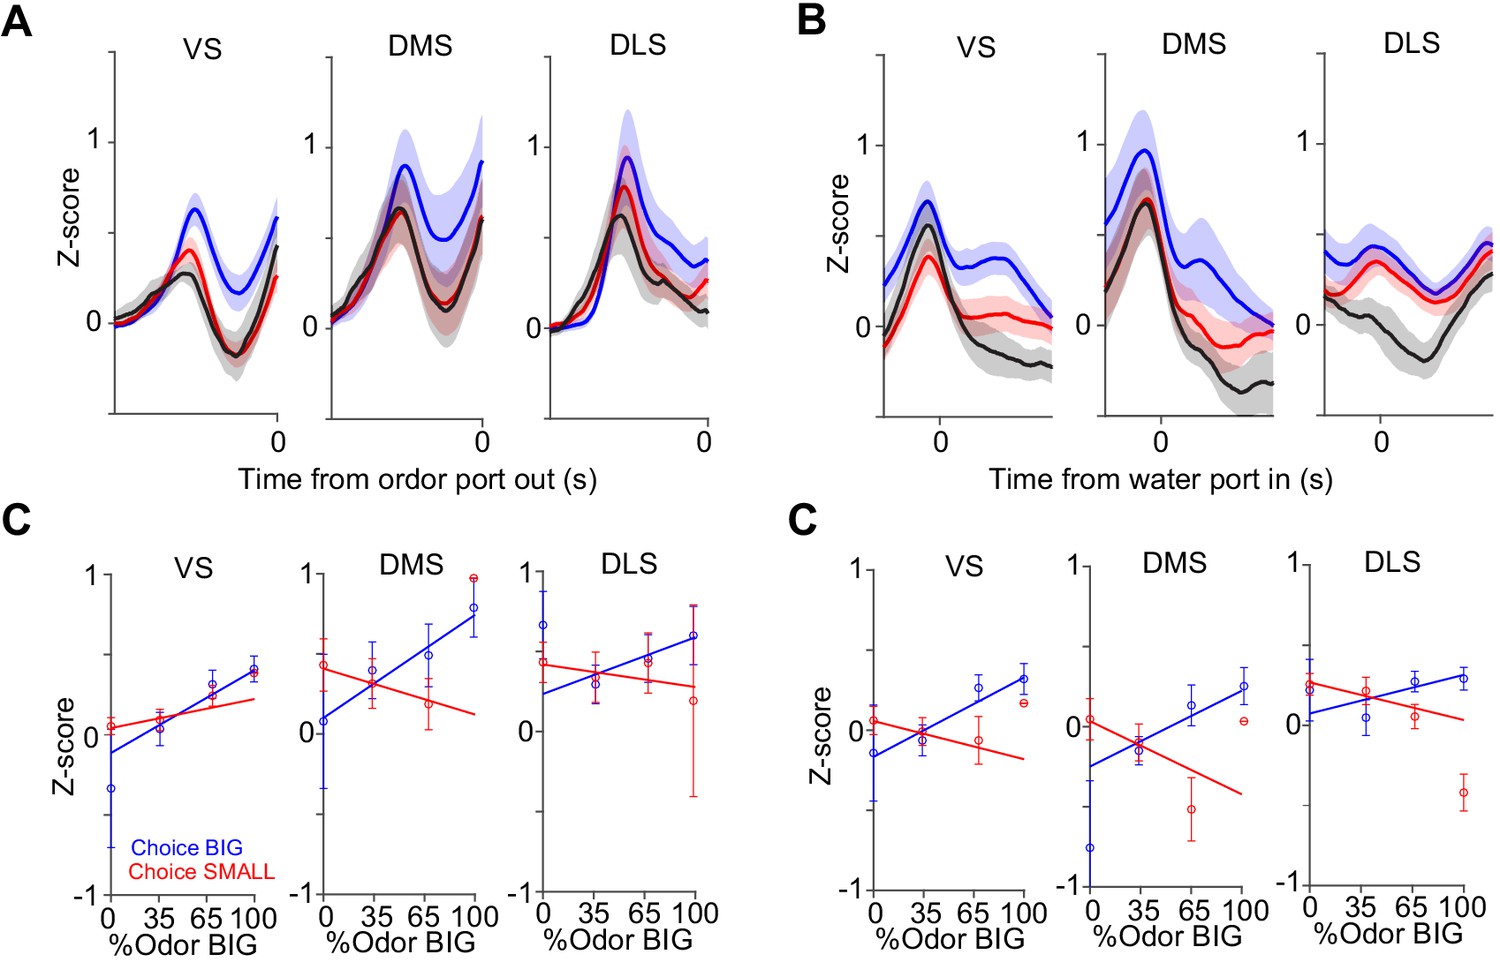
Dopamine signals stimulus-associated value and sensory evidence with different dynamics.
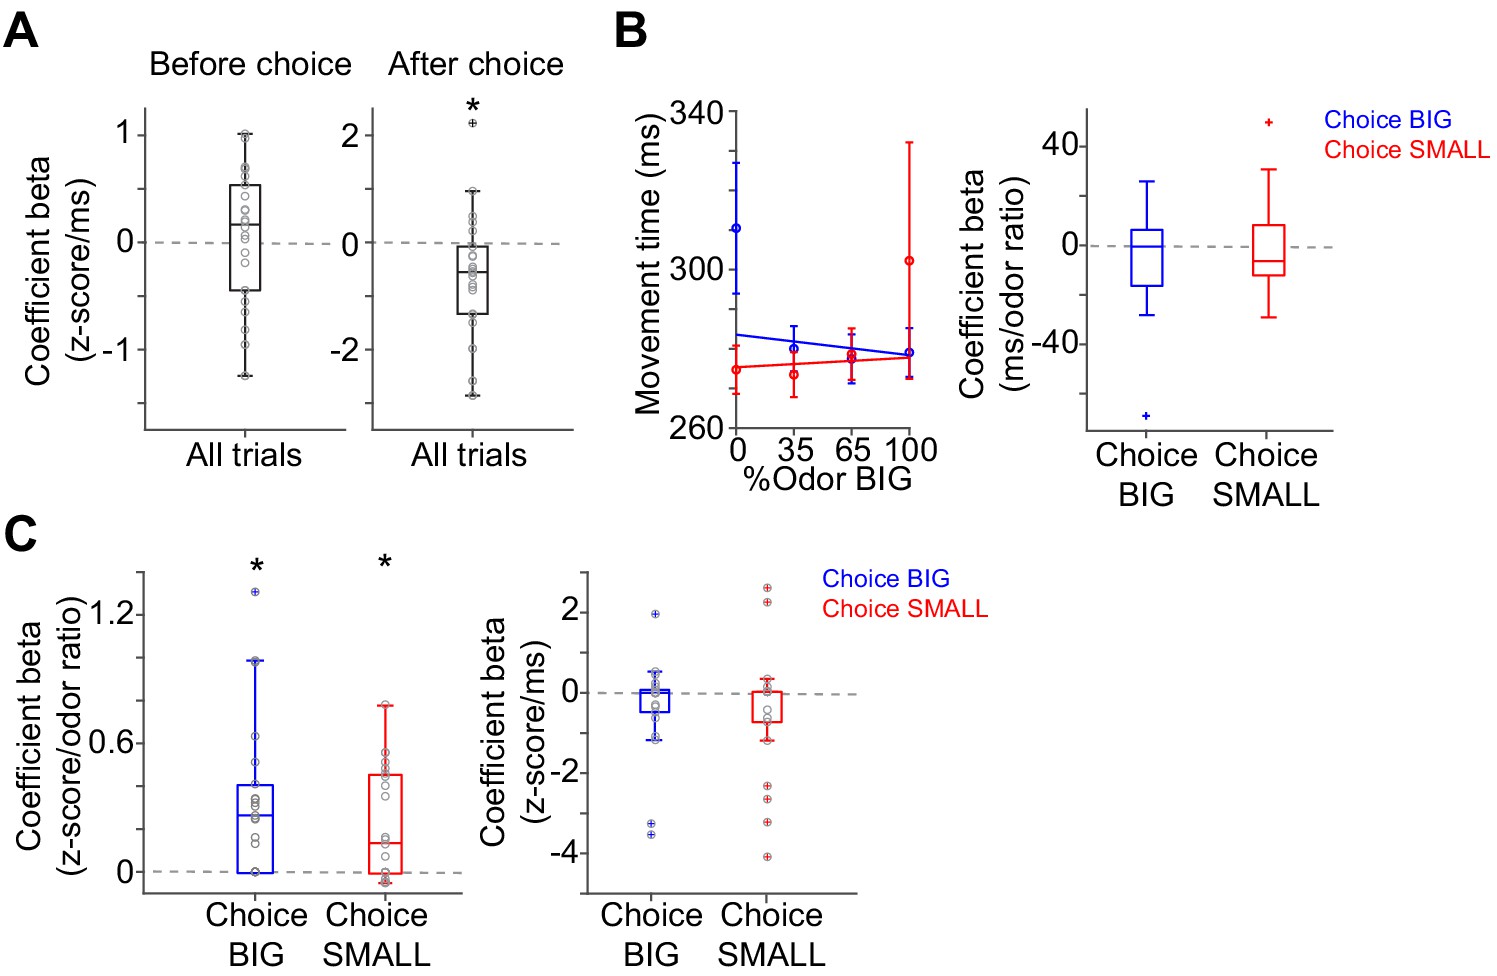
(A) Dopamine axon activity pattern aligned to time of water port entry for all animals (mean ± SEM). (B) Responses before choice (−1–0 s before odor port out) were fitted with linear regression with odor mixture ratio, and coefficient beta (slope) for all the animals are plotted. Correlation slopes were significantly positive for choice of the BIG side (t(21) = 6.0, p=5.6 × 10⁻⁶, one sample t-test), but not significant for choice of the SMALL side (t(21) = −0.8, p=0.42, one sample t-test). (C) Responses after choice (0–1 s after water port in) were fitted with linear regression with stimulus evidence (odor %) and coefficient beta (slope) for all the animals are plotted. Correlation slopes were significantly positive for both choice of the BIG side (t(21) = 5.6, p=1.4 × 10⁻⁵, one sample t-test) and of the SMALL side (t(21) = 4.4, p=2.2 × 10⁻⁴, one sample t-test). (D) Dopamine axon activity with an odor that instructed to choose BIG side (pure odor, correct choice) minus activity with odor that instructed to choose SMALL side (pure odor, correct choice) in each recording site (left), and the average difference in activity was plotted (mean ± SEM, middle). Correlation slopes between responses and stimulus-associated value (water amounts) significantly decreased after choice (t(21) = 2.3, p=0.026, before choice (−1–0 s before odor port out) versus after choice (0–1 s after water port in), pure odor, correct choice, paired t-test). (E) Dopamine axon activity when an animal chose SMALL side in easy trials (pure odor, correct choice) minus activity in difficult trials (mixture odor, wrong choice) in each recording site (left), and the average difference in activity was plotted (mean ± SEM, center). Coefficient beta between responses to odors and sensory evidence (odor %) significantly increased after choice (t(21) = −2.9, p=0.0078, before choice versus after choice, paired t-test). (F) Average difference in activity (odor BIG minus odor SMALL) before and after choice in each striatal area. The difference of coefficient (before versus after choice) was not significantly different across areas (F(2,19) = 0.15, p=0.86, ANOVA). (G) Average difference in activity (easy minus difficult) in each striatal area. The difference of coefficient (before versus after choice) was not significantly different across areas (F(2,19) = 1.46, p=0.25, ANOVA). n = 22 animals.
-
Figure 6—source data 1
Summary statistics.
- https://cdn.elifesciences.org/articles/62390/elife-62390-fig6-data1-v2.xlsx
Figure 6—figure supplement 1
Dopamine axon responses before and after choice in each striatal area.
Dopamine axon responses before choice (−1–0 s before odor port out) (A) and after choice (0–1 s after water port in) (B). (C) Responses before choice was fitted with linear regression with sensory evidence (odor %) and average fitted lines in each striatal area were plotted. Although the correlation slope for BIG choice was slightly modulated by striatal areas (choice BIG, F(2,19) = 7.3, p=0.0043, ANOVA; VS versus DMS, t(14) = −0.63, p=0.53; VS versus DLS, t(13) = 0.70, p=0.49; DMS versus DLS, t(11)=1.4, p=0.18, two sample t-test; choice SMALL, F(2,19) = 3.0, p=0.071, ANOVA; t(14) = 4.0, p=0.0013, VS versus DMS; t(13) = 2.4, p=0.031, VS versus DLS; t(11) = −0.97, p=0.35, DMS versus DLS, two sample t-test), it was not correlated with anatomical locations (linear regression coefficient, t = 0.7, p=0.44, anterior-posterior; t = −0.5, p=0.60, medial-lateral; t = −0.6, p=0.51, ventral-dorsal, n = 22 animals). (D) Responses after choice was fitted with linear regression with sensory evidence and an average fitted line of each striatal area was plotted. The correlation slope was not significantly modulated by striatal areas (F(2,19) = 1.1, p=0.35 for choice BIG; F(2,19) = 1.0, p=0.35 for choice SMALL, ANOVA). n = 22 animals.
Figure 7 with 6 supplements
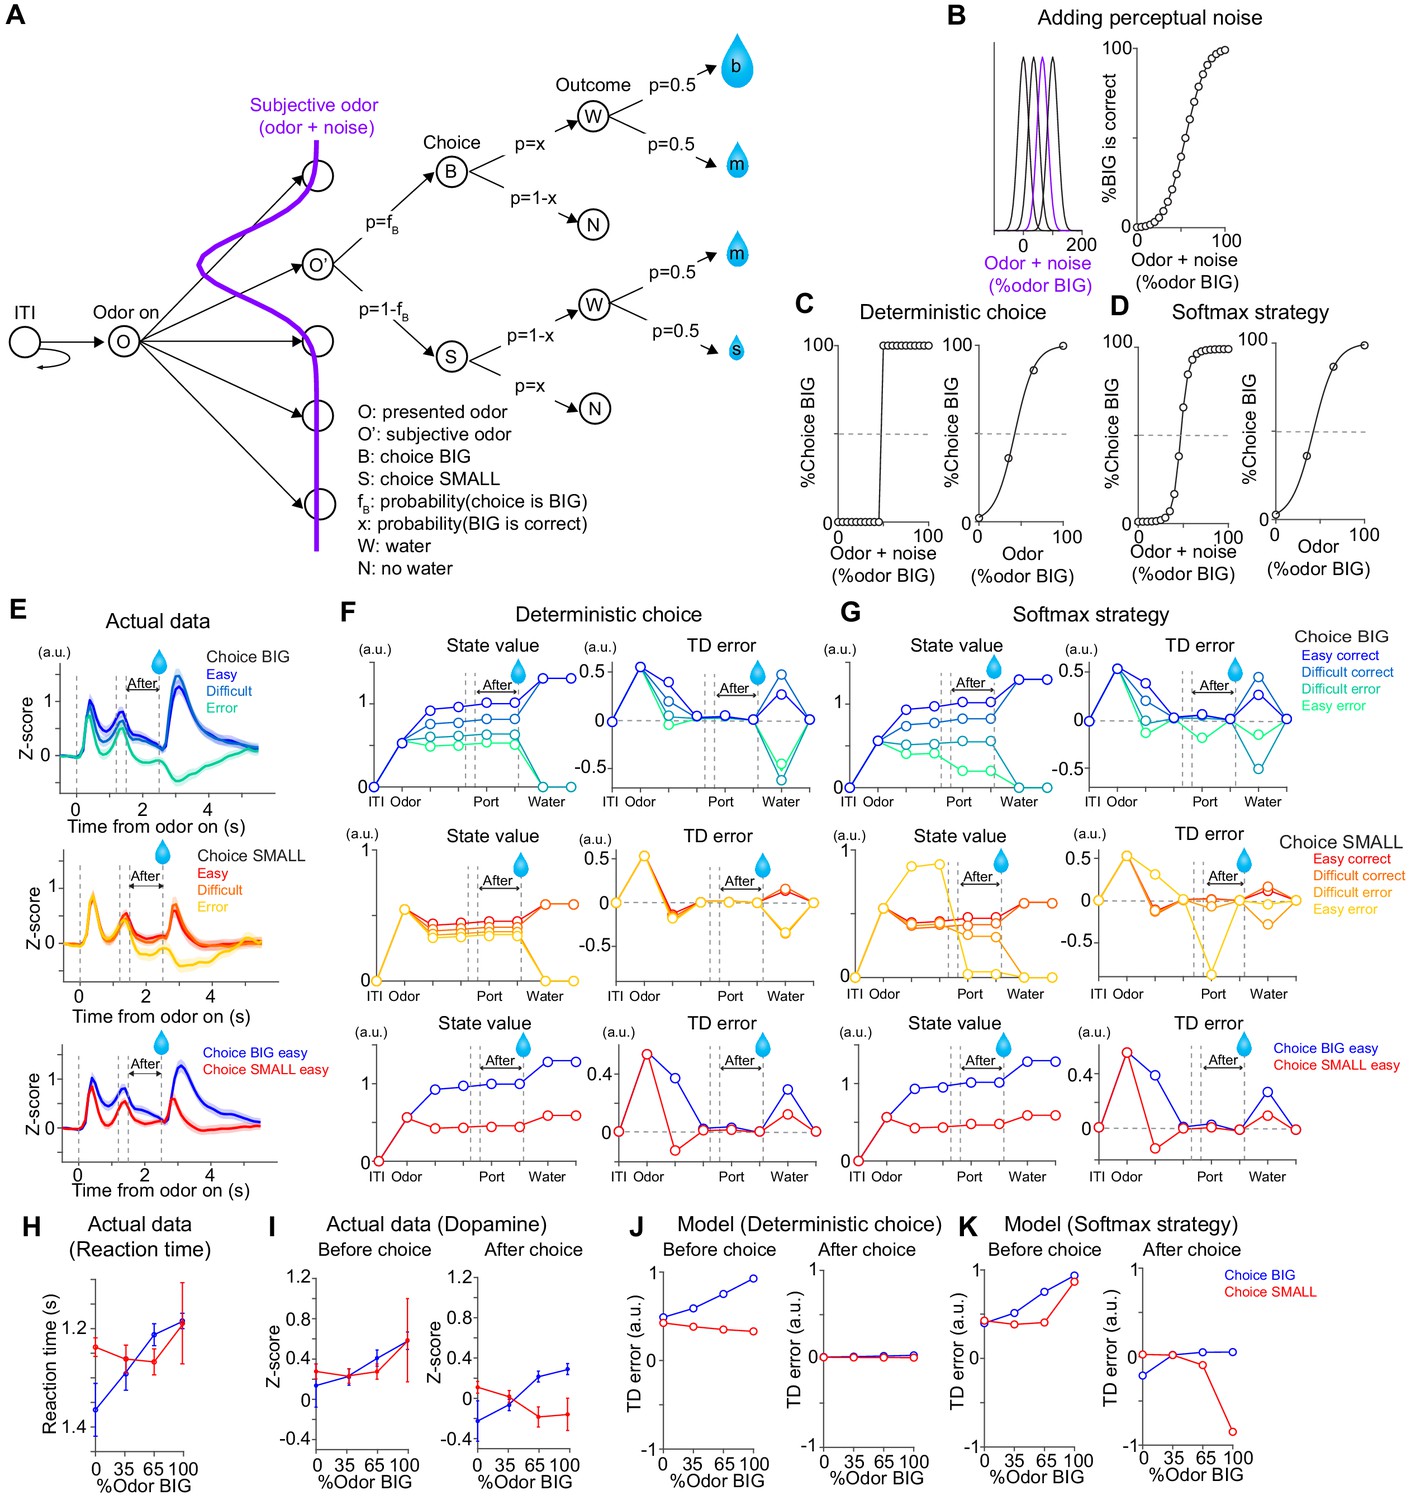
TD error dynamics capture emergence of sensory evidence after stimulus-associated value in dopamine axon activity.
(A) Trial structure in the model. Some repeated states are omitted for clarification. (B–D) Models were constructed by adding perceptual noise with normal distribution to each experimenter's odor (B left, subjective odor), calculating correct choice for each subjective odor (B right), and determining choice for each subjective odor (C or D left) according to choice strategy in the model. The final choice for each objective odor by experimenters (odor %) was calculated as the weighted sum of choice for subjective odors (C or D right). (E) Dopamine axon activity in trials with different levels of stimulus evidence: easy (pure odor, correct choice), difficult (mixture odor, correct choice), and error (mixture odor, error), when animals chose the BIG side (top) and when animals chose the SMALL side (middle). Bottom, dopamine axon activity when animals chose the BIG or SMALL side in easy trials (pure odor, correct choice). (F, G) Time course in each trial of value (left) and TD error (right) of a model. (H) Line plots of actual reaction time from Figure 1G. Y-axis are flipped for better comparison with models. (I) Line plots of actual dopamine axon responses before and after choice from Figure 6B and C. (J, K) Model responses before and after choice were plotted with sensory evidence (odor %). Arbitrary unit (a.u.) was determined by value of standard reward as 1 (see Materials and methods).
Figure 7—figure supplement 1
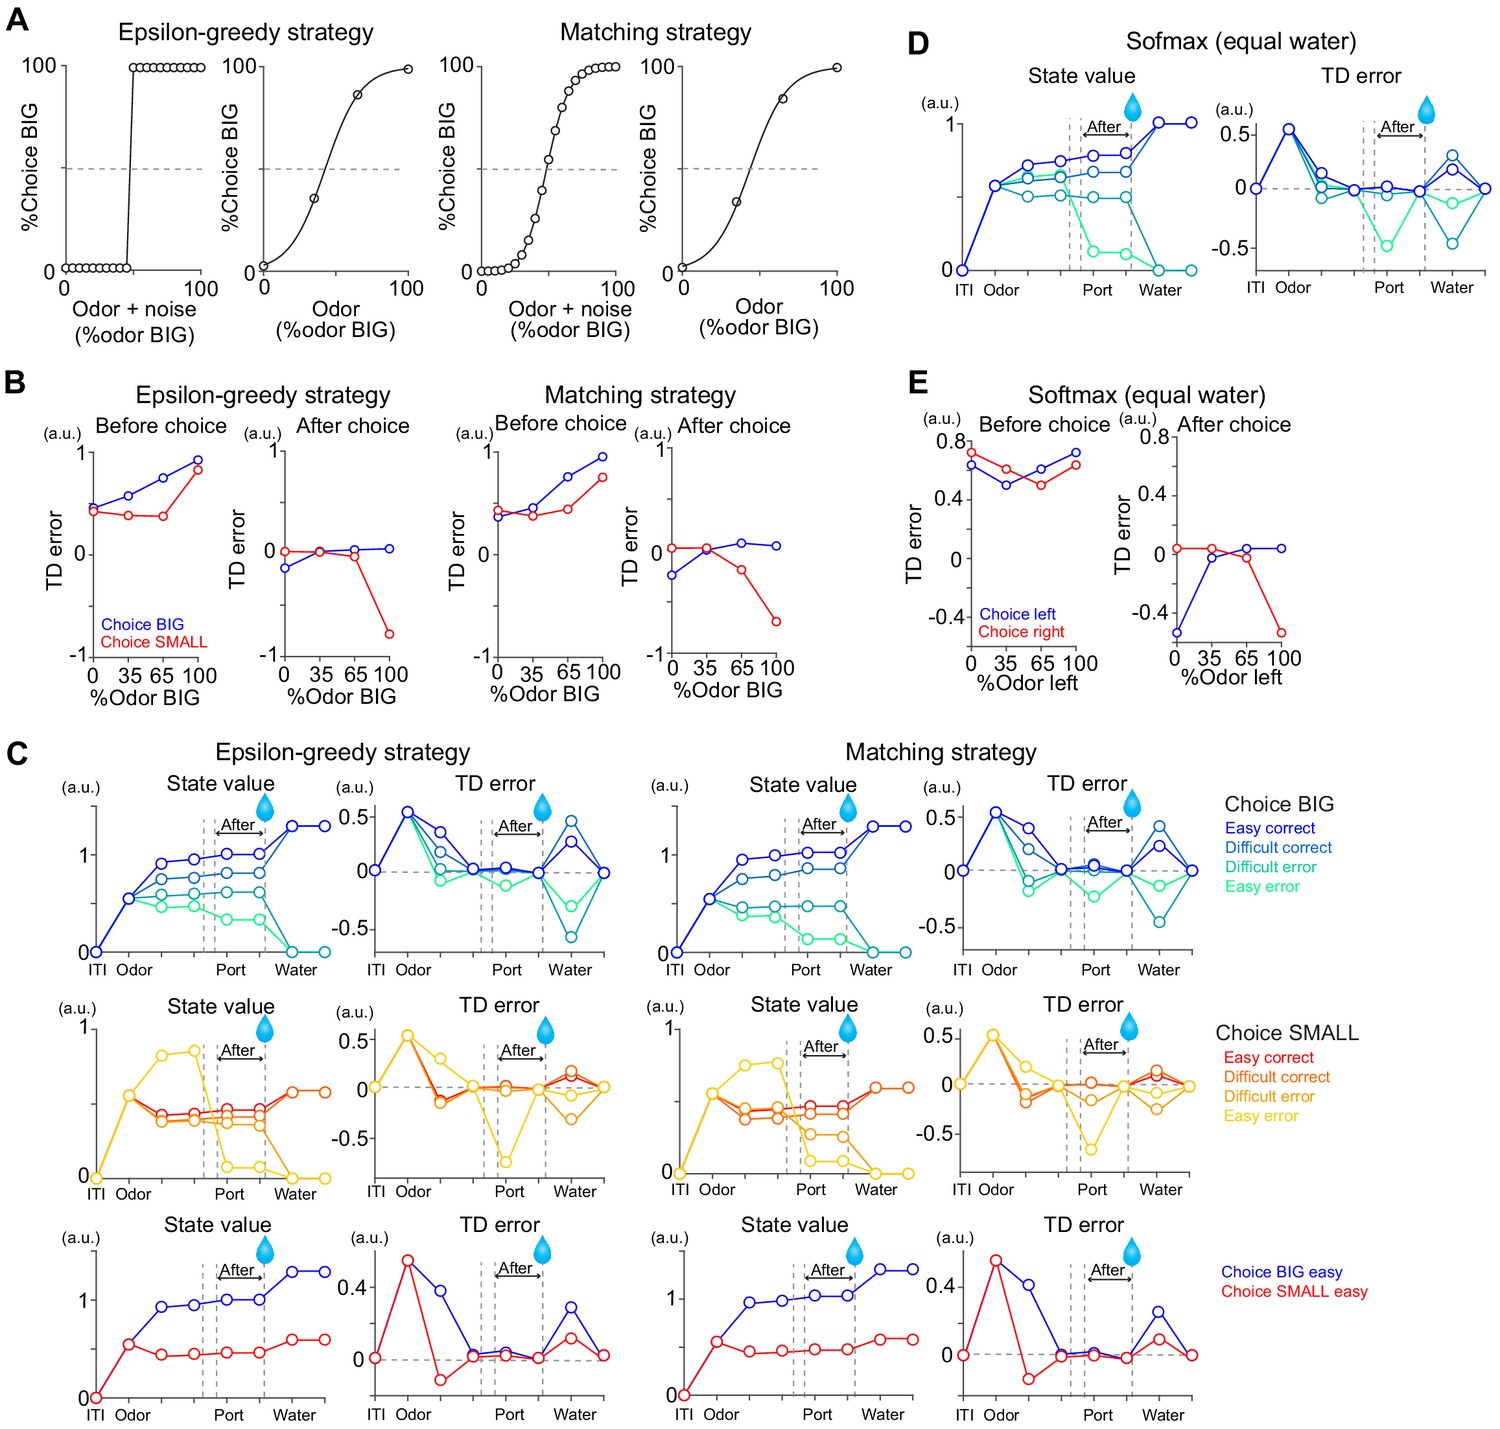
TD errors with stochastic choice strategies.
(A) choice for each subjective odor (left) and choice for each objective odor (right) with epsilon greedy strategy and matching strategy. (B) TD errors with different sensory evidence (odor %) before and after choice in each model. (C) The temporal dynamics of state values and TD errors in each model. (D) The temporal dynamics of state values and TD errors with a softmax choice strategy (Figure 7D) but with equal amounts of water for both water ports. (E) TD errors with different levels of sensory evidence (odor %) before and after choice in model from D. Arbitrary unit (a.u.) was determined by value of standard reward as 1 (see Materials and methods).
Figure 7—figure supplement 2
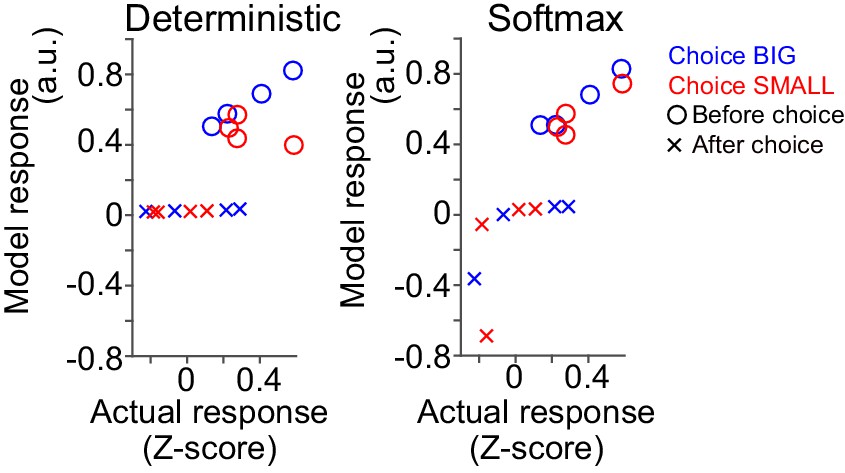
Comparison of model and actual responses.
Model responses were compared with average actual responses before choice (1–0 s before odor port out) and after choice (0–1 s after water port in) in scatter plots. Arbitrary unit (a.u.) was determined by value of standard reward as 1 (see Materials and methods).
Figure 7—figure supplement 3
Correlation between dopamine axon signals and reaction time.
Linear regression of dopamine axon signals before choice with reaction time. Although both dopamine axon signals before choice and reaction time are similarly modulated by state value (Figure 1G, Figure 6B, Figure 7H), (I), they do not show trial-to-trial correlation (t(21) = −0.6, p=0.55, one sample t-test, n = 22 animals).
Figure 7—figure supplement 4
Correlation between dopamine axon signals and movement time.
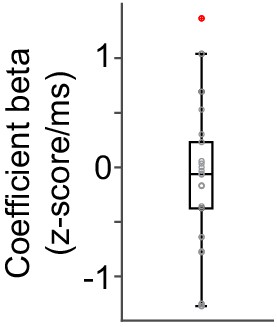
(A) Linear regression of dopamine axon signals with movement time. There is weak negative correlation between movement time and dopamine axon signals after choice (t(21) = 0.4, p=0.66 before choice; t(21) = −2.4, p=0.022 after choice, one-sample t-test). (B) Linear regression of movement time with sensory evidence in trials separated by choice BIG and SMALL. t(21) = −1.1, p=0.24 for choice BIG; t(21) = 0.5, p=0.56 for choice SMALL, one sample t-test. (C) Linear regression of dopamine axon signals after choice with sensory evidence and movement time with elastic net regularization (α = 0.1) with 5-fold cross validation. Dopamine axon signals are correlated with sensory evidence (t(21) = 4.2, p=3.4 × 10⁻⁴ for choice BIG; t(21) = −3.8, p=9.0 × 10⁻⁴ for choice SMALL, one sample t-test) even after normalizing with movement time. Movement time is not significantly correlated any more (t(21) = −1.6, p=0.10 for choice BIG; t(21) = −1.3, p=0.20 for choice SMALL, one sample t-test). n = 22 animals.
Figure 7—figure supplement 5
Dopamine axon responses while animals stayed at water port.
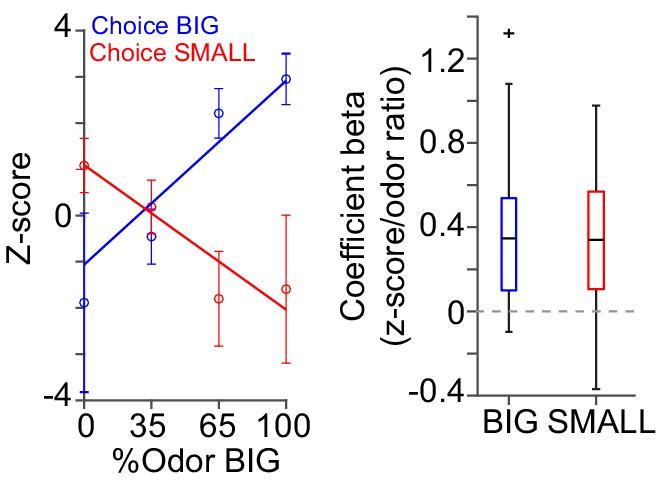
Dopamine axon responses after choice (0–1 s after water port in) were fitted with linear regression with stimulus evidence (odor %) and coefficient beta (slope) for all the animals are plotted, similar to Figure 6C, but excluding trials with premature (<1 s) exit of water port.
Correlation slopes were significantly positive for both choice of the BIG side (t(21) = 4.8, p=7.9 × 10⁻⁵) and of the SMALL side (t(21) = −4.4, p=2.3 × 10⁻⁴). one sample t-test, n = 22 animals.
Figure 7—figure supplement 6

Dopamine axon signals and body movement when a mouse waits for water.
(A) GCaMP signals showed slight but significantly negative correlation with body speed, but tdTom did not (Pearson's correlation coefficient, t(21) = −2.6, p=0.015 for GCaMP; t(21) = 1.2, p=0.20 for tdTom, n = 22 animals, one sample t-test). tdTom signals in some animals show significant correlation, indicating motion artifacts in recording. (B) GCaMP, but not body speed or tdTom were modulated by correct choice versus error (t(21) = 3.3, p=0.0033 for GCaMP; t(21) = 0.43, p=0.66 for body speed; t(21) = −0.4, p=0.63 for tdTom, n = 22 animals, paired t-test). (C) Linear regression of GCaMP signals with accuracy (correct or error) and body speed with elastic net regularization. GCaMP is modulated by accuracy (t(21) = 13.9, p=4.2 × 10⁻¹², n = 22 animals, one sample t-test) even after normalizing with body speed. Body speed is slightly correlated (t(21) = −2.2, p=0.032, n = 22 animals, two-sided t-test). Red dots indicate significant (p<0.05) regression coefficient in each animal. 2 videos for 21 animals and 1 video for 1 animal were used.
Figure 8
A potential mechanism of different zero-crossing points in dopamine neurons.
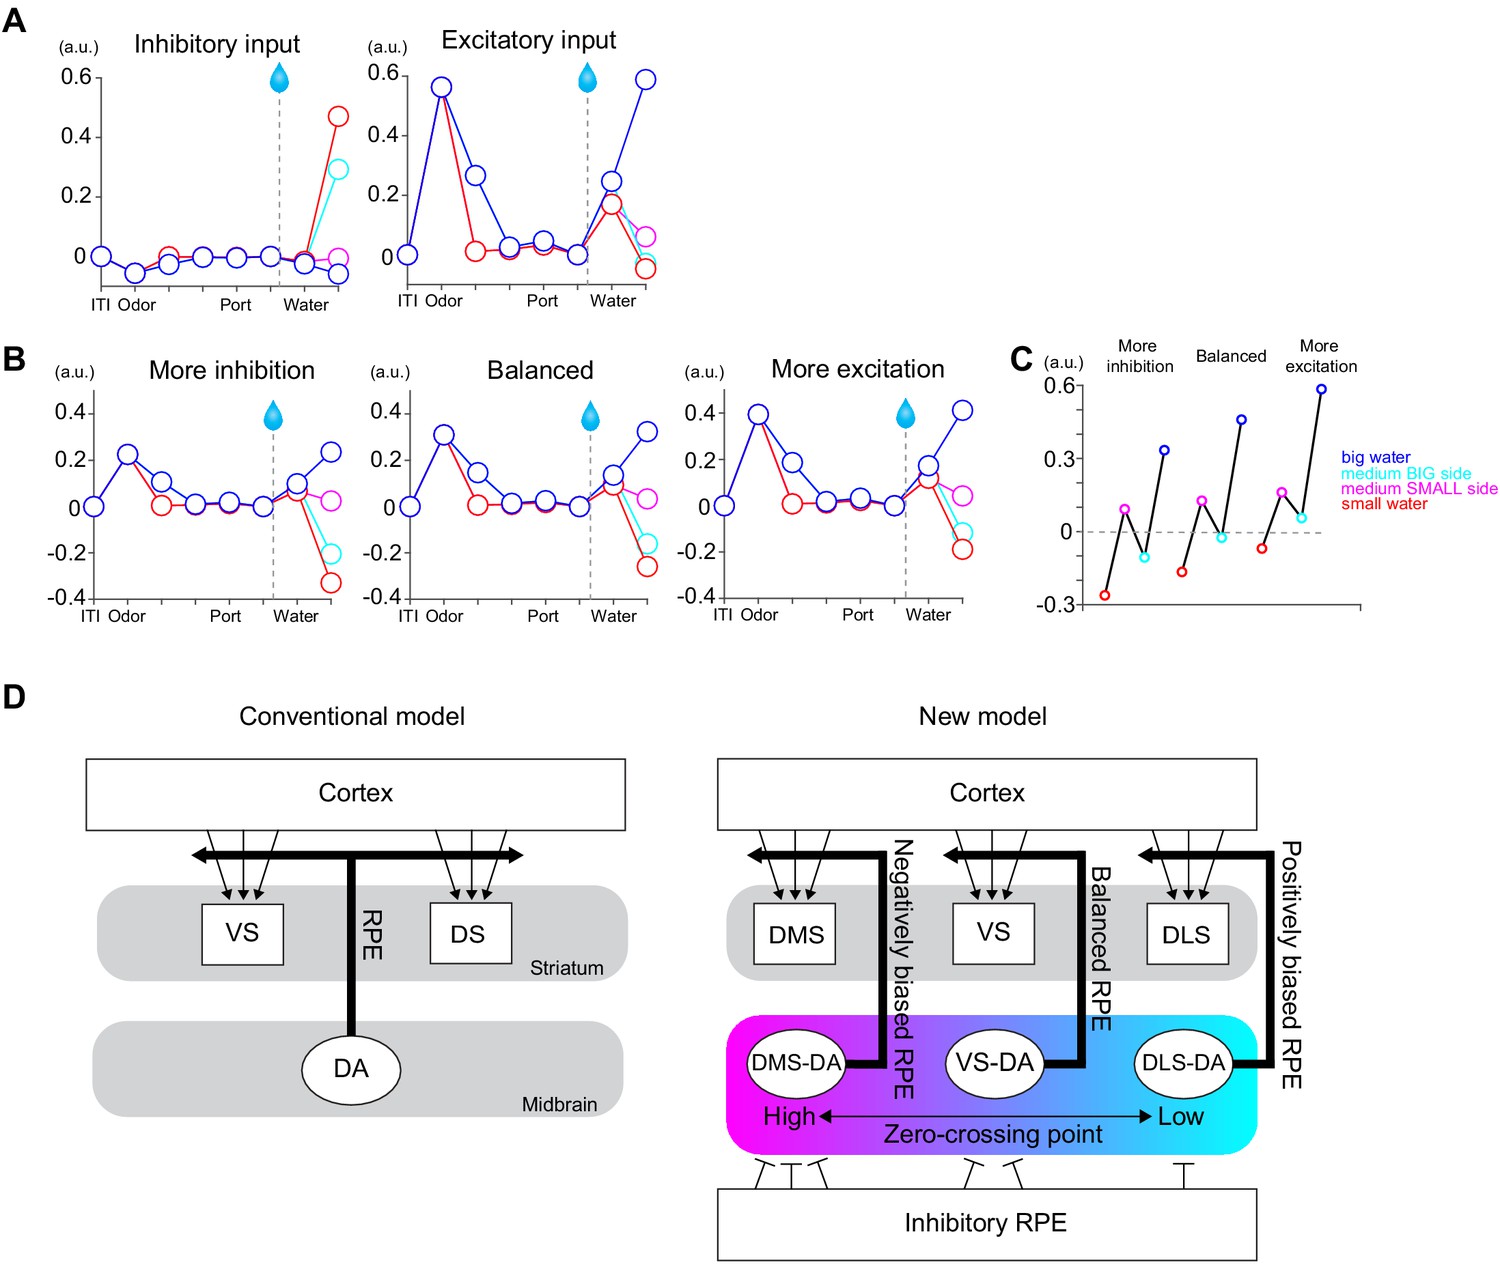
(A) A simplified model with only two inputs, one is inhibitory, and the other is excitatory, both of which encode TD errors but send information to the postsynaptic neurons mainly with excitation (1/10 with inhibition). (B) TD errors in postsynaptic neurons with different ratios of presynaptic inputs, balanced (1:1), more inhibition (two times more inhibitory inputs) and more excitatory (half of inhibitory inputs). (C) Net responses to water in these three postsynaptic neurons. (D) Left, conventional models such as actor-critic models assume the same TD errors to be broadcasted throughout the striatum. Right, we propose that the striatal subareas receive slightly different TD errors with different zero-crossing points. One of potential mechanisms is different ratios of presynaptic inputs. Arbitrary unit (a.u.) was determined by value of standard reward as 1 (see Materials and methods).
Tables
Key resources table
| Reagent type (species) or resource | Designation | Source or reference | Identifiers | Additional information |
|---|---|---|---|---|
| Transgenic mouse strain | Dopamine transporter (DAT)-cre | Jackson laboratory | B6.SJL-Slc6a3tm1.1(cre)Bkmn/J | RRID:IMSR JAX:006660 |
| Transgenic mouse strain | Ai14 | Jackson laboratory | Rosa-CAG-LSL-tdTomato | RRID:IMSR JAX:007914 |
| Virus strain | GCaMP7f | UNC Vector Core | AAV5-CAG-FLEX-GCaMP7f | 1.8 × 10¹³ particles/ml |
| Virus strain | tdTomato | UNC Vector Core | AAV5-CAG-FLEX-tdTomato | 2.0 × 10¹³ particles/ml |
Additional files
-
Source code 1
MATLAB code to model state value and TD error.
This code was used to generate Figure 7B–G, and Figure 7—figure supplement 1.
- https://cdn.elifesciences.org/articles/62390/elife-62390-code1-v2.zip
-
Transparent reporting form
- https://cdn.elifesciences.org/articles/62390/elife-62390-transrepform-v2.docx
Download links
A two-part list of links to download the article, or parts of the article, in various formats.
Downloads (link to download the article as PDF)
Open citations (links to open the citations from this article in various online reference manager services)
Cite this article (links to download the citations from this article in formats compatible with various reference manager tools)
Distinct temporal difference error signals in dopamine axons in three regions of the striatum in a decision-making task
eLife 9:e62390.
https://doi.org/10.7554/eLife.62390


