ACLY ubiquitination by CUL3-KLHL25 induces the reprogramming of fatty acid metabolism to facilitate iTreg differentiation
- Key Laboratory of Molecular Epigenetics of the Ministry of Education (MOE), Northeast Normal University, China
- Shanghai Institute of Immunology, Shanghai Jiao Tong University School of Medicine, China
- Department of Immunology and Microbiology, Shanghai Jiao Tong University School of Medicine, China
- Tongji University Cancer Center, Shanghai Tenth People’s Hospital, School of Medicine, Tongji University, China
Figures
Figure 1 with 1 supplement
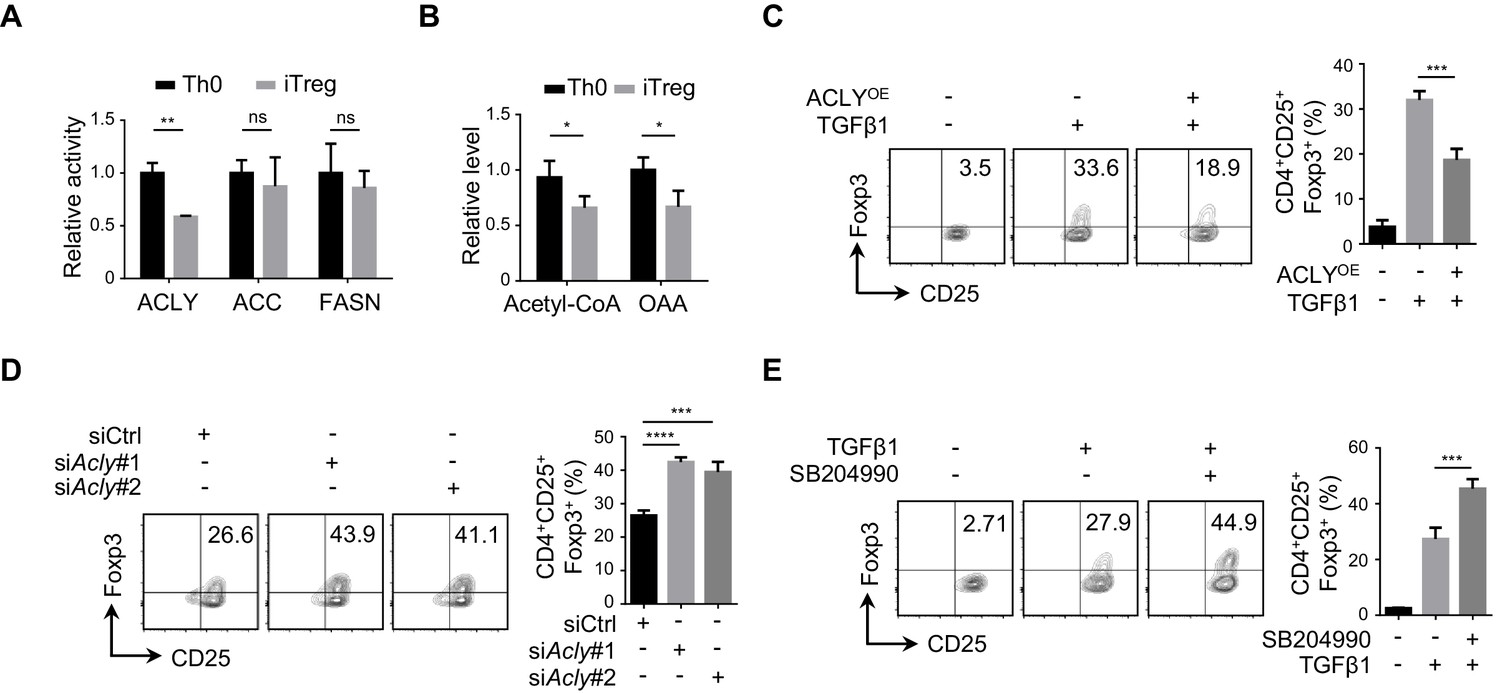
ACLY is critical for iTreg cell differentiation.
(A, B) Detection of ATP-citrate lyase (ACLY) activity in inducible regulatory T (iTreg) cells. Naive CD4+ T cells isolated from mice were cultured with Dynabeads Mouse T-Activator CD3/CD28 and rmIL-2 for 72 hr to obtain activated T (Th0) cells or simultaneously supplemented with rhTGFβ1 (2 ng/ml) to generate iTreg cells. (A) Assessment of enzymatic activity for ACLY, acetyl-CoA carboxylase (ACC), and fatty acid synthase (FASN) from Th0 or iTreg cells. (B) Assay for cytosol acetyl-CoA and oxaloacetic acid (OAA) from Th0 or iTreg cells. (C) ACLY overexpression affects iTreg differentiation. Naive CD4+ T cells were transfected with GFP-ACLY and cultured under Th0- or iTreg-polarization condition as in (A). Cells were analyzed by flow cytometry (FCM) to evaluate GFP+CD25+Foxp3+ iTreg cells. (D, E) Inhibition of ACLY influences iTreg differentiation. Naive CD4+ T cells transfected with small interfering RNAs (siRNAs) against Acly (D) or treated with SB204990 (100 μM) (E) were cultured under Th0- or iTreg (with 0.5 ng/ml rhTGFβ1)-polarization condition for 72 hr. CD4+CD25+Foxp3+ iTreg cells were assayed by FCM (left) and quantified (right). Data represent mean ± SD of three independent experiments, with significance determined by Student's t-test (A, B) or one-way analysis of variance (ANOVA) test (C–E). *p<0.05, **p<0.01, ***p<0.001, and ****p<0.0001; ns, nonsignificant.
Figure 1—figure supplement 1
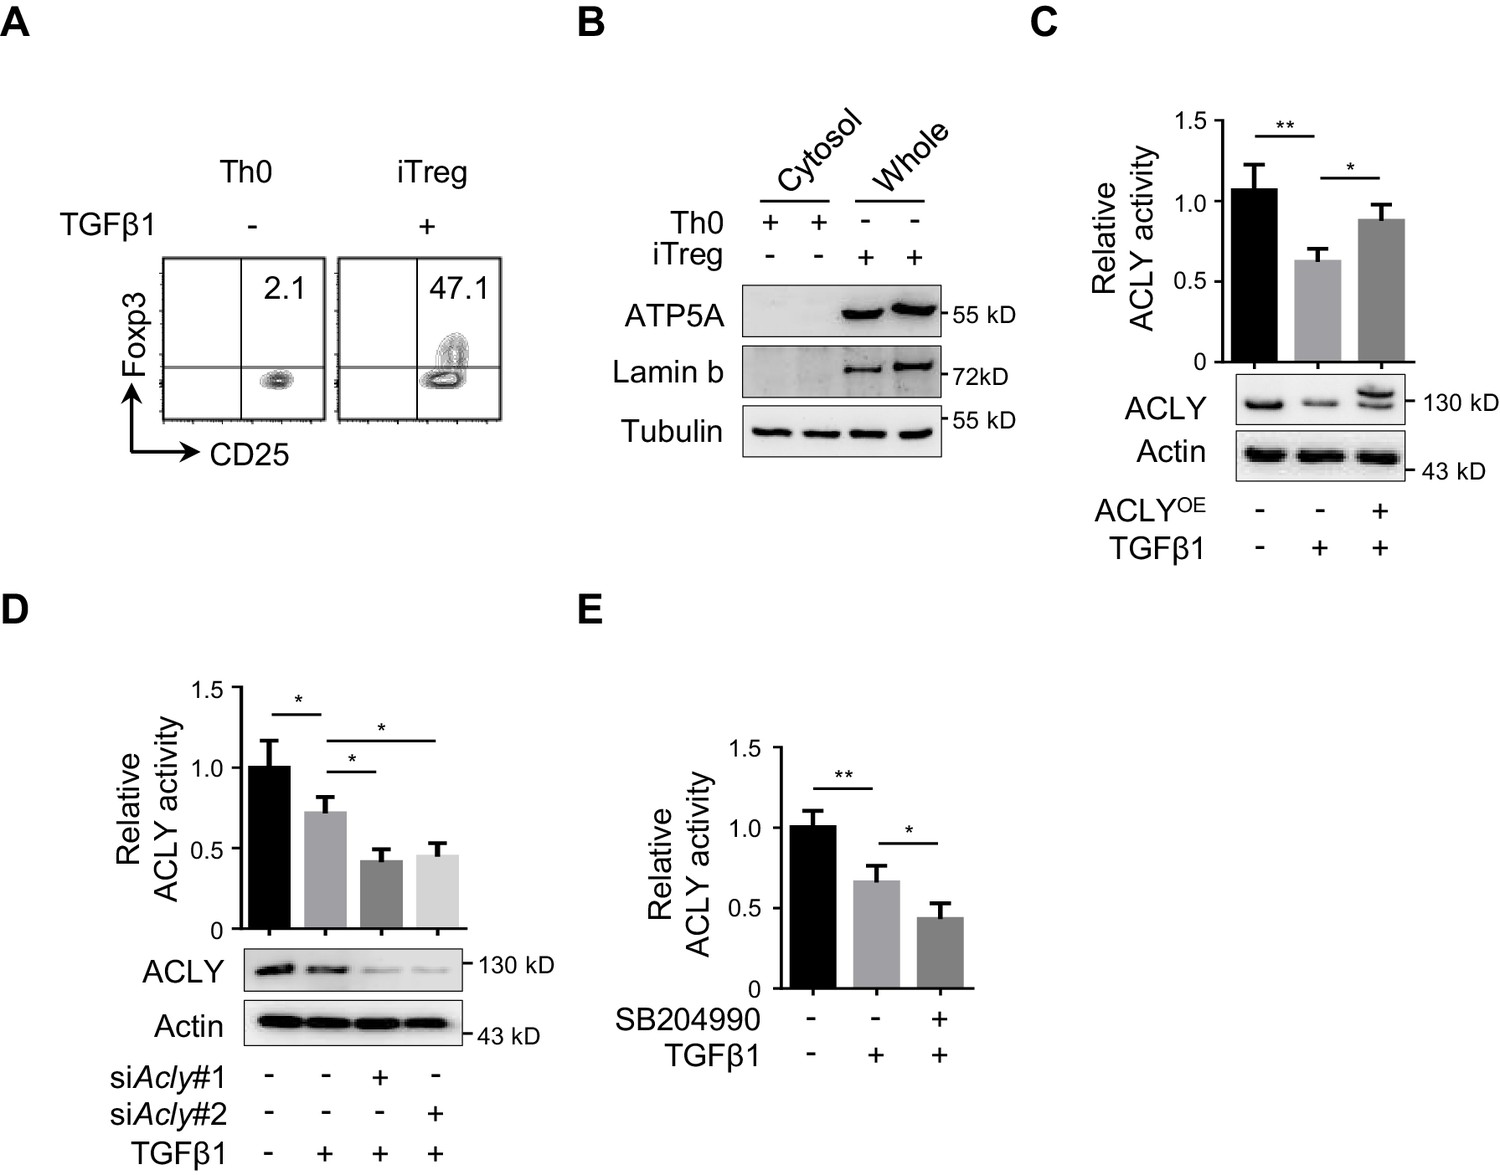
Analyses of ACLY activity during iTreg differentiation.
(A) Activated T (Th0) and inducible regulatory T (iTreg) cell polarization in vitro. Naive CD4+ T cells isolated from mice were cultured with Dynabeads Mouse T-Activator CD3/CD28 and rmIL-2 for 72 hr to obtain Th0 cells or simultaneously supplemented with rhTGFβ1 (2 ng/ml) to generate iTreg cells. CD4+CD25+Foxp3+ iTreg cells were evaluated by flow cytometry (FCM). (B) Isolation of cytosolic fraction. Cytosolic fraction without mitochondria and nuclei was isolated from cells prepared as in (A). (C) Enzymatic activity of ATP-citrate lyase (ACLY). Cells were transfected with GFP-ACLY and cultured as in (A) for 24 hr. Enzymatic activity of ACLY was measured and quantified. (D, E) Assay for ACLY activity in cells treated with siAcly or SB204990. Cells transfected with small interfering RNA (siRNA) against Acly (D) or treated with SB204990 (100 μM) (E) were induced under Th0- or iTreg (with 0.5 ng/ml transforming growth factor β1 [TGFβ1])-polarization condition for 24 hr as in Figure 1E prior to the measurement of enzymatic activity of ACLY. (A, B) One representative experiment out of three independent experiments is represented. (C–E) Data represent mean ± SD based on three independent experiments, with significance determined by one-way analysis of variance (ANOVA) test. *p<0.05, **p<0.01.
Figure 2 with 5 supplements
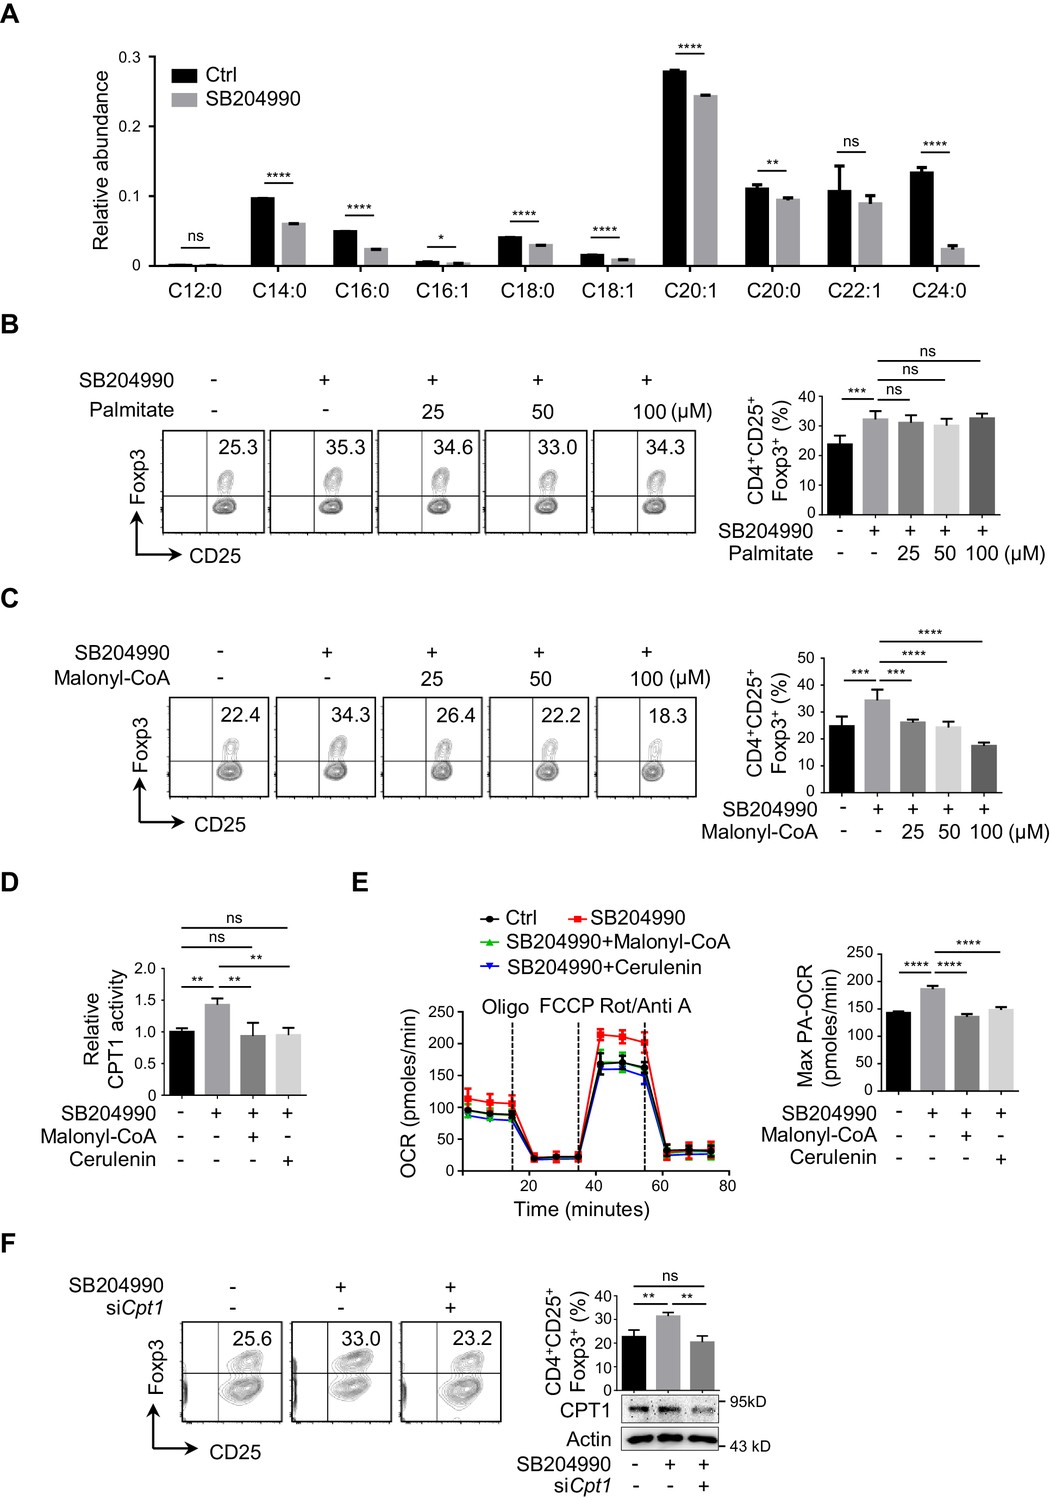
ACLY inhibition induces the reprogramming in fatty acid metabolism during iTreg differentiation.
(A) ATP-citrate lyase (ACLY) inhibition reduces de novo fatty acid synthesis (FAS). Naive CD4+ T cells were treated with SB204990 (100 μM) and cultured under inducible regulatory T (iTreg)-polarization condition as in Figure 1E for 24 hr in the presence of [U-13C] glucose (11 mM). Cells were collected and subjected to metabolic flux analysis for FAS by ultra-high performance liquid chromatography-high resolution mass spectrometry (UHPLC-HRMS) analysis. n = 4, Student's t-test, mean ± SD. *p<0.05, **p<0.01, ****p<0.0001; ns, nonsignificant. (B, C) Functional evaluation of metabolic intermediates from FAS on iTreg differentiation. Naive CD4+ T cells were treated with SB204990 (100 μM) and cultured as in Figure 1E in the presence of different doses of palmitate (B) or malonyl-CoA (C). CD4+CD25+Foxp3+ iTreg cells were assayed by flow cytometry (FCM) (left) and quantified (right). (D, E) ACLY inhibition increases carnitine palmitoyltransferase 1 (CPT1) activity and fatty acid oxidation (FAO). In the presence of malonyl-CoA (50 μM) or cerulenin (4 μM), naive CD4+ T cells treated with SB204990 were cultured as in Figure 1E for 24 hr. Cell lysates were used for analyzing CPT1 activity (D). For oxygen consumption rate (OCR) detection, cells were transferred to XF Base Medium containing palmitate and carnitine. Diagram (left) illustrating the OCR at various conditions and associated quantifications (right) are shown (E). (F) Impact of Cpt1 knockdown on iTreg differentiation. Naive CD4+ T cells transfected with small interfering RNA (siRNA) against Cpt1 were cultured as in Figure 1E. CD4+CD25+Foxp3+ iTreg cells were assayed by FCM (left) and quantified (right). (B–F) Data represent mean ± SD of three (D–F) or four (B, C) independent experiments, with significance determined by one-way analysis of variance (ANOVA) test. **p<0.01, ***p<0.001, and ****p<0.0001; ns, nonsignificant.
Figure 2—figure supplement 1
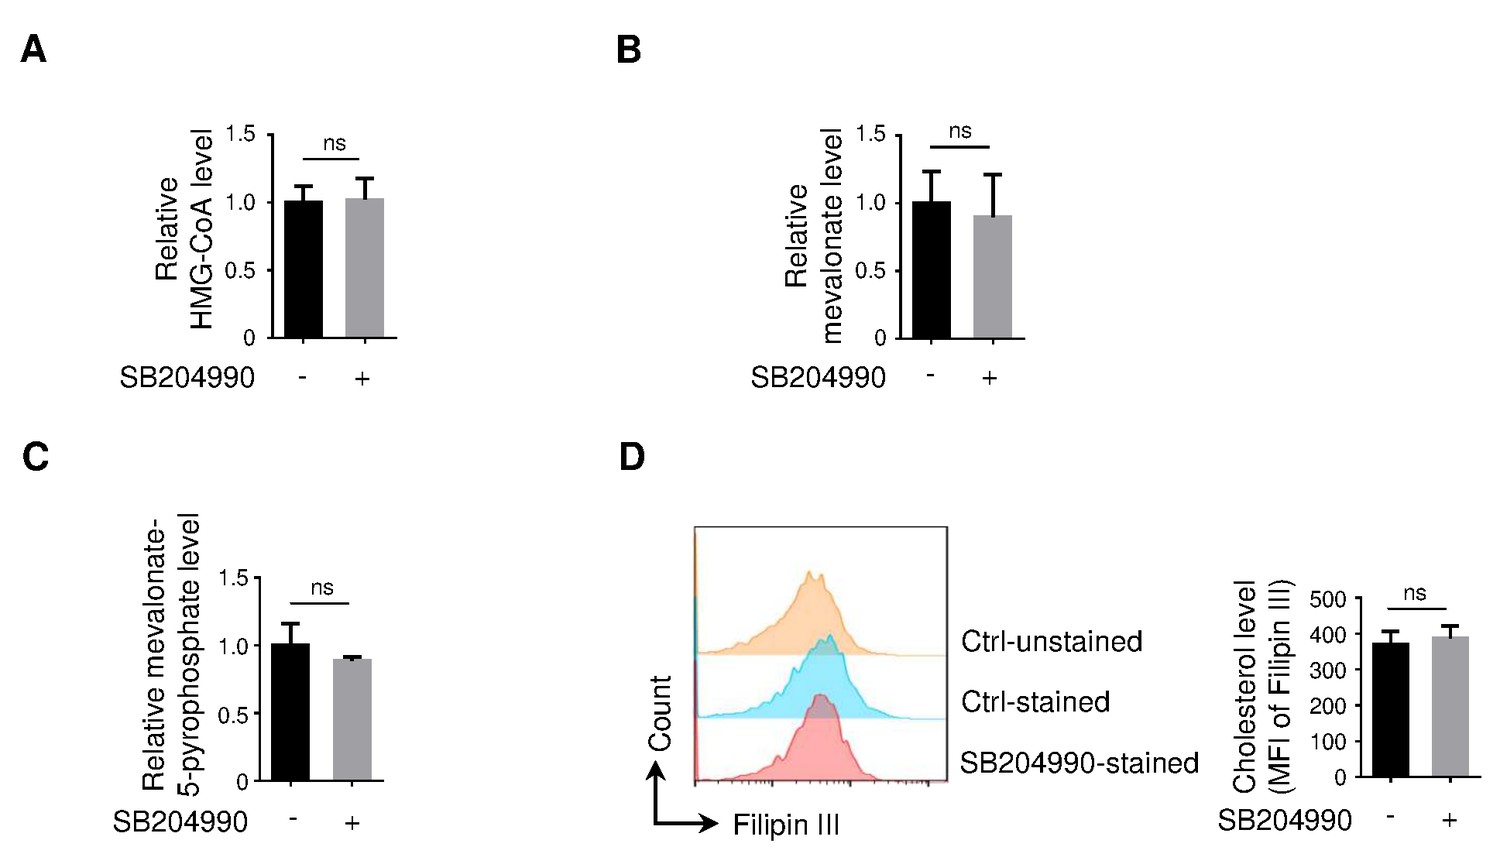
Detection of metabolic intermediates in mevalonate-cholesterol synthesis pathway upon ACLY inhibition.
(A–D) Naive CD4+ T cells treated with SB204990 were cultured under inducible regulatory T (iTreg)-polarization condition as in Figure 1E. Cells were lysed for the detection of HMG-CoA (A), mevalonate (B), and mevalonate-5-pyrophosphate (C) by enzyme-linked immunosorbent assay (ELISA) or stained by Filipin III for evaluating cholesterol by flow cytometry (FCM) (D). Data represent mean ± SD of four independent experiments, with significance determined by Student's t-test. ns, nonsignificant.
Figure 2—figure supplement 2
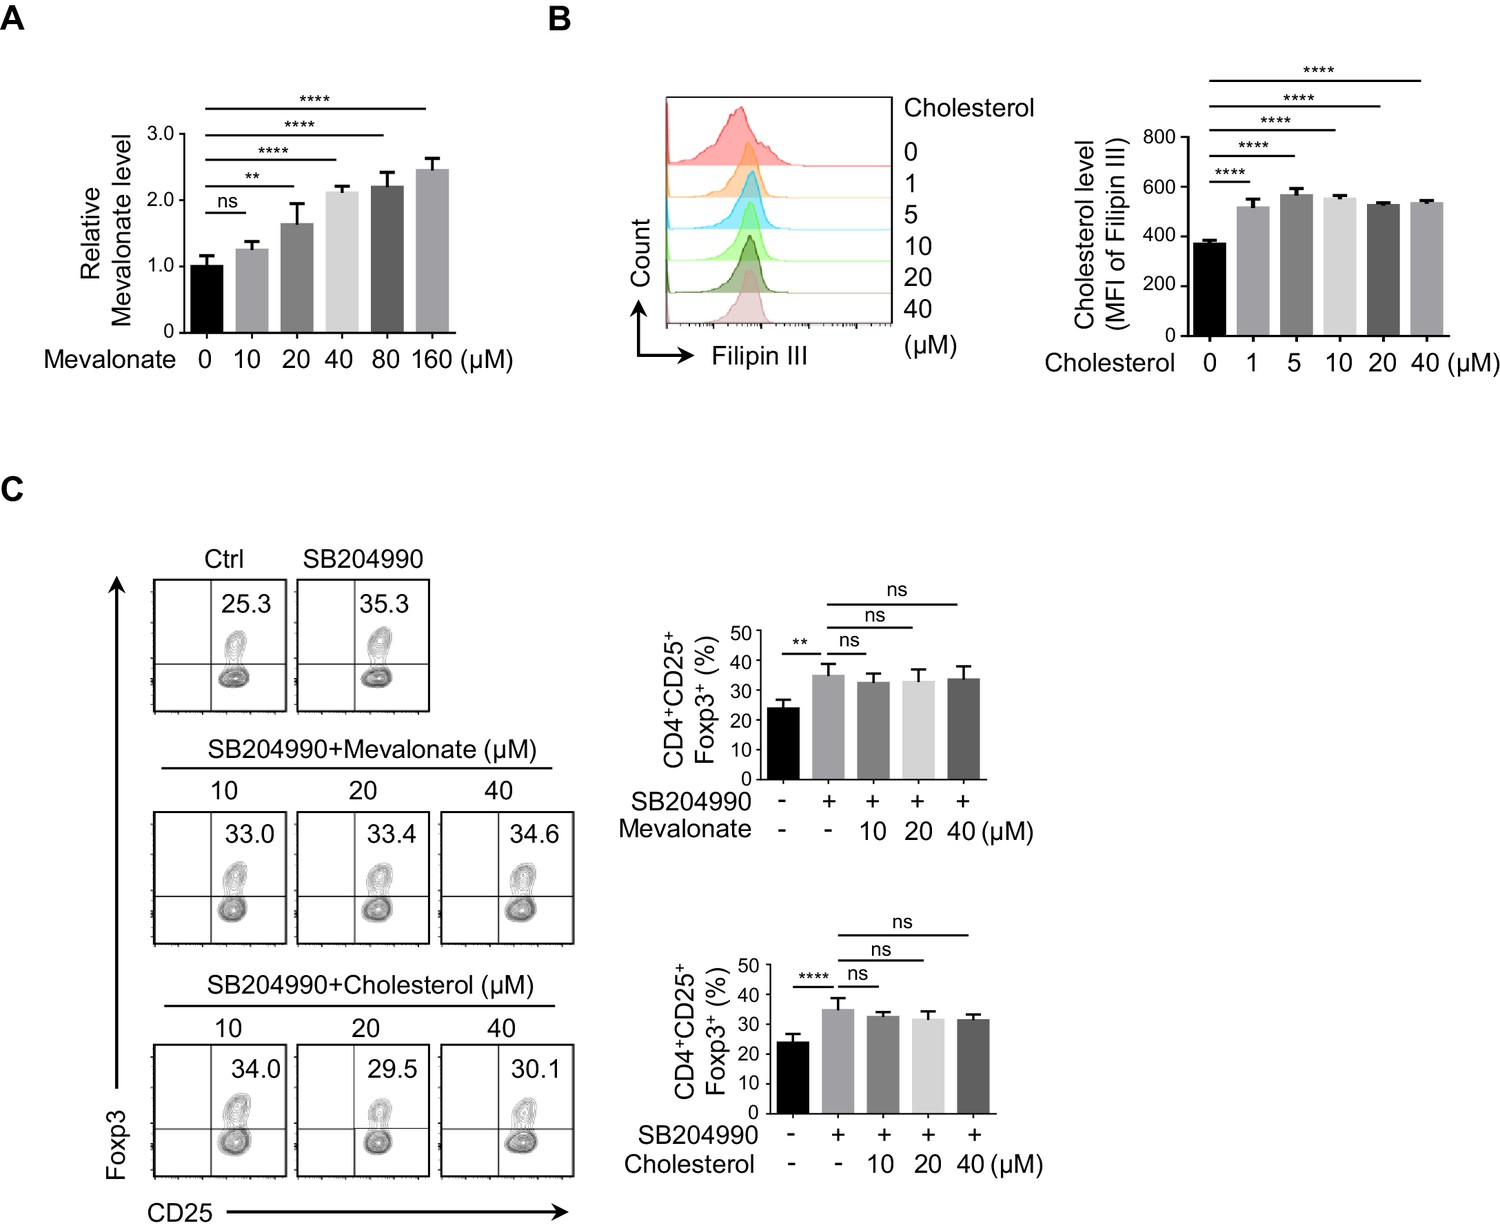
Impact of mevalonate and cholesterol on iTreg differentiation.
(A, B) Assay for mevalonate and cholesterol. Naive CD4+ T cells were cultured under inducible regulatory T (iTreg)-polarization condition as in Figure 1E for 24 hr in the presence of variable doses of mevalonate (A) or cholesterol (B). Levels of mevalonate (A) or cholesterol (B) were evaluated by enzyme-linked immunosorbent assay (ELISA) and flow cytometry (FCM), respectively. (C) Influence from mevalonate and cholesterol on ATP-citrate lyase (ACLY)-inhibition-induced iTreg differentiation. Naive CD4+ T cells were cultured as in Figure 1E in the presence of different doses of mevalonate or cholesterol for 72 hr. Subsequently, CD4+CD25+Foxp3+ iTreg cells were analyzed by FCM (left) and quantified (right). (A–C) Data represent mean ± SD of three (A, B) or four (C) independent experiments, with significance determined by one-way analysis of variance (ANOVA) test. **p<0.01, ****p<0.0001; ns, nonsignificant.
Figure 2—figure supplement 3

Examination of nuclear acetyl-CoA and histone acetylation upon ACLY inhibition.
(A–D) Cells prepared as in Figure 1E for 24 hr were fractionated (A) and evaluated for nuclear acetyl-CoA (B). Acetylation in total histones (C) and H3/H4 from whole-cell lysates (D) were assessed. (B–D) Quantification shows mean ± SD based on three independent experiments, with significance determined by Student's t-test. ns, nonsignificant. For western blot (WB) in (A), (C), and (D), one representative experiment out of three is represented. Associated scores indicate mean intensities based on three biological replicas.
Figure 2—figure supplement 4
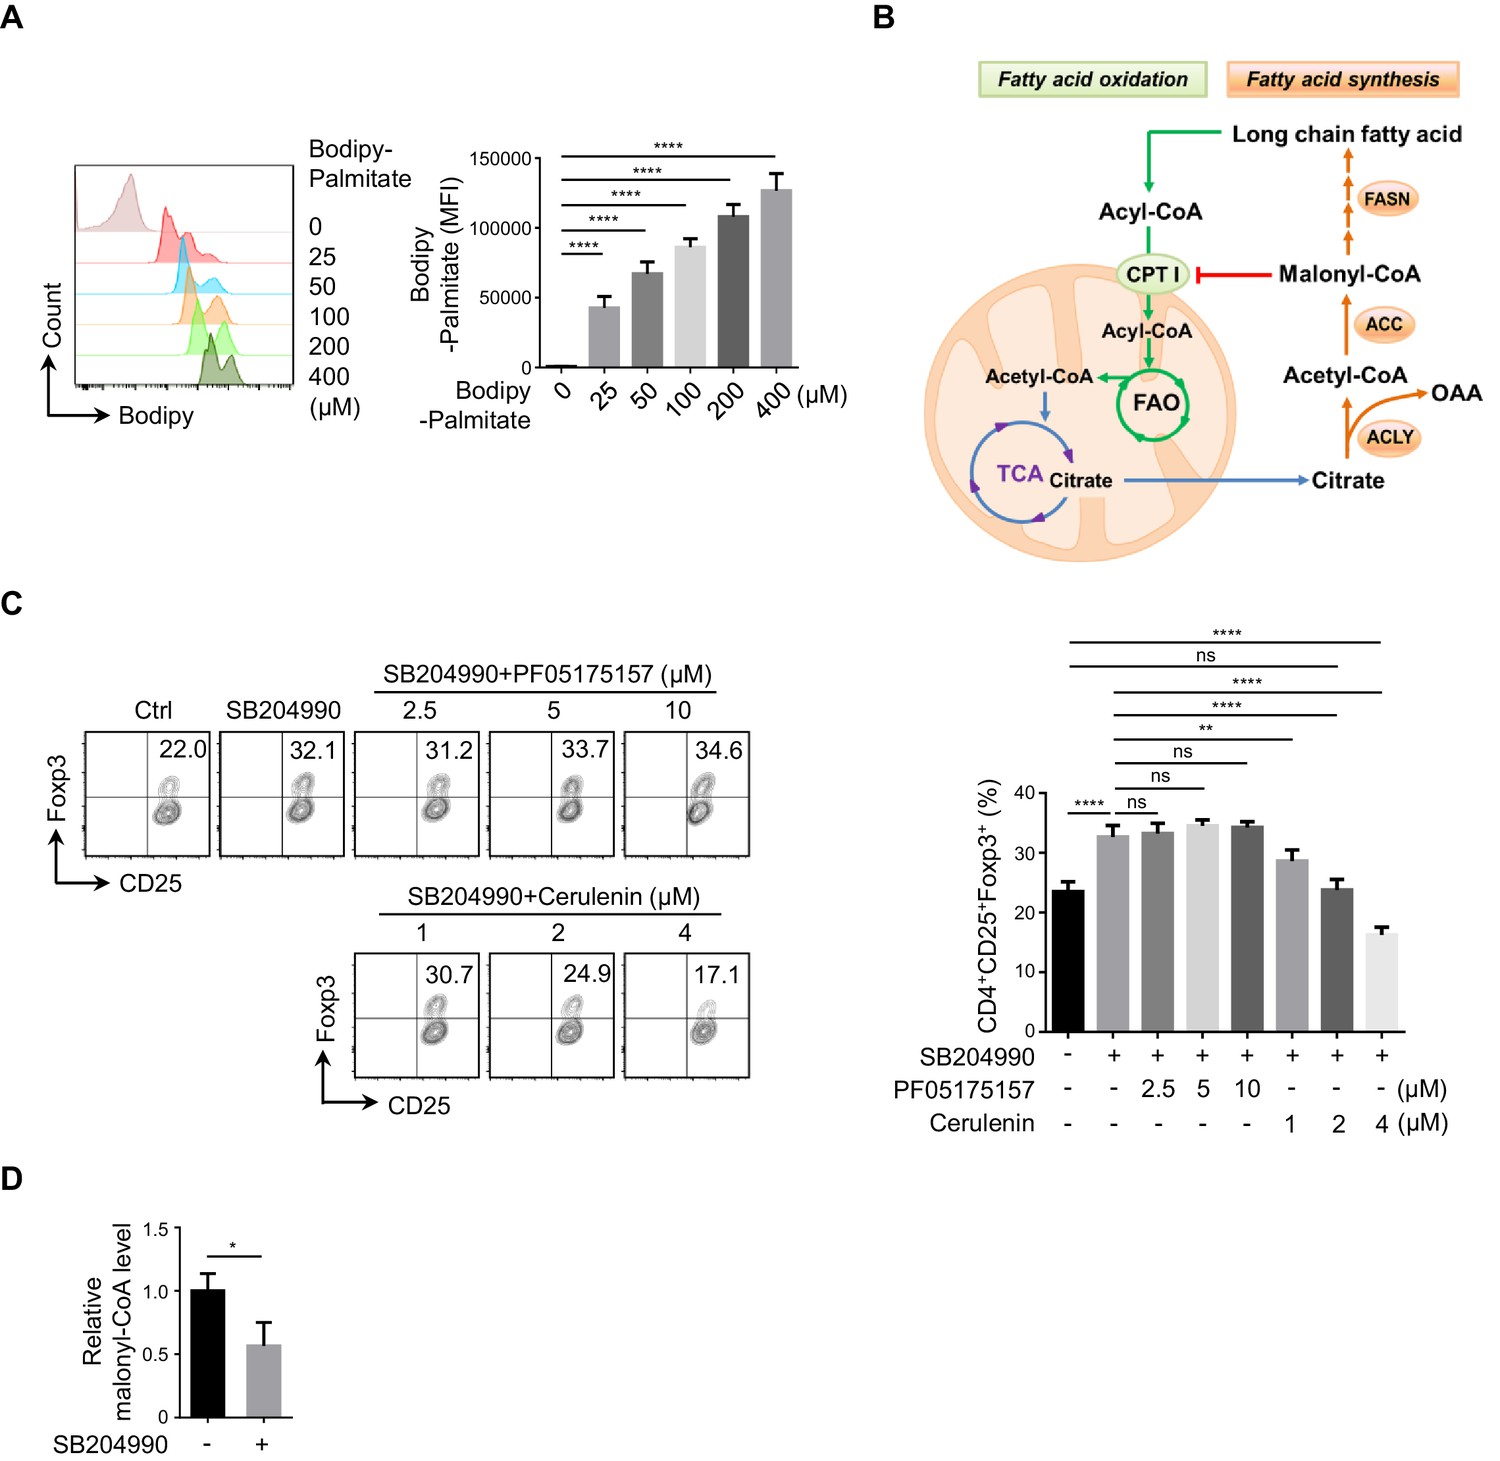
Functional comparison between ACC and FASN in ACLY-inhibition-induced iTreg differentiation.
(A) Assay for palmitate in cells. Naive CD4+ T cells were cultured under inducible regulatory T (iTreg)-polarization condition as in Figure 1—figure supplement 1A for 24 hr in the presence of variable doses of Bodipy-palmitate prior to flow cytometry (FCM) evaluation (left) and quantification (right). (B) Fatty acid synthesis (FAS) and fatty acid oxidation (FAO) pathways. (C) Assay of iTreg differentiation upon acetyl-CoA carboxylase (ACC) or fatty acid synthase (FASN) inhibition. Naive CD4+ T cells were cultured as in Figure 1E. In the presence of variable doses of ACC inhibitor (PF05175157) or FASN inhibitor (cerulenin), cells positive for CD4/CD25/Foxp3 were evaluated with FCM (left) and quantified (right). (D) Analysis of malonyl-CoA level upon ATP-citrate lyase (ACLY) inhibition. Naive CD4+ T cells cultured as in Figure 1E for 24 hr were analyzed for malonyl-CoA by high-performance liquid chromatography (HPLC). (A, C, D) Data represent mean ± SD of three independent experiments, with significance determined by one-way analysis of variance (ANOVA) test (A, C) or Student's t-test (D). *p<0.05, **p<0.01, and ****p<0.0001; ns, nonsignificant.
Figure 2—figure supplement 5

Functional evaluation of CPT1 in ACLY-inhibition-induced iTreg differentiation.
(A) Assay of malonyl-CoA level. Naive CD4+ T cells were cultured as in Figure 1E for 24 hr in the presence of malonyl-CoA (50 μM) or cerulenin (4 μM), and malonyl-CoA level was analyzed by high-performance liquid chromatography (HPLC). (B) Impact of carnitine palmitoyltransferase 1 (CPT1) inhibition on inducible regulatory T (iTreg) differentiation. Naive CD4+ T cells were cultured as in Figure 1E in the presence of etomoxir (5 μM). CD4+CD25+Foxp3+ iTreg cells were analyzed by flow cytometry (FCM) (left) and quantified (right). Data represent mean ± SD of three independent experiments, with significance determined by one-way analysis of variance (ANOVA) test. **p<0.01, ***p<0.001; ns, nonsignificant.
Figure 3 with 2 supplements
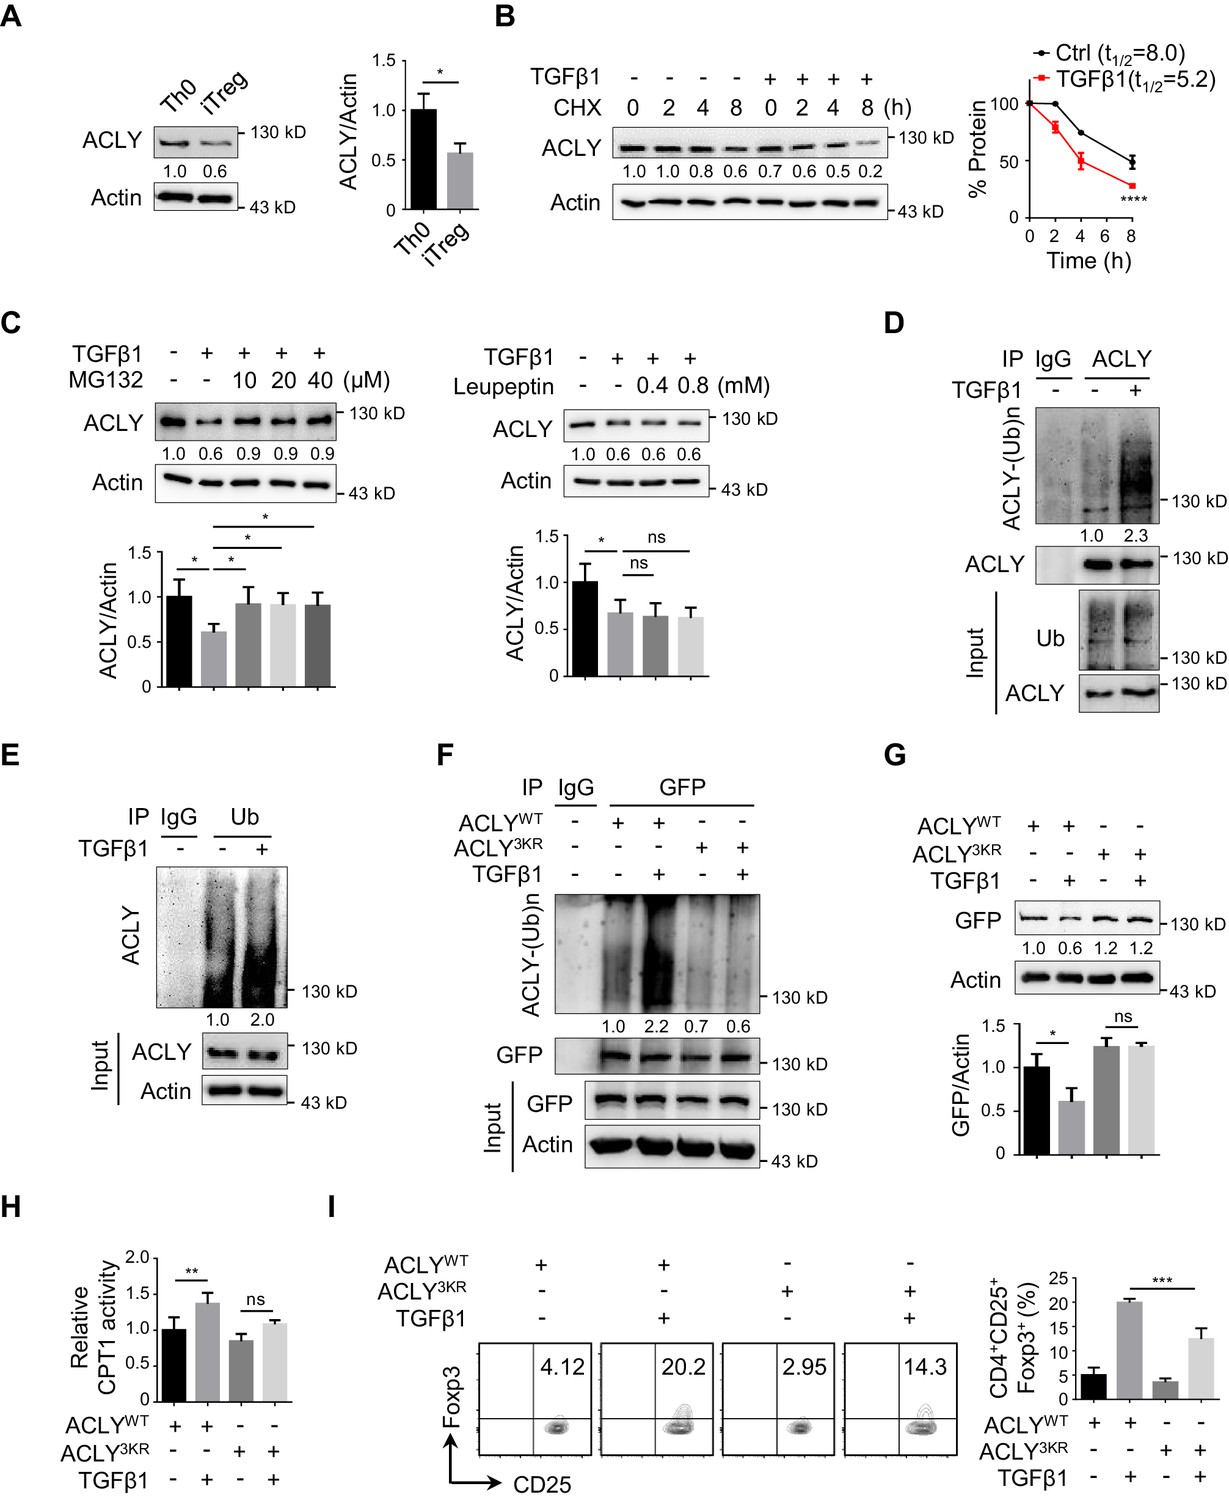
TGFβ1 induces ACLY ubiquitination and degradation during iTreg differentiation.
(A) Assay of ATP-citrate lyase (ACLY) protein level. Activated T (Th0) and inducible regulatory T (iTreg) cells prepared as in Figure 1A were subjected to western blot (WB) with antibodies against ACLY (left). Quantification of ACLY levels (right). (B) Impact of transforming growth factor β1 (TGFβ1) on ACLY degradation. Naive CD4+ T cells were cultured as in Figure 1A for 24 hr and treated with cycloheximide (CHX) (10 μg/ml) as indicated prior to WB analysis (left). Quantification of ACLY levels (right). (C) Pathway analysis for ACLY degradation. Th0 and iTreg cells polarized as in Figure 1A for 24 hr were treated with MG132 (left) or leupeptin (right) and analyzed with WB for ACLY protein. (D, E) Impact of TGFβ1 on ACLY ubiquitination. Cells polarized as in Figure 1A for 24 hr were treated with MG132 (10 μM) and cell extracts were immunoprecipitated with antibodies against ACLY (D) or ubiquitin (Ub) (E). IgG serves as a negative control. (F–H) Functional comparison between ACLYWT and ACLY3KR. Naive CD4+ T cells transfected with GFP-ACLYWT or -ACLY3KR were polarized as in Figure 1A for 24 hr. (F) Extracts from cells pre-treated with MG132 were assayed with immunoprecipitation (IP) for ACLY ubiquitination. IgG serves as a negative control. (G) WB analysis for ACLY protein. (H) Cell lysates were prepared for the analysis of carnitine palmitoyltransferase 1 (CPT1) activity. (I) ACLY ubiquitination impacts on iTreg differentiation. Cells transfected with GFP-ACLYWT or -ACLY3KR were polarized as in Figure 1A and assessed with flow cytometry (FCM) (left). Quantification of GFP+CD25+Foxp3+ iTreg cells (right). (A–C, G–I) Quantification shows mean ± SD based on three independent experiments. Student's t-test (A), two-way analysis of variance (ANOVA) test (B), or one-way ANOVA test (C, G–I) was used. *p<0.05, **p<0.01, ***p<0.001, and ****p<0.0001; ns, nonsignificant. For WB in (A–G), one representative experiment out of three is represented. Associated scores indicate mean intensities based on three biological replicas.
Figure 3—figure supplement 1
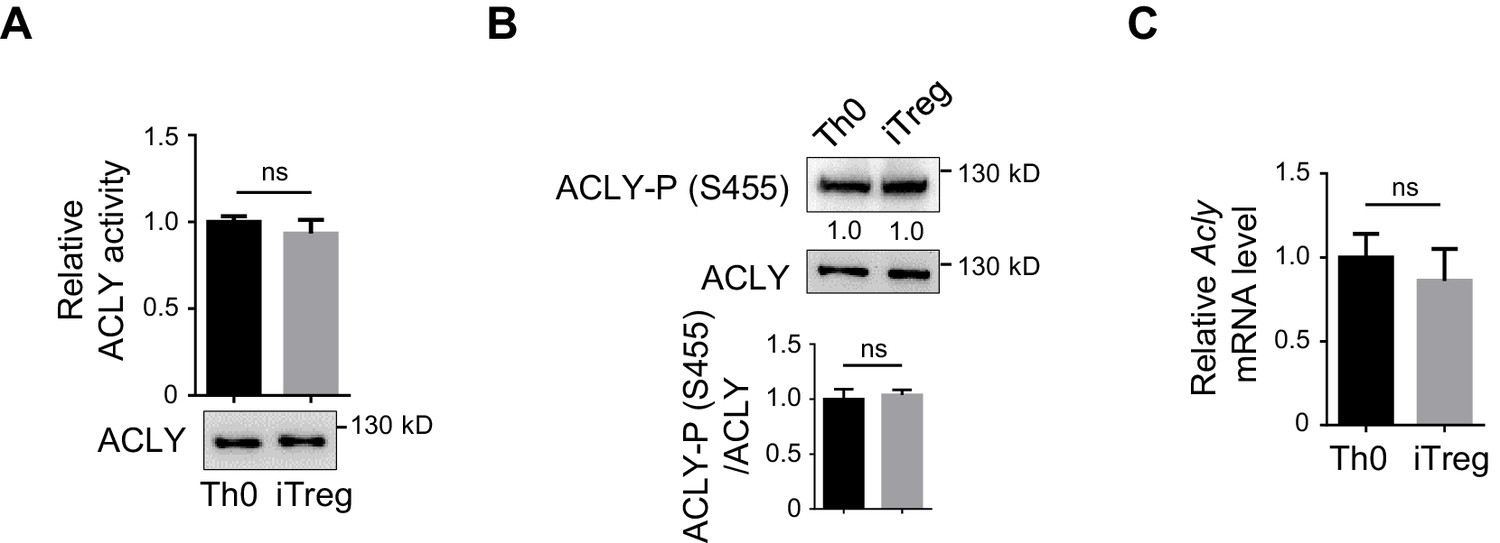
Assessment of ACLY activity and mRNA in Th0 and iTreg cells.
(A, B) Analysis of ATP-citrate lyase (ACLY) enzymatic activity. Same amount of ACLY from activated T (Th0) or inducible regulatory T (iTreg) cells that were prepared as in Figure 1—figure supplement 1A was used in assays for detecting enzymatic activity (A) and ACLY phosphorylation at S455 (B). (C) Analysis of Acly mRNA. Cells prepared as in Figure 1—figure supplement 1A were examined for ACLY transcription by reverse transcription polymerase chain reaction (RT-PCR). (A–C) Quantification shows mean ± SD based on three independent experiments, with significance determined by Student's t-test. ns, nonsignificant. For western blot (WB) in (A) and (B), one representative experiment out of three is represented. Associated scores indicate mean intensities based on three biological replicas.
Figure 3—figure supplement 2

K530/536/544 are important for ACLY degradation.
(A) Conservative analysis of ATP-citrate lyase (ACLY) amino acid sequence. (B) Time-course analysis for ACLYWT and ACLY3KR degradation. Cells transfected with GFP-ACLYWT or -ACLY3KR were induced under inducible regulatory T (iTreg)-polarization condition as in Figure 1—figure supplement 1A for 24 hr and treated with cycloheximide (CHX) (10 μg/ml) prior to the analysis of exogenous ACLY by western blotting (WB). Quantification shows mean ± SD based on three independent experiments, with significance determined by one-way analysis of variance (ANOVA) test. *p<0.05, ***p<0.001; ns, nonsignificant. For WB, one representative experiment out of three is represented. Associated scores indicate mean intensities based on three biological replicas.
Figure 4 with 4 supplements
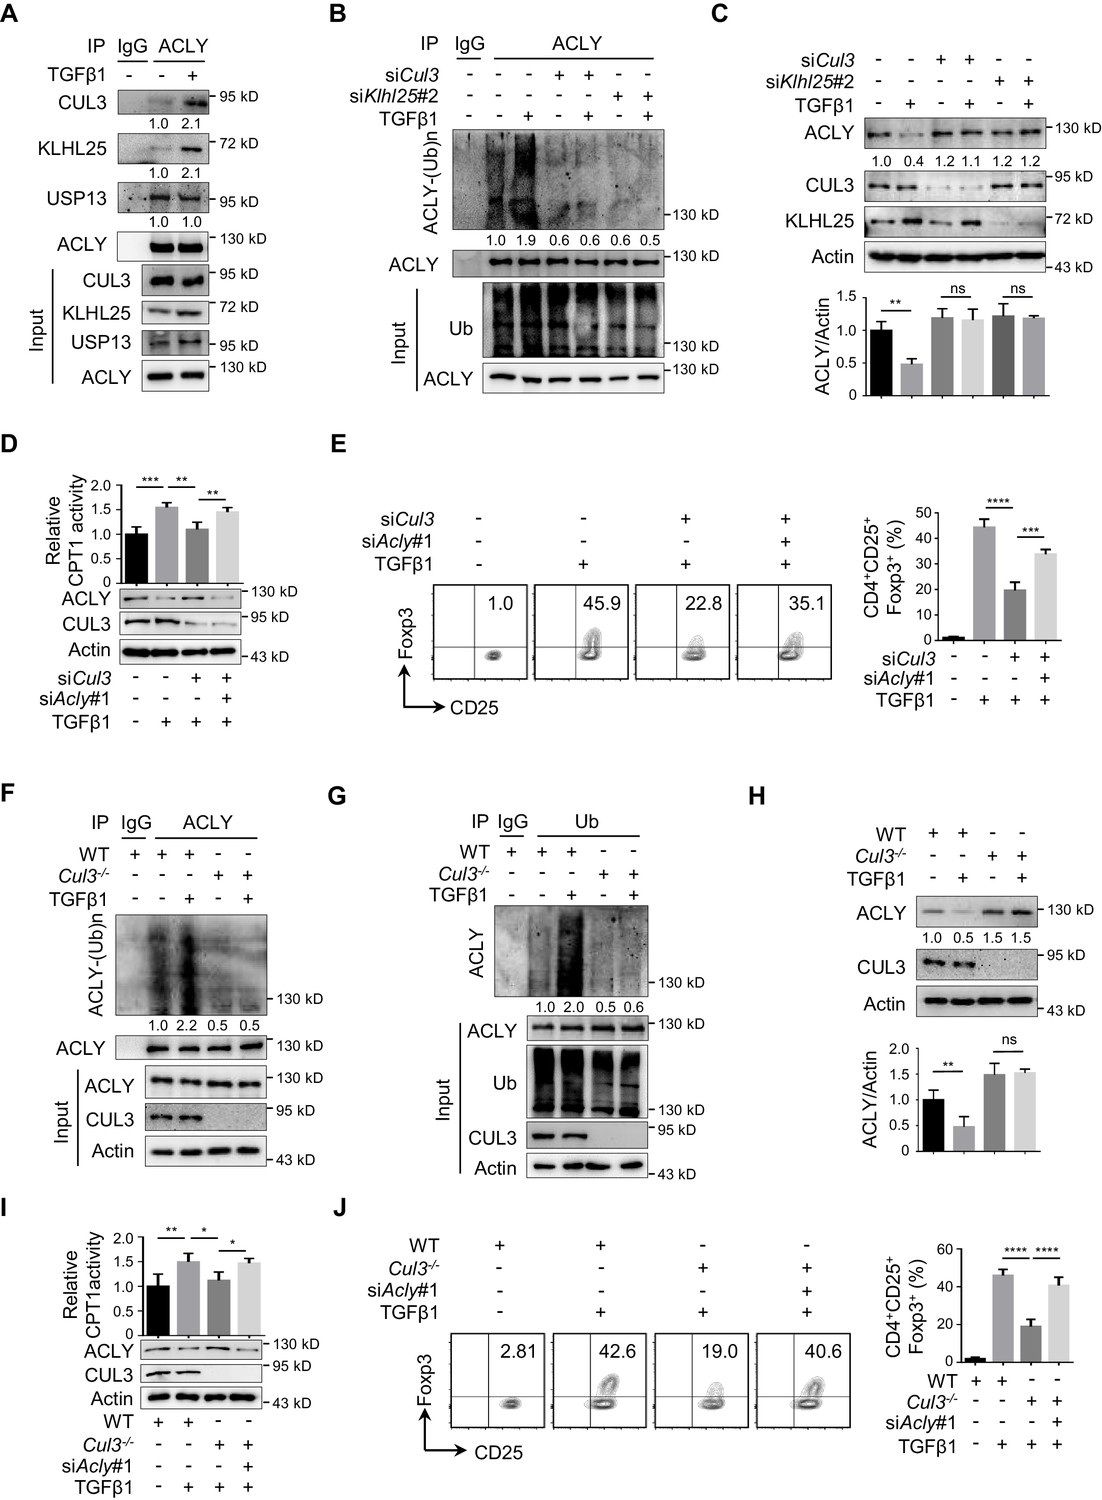
CUL3-KLHL25 is responsible for TGFβ1-mediated ACLY ubiquitination.
(A) Assay of ATP-citrate lyase (ACLY) interaction with CUL3-KLHL25. Cells polarized as in Figure 1A for 24 hr were treated with MG132 and assayed by immunoprecipitation (IP) with ACLY antibody. IgG serves as a negative control. (B–E) Functional assessment of CUL3-KLHL25 depletion in inducible regulatory T (iTreg) differentiation. Naive CD4+ T cells transfected with desired small interfering RNAs (siRNAs) were polarized as in Figure 1A for 24 hr (B–D) or 72 hr (E). They were pre-treated with MG132 before IP for the detection of ACLY ubiquitination (B), analyzed by western blotting (WB) with indicated antibodies (C), evaluated for carnitine palmitoyltransferase 1 (CPT1) activity (D), and stained for CD4/CD25/Foxp3 to identify iTreg cells prior to flow cytometry (FCM) analysis (E). (F–H) Functional assays for ACLY ubiquitination in cells derived from Cul3 knockout mice. Naive CD4+ T cells isolated from wild-type (WT) or Cd4CreCul3fl/fl mice were polarized as in Figure 1A for 24 hr. Cells were pre-treated with MG132 before IP with antibodies against ACLY (F) or ubiquitin (Ub) (G), or analyzed for ACLY expression with WB (H). (I, J) Impact of CUL3 deficiency on fatty acid oxidation (FAO) and iTreg differentiation. Naive CD4+ T cells transfected with siRNAs were induced as in Figure 1A for 24 hr (I) or 72 hr (J). Cells were lysed for CPT1 activity detection (I) or stained for CD4/CD25/Foxp3 to identify iTreg cells prior to FCM analysis (J). (C–E, H–J) Quantification shows mean ± SD based on three independent experiments, with significance determined by one-way analysis of variance (ANOVA) test. *p<0.05, **p<0.01, ***p<0.001, and ****p<0.0001; ns, nonsignificant. For WB in (A–D, F–I), one representative experiment out of three is represented. Associated scores indicate mean intensities based on three biological replicas.
Figure 4—figure supplement 1
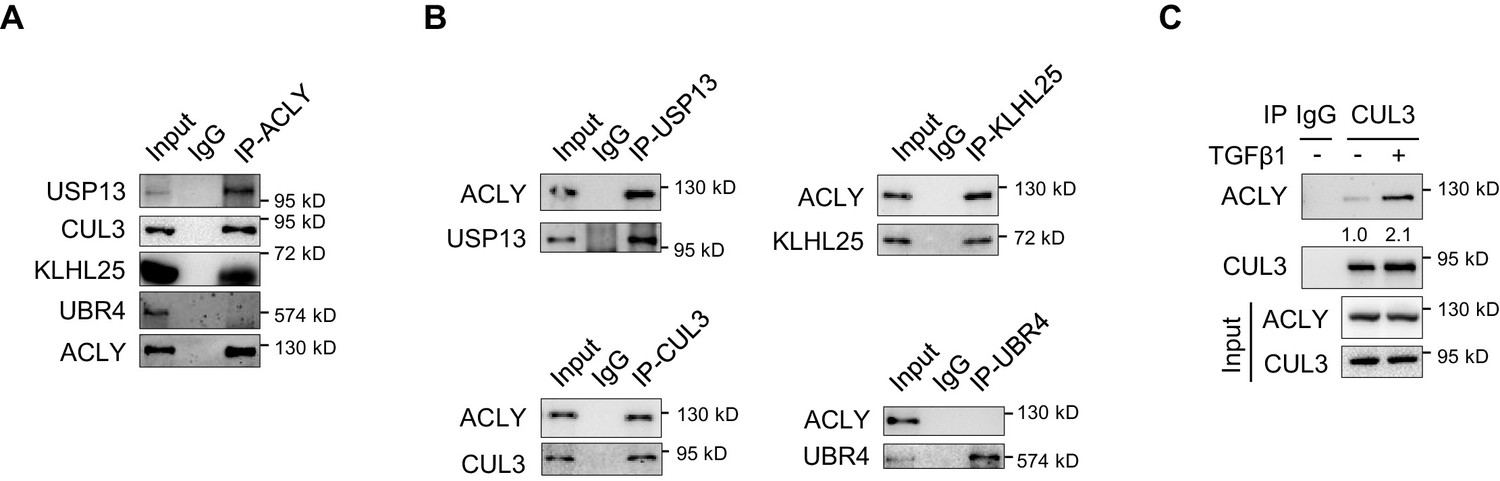
Examination of ACLY association with ubiquitin ligases and deubiquitinase.
(A, B) Co-immunoprecipitation (co-IP) for ATP-citrate lyase (ACLY) association with USP13, CUL3, KLHL25, and UBR4. Naive CD4+ T cells were polarized under inducible regulatory T (iTreg)-polarization condition as in Figure 1—figure supplement 1A for 24 hr and pre-treated with MG132 (10 μM) before co-IP with antibodies against ACLY (A), USP13, CUL3, or UBR4 (B). IgG serves as a negative control. (C) Impact of transforming growth factor β1 (TGFβ1) on CUL3 binding to ACLY. Cells polarized as in Figure 1—figure supplement 1A for 24 hr were pre-treated with MG132 before CUL3 IP and western blotting (WB). IgG serves as a negative control. (A–C) One representative experiment out of three is represented. Associated scores indicate mean intensities based on three biological replicas.
Figure 4—figure supplement 2
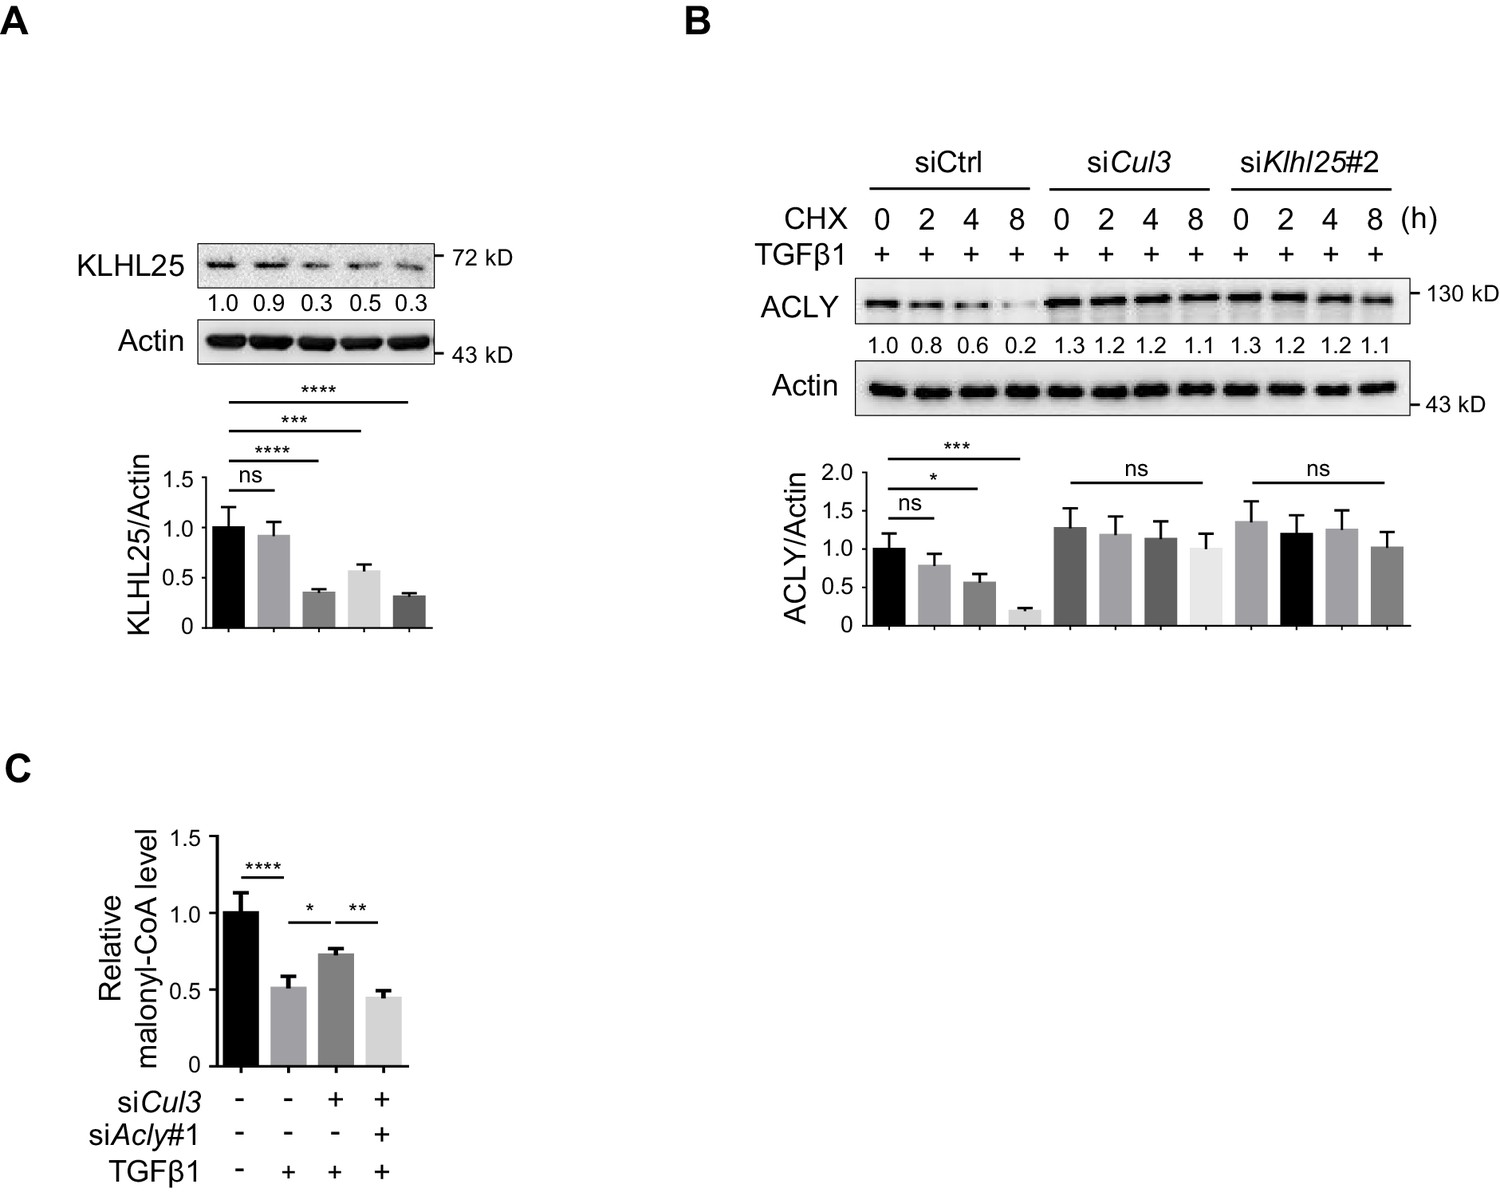
Knockdown of CUL3-KLHL25 blocks TGFβ1-induced ACLY degradation.
(A) Analysis of siKlhl25 knockdown efficiency. Cells transfected with indicated small interfering RNAs (siRNAs) (#1, #2, #3, or Mix) were polarized under inducible regulatory T (iTreg)-polarization condition as in Figure 1—figure supplement 1A for 24 hr prior to western blot (WB) analysis and quantification. (B) Time-course analysis for ATP-citrate lyase (ACLY) degradation upon knocking down Cul3 or Klhl25. Cells transfected with indicated siRNAs were induced as in Figure 1—figure supplement 1A for 24 hr and were treated with cycloheximide (CHX) (10 μg/ml) prior to WB analysis with antibody against ACLY. (C) Analysis of malonyl-CoA level. Cells transfected with siRNAs were polarized as in Figure 1—figure supplement 1A for 24 hr and analyzed for malonyl-CoA by high-performance liquid chromatography (HPLC). (A–C) Quantification shows mean ± SD based on three independent experiments, with significance determined by one-way analysis of variance (ANOVA) test. *p<0.05, **p<0.01, ***p<0.001, ****p<0.0001; ns, nonsignificant. For WB in (A, B), one representative experiment out of three is represented. Associated scores indicate mean intensities based on three biological replicas.
Figure 4—figure supplement 3
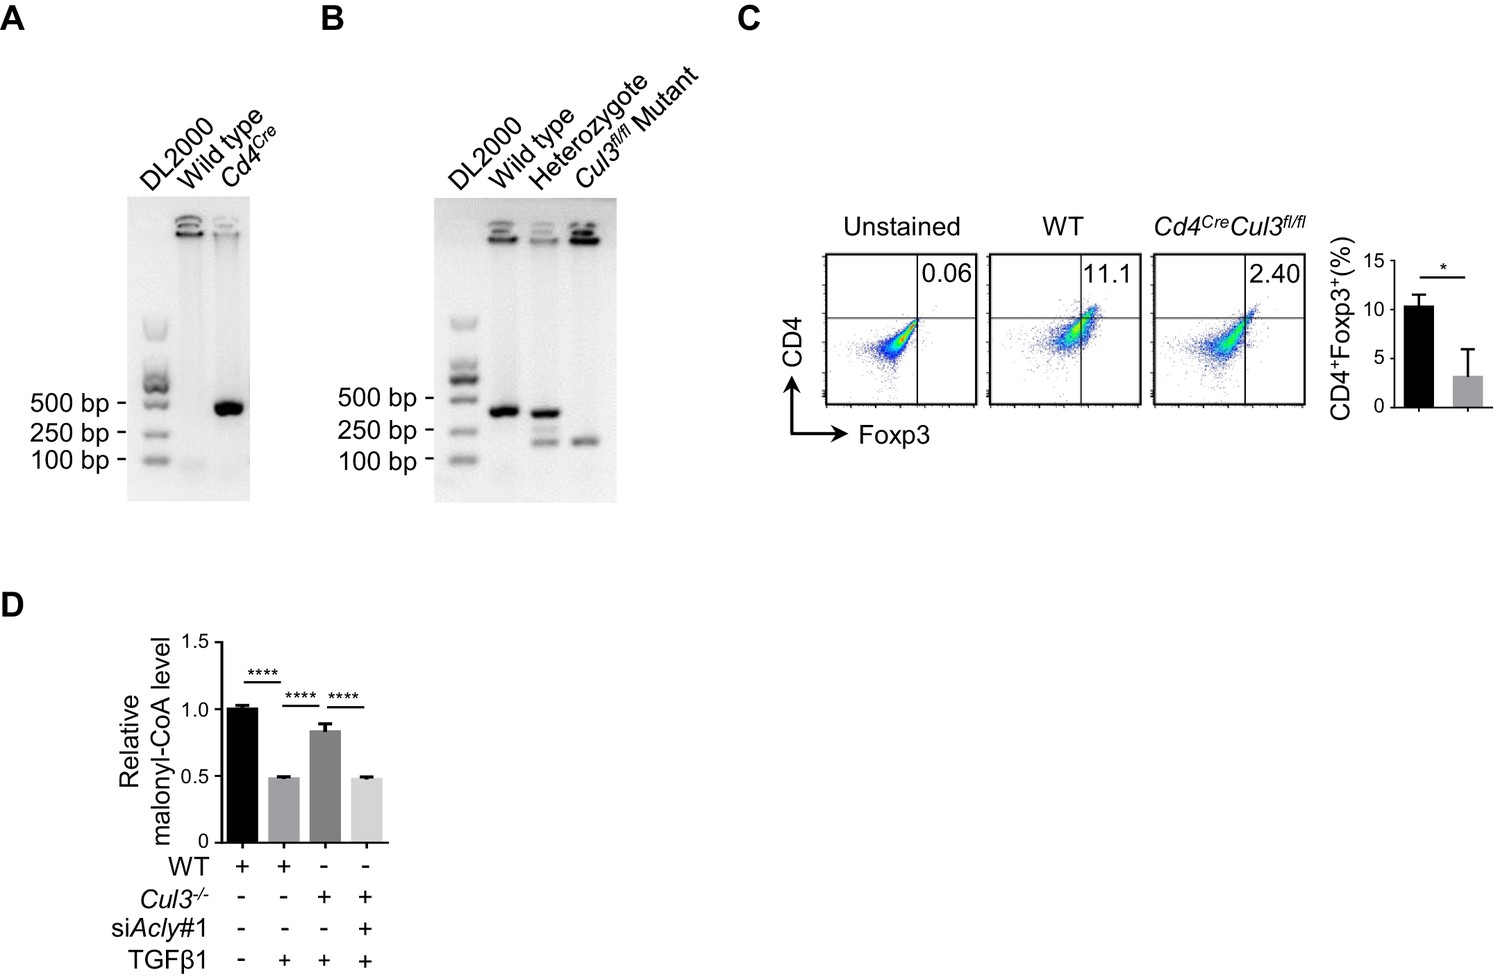
Analysis of Treg number in the intestines of Cd4CreCul3fl/fl mice.
(A, B) Genotype identification of Cd4CreCul3fl/fl mice. Genotype analyses for (A) Cd4Cre and (B) Cul3fl/fl mutant genes. Mouse tail DNA was extracted for genotype analysis (Cd4Cre and Cul3fl/fl) with polymerase chain reaction (PCR) and agarose gel electrophoresis. (C) Analysis of regulatory T (Treg) cell number in the intestines of Cd4CreCul3fl/fl mice. Colon lamina propria cells from wild-type (WT) and Cd4CreCul3fl/fl mice were isolated and frequency of CD4+Foxp3+ Treg was analyzed by flow cytometry (FCM). (D) Assay for malonyl-CoA. Naive CD4+ T cells isolated from WT and Cd4CreCul3fl/fl mice were transfected with small interfering RNA (siRNA) against Acly and induced as described in Figure 1—figure supplement 1A for 24 hr prior to detection of malonyl-CoA by high-performance liquid chromatography (HPLC). (A, B) One representative experiment out of three independent experiments is represented. (C, D) Quantification shows mean ± SD based on three independent experiments, with significance determined by Student's t-test (C) and one-way analysis of variance (ANOVA) test (D). *p<0.05, ****p<0.0001.
Figure 4—figure supplement 4

Functional analysis of ACLY ubiquitination for iTreg cells.
(A) Assay for the expression of surrogate molecules associated with regulatory T (Treg) suppressive activity. Naive CD4+ T cells isolated from wild-type (WT) and Cd4CreCul3fl/fl mice were transfected with small interfering RNAs (siRNAs) and cultured under inducible regulatory T (iTreg)-polarization condition as in Figure 1—figure supplement 1A prior to staining with antibodies against CD4, CD25, Foxp3, CTLA4, ICOS, IL-10, and TIGIT. By flow cytometry (FCM), CD4+CD25+Foxp3+ iTreg cells were analyzed for CTLA4, ICOS, IL-10, or TIGIT expression (left). Quantification based on mean fluorescence intensity (MFI) is shown (right). (B) Analysis of the suppressive activity of Foxp3-YFP iTreg cells under various conditions. Naive CD4+ T cells separated from Foxp3YFP-Cre mice were transfected with siRNAs against Acly and (or) Cul3 and cultured under iTreg-polarization condition as in Figure 1—figure supplement 1A. Interference efficiency was evaluated by western blotting (WB). Foxp3-YFP-positive cells sorted by FCM were cocultured with naive CD4+ T cells pre-staining with CellTrace Violet (CTV, 1 μM) in the presence of anti-CD3/CD28 for 3 days. T-cell proliferation was evaluated using FCM. (A, B) Quantification shows mean ± SD based on three independent experiments, with significance determined by one-way analysis of variance (ANOVA) test. ****p<0.0001; ns, nonsignificant. For WB in (B) and FCM analysis for iTreg in (A, B), one representative experiment out of three is represented.
Figure 5

CUL3-KLHL25-ACLY ubiquitination axis regulates human iTreg differentiation.
(A) Assay of ATP-citrate lyase (ACLY) expression in human inducible regulatory T (iTreg) cells. Naive CD4+ T cells isolated from human peripheral blood were cultured with Dynabeads Human T-Activator CD3/CD28 and rhIL-2 to induce activated T (Th0) cells or simultaneously supplemented with rhTGFβ1 (2 ng/ml) to induce iTreg cells for 24 hr. Cell extracts were subsequently analyzed for ACLY expression by western blotting (WB). (B) ACLY overexpression affects iTreg cell differentiation. Human naive CD4+ T cells transfected with GFP-ACLYWT were polarized as in (A) for 72 hr prior to the assessment of iTreg cells by flow cytometry (FCM) (left). Quantification of iTreg populations (right). (C) ACLY inhibition affects iTreg differentiation. Cells treated with SB204990 were cultured under Th0- or iTreg (with 0.5 ng/ml rhTGFβ1)-polarization condition for 72 hr and subjected to the analysis (left) and quantification (right) of iTreg cells. (D) ACLY interaction with CUL3-KLHL25. Cells prepared as in (A) were pre-treated with MG132 before immunoprecipitation (IP) with ACLY antibody. IgG serves as a negative control. (E–G) ACLY ubiquitination regulates human iTreg differentiation. Cells transfected with GFP-ACLYWT or -ACLY3KR were induced under Th0- or iTreg-polarization condition as described in (A) for 24 hr (E, F) or 72 hr (G). Cells were pre-treated with MG132 before IP for the assessment of protein ubiquitination (E), examined by WB (F), or evaluated for GFP/CD25/Foxp3 expression with FCM (left), and quantified (right) (G). (A–C, F, G) Quantification shows mean ± SD based on three independent experiments, with significance determined by Student's t-test (A, C) or one-way analysis of variance (ANOVA) test (B, F, G). *p<0.05, **p<0.01, ***p<0.001; ns, nonsignificant. For WB in (A) and (D–F), one representative experiment out of three is represented. Associated scores indicate mean intensities based on three biological replicas.
Figure 6 with 4 supplements
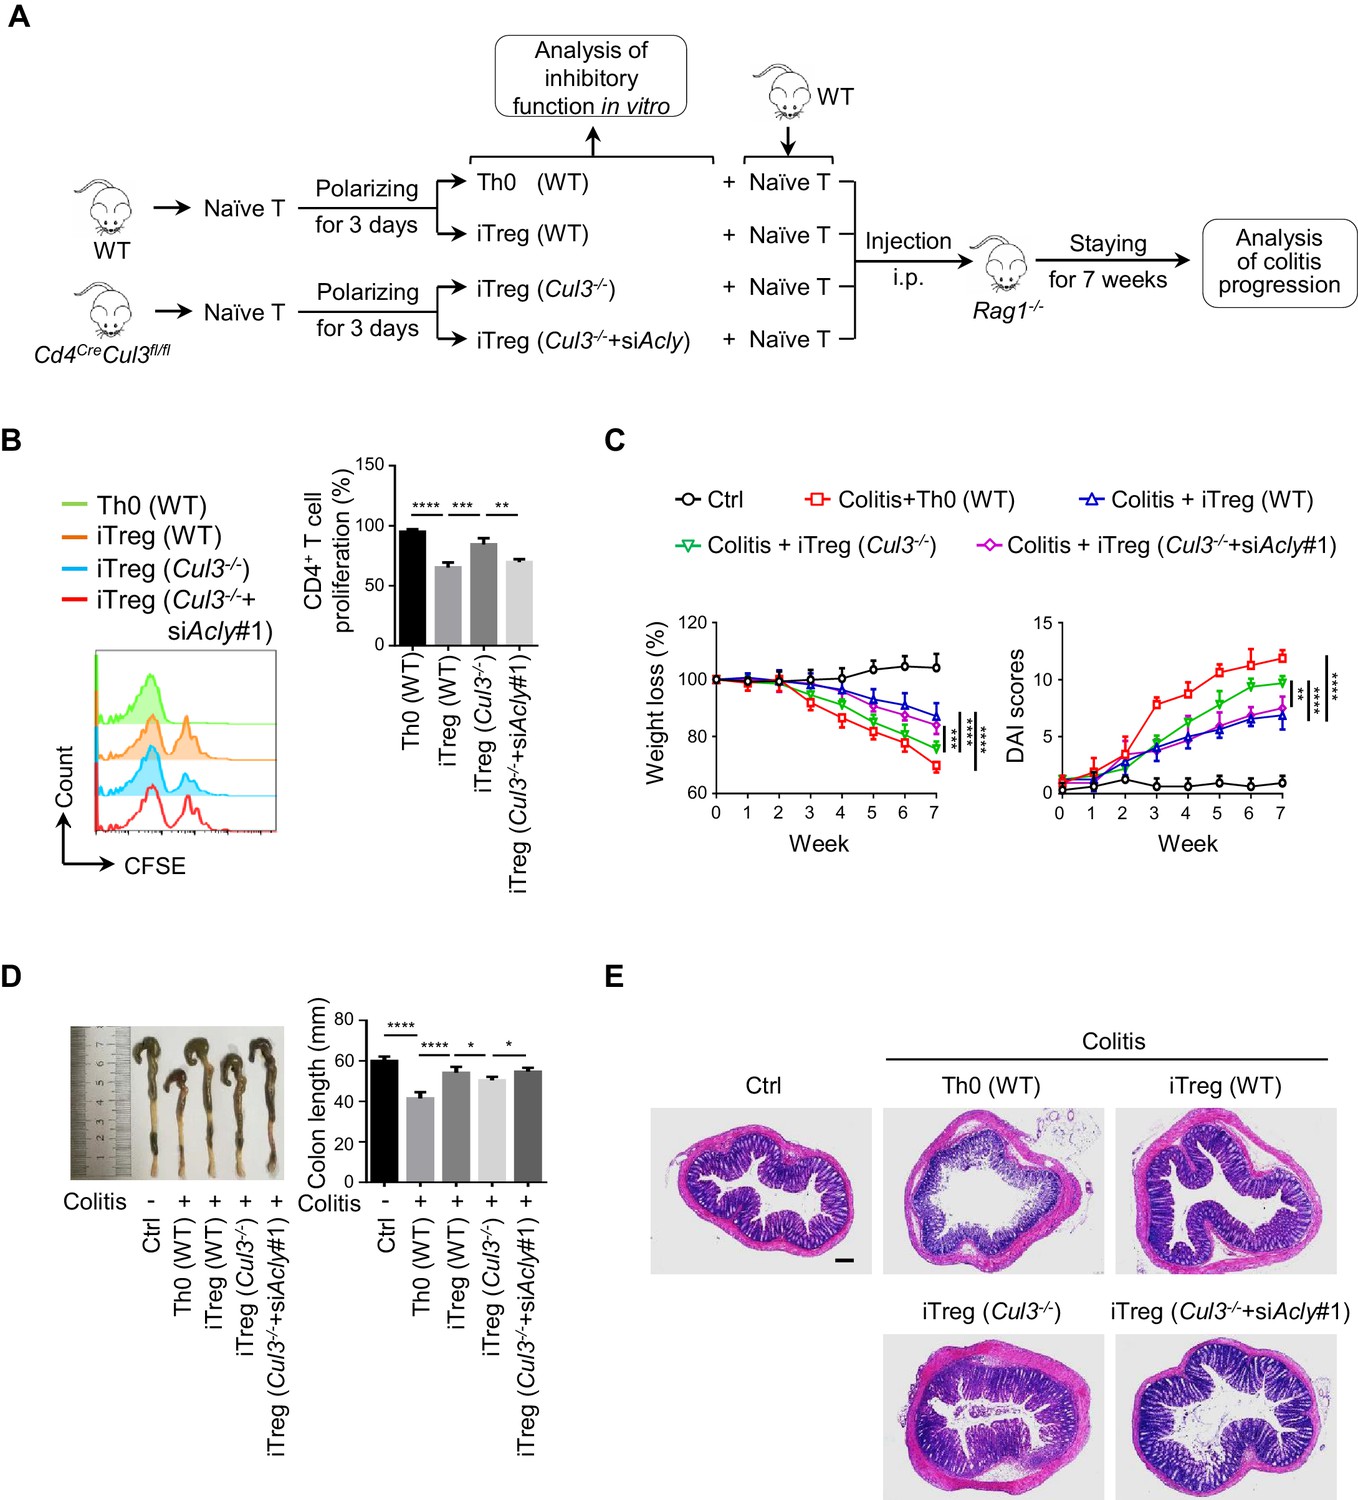
ACLY ubiquitination promotes iTreg cell generation and alleviates mouse colitis.
(A) Experimental design. (B) Impact of inducible regulatory T (iTreg) cells on T-cell proliferation. Activated T (Th0) (wild-type, WT), iTreg (WT), iTreg (Cul3-/-), and iTreg (Cul3-/-+siAcly#1) cells were cocultured with carboxyfluorescein diacetate succinimidyl ester (CFSE)-stained naive CD4+ T cells and treated with Dynabeads Mouse T-Activator CD3/CD28 for 72 hr. T-cell proliferation was evaluated using flow cytometry (FCM) (left). Quantification analysis for CD4+ T-cell proliferation (right) based on three independent experiments. One-way analysis of variance (ANOVA) test, mean ± SD. **p<0.01, ***p<0.001, ****p<0.0001. (C–E) Systematic evaluation of colitis in mice adoptively transferred with different cells. (C) Body weight (left) and disease activity index (DAI) score (right) based on body weight loss, stool consistency, and blood in the stool were recorded weekly. 7 weeks later, entire colons from mice treated in different ways were removed for length assessment (D) and hematoxylin and eosin (H and E) staining, which is used for revealing histopathological changes (E). Scale bar, 200 μm. One representative experiment out of four biological replicas is represented. (C, D) Data represent mean ± SD (n = 4), with significance determined by two-way ANOVA test (C) or one-way ANOVA test (D). *p<0.05, **p<0.01, ***p<0.001, ****p<0.0001.
Figure 6—figure supplement 1
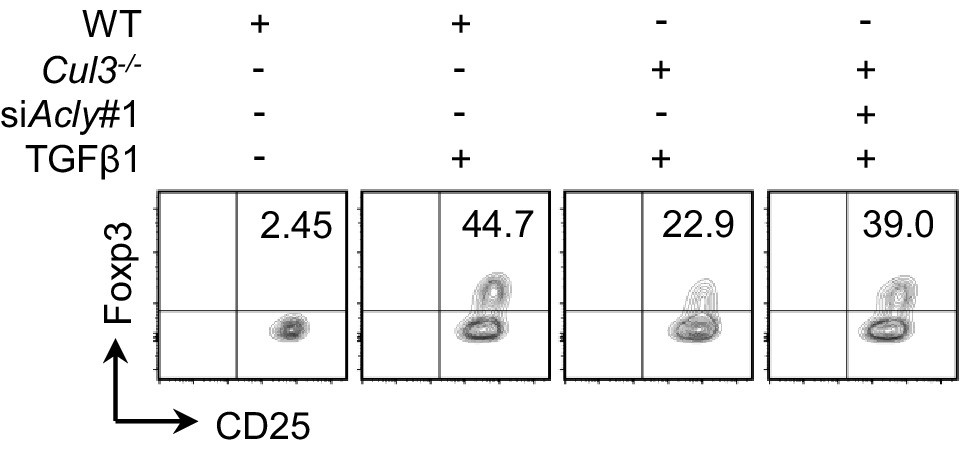
ACLY knockdown influences the differentiation of naive CD4+ T cells derived from Cul3 knockout mice.
Naive CD4+ T cells isolated from wild-type (WT) and Cd4CreCul3fl/fl mice were transfected with small interfering RNA (siRNA) against Acly and induced as described in Figure 1—figure supplement 1A prior to evaluating CD4+CD25+Foxp3+ inducible regulatory T (iTreg) cells by flow cytometry (FCM). One representative experiment out of three independent experiments is represented.
Figure 6—figure supplement 2
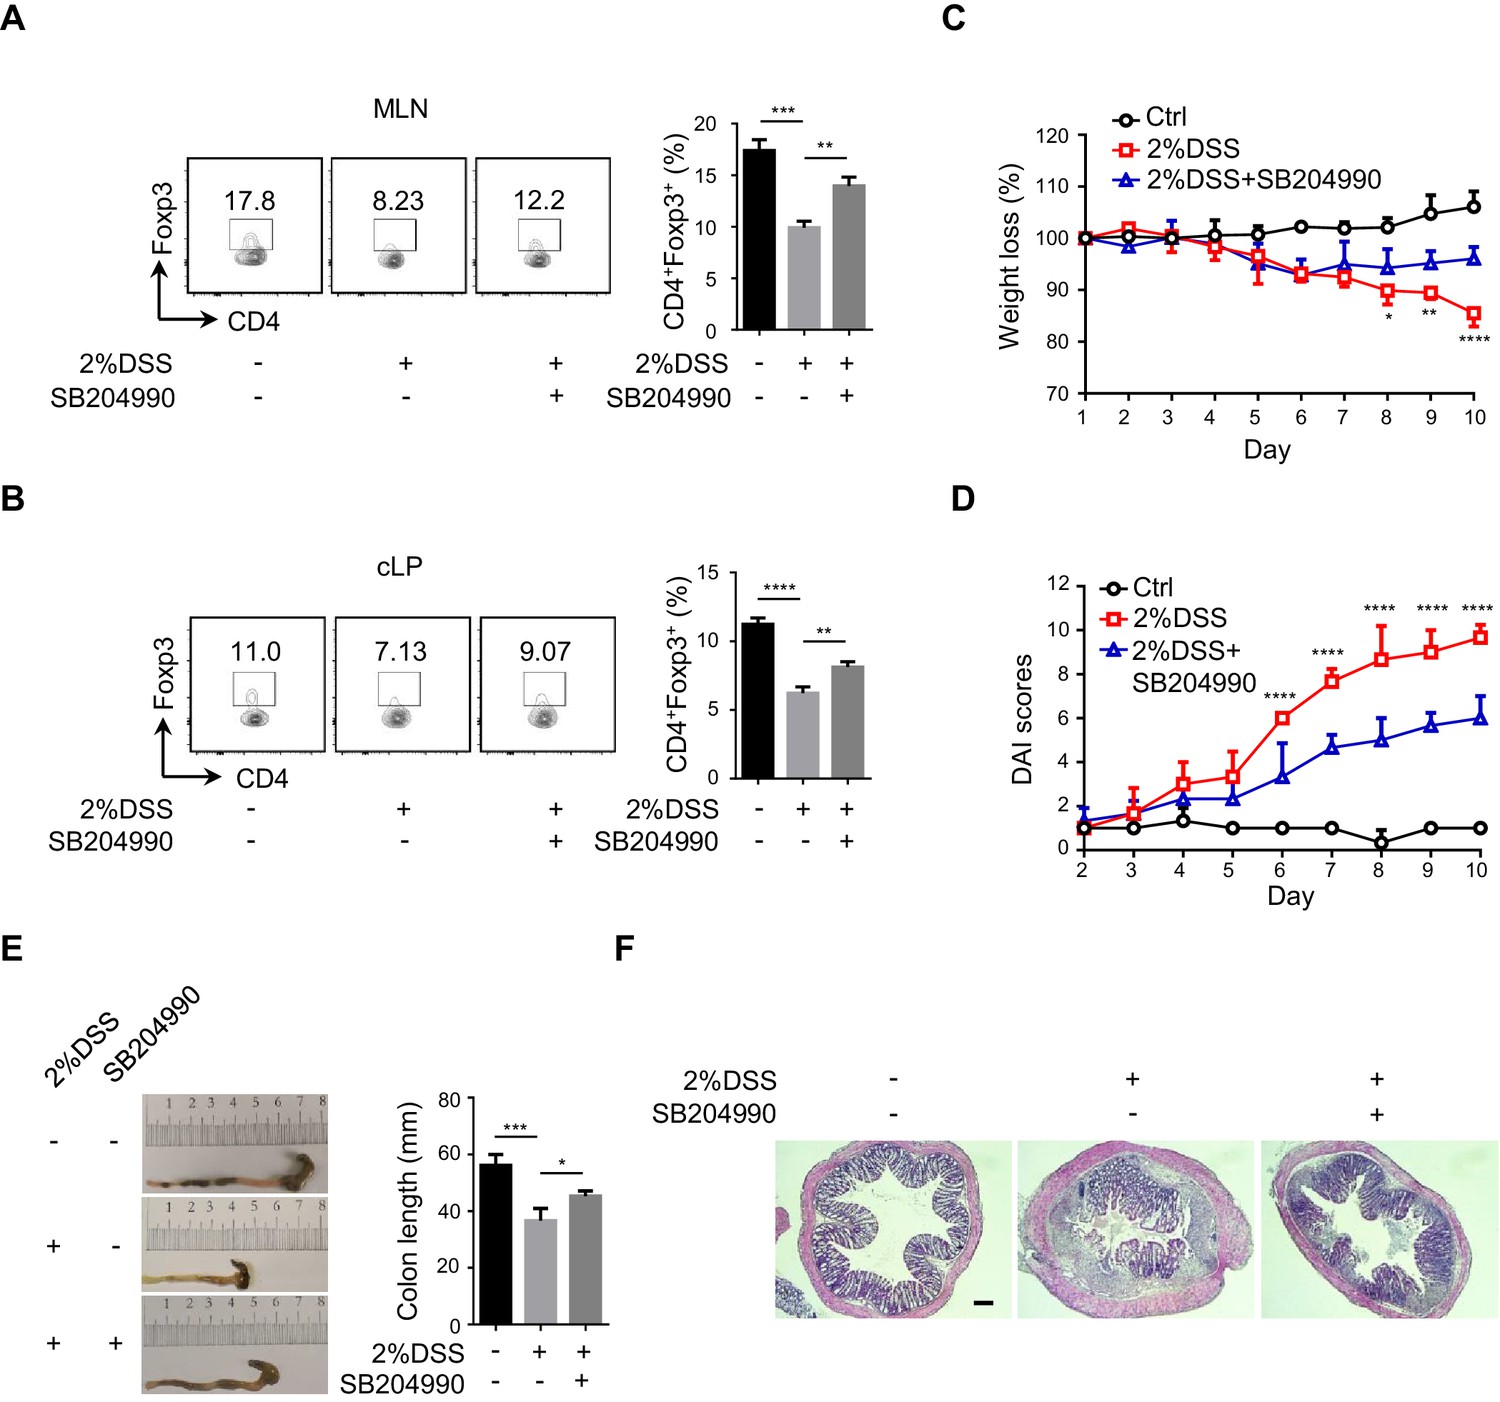
SB204990 administration elevates iTreg population in vivo and alleviates mice colitis.
(A, B) Mice were supplied with dextran sodium sulfate (DSS) (2%, w/v) in drinking water. Meanwhile, ATP-citrate lyase (ACLY) inhibitor (SB204990, 37.5 mg/kg/d) was administrated once every 2 days by oral gavage. 10 days later, regulatory T (Treg) cells in mesenteric lymph nodes (MLNs) (A) and colonic lamina propria (cLP) (B) were examined by flow cytometry (FCM). (C–F) Systematic evaluation of colitis in mice administrated with ACLY inhibitor. Body weight (C) and disease activity index (DAI) score (D), based on body weight loss, stool consistency, and blood in the stool, were recorded daily. 10 days later, entire colons from mice treated in different ways were removed for length assessment (E) and hematoxylin and eosin (H and E) staining for histopathological changes (F). Scale bar, 200 μm. In (F), one representative experiment out of three biological replicas is represented. (A–E) Data represent mean ± SD (n = 3), with significance determined by one-way analysis of variance (ANOVA) test (A, B, E) and two-way ANOVA test (C, D). *p<0.05, **p<0.01, ***p<0.001, and ****p<0.0001.
Figure 6—figure supplement 3
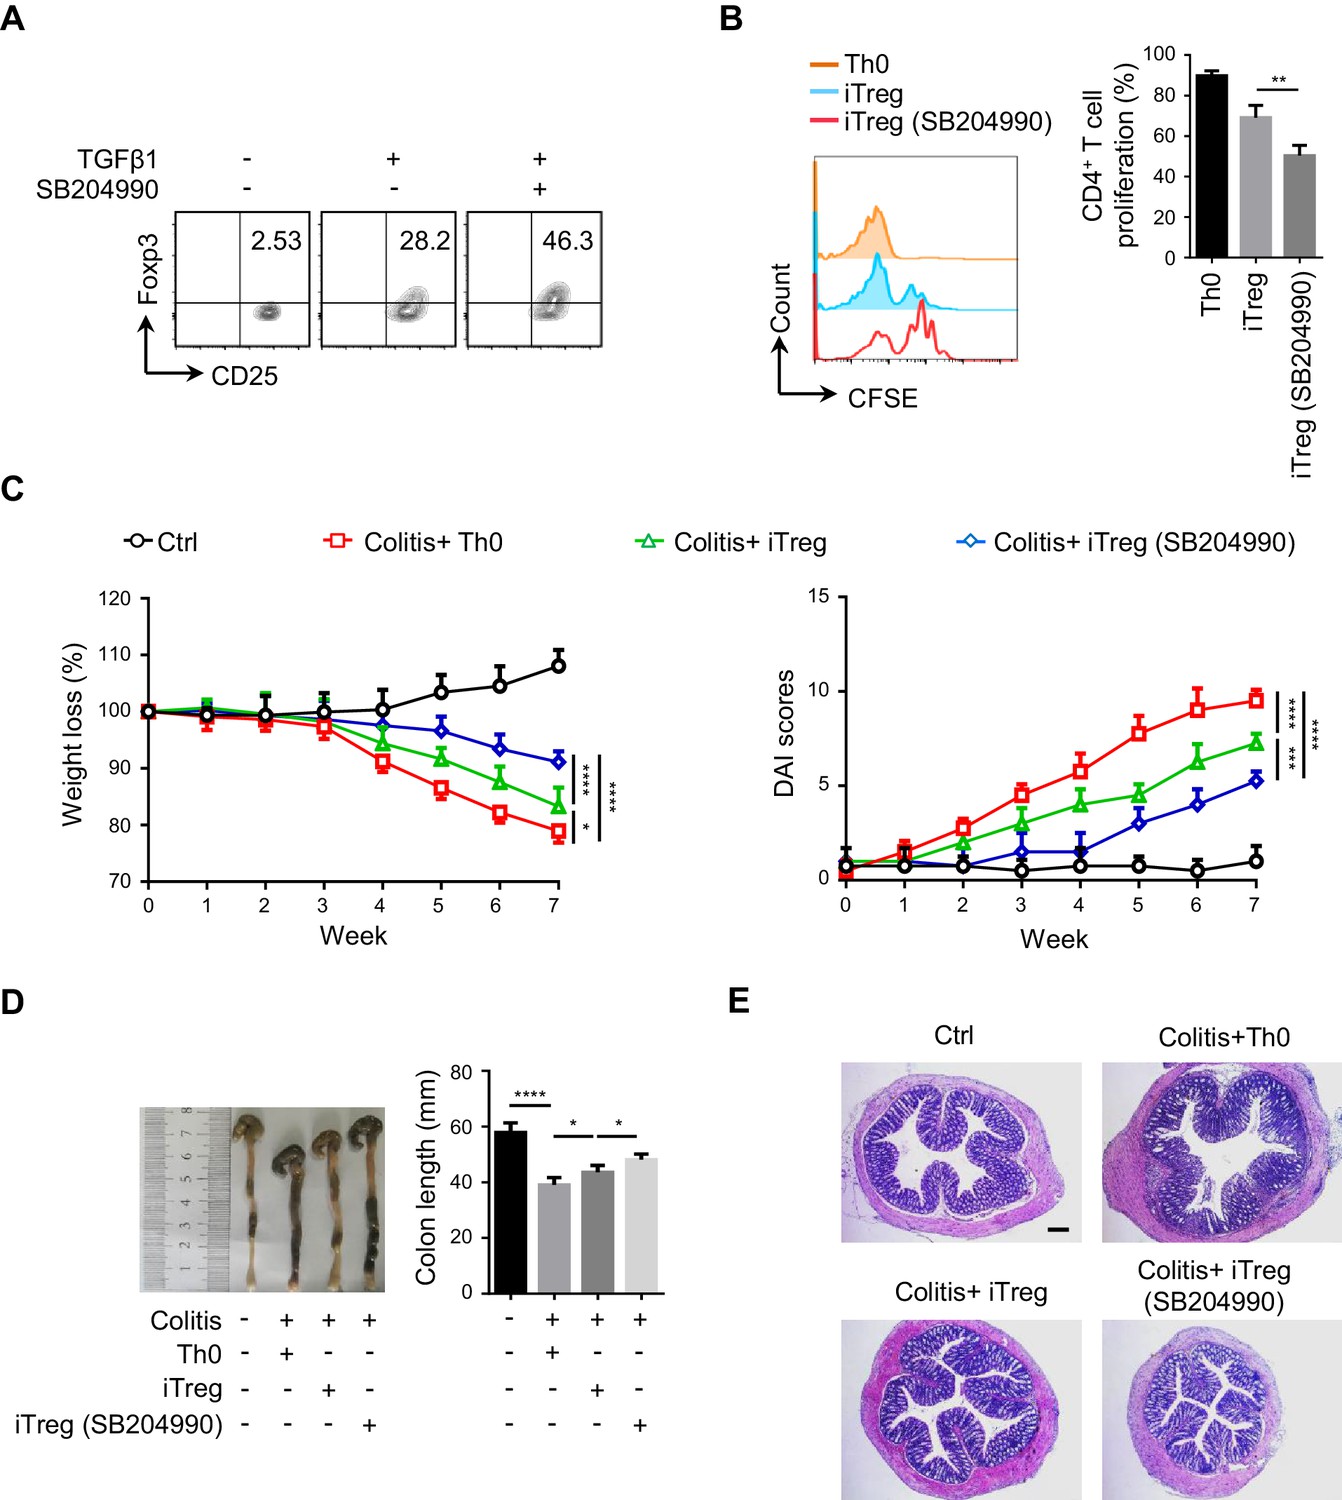
ACLY inhibition promotes iTreg differentiation and relieves mice colitis.
(A) Inhibition of ATP-citrate lyase (ACLY) by SB204990 facilitates inducible regulatory T (iTreg) differentiation. Naive CD4+ T cells treated with SB204990 were induced as in Figure 1E. CD4+CD25+Foxp3+ iTreg cells were evaluated by flow cytometry (FCM). (B) Assay for iTreg inhibitory function in vitro. Cells prepared as in (A) were cocultured with carboxyfluorescein diacetate succinimidyl ester (CFSE)-stained naive CD4+ T cells in the presence of Dynabeads Mouse T-Activator CD3/CD28 for 72 hr. CD4+ T-cell proliferation was analyzed by FCM (left) and quantified (right) based on three independent experiments. One-way analysis of variance (ANOVA) test, mean ± SD. **p<0.01. (C–E) Systematic evaluation of colitis in mice adoptively transferred with different cells. (C) Body weight (left) and disease activity index (DAI) score (right), based on body weight loss, stool consistency, and blood in the stool, were recorded weekly. 7 weeks later, entire colons from mice treated in different ways were removed for length assessment (D) and hematoxylin and eosin (H and E) staining for histopathological changes (E). Scale bar, 200 μm. (C, D) Data represent mean ± SD (n = 4), with significance determined by two-way ANOVA test (C) and one-way ANOVA test (D). *p<0.05, ***p<0.001, and ****p<0.0001. (A, E) One representative experiment out of four biological replicas is represented.
Figure 6—figure supplement 4
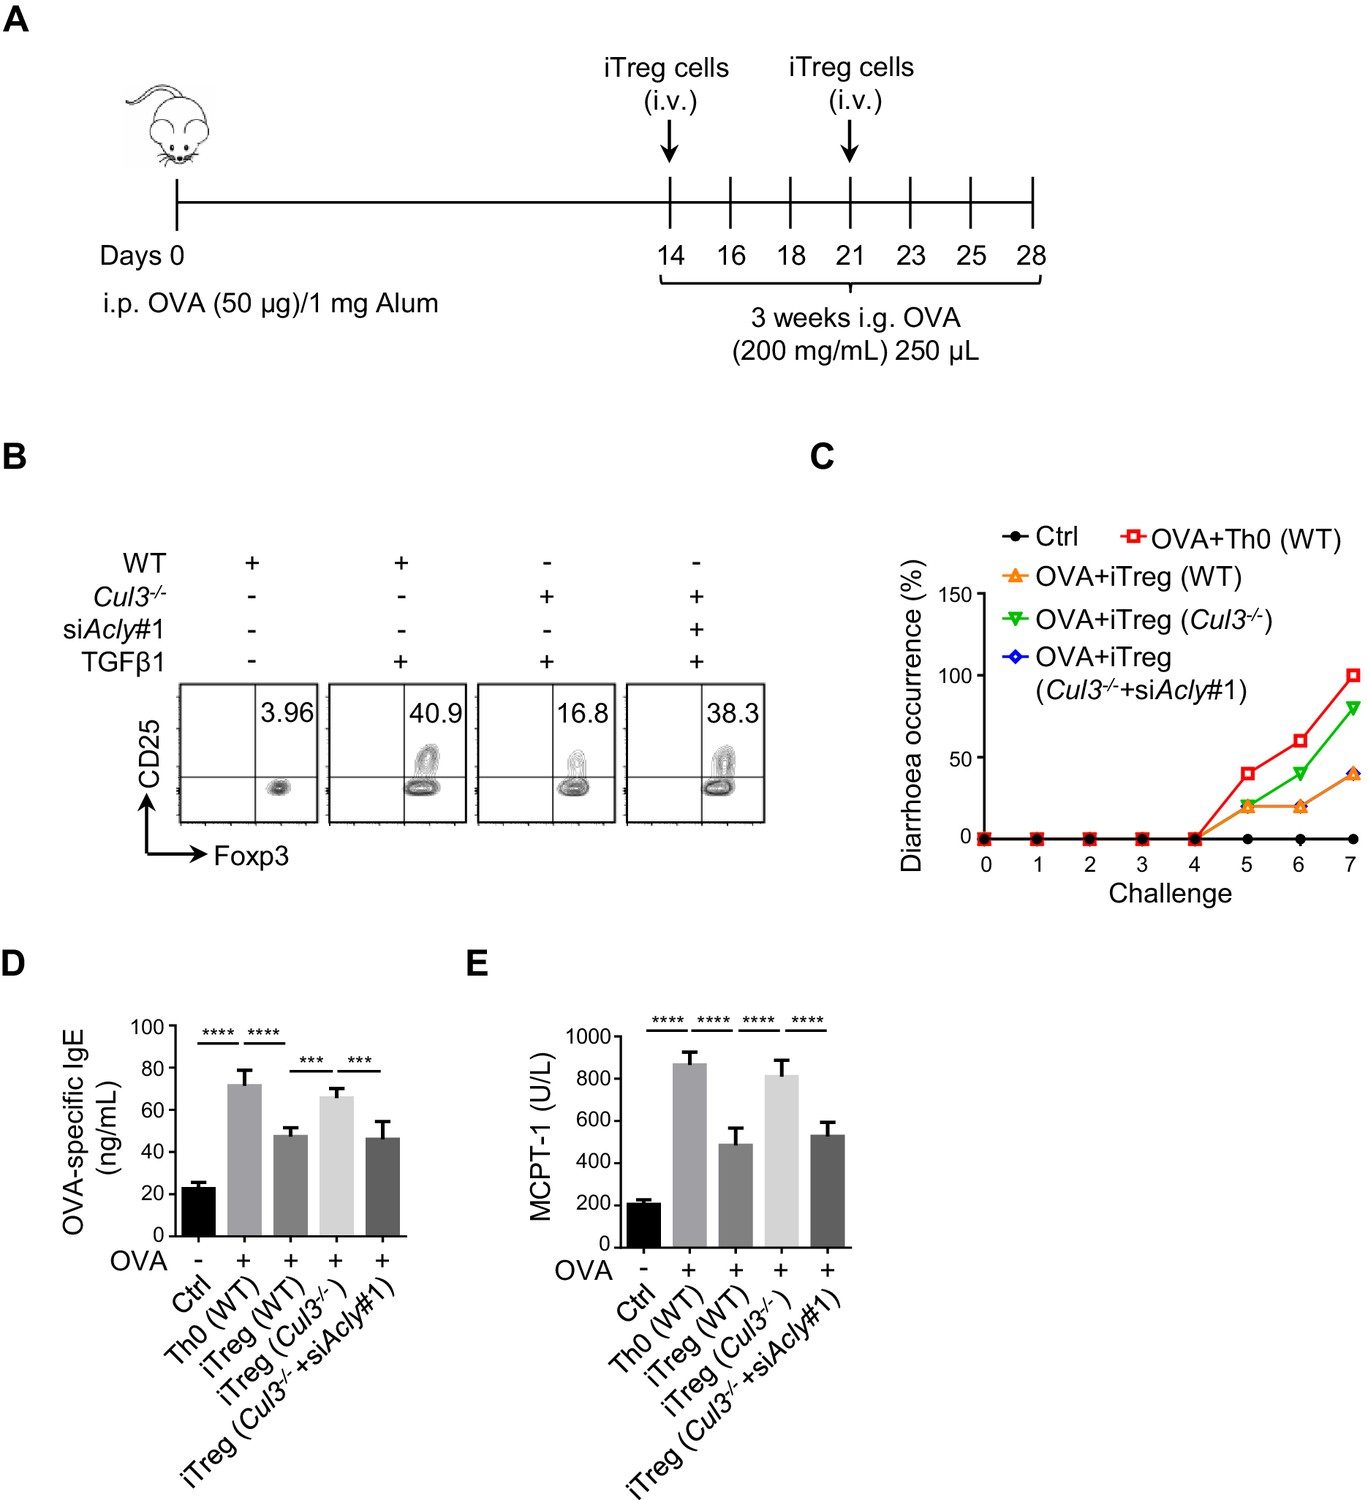
ACLY ubiquitination is involved in the regulation of iTreg differentiation and allergic diarrhea in mice.
(A) Experimental design of the oral allergen-induced food allergy model. (B) Analysis of inducible regulatory T (iTreg) differentiation upon ATP-citrate lyase (ACLY) depletion. Naive CD4+ T cells isolated from wild-type (WT) or Cd4CreCul3fl/fl mice were transfected with small interfering RNAs (siRNAs) and polarized as described in Figure 1—figure supplement 1A. CD4+CD25+Foxp3+ iTreg cells were evaluated by flow cytometry (FCM). One representative experiment out of three independent experiments is represented. (C–E) Systematic evaluation of manifestation of allergic diarrhea in mice adoptively transferred with different cells. (C) Frequency of diarrhea in mice challenged with ovalbumin (OVA). Assay of serum OVA-specific IgE (D) and mastocyte protease (MCPT-1) (E) by enzyme-linked immunosorbent assay (ELISA). (D, E) Data represent mean ± SD (n = 4), with significance determined by one-way analysis of variance (ANOVA) test. ***p<0.001, ****p<0.0001.
Tables
Key resources table
| Reagent type (species) or resource | Designation | Source or reference | Identifiers | Additional information |
|---|---|---|---|---|
| Strain, strain background (Mus musculus) | C57BL/6J | Beijing HFK Bioscience | ||
| Strain, strain background (M. musculus) | Cd4Cre | Dong et al., 2008 | ||
| Strain, strain background (M. musculus) | Cul3fl/fl | The Jackson Laboratory | Stock #: 028349 | |
| Strain, strain background (M. musculus) | Cd4CreCul3fl/fl | This paper | ||
| Strain, strain background (M. musculus) | Foxp3YFP-Cre | The Jackson Laboratory | Stock #: 016959 | |
| Strain, strain background (M. musculus) | B6/Rag1-/- | Jiangsu Gempharmatech | Stock #: T011699 | |
| Cell line (Homo sapiens) | HEK293T | ATCC | Cat. #: ACS-4500 | |
| Biological sample (Homo sapiens) | Healthy adult peripheral blood | Jilin blood center | ||
| Antibody | Mouse anti-CD3/CD28 beads | Gibco | Cat. #: 11453D | T-cell activation (beads:cells, 1:1) |
| Antibody | Human anti-CD3/CD28 beads | Gibco | Cat. #: 11132D | T-cell activation (beads:cells, 1:1) |
| Antibody | Anti-mouse CD4-FITC | BD Biosciences | Cat. #: 553046 RRID:AB_394582 | FCM (1:200) |
| Antibody | Anti-mouse CD25-PE | BD Biosciences | Cat. #: 561065 RRID:AB_10563211 | FCM (1:200) |
| Antibody | Anti-mouse Foxp3- Alexa Fluor 647 | BD Biosciences | Cat. #: 560401 RRID:AB_1645201 | FCM (1:200) |
| Antibody | Anti-human CD4-FITC | Biolegend | Cat. #: 357406 RRID:AB_2562357 | FCM (1:200) |
| Antibody | Anti-human CD25-PE | Biolegend | Cat. #: 302605 RRID:AB_314275 | FCM (1:200) |
| Antibody | Anti-human Foxp3- Alexa Fluor 647 | Biolegend | Cat. #: 320114 RRID:AB_439754 | FCM (1:200) |
| Antibody | Anti-mouse CTLA4-PE-Cy7 | Biolegend | Cat. #: 106311 RRID:AB_10901170 | FCM (1:200) |
| Antibody | Anti-mouse ICOS-PE-Cy7 | Biolegend | Cat. #: 117421 RRID:AB_2860636 | FCM (1:200) |
| Antibody | Anti-mouse TIGIT-PE-Cy7 | Biolegend | Cat. #: 142107 RRID:AB_2565648 | FCM (1:200) |
| Antibody | Anti-mouse IL-10-PE-Cy7 | Biolegend | Cat. #: 505025 RRID:AB_11149682 | FCM (1:200) |
| Antibody | Anti-ACLY | Abcam | Cat. #: Ab40793 RRID:AB_722533 | IP (1:100) WB (1:1000) |
| Antibody | Anti-eGFP | Proteintech | Cat. #: 66002–1-Ig RRID:AB_11182611 | IP (1:100) WB (1:1000) |
| Antibody | Anti-Actin | Proteintech | Cat. #: 66009–1-Ig RRID:AB_2687938 | WB (1:1000) |
| Antibody | Anti-CUL3 | Santa Cruz | Cat. #: sc-166110 RRID:AB_2245478 | IP (1:50) WB (1:200) |
| Antibody | Anti-KLHL25 | Santa Cruz | Cat. #: sc-100774 RRID:AB_1124139 | IP (1:50) WB (1:200) |
| Antibody | Anti-UBR4 | Abcam | Cat. #: Ab86738 RRID:AB_1952666 | IP (1:100) WB (1:1000) |
| Antibody | Anti-USP13 | Santa Cruz | Cat. #: sc-514416 | IP (1:50) WB (1:200) |
| Antibody | Anti-Ubiquitin | Abcam | Cat. #: ab7780 RRID:AB_306069 | IP (1:100) WB (1:1000) |
| Antibody | Anti-Lamin b1 | CST | Cat. #: 12586 | WB (1:1000) |
| Antibody | Anti-β-Tubulin | Sigma | Cat. #: T0198 RRID:AB_2210695 | WB (1:1000) |
| Antibody | Anti-ATP5A1 | Bimake | Cat. #: A5288 | WB (1:1000) |
| Antibody | Anti-Pan-acetylation | CST | Cat. #: 9441 RRID:AB_331805 | WB (1:1000) |
| Antibody | Goat anti-Rabbit | Signalway Antibody | Cat. #: L3012-2 | WB (1:10,000) |
| Antibody | Goat anti-Mouse | Signalway Antibody | Cat. #: L3032-2 | WB (1:10,000) |
| Commercial assay or kit | Mouse CD4+Naïve T Cell isolation kit | Biolegend | Cat. #: 480040 | |
| Commercial assay or kit | Human CD4+Naïve T Cell isolation kit | Biolegend | Cat. #: 480042 | |
| Commercial assay or kit | Mouse T cell nucleofection kit | Lonza | Cat. #: VPA1006 | |
| Commercial assay or kit | Mouse mevalonate ELISA kit | Sino Best Biological Technology | Cat. #: YX-132201M | |
| Commercial assay or kit | Mouse MCPT1 ELISA kit | Sino Best Biological Technology | Cat. #: YX-130316M | |
| Commercial assay or kit | Mouse OVA-specific IgE ELISA kit | Sino Best Biological Technology | Cat. #: YX-152201M | |
| Commercial assay or kit | Mouse mevalonate-5-pyrophosphate ELISA kit | Shanghai Ruifan Biological Technology | Cat. #: RF8872 | |
| Commercial assay or kit | Mouse HMG-CoA ELISA kit | Shanghai Ruifan Biological Technology | Cat. #: RF8726 | |
| Commercial assay or kit | Mitochondrial isolation kit | Beyotime Biotechnology | Cat. #: C3601 | |
| Commercial assay or kit | Cell Nuclear/Cytoplasm Protein Isolation Kit | Beyotime Biotechnology | Cat. #: P0028 | |
| Commercial assay or kit | ACLY activity assay kit | Suzhou comin Biotechnology | Cat. #: ACL-1-Y | |
| Commercial assay or kit | ACC activity assay kit | Suzhou comin Biotechnology | Cat. #: ACC-1-Y | |
| Commercial assay or kit | FASN activity assay kit | Suzhou comin Biotechnology | Cat. #: FASN-1-Y | |
| Commercial assay or kit | CPT1 activity assay kit | Suzhou comin Biotechnology | Cat. #: CPT1-1-Y | |
| Commercial assay or kit | Acetyl-CoA Fluorometric Assay kit | BioVision | Cat. #: K317-100 | |
| Commercial assay or kit | OAA assay kit | Sigma | Cat. #: MAK070 | |
| Commercial assay or kit | Transcriptional factor buffer set | BD | Cat. #: 562574 | |
| Commercial assay or kit | CFSE | Biolegend | Cat. #: 423801 | 1 μM |
| Commercial assay or kit | CellTrace Violet | Thermo Fisher | Cat. #: C34557 | 1 μM |
| Commercial assay or kit | Mito Stress Test kits | Agilent | Cat. #: 103010–100 | |
| Commercial assay or kit | Seahorse XF Palmitate-BSA FAO substrate | Agilent | Cat. #: 102720–100 | |
| Recombinant DNA reagent | pWPXLD-mACLY (plasmid) | This paper | ||
| Recombinant DNA reagent | pWPXLD-mACLY3KR(K530/536/544)(plasmid) | This paper | ||
| Recombinant DNA reagent | pWPXLD-hACLY (plasmid) | This paper | ||
| Recombinant DNA reagent | pWPXLD-hACLY3KR(K540/546/554)(plasmid) | This paper | ||
| Peptide, recombinant protein | Recombinant mouse IL-2 | Peprotech | Cat. #: 212–12 | 7.5 ng/ml |
| Peptide, recombinant protein | Recombinant human IL-2 | Gibco | Cat. #: PHC0026 | 7.5 ng/ml |
| Peptide, recombinant protein | Recombinant human TGFβ1 | Peprotech | Cat. #: 100-21-10 | 0.5 or 2 ng/ml |
| Chemical compound, drug | SB204990 | Tocris Bioscience | Cat. #: 154566-12-8 | 100 μM |
| Chemical compound, drug | MG132 | Selleck | Cat. #: S2619 | 10, 20, or 40 μM |
| Chemical compound, drug | CHX | Tocris Bioscience | Cat. #: 0970 | 10 μg/ml |
| Chemical compound, drug | Leupeptin | Selleck | Cat. #: S7380 | 0.4 or 0.8 mM |
| Chemical compound, drug | Dextran sulfate sodium (36,000–50,000) | MP Biomedicals | Cat. #: 0216011080 | 2% |
| Chemical compound, drug | PF05175157 | TOCRIS | Cat. #: 5709 | 5 μM |
| Chemical compound, drug | Cerulenin | Biovision | Cat. #: 1579–5 | 4 μM |
| Software, algorithm | FlowJo 10.1 | FlowJo LLC | https://www.flowjo.com/ | |
| Software, algorithm | GraphPad Prism 6 | GraphPad Software | https://www.graphpad.com | |
| Other | RPMI 1640 | Sigma-Aldrich | Cat. #: R66504 | |
| Other | Fetal bovine serum | Biological Industries | Cat. #: 04-001-01 | |
| Other | XF Base Medium | Agilent | Cat. #: 103193–100 | |
| Other | OVA | Sigma-Aldrich | Cat. #: A5503 | |
| Other | Polybrene | Solarbio | Cat. #: H8761 | 8 μg/ml |
Additional files
-
Source data 1
Original data and blots supporting main figures and figure supplements.
- https://cdn.elifesciences.org/articles/62394/elife-62394-data1-v1.zip
-
Supplementary file 1
List of oligonucleotides.
Primers for PCR and quantitative PCR, and sequences of siRNAs are included.
- https://cdn.elifesciences.org/articles/62394/elife-62394-supp1-v1.docx
-
Transparent reporting form
- https://cdn.elifesciences.org/articles/62394/elife-62394-transrepform-v1.docx
Download links
A two-part list of links to download the article, or parts of the article, in various formats.
Downloads (link to download the article as PDF)
Open citations (links to open the citations from this article in various online reference manager services)
Cite this article (links to download the citations from this article in formats compatible with various reference manager tools)
ACLY ubiquitination by CUL3-KLHL25 induces the reprogramming of fatty acid metabolism to facilitate iTreg differentiation
eLife 10:e62394.
https://doi.org/10.7554/eLife.62394


