Salivary and plasmatic oxytocin are not reliable trait markers of the physiology of the oxytocin system in humans
- Department of Neuroimaging, Institute of Psychiatry, Psychology & Neuroscience, Kings College London, United Kingdom
- Centre for Human Brain Health, University of Birmingham, United Kingdom
Figures
Figure 1 with 2 supplements
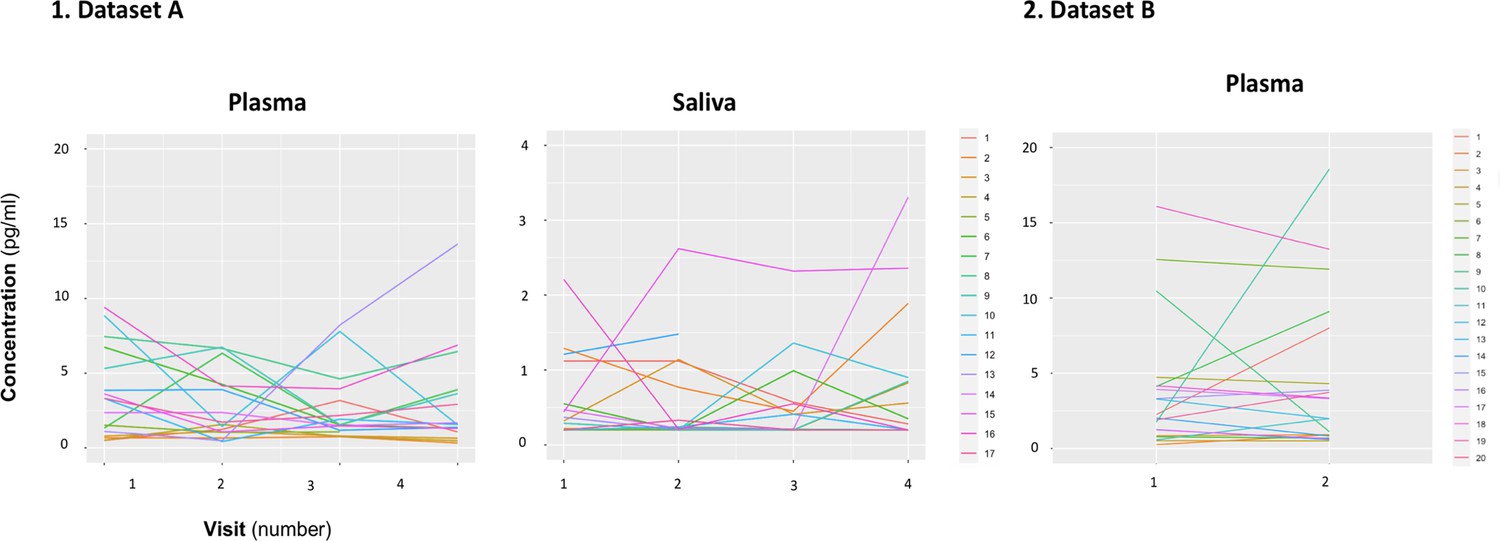
Within-individual variation of baseline measurements of oxytocin in plasma and saliva samples across visits.
Baseline plasmatic and salivary oxytocin fluctuate from one visit to another for most individuals (Dataset A). We replicated this trend in an independent dataset for plasma (Dataset B). Each colored line represents one individual.
Figure 1—figure supplement 1
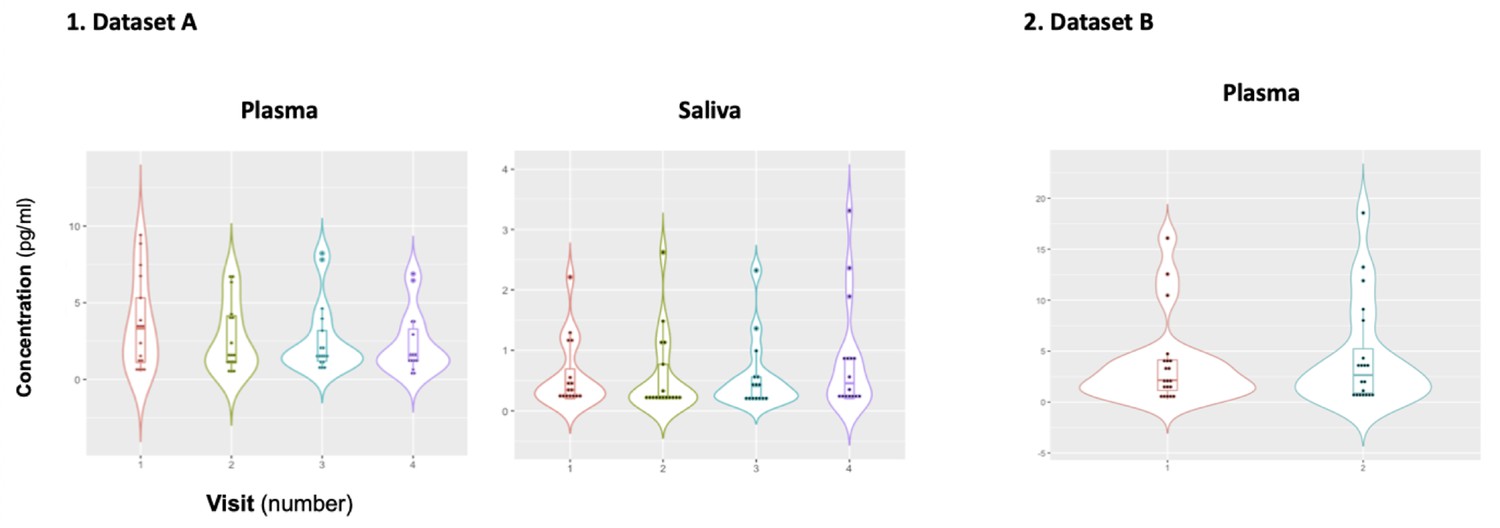
Mean plasmatic and salivary concentrations of oxytocin across visits.
We tested for differences in mean baseline plasmatic and salivary oxytocin across the four visits of dataset A in a repeated measures one-way analysis of variance. In dataset B, we tested for differences in mean baseline plasmatic oxytocin across the two visits using a paired T-test. Statistical significance was set to p<0.05 (two-tailed). Box plots and violin plots depicting oxytocin concentrations for each visit; middle horizontal lines represent the median; boxes indicate the 25 and 75th percentiles.
Figure 1—figure supplement 2
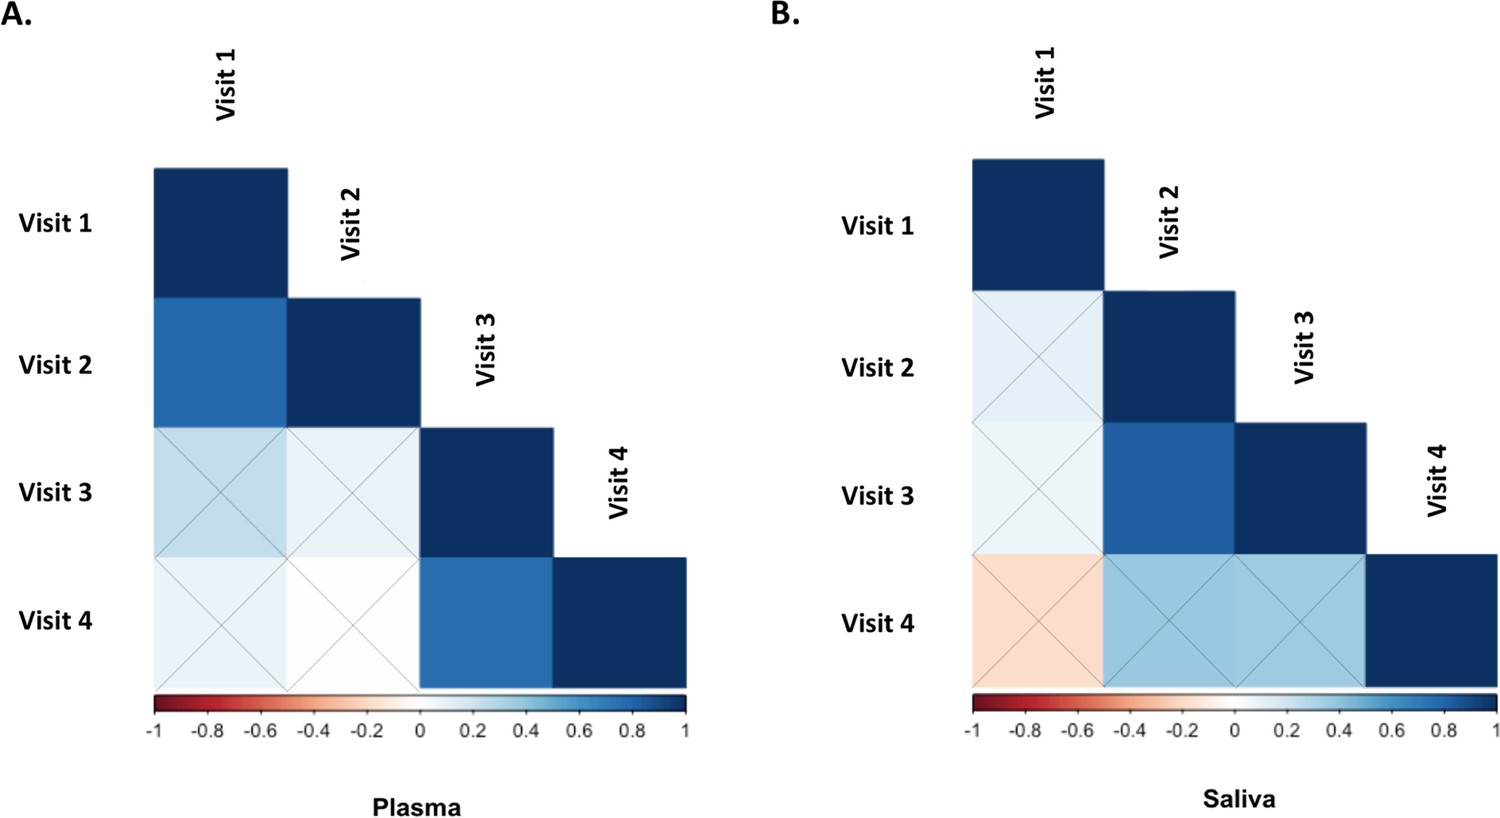
Correlation between baseline oxytocin concentrations in plasma (left) and saliva (right) for each pair of the four sessions included in Study A.
Color grading represents Pearson’s coefficient of correlation (r), with bootstrapping 1000 samples. Statistical significance was set to p<0.05 (two-tailed). Black crosses identify correlations that did not reach significance.
Figure 2
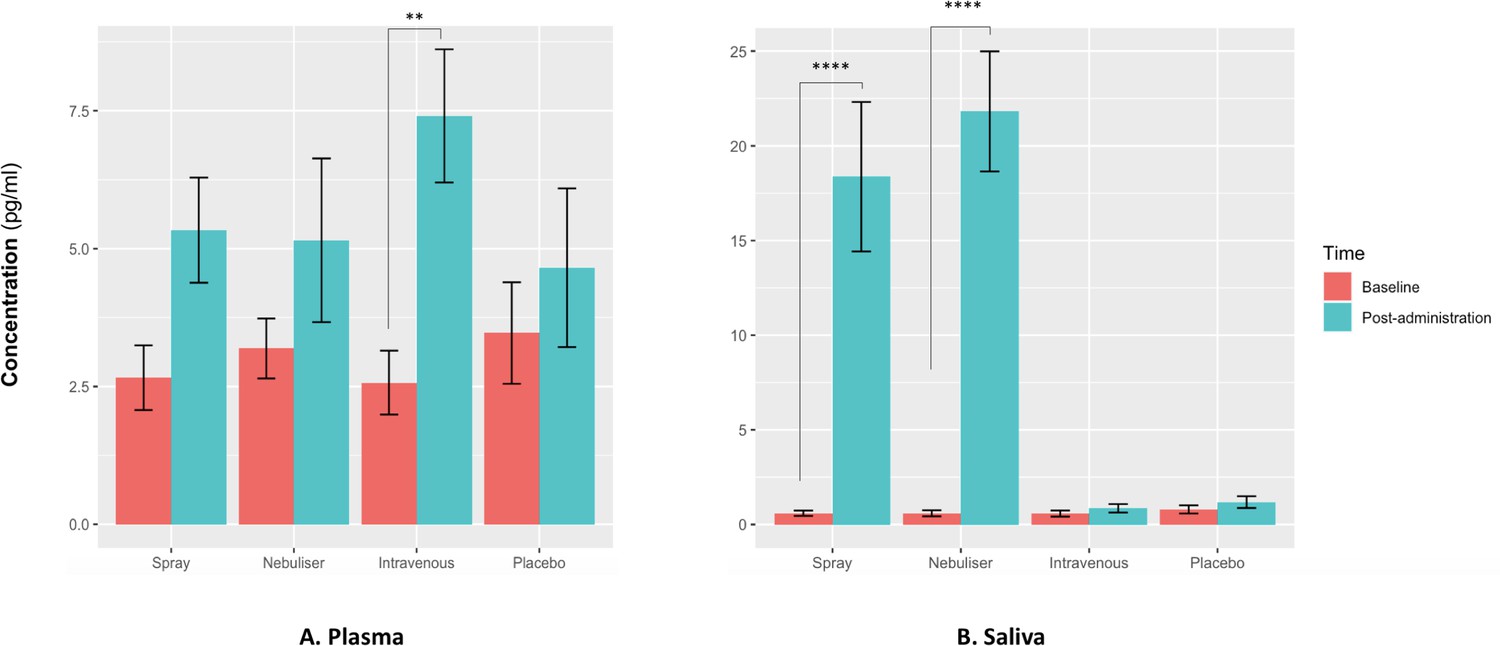
Effects of the administration of intranasal and intravenous oxytocin on salivary (A) and plasmatic (B) oxytocin.
We examined the effects of treatment, time and treatment × time on salivary and plasmatic oxytocin in a two-way analysis of variance. Post-administration samples were collected at 115 min post-dosing. Statistical significance was set to p<0.05. **p=0.001 and ****p<0.001, using Tukey for multiple testing correction during post-hoc investigation of significant interaction effects. Please note that although all the statistical analyses were conducted on log-transformed oxytocin concentrations, here we plot the raw values to facilitate interpretation.
Figure 3
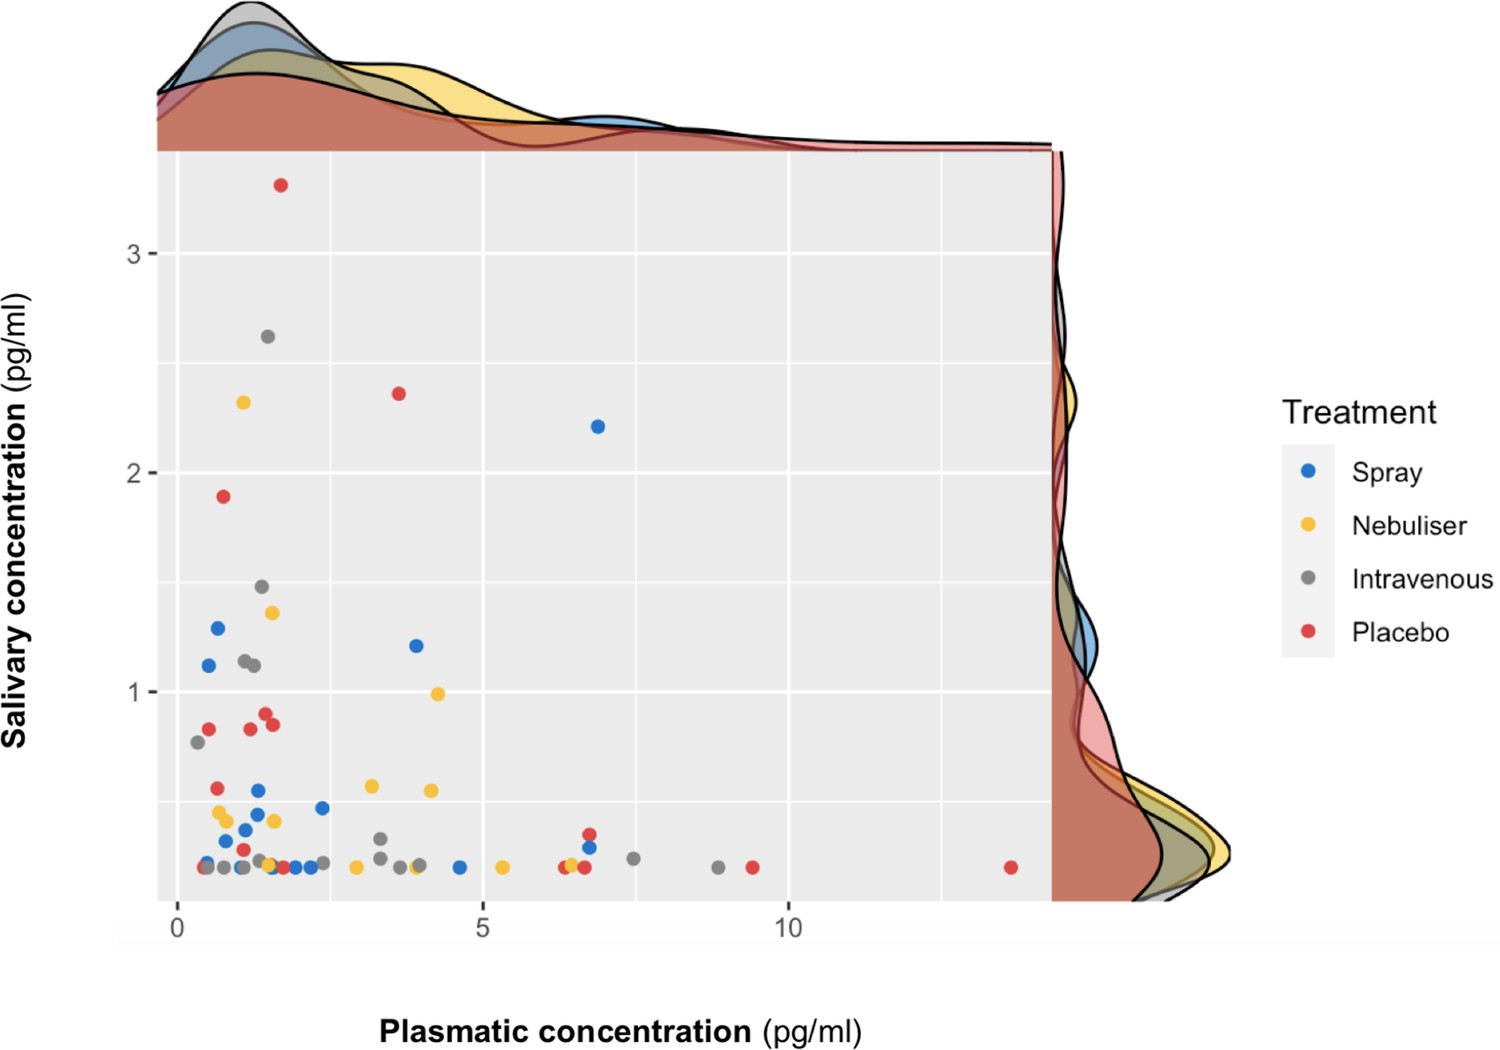
Association between salivary and plasmatic oxytocin concentrations at baseline.
In this scatter plot, we depict the lack of association between salivary and plasmatic oxytocin concentrations at baseline (before any treatment administration). The density plots on the top of each axis show the distribution of oxytocin concentrations for each treatment level. Please note that although all the statistical analyses were conducted on log-transformed oxytocin concentrations, here we plot the raw values to facilitate interpretation.
Figure 4
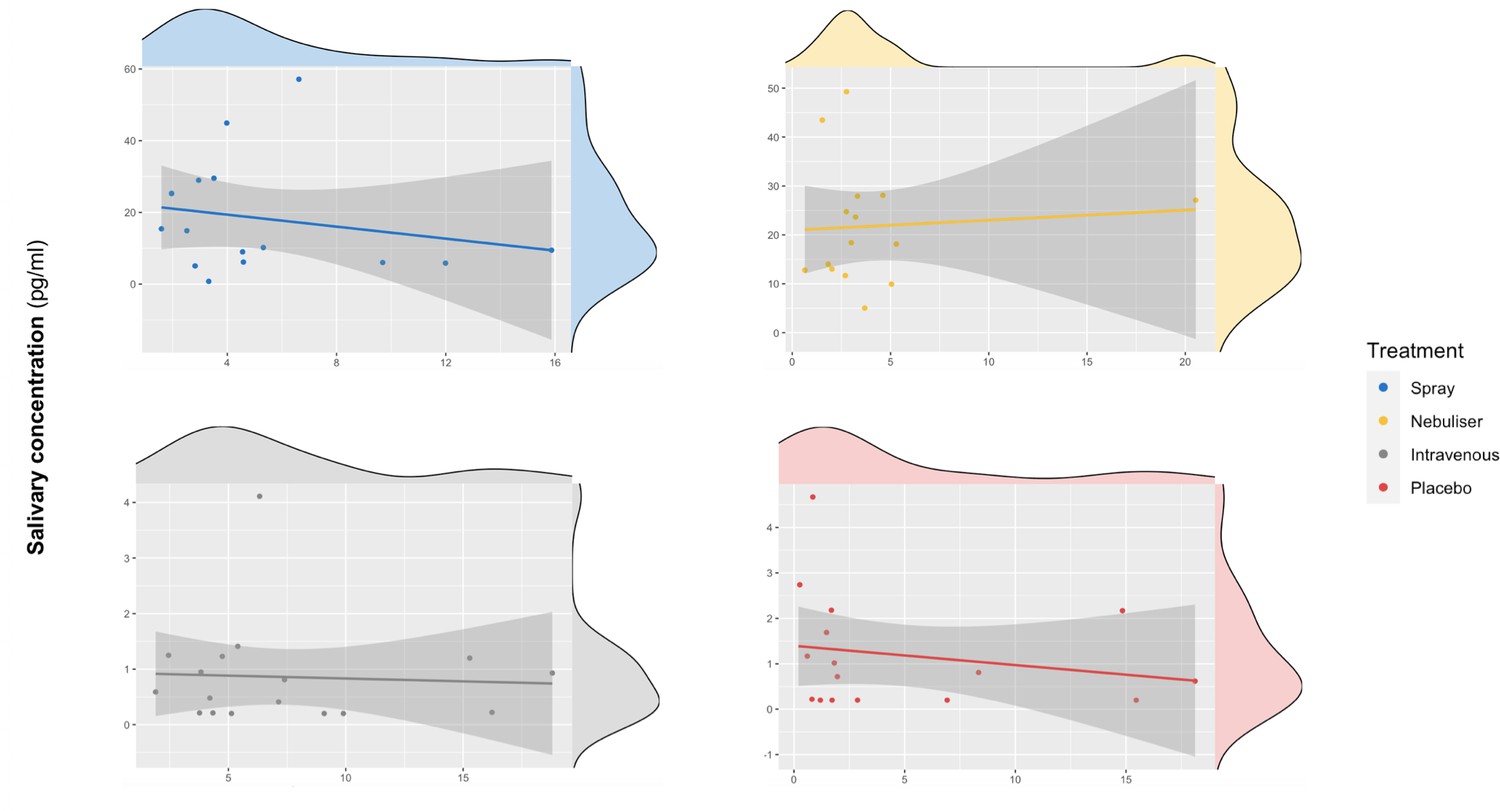
Association between salivary and plasmatic oxytocin after administration of intranasal and intravenous exogenous oxytocin.
In these scatter plots, we depict the lack of association between salivary and plasmatic oxytocin concentrations at 120 and 115 min after the administration of intravenous and intranasal oxytocin or placebo, respectively. Each panel depicts data from one out of the four treatment levels. Please note that although all the statistical analyses were conducted on log-transformed oxytocin concentrations, here we plot the raw values to facilitate interpretation.
Figure 5
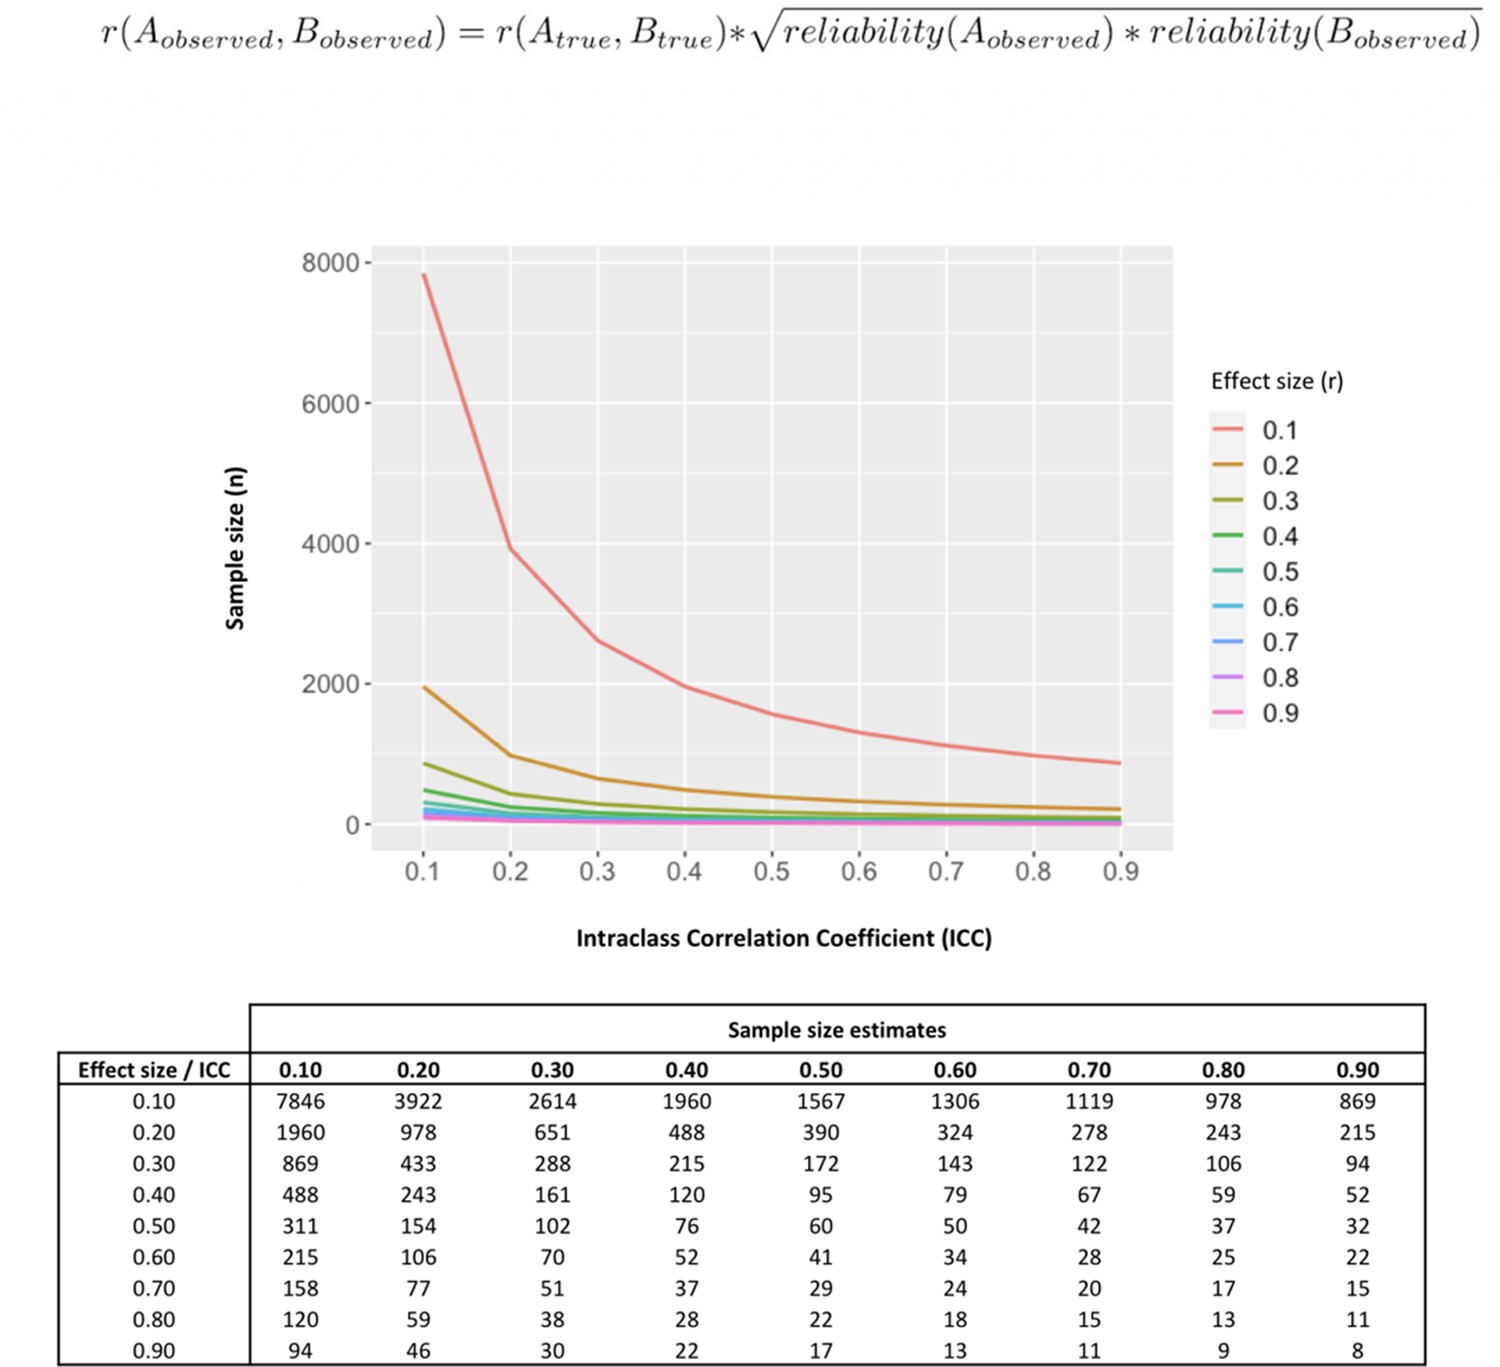
Influence of less-than-perfect reliability of oxytocin measurements on the sample sizes required to detect significant endogenous oxytocin-outcome associations in neurobehavioral human oxytocin research.
In this figure, we show that the results of a set of simulations illustrating the impact less-than-perfect reliabilities of endogenous oxytocin measurements in peripheral fluids might have on the sample size required to detect significant oxytocin (A) – outcome (B) correlations of varying effect sizes in research studies. We conduct calculations for a minimally acceptable statistical power of 80% in a two-tailed parametric test. The outcome measure (B) was assumed to present perfect reliability. The figure was generated using the ‘pwr.r.test’ function of the ‘pwr’ R package. We specified ‘r’ according to the attenuation formula below (Nunnally, 1970). ICC -. Intraclass correlation coefficient; r – Pearson’s correlation coefficient.
Figure 6
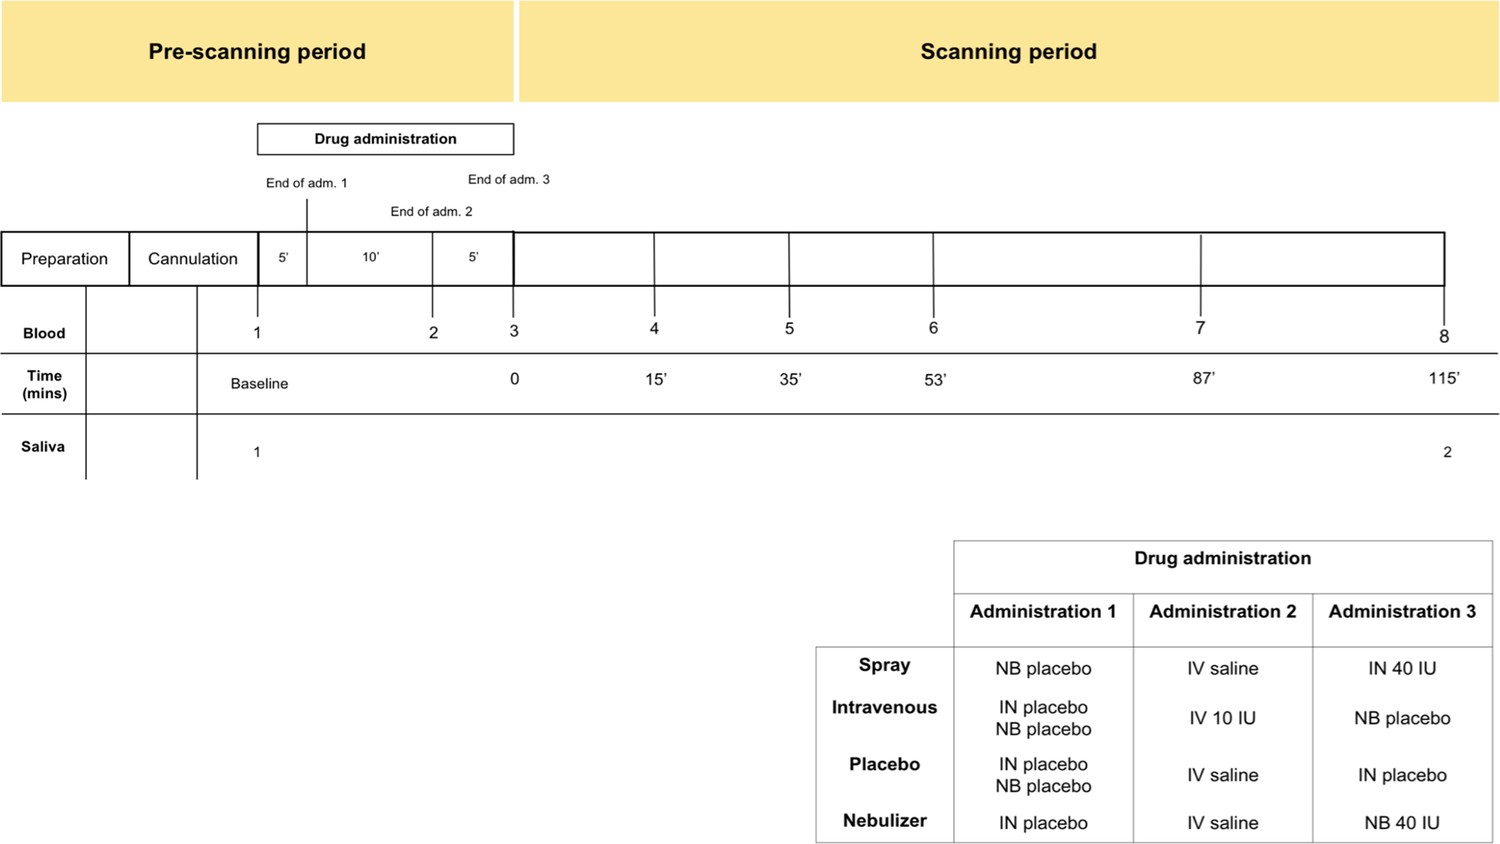
Schematic representation of the design of study A.
All subjects received first an administration of intranasal placebo - either by spray or nebuliser, then an intravenous administration of oxytocin (10 IU)/saline and then an intranasal administration of oxytocin (40 IU)/placebo, either by spray or nebuliser. Following drug administration, participants were placed in a Magnetic Resonance Imaging scanner for eight resting arterial spinal labeling (ASL) regional blood flow images of the brain and one resting BOLD fMRI scan. Saliva samples were collected before any drug administration (baseline) and after the scanning session (at 115 min after our last treatment administration). Plasma samples were collected before any drug administration, after any administered drug and then at several time-points during scanning session. For the current study, only time-points where saliva and plasma were concomitantly collected were considered – baseline and after scanning session. Detailed plasmatic pharmacokinetics of each route/method have been presented elsewhere (Martins et al., 2020). Adm. – administration; min – minutes; IN – Spray; NB – Nebuliser; IV – Intravenous.
Tables
Table 1
Estimates of absolute and relative between-visits reliability of oxytocin measurements in saliva and plasma samples.
Absolute and relative reliability were analyzed using the within-subject coefficient of variation (CV) and the intra-class correlation coefficient (ICC), respectively. We also present the number of additional measurements of the same individual that would be theoretically required to achieve different levels of reliability (ICC = X) of a hypothetical averaged measure, based on the initial reliabilities estimated for our datasets A and B. This number was calculated using the Spearman-Brown prediction formula. CI – confidence interval; SD – Standard Deviation; *H0: ICC is not significantly different from 0. N represents the actual size of the sample used to calculate the ICCs and the CVs.
| ICC | CV mean (SD) | Number of samples necessary to achieve an ICC = X of the averaged measurements in a design including multiple samples per individual | |||||||||
|---|---|---|---|---|---|---|---|---|---|---|---|
| N | 95% CI | F test* | p-value | X = 0.80 (good reliability) | X = 0.70 (moderate) | X = 0.50 (fair) | |||||
| Lower | Upper | ||||||||||
| Study A | Plasma (N = 16) | 0.29 | 16 | 0.06 | 0.59 | F(15, 45) = 2.61 | 0.01 | 57 % | 9.79 | 5.71 | 2.45 |
| Saliva (N = 13) | 0.23 | 13 | − 0.01 | 0.58 | F(12, 36) = 2.22 | 0.32 | 63 % | 13.39 | 7.81 | 3.35 | |
| Study B | Plasma (N = 19) | 0.49 | 19 | 0.06 | 0.76 | F(18, 18) = 2.84 | 0.01 | 42 % | 4.16 | 2.43 | 1.05 |
Additional files
-
Supplementary file 1
Table 1 – Absolute and relative between-visits reliability of oxytocin measurements in plasma and saliva for each pair of the four visits included in study A.
ICC – Intraclass correlation coefficient; CV – coefficient of variation; CI – confidence interval; SD – Standard Deviation; *H0: ICC is not significantly different from 0; statistical significance was set to p<0.05 (two-tailed). N represents the actual size of the sample used to calculate the ICCs and the CVs. Table 2 – Absolute and relative between-visits reliability of oxytocin measurements in plasma and saliva controlling for time-interval between visits (dataset A). ICC – Intraclass correlation coefficient; CV – coefficient of variation; CI – confidence interval; SD – Standard Deviation; *H0: ICC is not significantly different from 0; statistical significance was set to p<0.05 (two-tailed). N represents the actual size of the sample used to calculate the ICCs and the CVs. Table 3 – Absolute and relative within-visit reliability of oxytocin measurements in plasma and saliva in the placebo visit of dataset A. ICC – Intraclass correlation coefficient; CV – coefficient of variation; CI – confidence interval; SD – Standard Deviation; *H0: ICC is not significantly different from 0; statistical significance was set to p<0.05 (two-tailed). N represents the actual size of the sample used to calculate the ICCs and the CVs.
- https://cdn.elifesciences.org/articles/62456/elife-62456-supp1-v1.docx
-
Source data 1
- https://cdn.elifesciences.org/articles/62456/elife-62456-data1-v1.xlsx
-
Transparent reporting form
- https://cdn.elifesciences.org/articles/62456/elife-62456-transrepform-v1.docx
Download links
A two-part list of links to download the article, or parts of the article, in various formats.
Downloads (link to download the article as PDF)
Open citations (links to open the citations from this article in various online reference manager services)
Cite this article (links to download the citations from this article in formats compatible with various reference manager tools)
Salivary and plasmatic oxytocin are not reliable trait markers of the physiology of the oxytocin system in humans
eLife 9:e62456.
https://doi.org/10.7554/eLife.62456


