Susceptibility rhythm to bacterial endotoxin in myeloid clock-knockout mice
- Laboratory of Chronobiology, Charité Universitätsmedizin Berlin, Germany
- Institute for Theoretical Biology, Humboldt-Universität zu Berlin, Germany
Figures
Figure 1 with 1 supplement

Time-of-day-dependent mortality in LPS-treated mice is controlled by the circadian system and light conditions.
(A) LPS (30 mg/kg, i.p.) induced mortality in C57Bl/6 mice (n=10 per time point) kept either in LD 12:12 (yellow) or in DD (gray). Left graph: single time points plottet in either Zeitgeber Time [ZT] or Circadian Time [CT] depending on respective light conditions; right graph: mean mortality of LD or DD light condition. Error bars represent 95% confidence intervals (n=40 per group, *** p=0.0005). (B) LPS dose-mortality curves of mice challenged at four time points in LD versus DD (overall n=40 mice per dosage). Gray lines were calculated by fitting an allosteric model to each group. (C) Mice (n=10–14 per time point) were challenged with half-lethal doses of LPS (30 mg/kg, i.p.), for mice kept in LD (left panel) or 13 mg/kg, i.p., for mice kept in DD (right panel). Mortality was assessed 60 hr after LPS injection. To perform statistical analyses, mortality rates were transformed to probability of death in order to compute sine fit using logistic regression and F-test (LD, p=0.06; DD, p=0.001; gray-shaded areas indicate 95% confidence intervals). (D) and (E) Time-of-day-dependent cytokine profiles in peripheral blood of C57Bl/6 mice (n=14 per time point) challenged with half-lethal doses of LPS (30 mg/kg, i.p., for mice kept in LD (yellow) or 13 mg/kg, i.p., for mice kept in DD (gray)) and sacrificed 2 hr later. (E) Relative amplitudes and phases of cytokines shown in (D). Light-colored circles represent non-significant circadian rhythms (p-value>0.05 ) as determined by non-linear least square fit and consecutive F-test (see also Materials and methods section). (F) Cytokine levels in peripheral blood from mice (n=10 per time point) challenged with LPS (13 mg/kg, i.p.) at either ZT8 (LD) or CT8 (DD) conditions (T-test, *** p<0.001, ** p<0.01, * p<0.05).
Figure 1—figure supplement 1
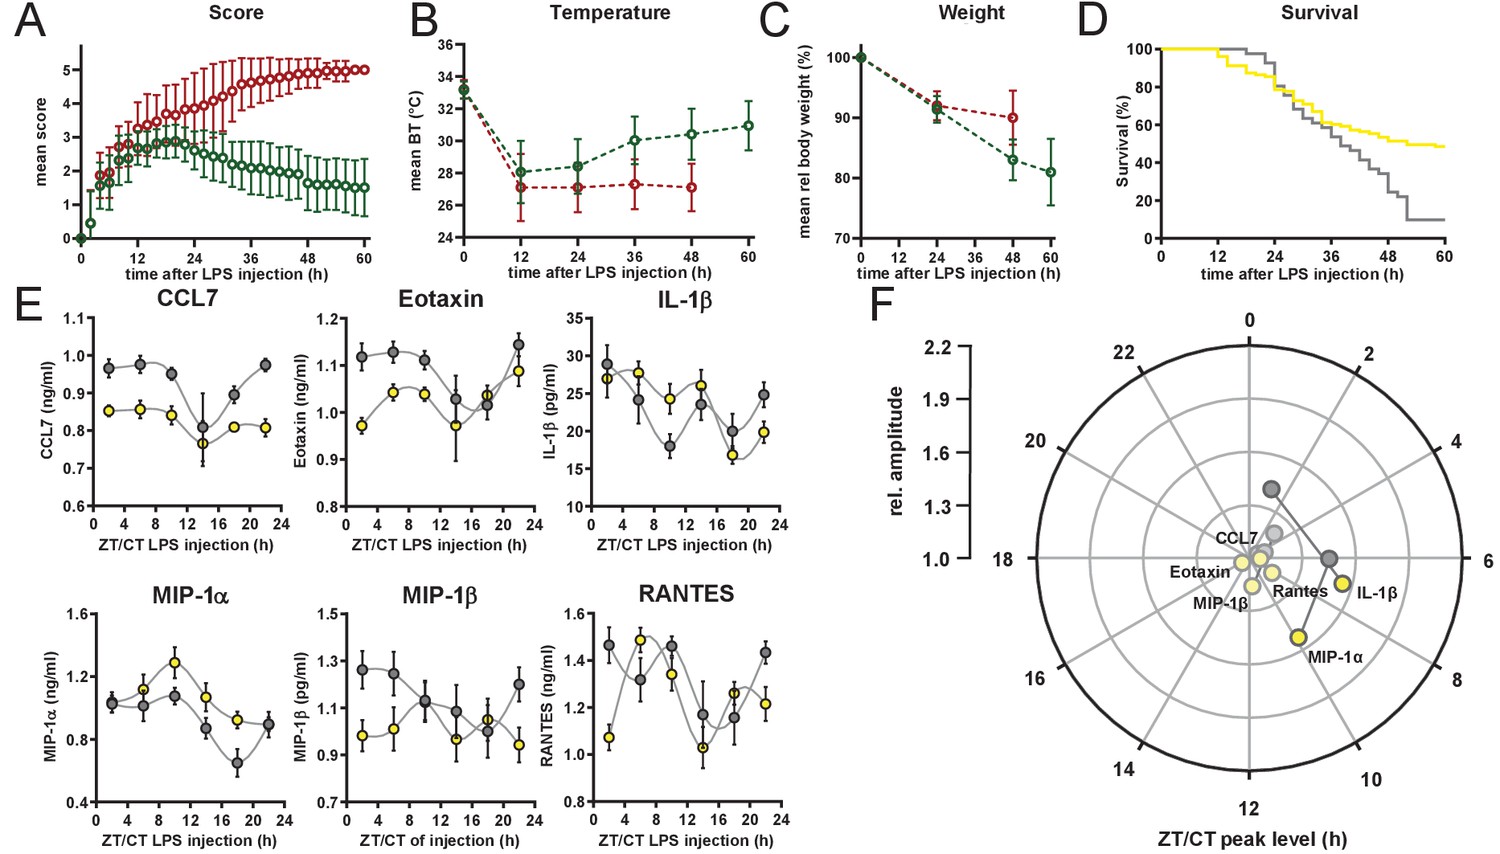
Symptomatic characterization of surviviors and non-survivors in endotoxic shock mice.
(A–C) Score, body temperature, and weight development of C57Bl/6 mice kept in LD and challenged with LPS (30 mg/kg, i.p.) (A) Mean score development, (B) mean body temperature development and (C) mean body weight development in survivors (green circles, n=49) and non-survivors (red circles, n=54 at time point 0). Error bars represent SD. (D) Kaplan-Meier survival curves of C57Bl/6 mice kept either in LD (yellow line) or DD (gray line) and challenged with LPS (30 mg/kg, i.p.). Data have been aligned to time after challenge with LPS, irrespective of time of day of challenge (same experiment as shown in Figure 1C). Survival curves differ significantly (p=0.0006). (E) Time-of-day-dependent cytokine profiles (complementing data shown in Figure 1E) in peripheral blood of C57Bl/6 mice (n=10 per time point) challenged with half-lethal doses of LPS and sacrificed 2 hr later. LPS dosage for mice kept in LD (yellow, 30 mg/kg) or DD (gray, 13 mg/kg). (F) Relative amplitudes and phases of cytokines shown in E. Light-colored circles represent non-significant circadian rhythms (p-value>0.05) as determined by non-linear least square fit and consecutive F-test (see also Materials and methods section).
Figure 2 with 1 supplement
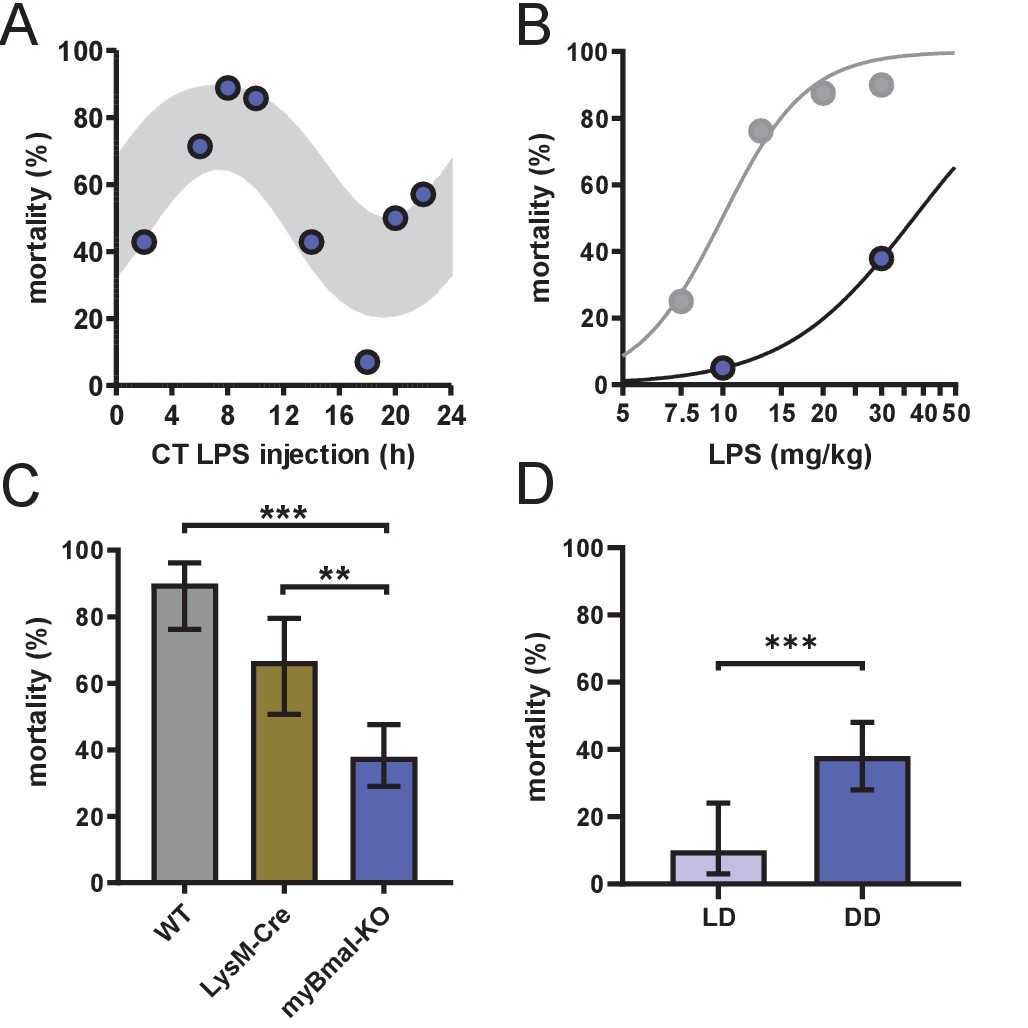
myBmal-KO mice show decreased and circadian time-dependent susceptibility to LPS.
(A) Circadian mortality in myBmal-KO mice. Mice kept in DD (n=10–14 per group) were challenged with half-lethal doses of LPS (30 mg/kg, i.p.) at indicated time points. Mortality was assessed 60 hr after LPS injection. Statistics were performed as in Figure 1C, (p=0.0009; gray shaded area indicates 95% confidence interval). (B) LPS dose-mortality curves of mice challenged at 4–8 time points across 24 hr in constant dark conditions. About threefold decrease of susceptibility to LPS in myBmal-KO mice (blue circles) as compared to wild-type mice (gray circles – re-plotted from Figure 1B kept in DD). Gray lines were calculated by fitting an allosteric model to each group. (C) Reduced mean mortality in myBmal-KO mice (n=103) compared to control strains LysM-Cre (n=39) or C57Bl/6 wild-type (WT, n=40). All mice were kept in DD and challenged with 30 mg/kg LPS i.p. Mean values and 95% confidence intervals from WT and myBmal-KO mice were calculated from experiments shown in Figure 1C (WT) and (A) (myBmal-KO)(** p=0.0021, *** p¡0.0001). (D) Constant dark conditions render mice more susceptible to LPS (30 mg/kg LPS) independent of Bmal1 in myeloid lineage cells (n=40 (LD) and n=103 (DD)). ( ** p<0.01, *** p<0.001).
Figure 2—figure supplement 1
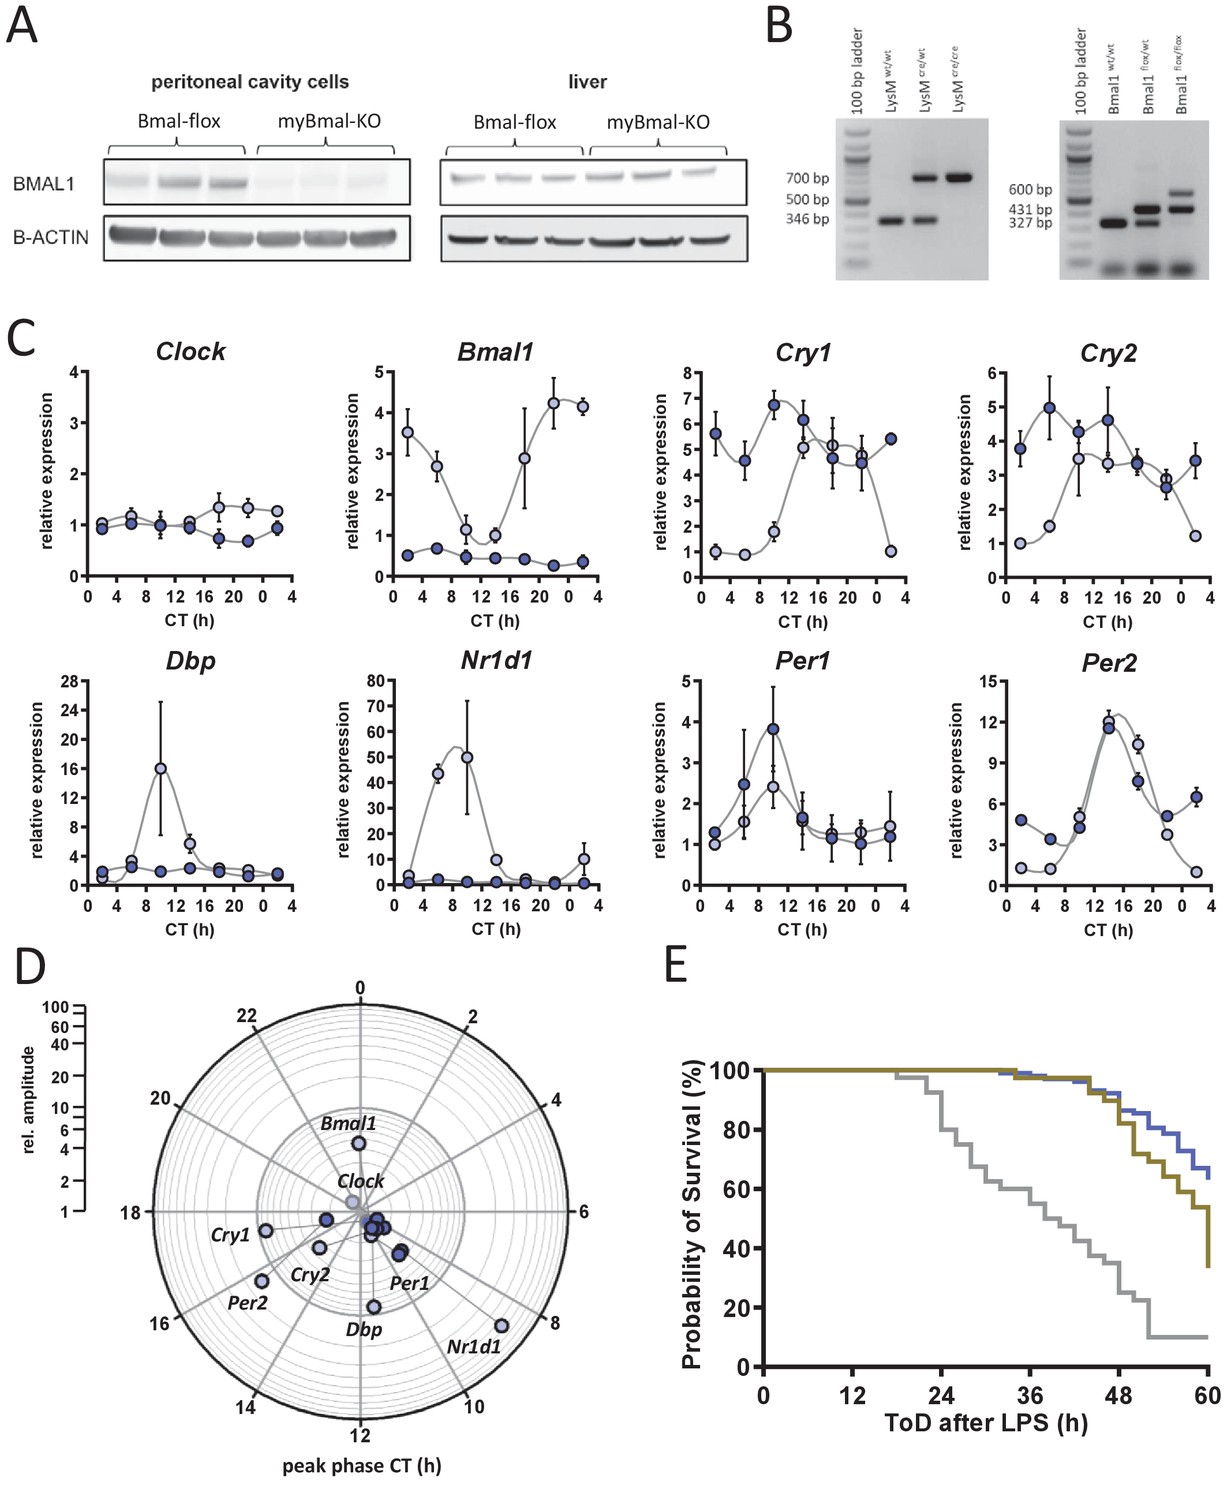
Molecular characterization of myBmal-KO mice.
Molecular characterization of myBmal-KO mice. (A) Western blots of whole cell lysates from peritoneal cavity cells or liver of control (Bmal1flox/flox) and myBmal-KO mice (n=3). (B) Prototypical genotyping results for Bmal1flox/flox mice. A 600 bp band indicates successful recombination - likely from immune cells of myeloid origin residing in skin. (C) Relative mRNA levels of selected clock genes in peritoneal macrophages from Bmal1flox/flox (light blue circles) or myBmal-KO (blue circles) mice at indicated circadian times. Phase and amplitude information are depicted in (D) as analyzed by Chronolyse. Non-significant circadian expression (p>0.05) are indicated by gray shaded circles for both myBmal-KO and LysM-cre control. (E) Kaplan-Meier survival curve of endotoxic shock experiments shown in Figure 2C. Mice kept in DD and challenged with LPS (30 mg/kg, i.p.). Gray line refers to C57Bl/6 mice (wild-type control, n=40), brown line to LysM-Cre control (n=39) and purple line to myBmal-KO (n=103). Data shown have been aligned to time after challenge with LPS, irrespective of time of day of challenge (same experiment as shown in Figure 1C and Figure 2A, respectively). Survival curves of wild-type and myBmal-KO as well as LysM-Cre and myBmal-KO differ significantly (p<0.0001 and p=0.0031, respectively, log-rank tests).
-
Figure 2—figure supplement 1—source data 1
Raw imaging data files from conditional knockout mouse genotyping.
- https://cdn.elifesciences.org/articles/62469/elife-62469-fig2-figsupp1-data1-v2.zip
Figure 3 with 1 supplement
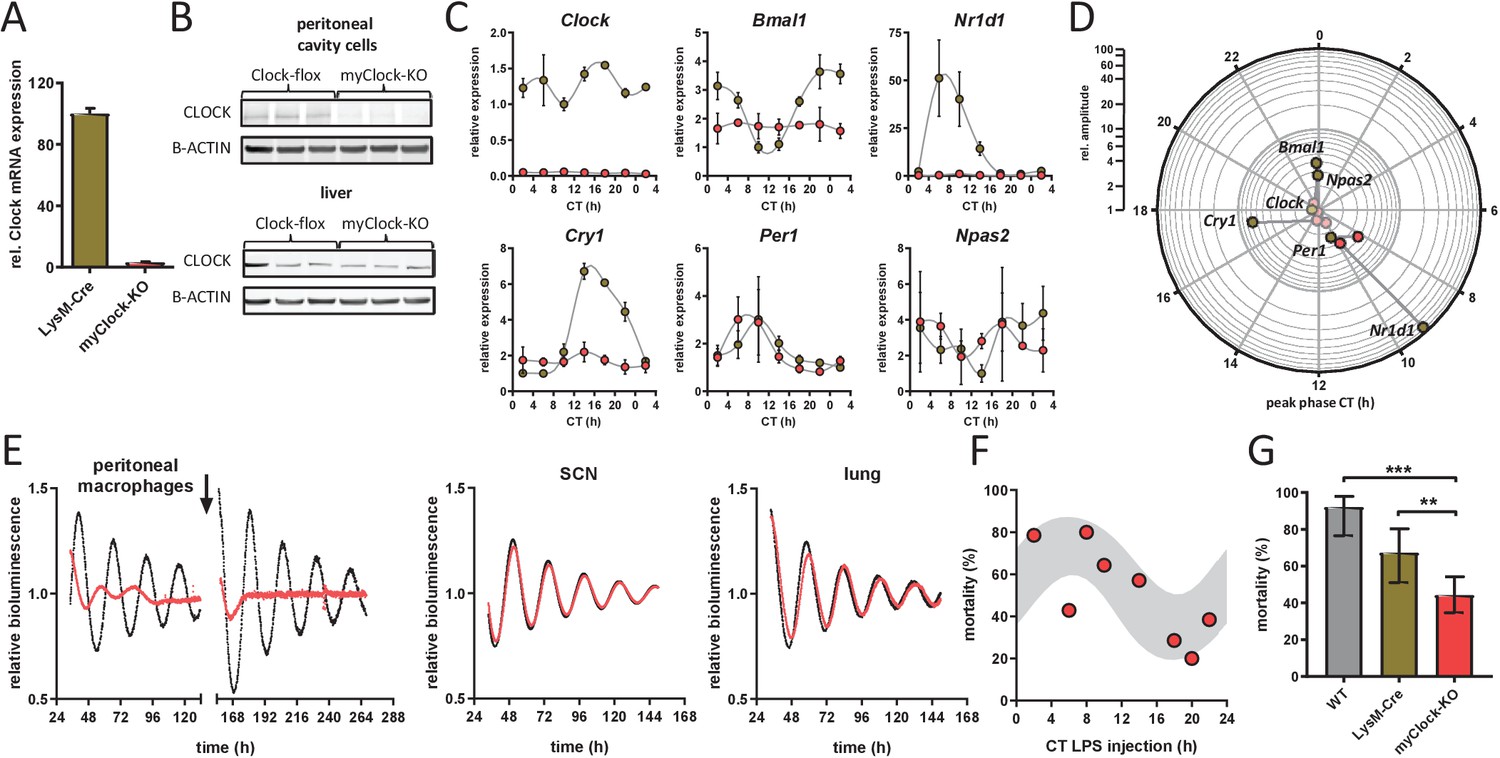
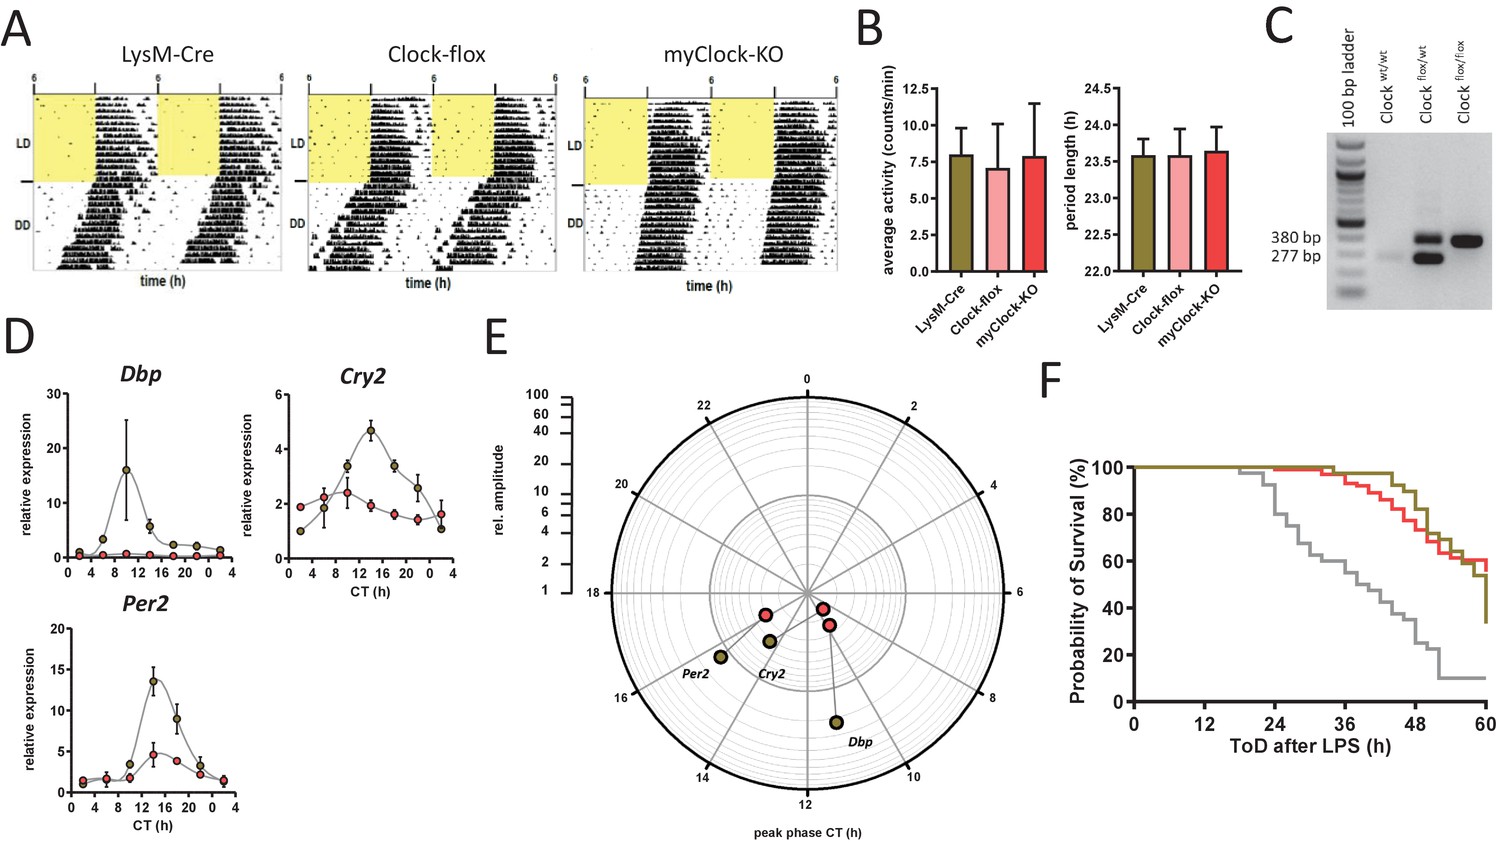
Conditional myClock-KO mice show circadian pattern in mortality by endotoxic shock.
(A) and (B) Reduced levels of Clock mRNA and protein in myeloid lineage cells of myClock-KO mice. (A) Mean values of normalized mRNA expression values of time-series shown in (C) (n=21 mice per condition, p<0.0001, t-test). (B) Protein levels by immunoblot in peritoneal cavity cells and liver of myClock-KO and Clockflox/flox control mice (n=3). (C) Relative mRNA levels of selected clock genes in peritoneal macrophages from LysM-Cre (brown circles) or myClock-KO (red circles) mice, both kept in DD, at indicated circadian times. Phase and amplitude information are depicted in (D) as analyzed by Chronolyse. Non-significant circadian expression (p>0.05) are depicted in light red (myClock-KO) or light brown (LysM-Cre control). (E) Representative bioluminescence recordings of peritoneal macrophages, SCN or lung tissue from myClock-KO or wild-type mice crossed with PER2:Luc reporter mice (color coding as before). Black arrow indicates time of re-synchronization by dexamethasone treatment (detrended data). (F) Circadian pattern in endotoxic shock mortality despite deficiency of CLOCK in myeloid lineage cells. Mice (DD, n=10–14 per time point) were challenged with half-lethal doses of LPS (30 mg/kg, i.p.) at indicated time points. Mortality was assessed 60 hr after LPS injection. Statistic were performed as in Figure 1C (p=0.005, gray shaded area indicates 95% confidence interval). (G) Reduced mean mortality (at 30 mg/kg LPS) in mice deficient of myeloid CLOCK (n=103) compared to control strains LysM-Cre (n=39) or C57Bl/6 (wild-type, n=40). First two bars where re-plotted from Figure 2C. Error bars represent 95% confidence intervals (* p=0.0192, *** p = 0.0001).
-
Figure 3—source data 1
Raw imaging data files from western blots.
- https://cdn.elifesciences.org/articles/62469/elife-62469-fig3-data1-v2.zip
Figure 3—figure supplement 1
Phenotypic and molecular characterization of myClock-KO mice.
Phenotypic and molecular characterization of myClock-KO mice. (A) Locomotor activity recordings from control (LysM-Cre and Clock-flox) and myClock-KO mice. Representative examples are shown and quantified (n=7–13) in (B) for circadian periods as well as overall activity. (C) Prototypical genotyping results for Clockflox mice. (D) Relative mRNA levels of selected clock genes (complementing data of Figure 3C) in peritoneal macrophages from LysM-Cre (brown circles) or myClock-KO (red circles) mice at indicated circadian times. Phase and amplitude information are depicted in (E) as analyzed by Chronolyse. Non-significant circadian expressions (p>0.05) are indicated by light shaded circles for both myClock-KO and LysM-Cre control. (F) Kaplan-Meier survival curve of mice kept in DD and challenged with LPS (30 mg/kg, i.p.). Gray line refers to C57Bl/6 mice (wild-type control), brown line to LysM-Cre control and red line to myClock-KO mice. Data have been aligned to time after challenge with LPS, irrespective of time of day of challenge (data are from experiments shown in Figure 1C and Figure 3F,G, respectively). Survival curves of wild-type and myClock-KO differ significantly (p<0.0001, log-rank test).
Figure 4 with 1 supplement
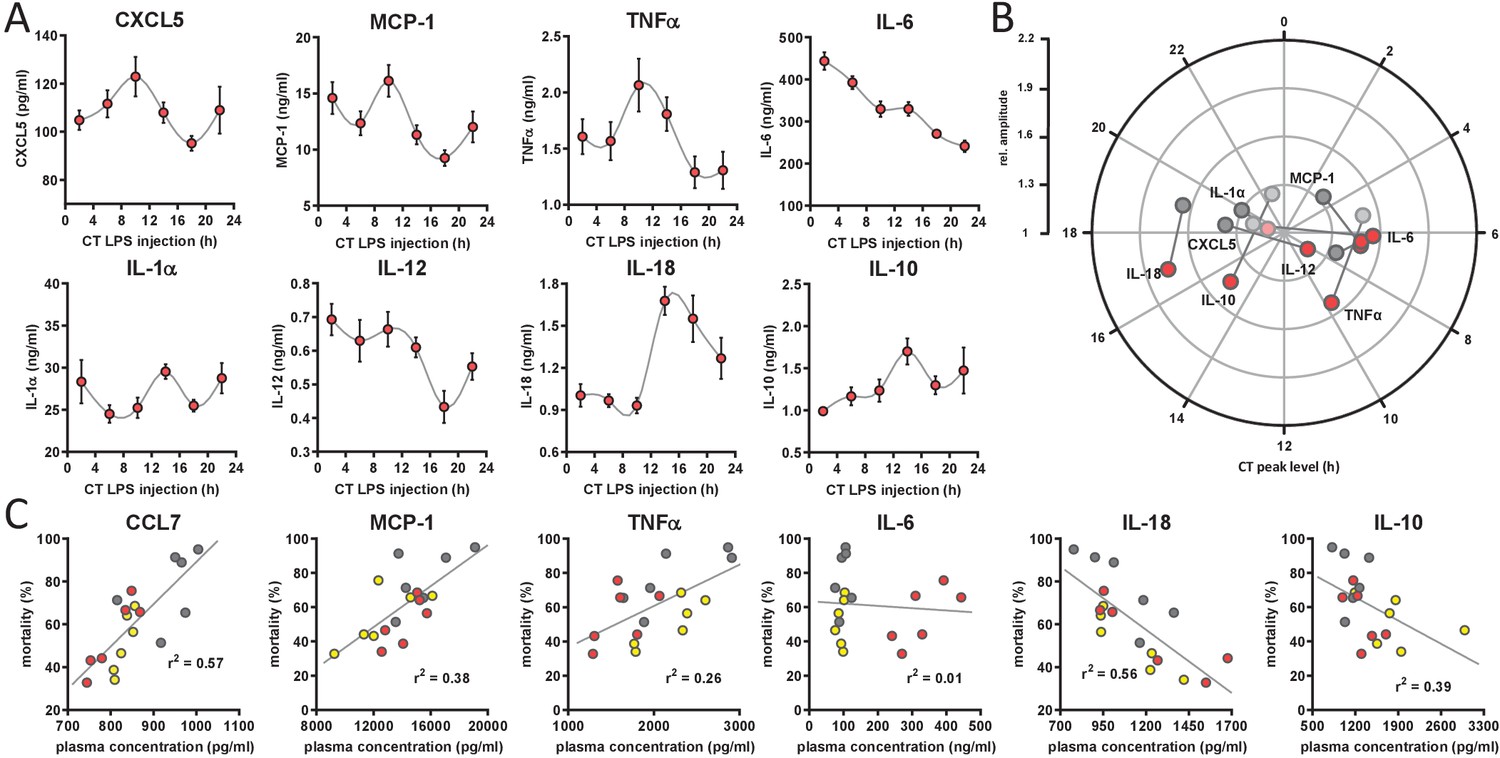
Circadian time-dependent cytokine levels in plasma of myClock-KO mice.
(A) Plasma cytokine levels in myClock-KO mice kept in constant darkness, 2 hr after i.p. injection of 30 mg/kg LPS. Data represent mean values ± SEM (n=14 per time point). (B) Polar plot showing amplitude and phase distribution of pro- and anti-inflammatory cytokines from A, red circles and wild-type DD (Figure 1E). Light circles indicate non-significant circadian abundance (p-values>0.05, non-linear least square fit statistics by Chronolyse). (C) Overall correlation of cytokine levels with mortality independent of time-of-day of LPS injection and mouse model. Colors indicate data source (wild-type, LD - yellow; wild-type, DD - gray; myClock-KO, DD - red; linear regression - gray line; statistics: spearman correlation).
Figure 4—figure supplement 1
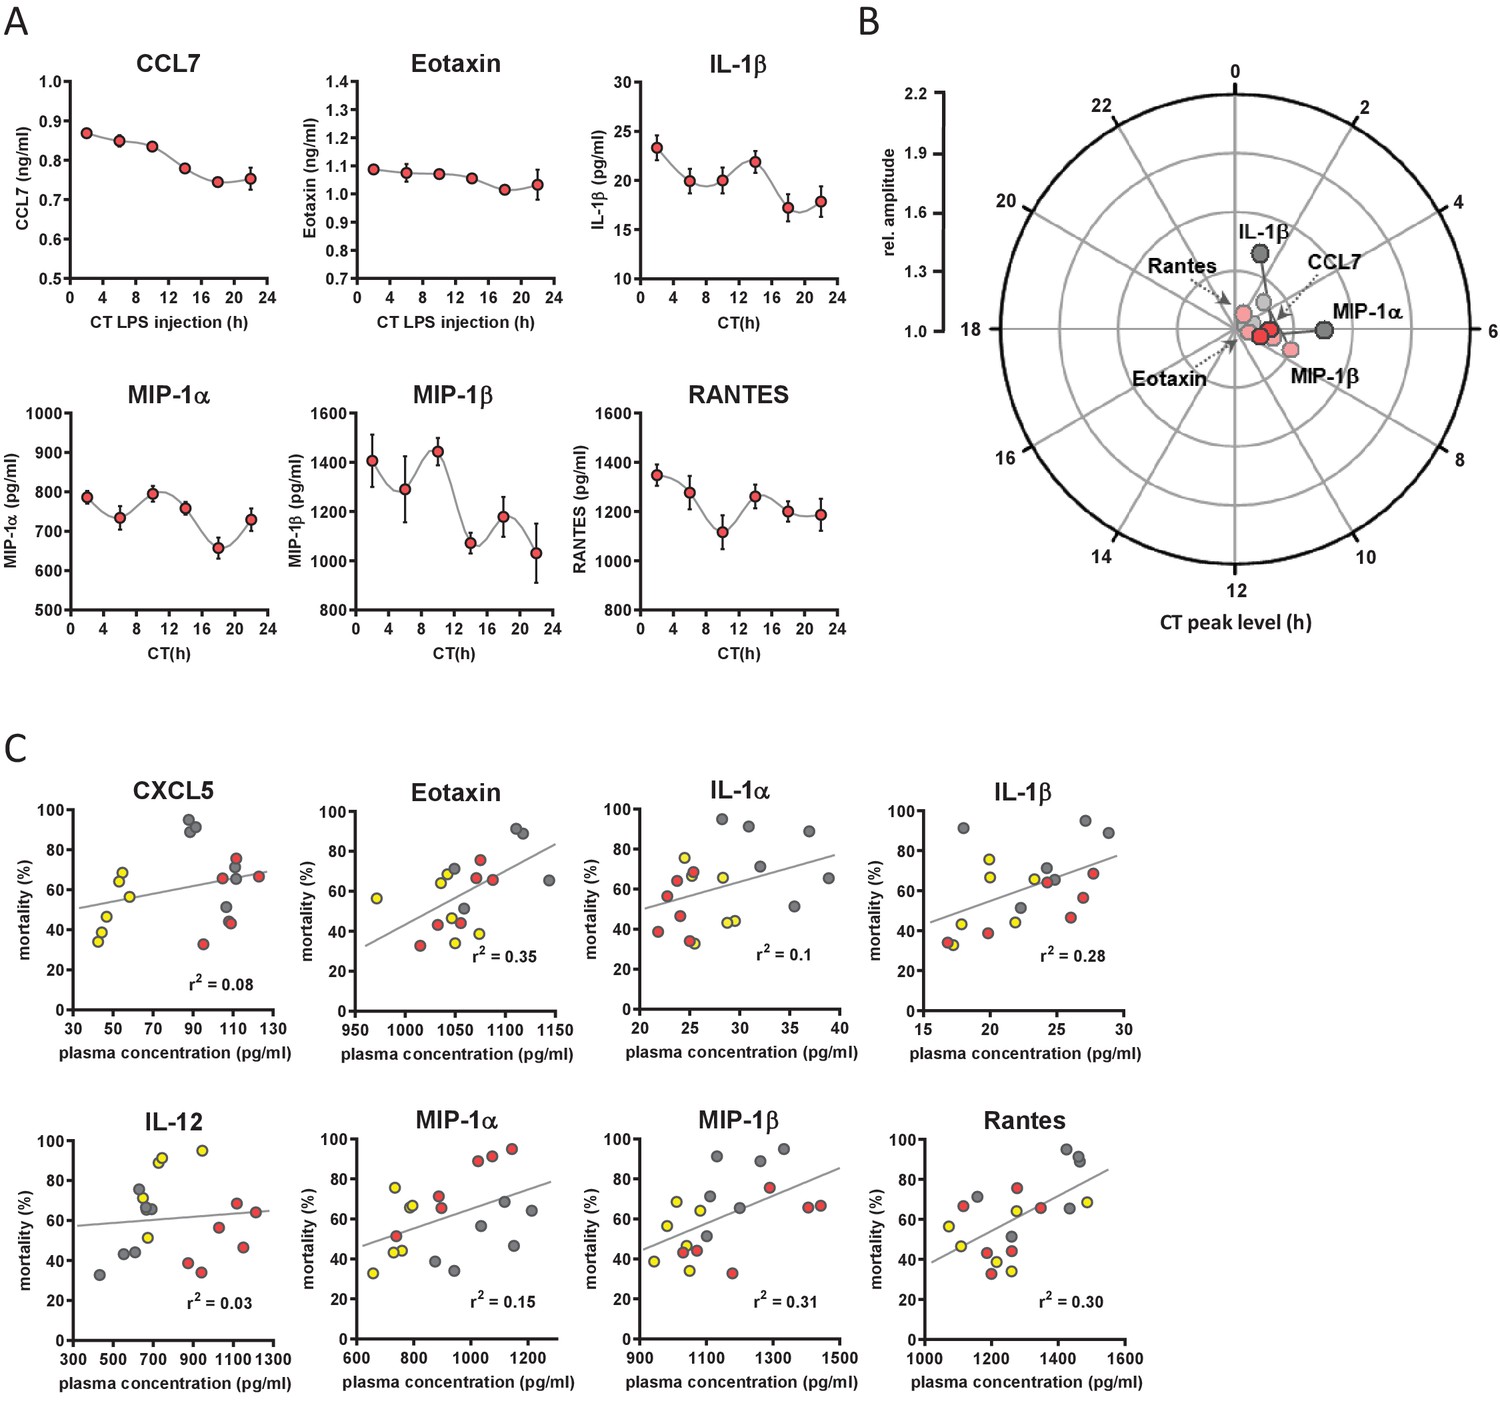
Circadian time-dependent cytokine levels in plasma of myClock-KO mice.
Circadian time dependent cytokine levels in plasma of myClock-KO mice complementing data in Figure 4. (A) Plasma cytokine levels in myClock-KO mice kept in constant darkness, 2 hr after i.p. injection of 30 mg/kg LPS. Data represent mean ± SEM (n=14 per time point). (B) Polar plot showing amplitude and phase distribution of cytokines from A, red circles, myClock-KO and wild-type DD, gray circles (Figure 1E). Light circles indicate non-significant circadian abundance (p-values>0.05, non-linear least square fit statistics by Chronolyse). (C) Overall correlation of cytokine levels with mortality independent of time-of-day of LPS injection and mouse model. Colors indicate data source (wild-type, LD - yellow; wild-type, DD - gray; myClock-KO, DD - red; linear regression - gray line; statistics: spearman correlation).
Figure 5 with 10 supplements
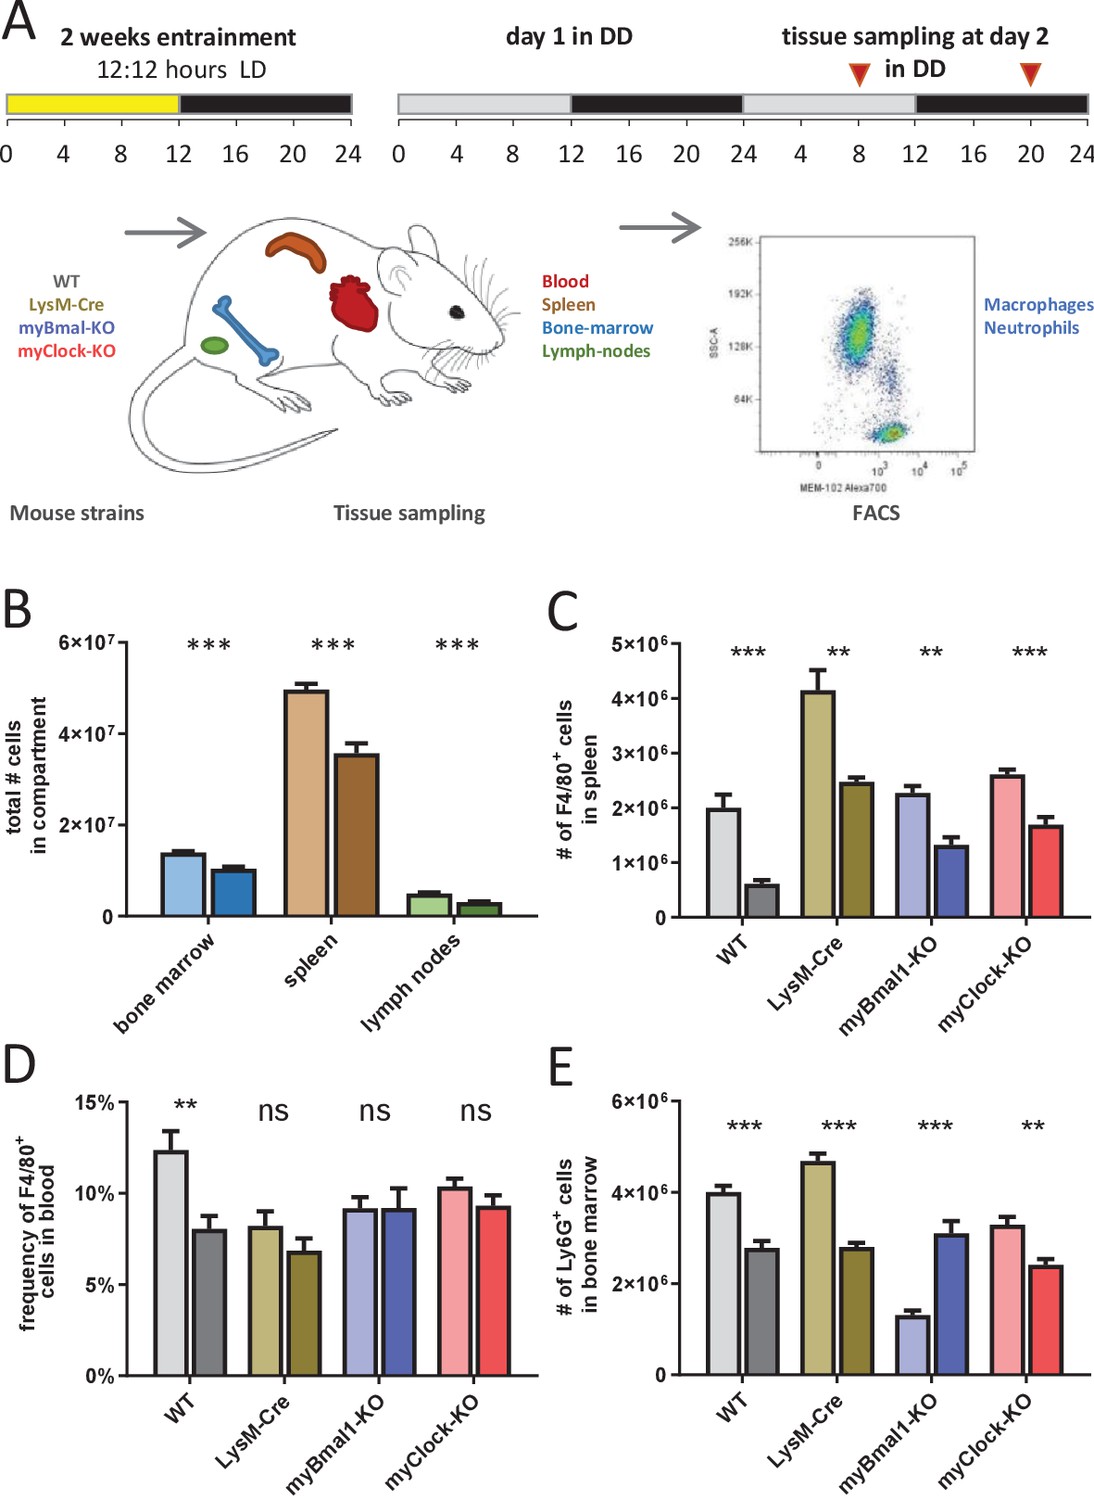
Time-of-day-dependent traffic of myeloid cells despite depletion of myeloid CLOCK or BMAL1.
(A) Experimental scheme to investigate time-of-day-dependent immune cell traffic in various compartments and genetic mouse models. (B) Total cell counts of femoral bone marrow (blue), spleen (brown), or inguinal lymph nodes (green) at CT8 (light colors) or CT20 (dark colors). (C–E) Cell number or frequency from wild-type and various conditional circadian clock knockout mice kept in DD at two different circadian time points (wild-type - gray, LysM-Cre - brown, myBmal-KO - blue, myClock-KO - red, CT8 - light, CT20 - dark). (C) Total number of F4/80+ macrophages in spleen. (D) Relative number of F4/80+ macrophages in blood. Asterisks indicate level of significance as determined by t-test. (E) Total number of Ly6G+ neutrophils in bone marrow (significance levels: ns p>0.05, * p<0.05, ** p<0.01, *** p<0.001).
Figure 5—figure supplement 1
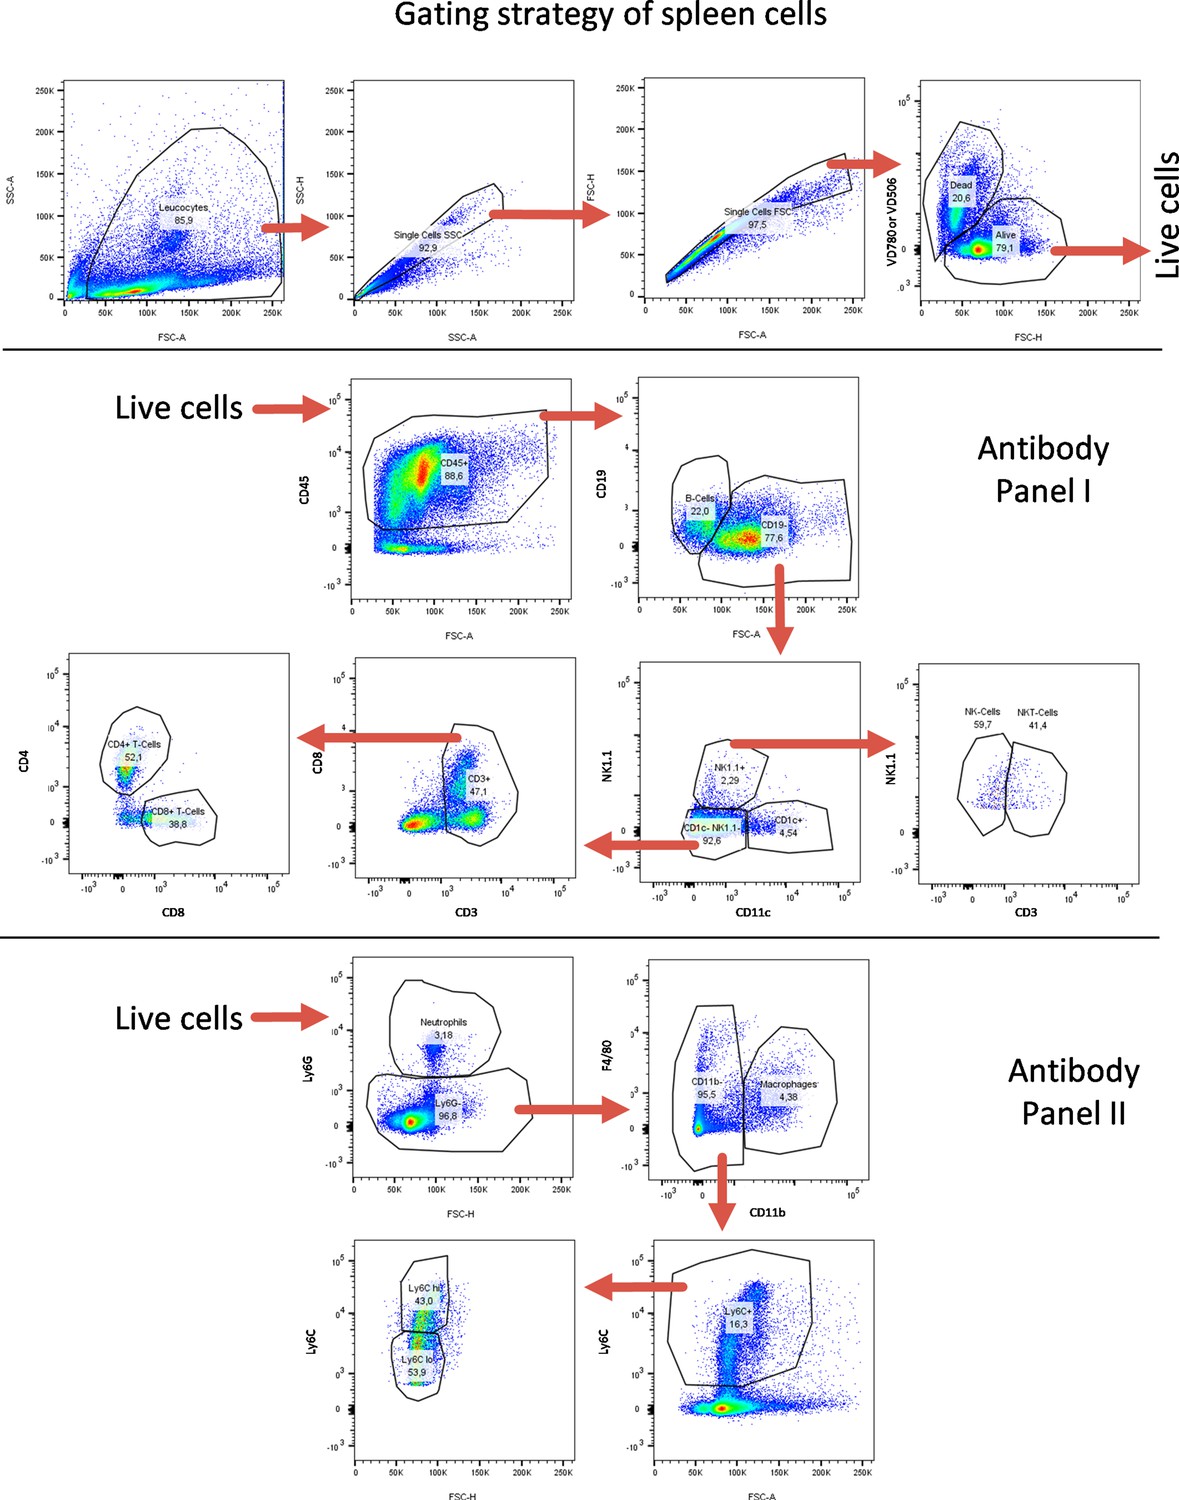
FACS gating strategy for spleen-derived cells.
FACS gating strategy for identification of lymphoid and myeloid immune cell subtypes from spleen. Quantifications are shown in Figure 5 as well as in Figure 5—figure supplements 7–10.
Figure 5—figure supplement 2
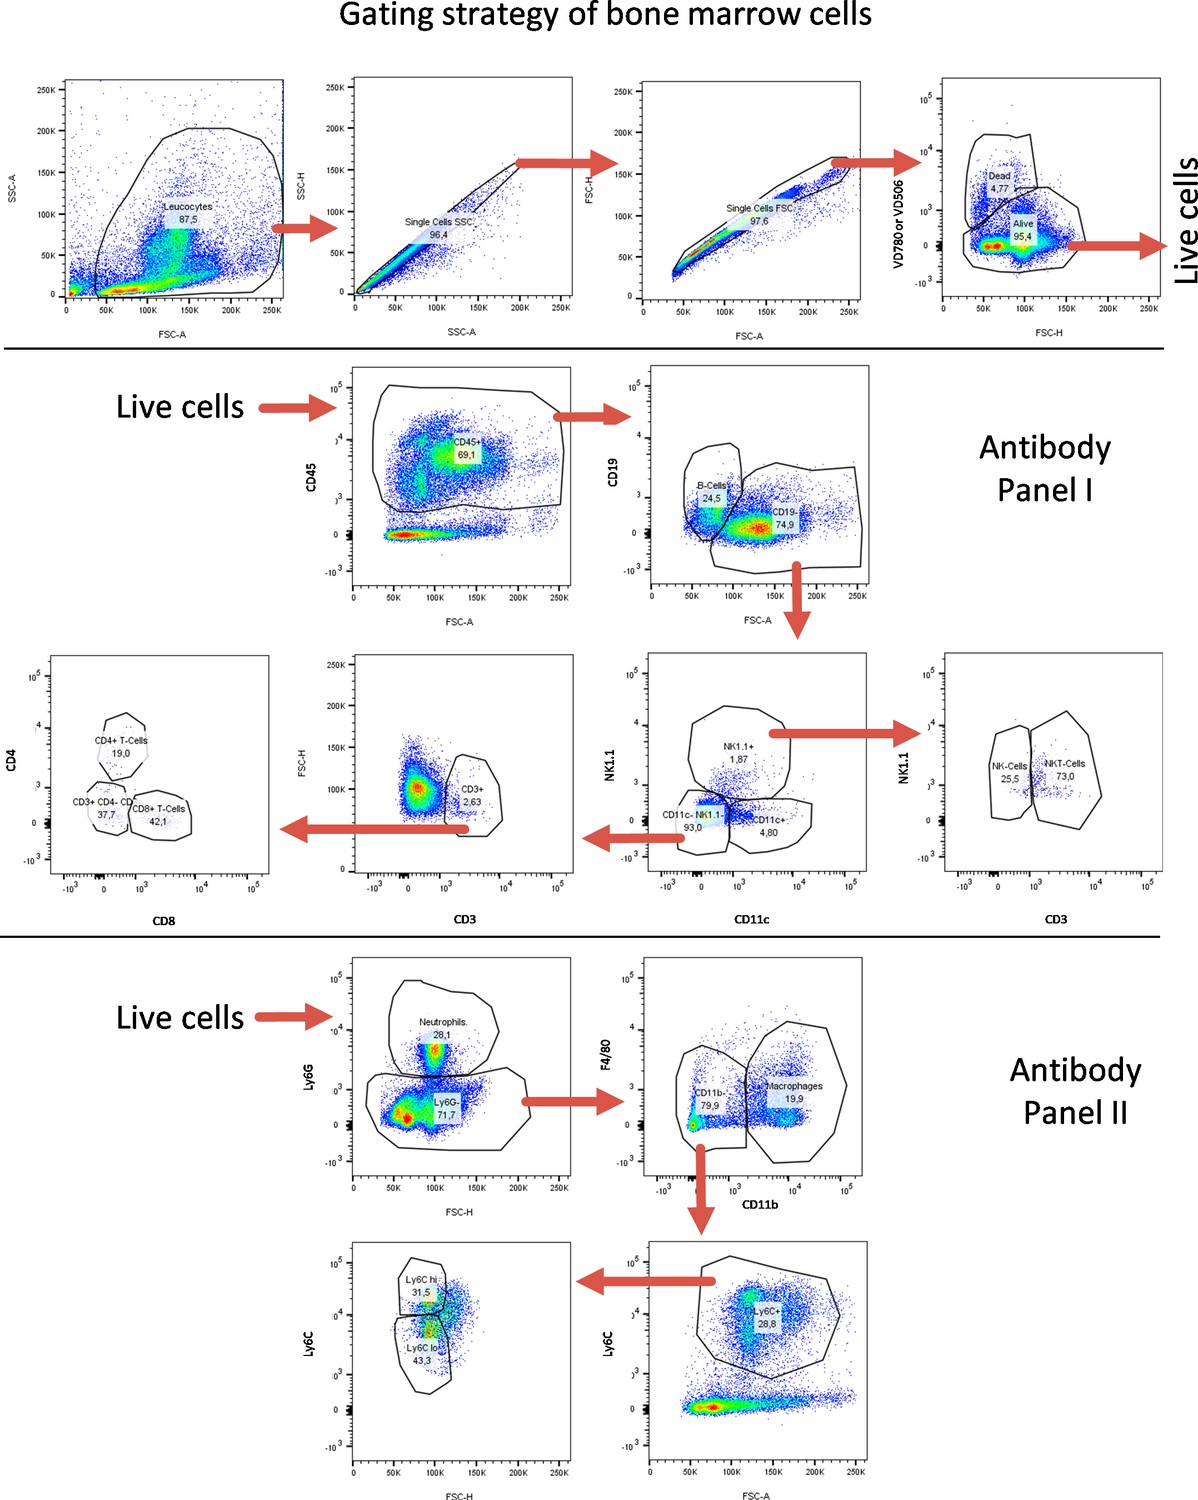
FACS gating strategy for bone-marrow-derived cells.
FACS gating strategy for identification of lymphoid and myeloid immune cell subtypes from bone marrow. Quantifications are shown in Figure 5 as well as in Figure 5—figure supplements 7–10.
Figure 5—figure supplement 3
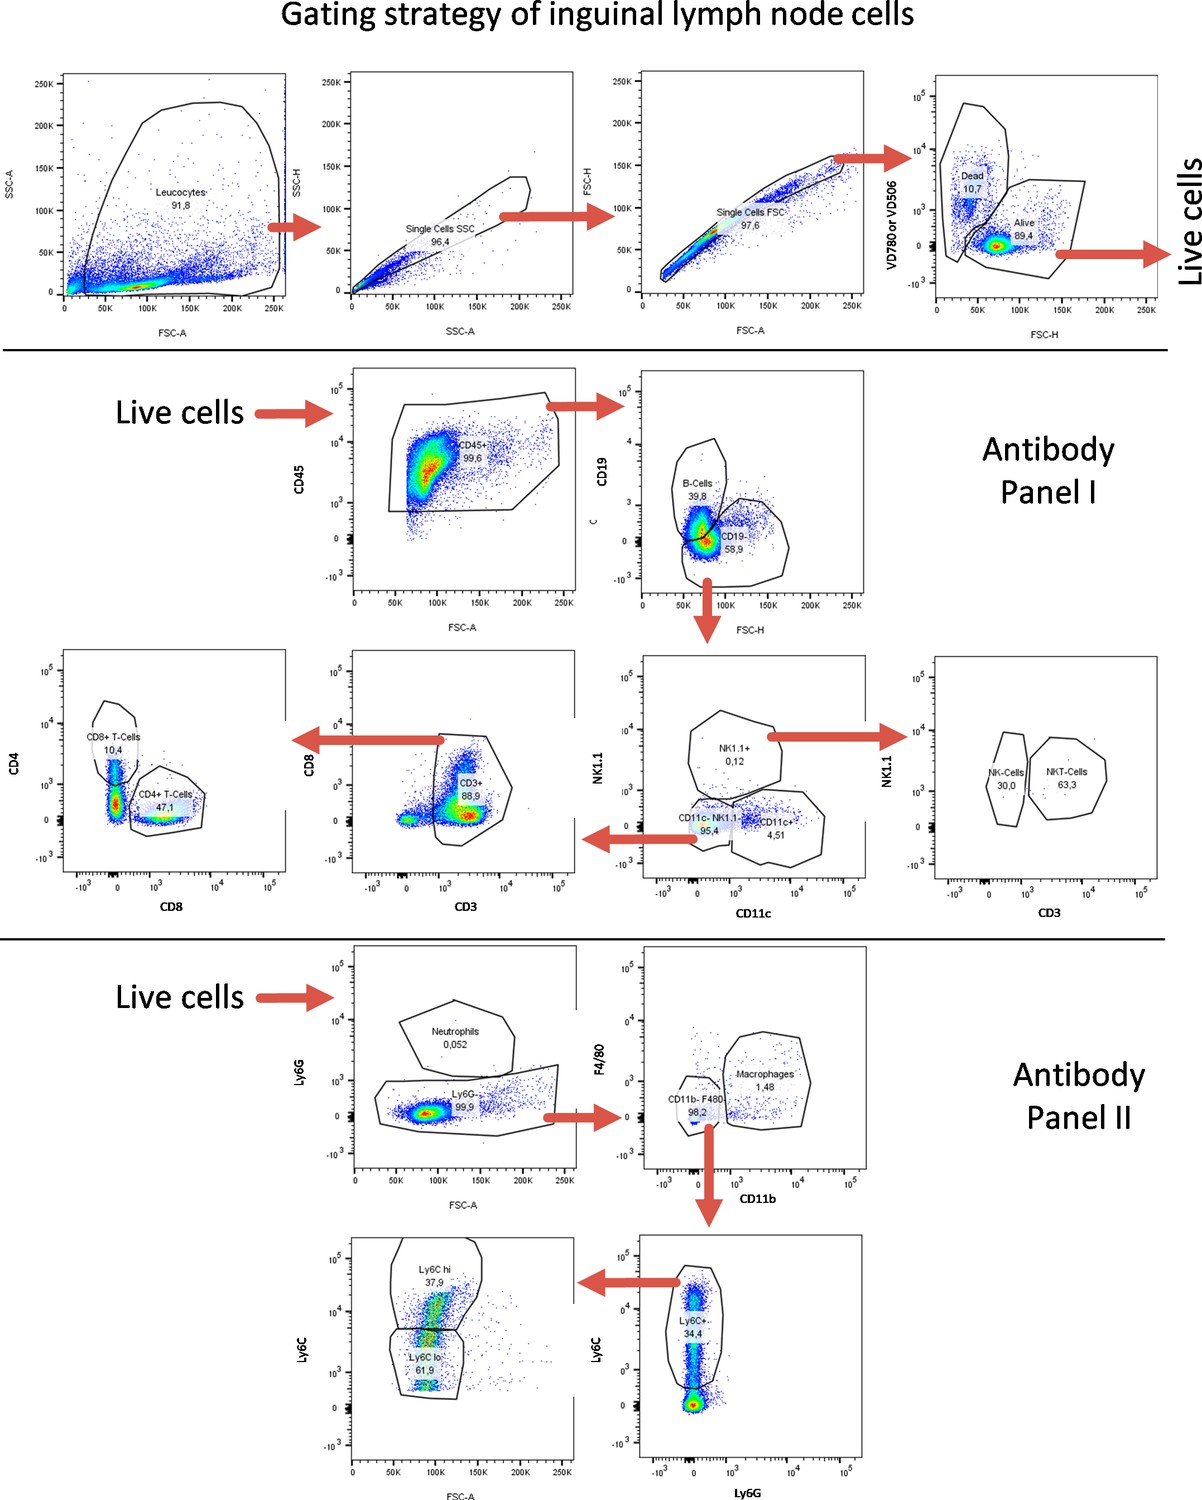
FACS gating strategy for lymph-node-derived cells.
FACS gating strategy for identification of lymphoid and myeloid immune cell subtypes from inguinal lymph nodes. Quantifications are shown in Figure 5 as well as in Figure 5—figure supplements 7–10.
Figure 5—figure supplement 4
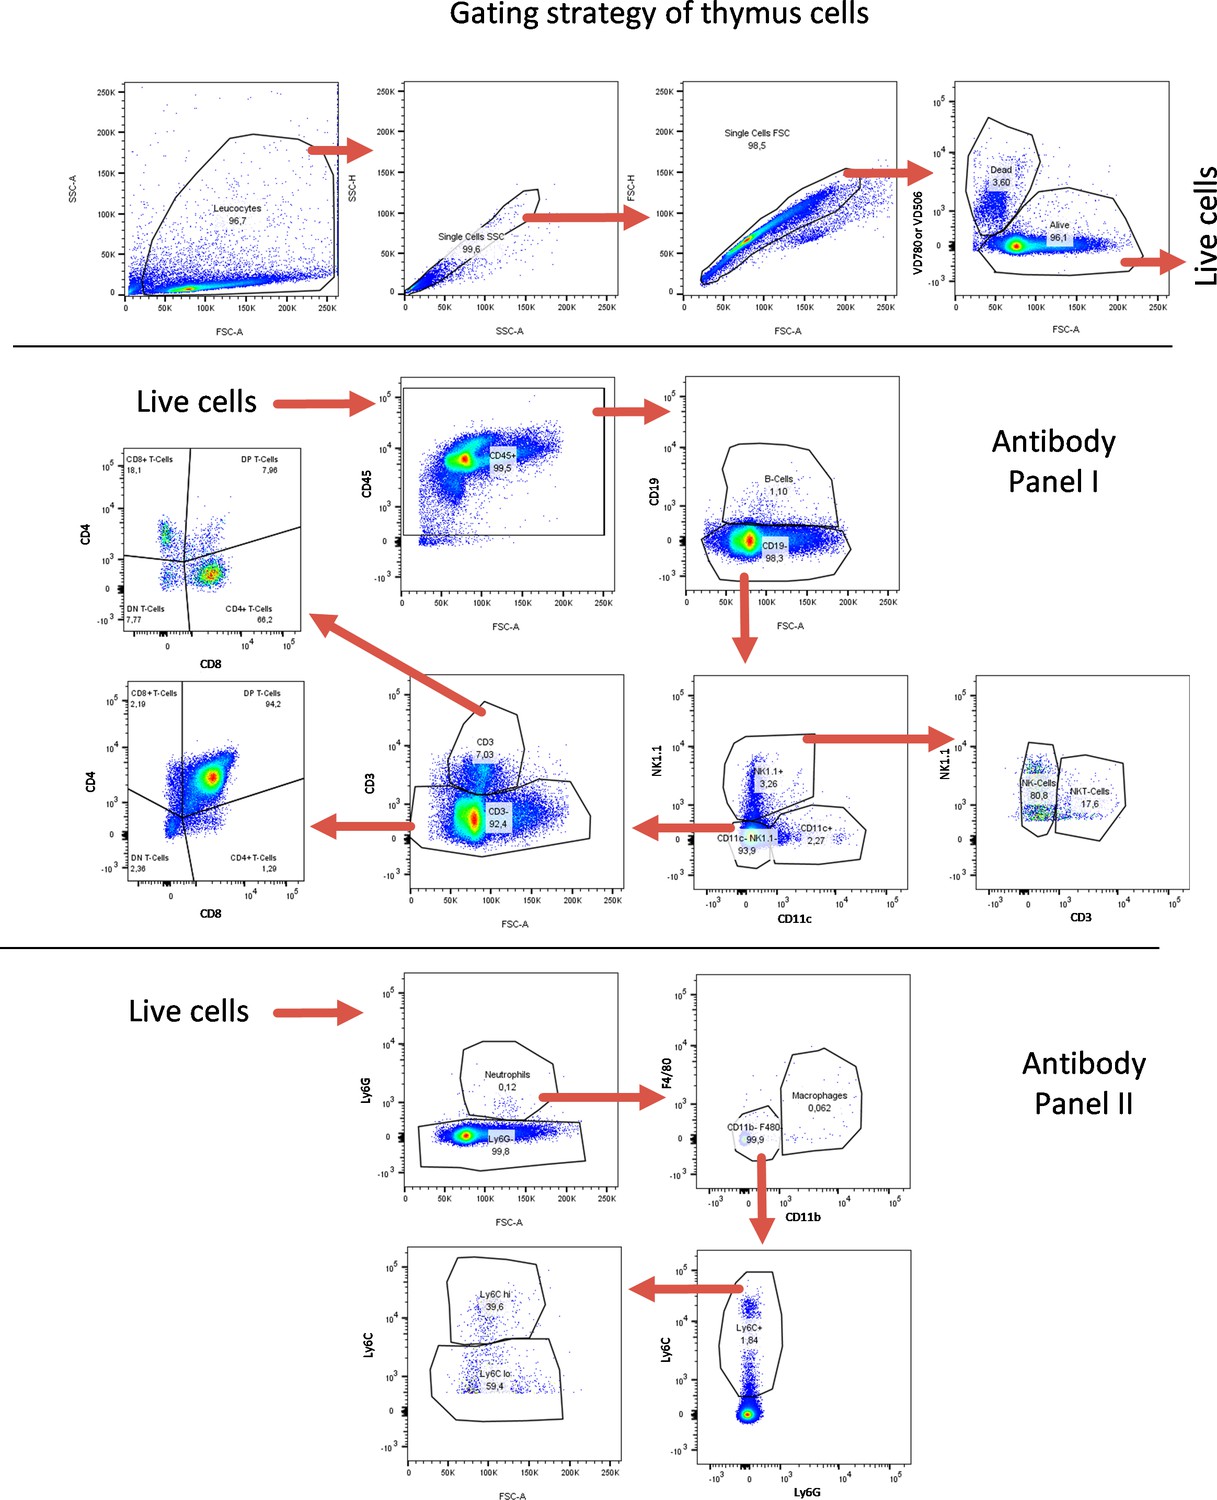
FACS gating strategy for thymus-derived cells.
FACS gating strategy for identification of lymphoid and myeloid immune cell subtypes from thymus. Quantifications are shown in Figure 5 as well as in Figure 5—figure supplements 7–10.
Figure 5—figure supplement 5
FACS gating strategy for blood-derived cells.
FACS gating strategy for identification of lymphoid and myeloid immune cell subtypes from blood. Quantifications are shown in Figure 5 as well as in Figure 5—figure supplements 7–10.
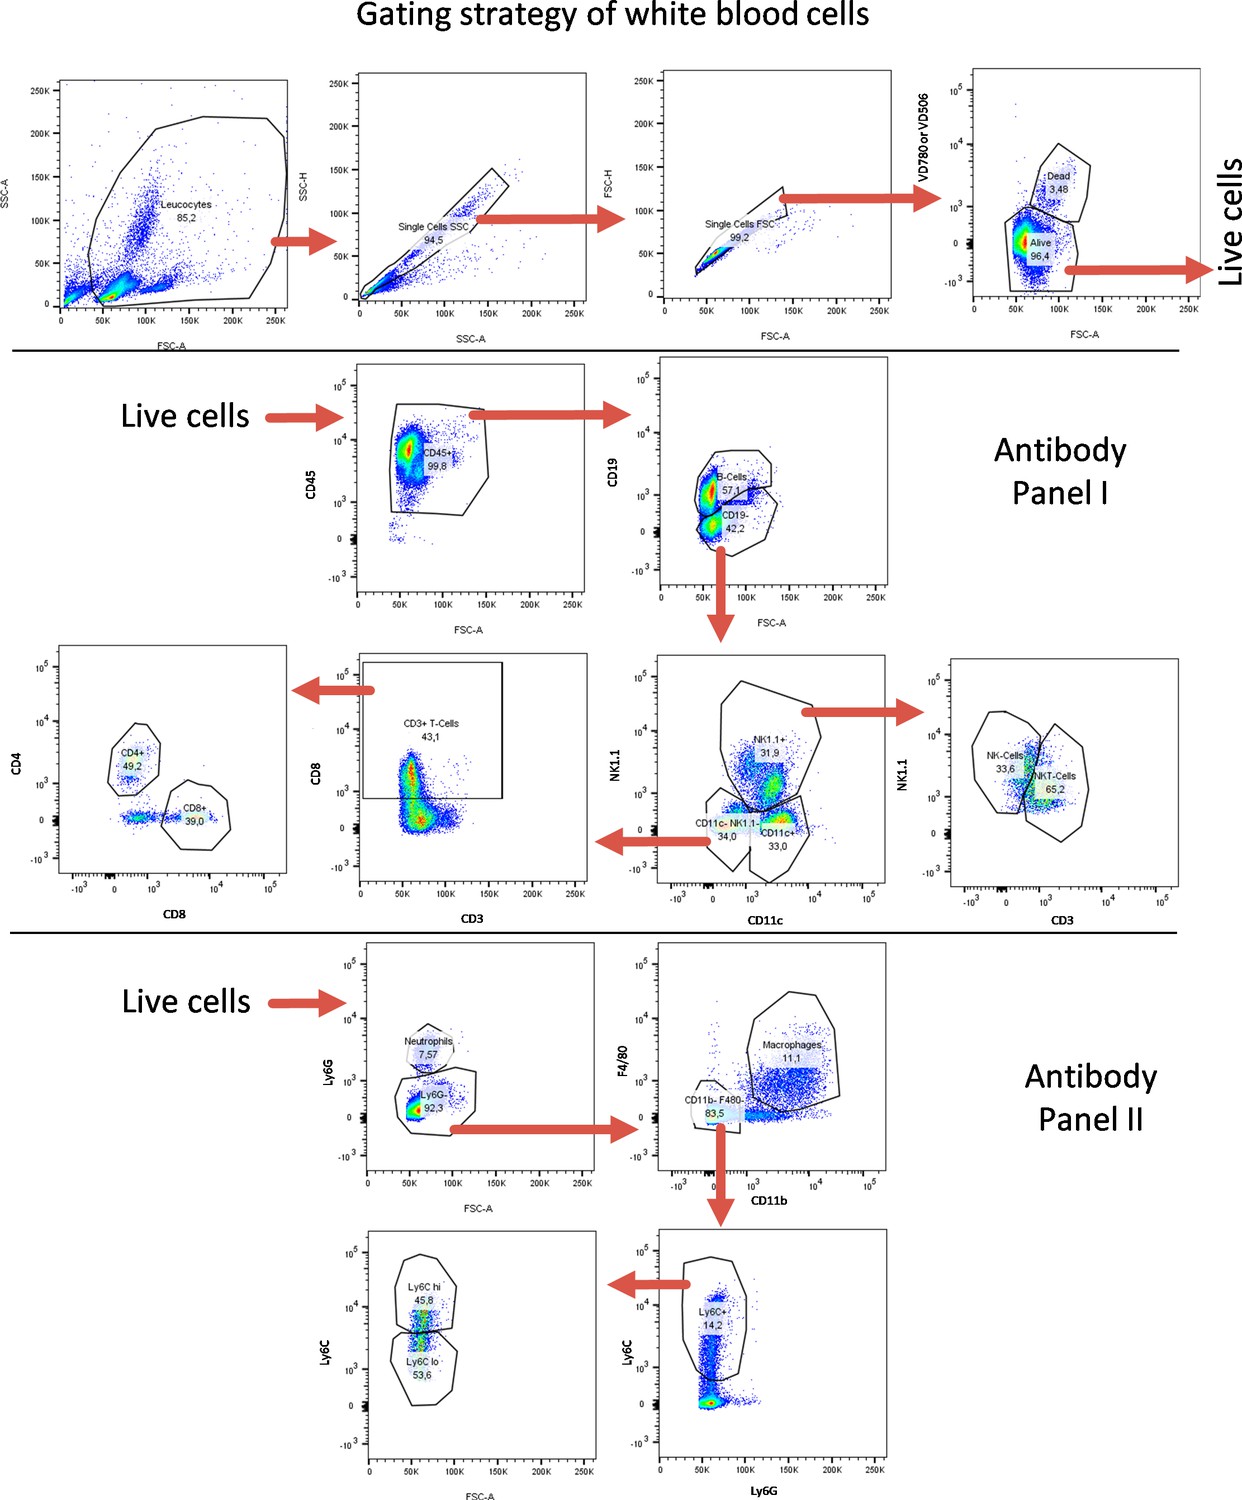
Figure 5—figure supplement 6
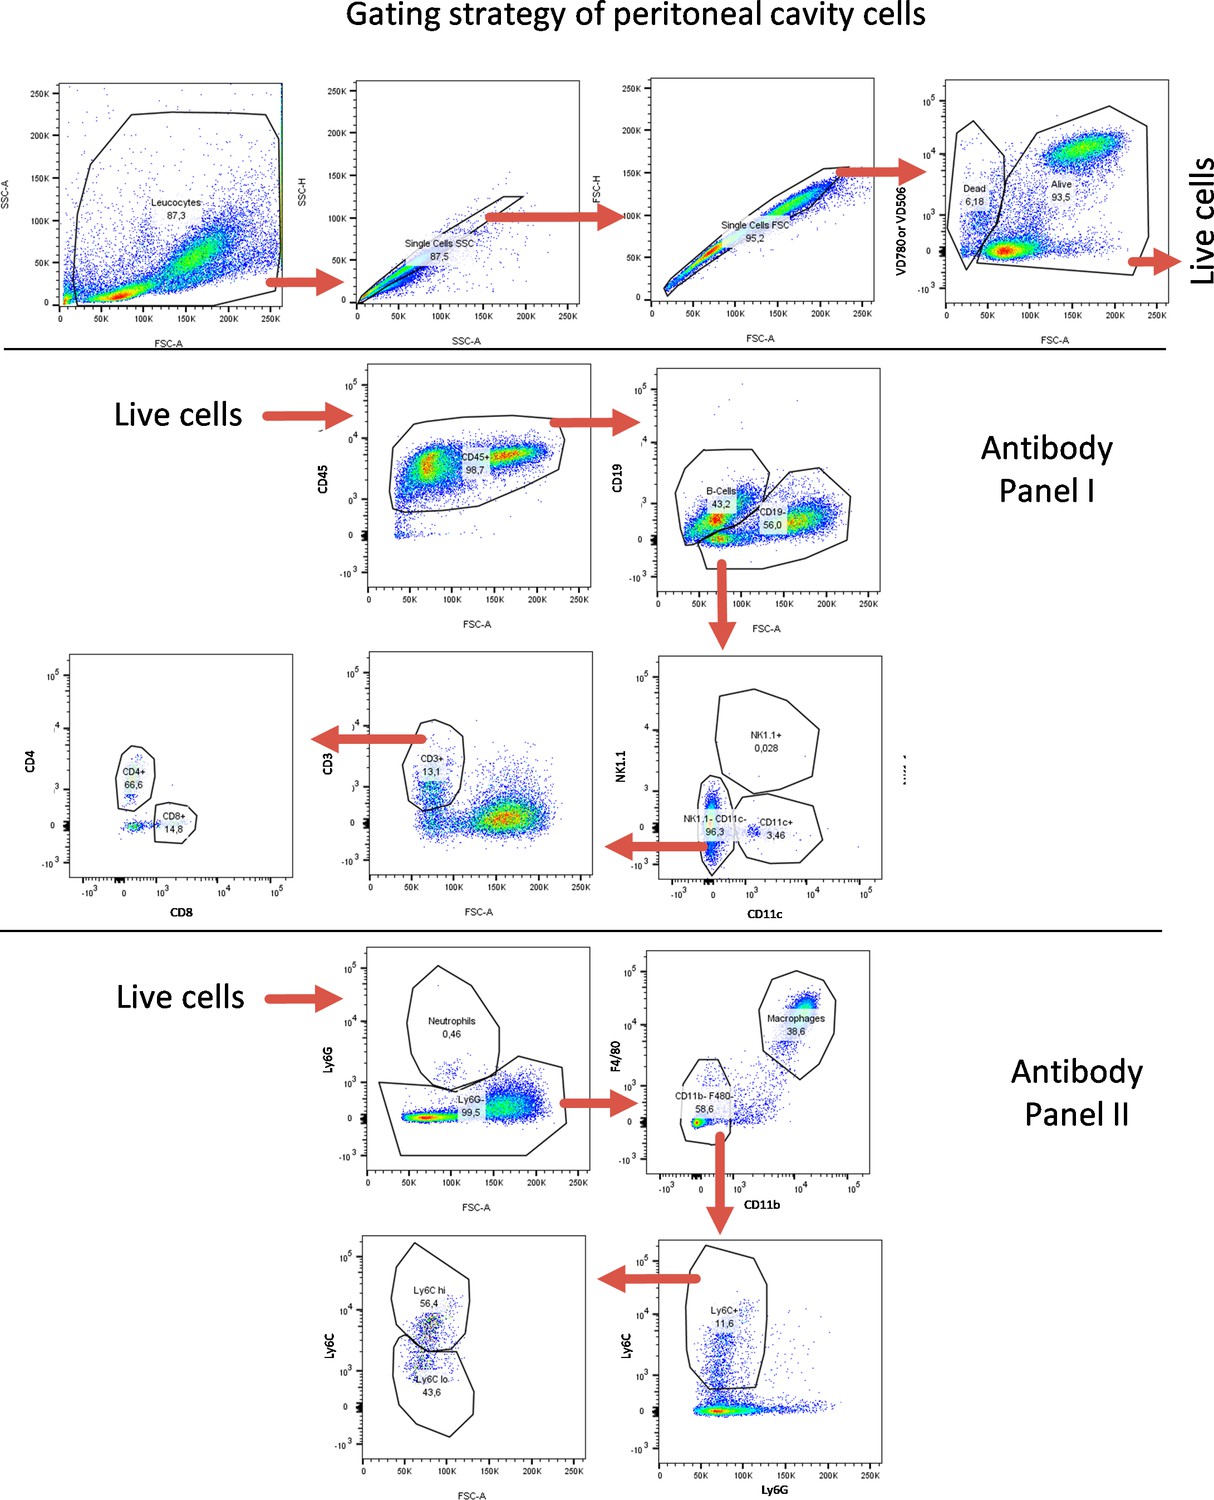
FACS gating strategy for peritoneal-cavity-derived cells.
FACS gating strategy for identification of lymphoid and myeloid immune cell subtypes from peritoneal cavity. Quantifications are shown in Figure 5 as well as in Figure 5—figure supplements 7–10.
Figure 5—figure supplement 7
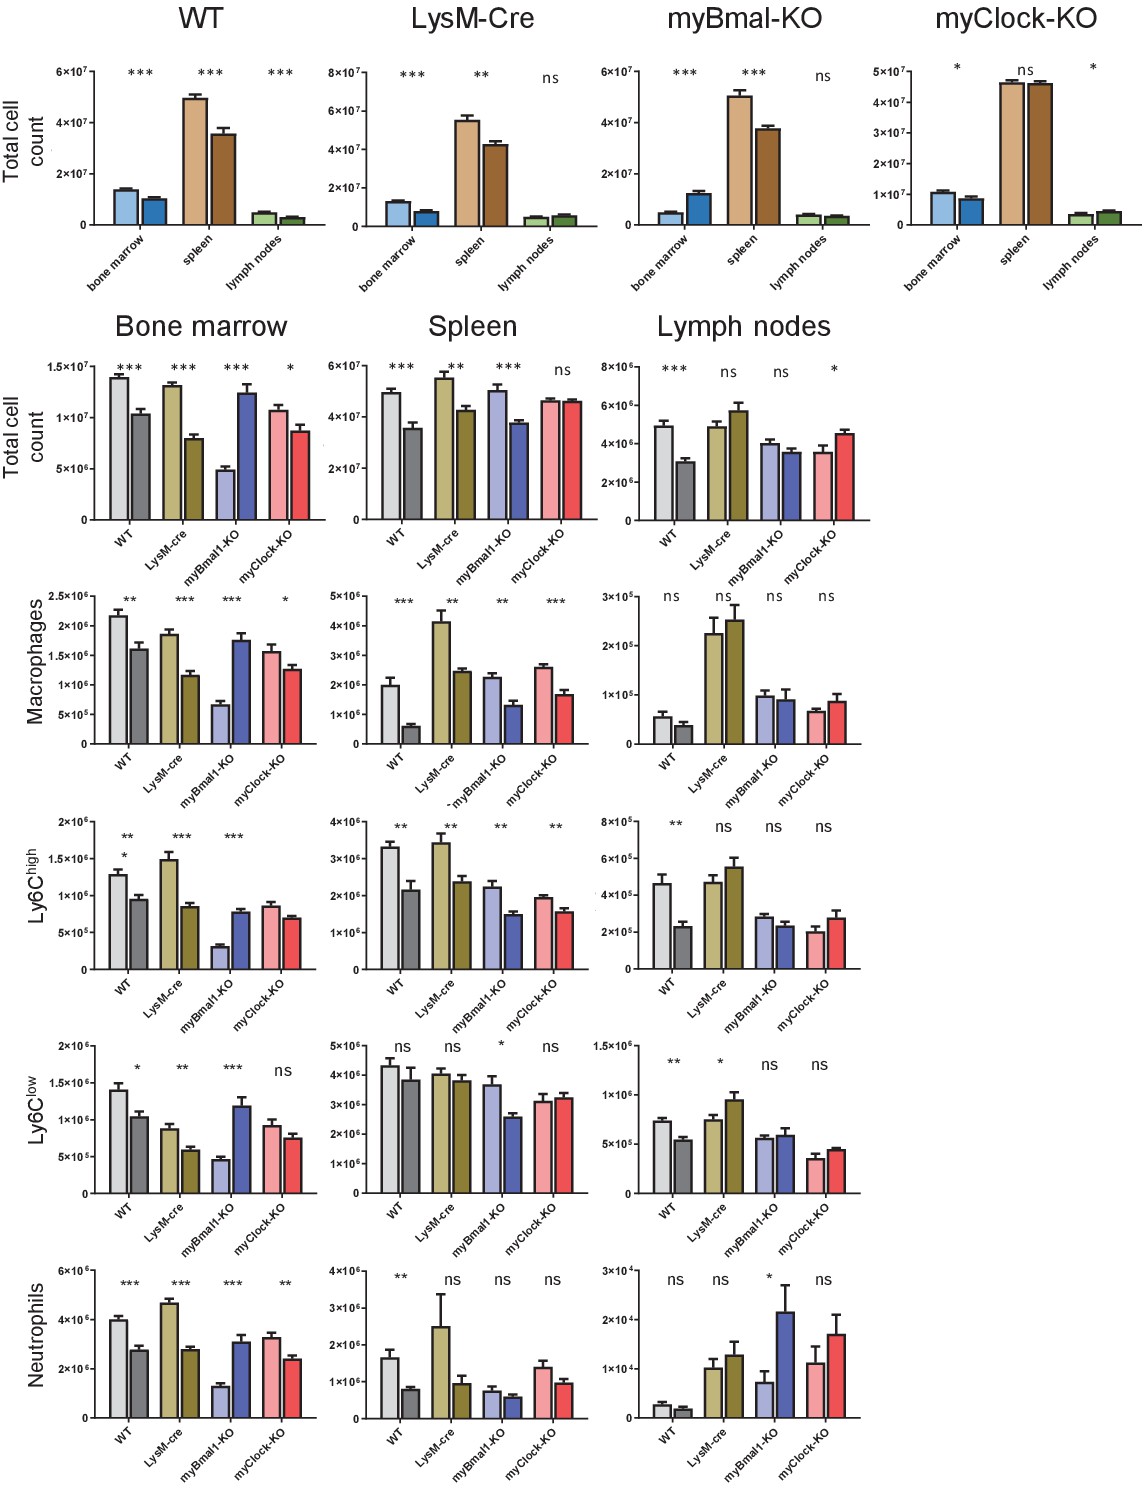
Cell numbers of myeloid panel from bone marrow, spleen, and lymph nodes.
Absolut cell numbers of leukocytes as quantified from myeloid panel FACS staining for bone marrow, spleen, and lymph nodes derived cells.
Figure 5—figure supplement 8
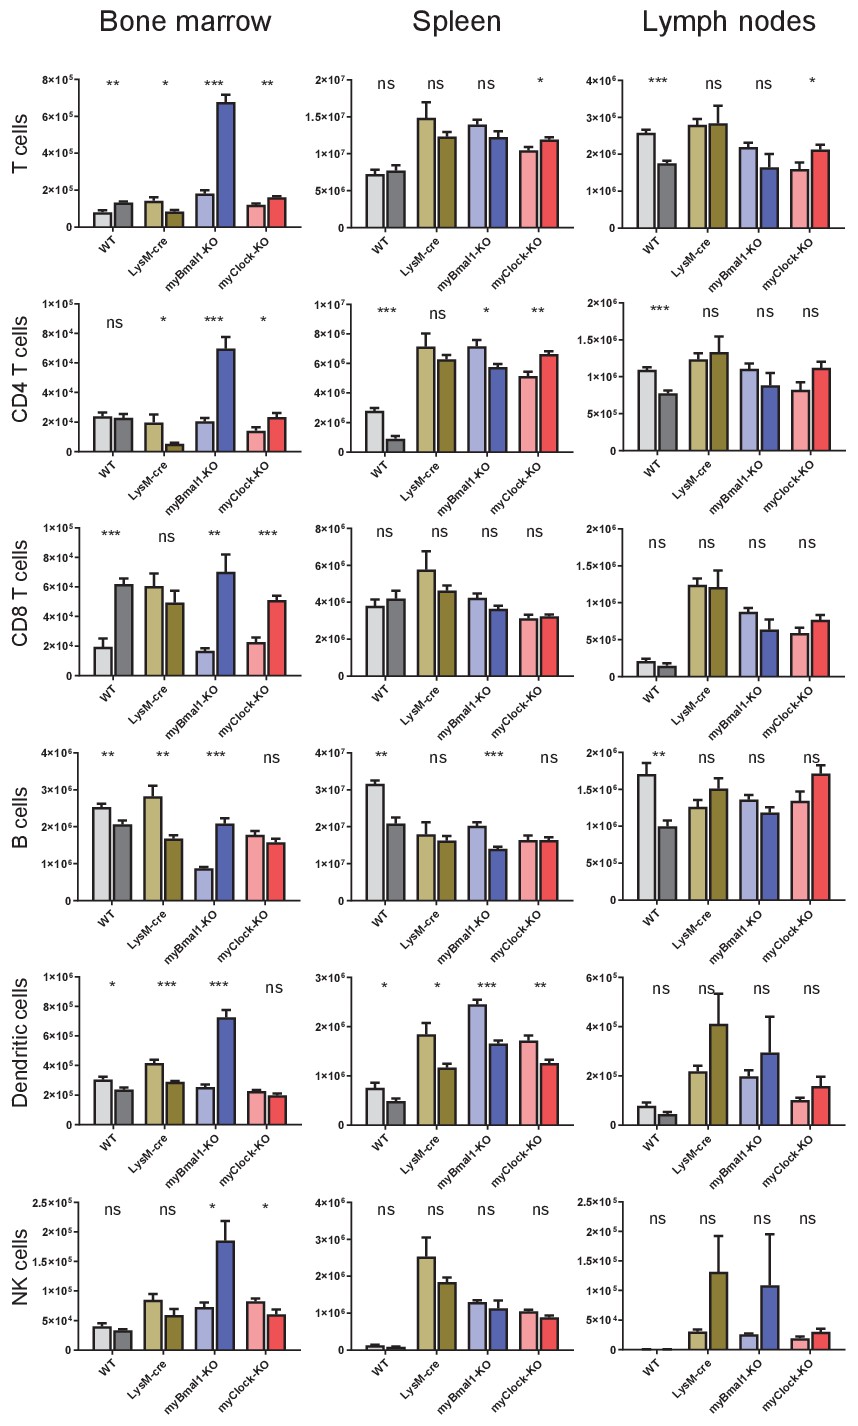
Cell numbers of lymphoid panel from bone marrow, spleen, and lymph nodes.
Absolut cell numbers of leukocytes as quantified from lymphoid panel FACS staining for bone marrow, spleen, and lymph nodes derived cells.
Figure 5—figure supplement 9
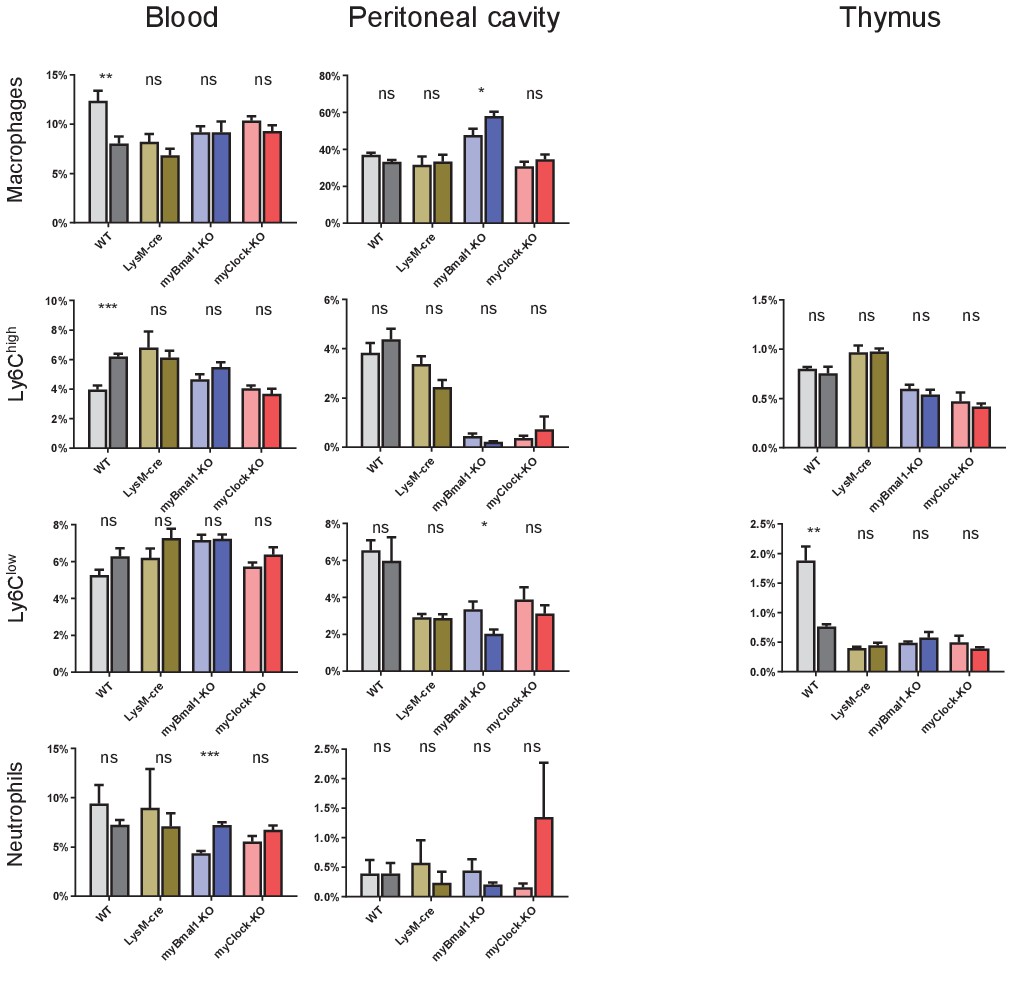
Cell frequencies of myeloid panel from blood, peritoneal cavity, and thymus.
Cell frequencies of leukocytes as quantified from myeloid panel FACS staining for blood, peritoneal cavity, and thymus derived cells.
Figure 5—figure supplement 10
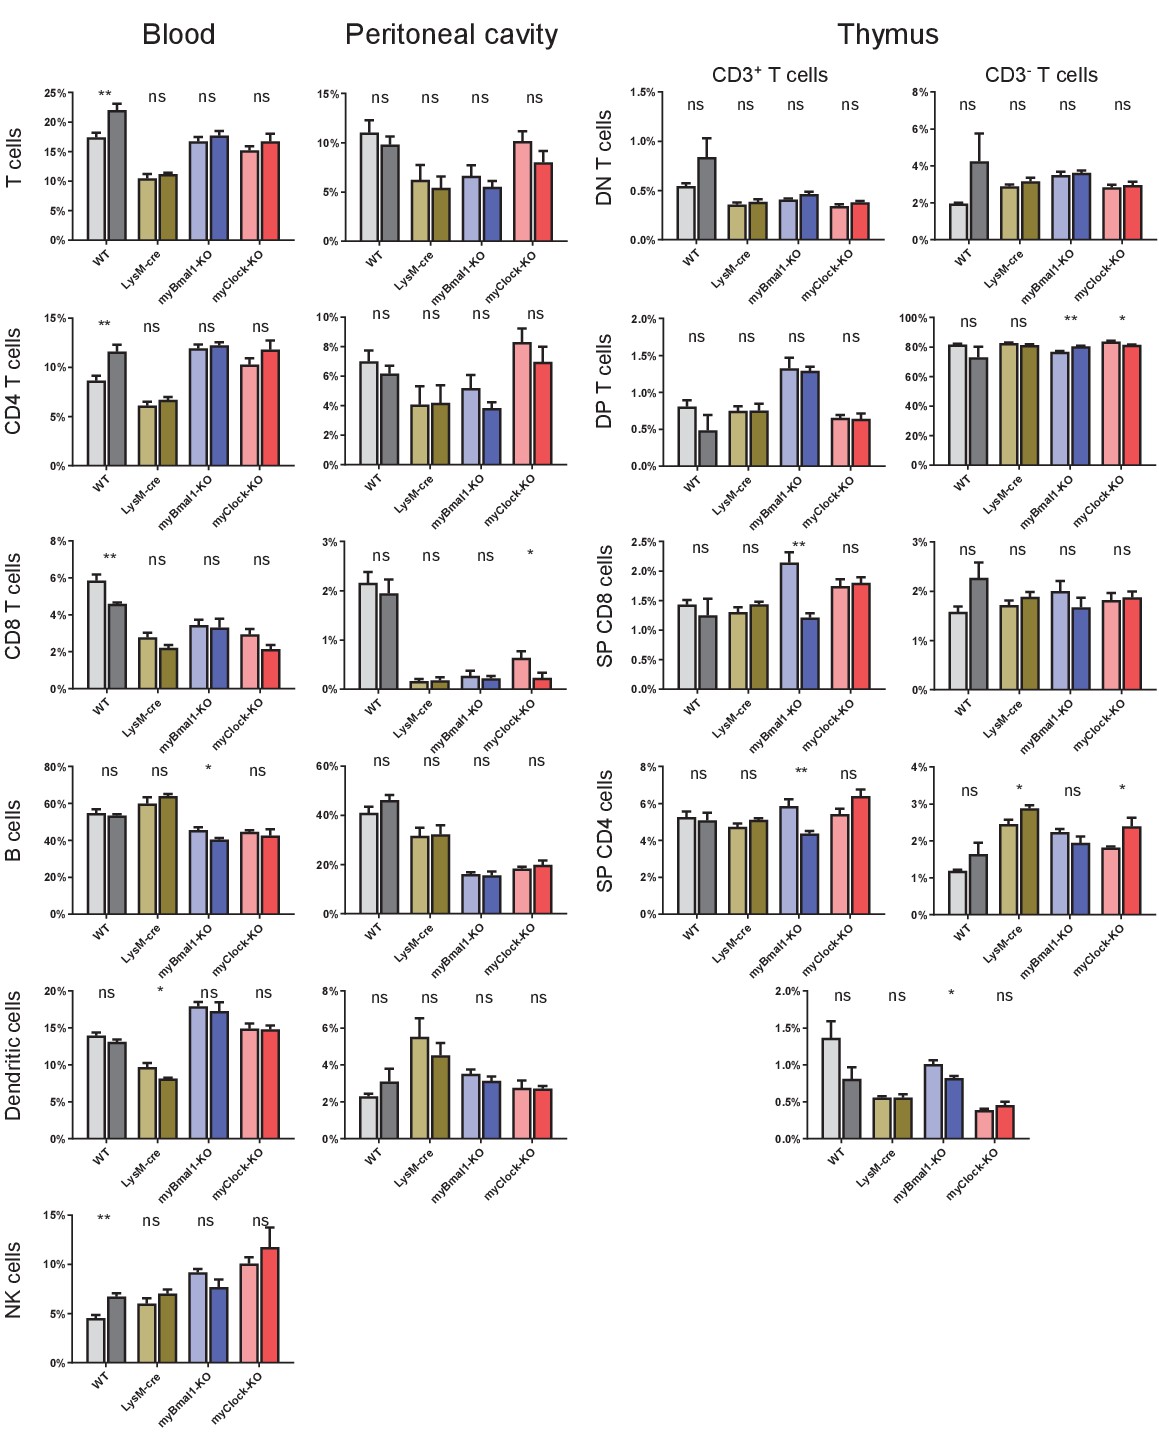
Cell frequencies of lymphoid panel from blood, peritoneal cavity, and thymus.
Cell frequencies of leukocytes as quantified from lymphoid panel FACS staining for blood, peritoneal cavity, and thymus derived cells.
Author response image 1
Tables
Key resources table
| Reagent type (species) or resource | Designation | Source or reference | Identifiers | Additional information |
|---|---|---|---|---|
| Strain, strain background (Mus musculus) | C57Bl/6J | The Jackson Laboratory | MGI:3028467 RRID:MGI:3028467 | |
| Strain, strain background (Mus musculus) | B6.129P2-Lyz2tm1(cre)Ifo/JC57Bl/6J | Clausen et al., 1999 | MGI:1934631 RRID:IMSR_JAX:004781 | |
| Strain, strain background (Mus musculus) | B6.129S4(Cg)-Arntltm1Weit/J, C57Bl/6J | Storch et al., 2007 | MGI: J:124157 | |
| Strain, strain background (Mus musculus) | B6.129S4-Clocktm1Rep/J, C57Bl/6J | Debruyne et al., 2006 | MGI: J:109634 | |
| Strain, strain background (Mus musculus) | B6.129S6-Per2tm1Jt/J, C57Bl/6J | Yoo et al., 2004 | MGI: J:89256 | |
| biological sample (Escherichia coli O55:B5) | LPS | Sigma-Aldrich | L2880 | LOTs 102M4017V, 032M4082V, 063M4041V |
| Antibody | CD11b Microbeads (rat monoclonal) | Miltenyi | Cat# 130-049-601 | MACS (1:5) |
| Antibody | α-mCD3 APC-Cy7 (rat monoclonal) | Biolegend | Cat# 100221 RRID:AB_2057374 | FACS (1:200) |
| Antibody | α-mCD4 FITC (rat monoclonal) | Biolegend | Cat# 100405 RRID:AB_312690 | FACS (1:500) |
| Antibody | α-mCD8 PE-Cy7 (rat monoclonal) | Biolegend | Cat# 100721 RRID:AB_312760 | FACS (1:200) |
| Antibody | α-mCD11b PE-Cy7 (rat monoclonal) | Ebioscience | Cat# 25-0112 RRID:AB_469587 | FACS (1:200) |
| Antibody | α-mCD11c APC (armenian hamster monoclonal) | Biolegend | Cat# 117309 RRID:AB_313778 | FACS (1:200) |
| Antibody | α-mCD14 PE (rat monoclonal) | Biolegend | Cat# 123309 RRID:AB_940582 | FACS (1:500) |
| Antibody | α-mCD19 Pacific Blue (rat monoclonal) | Biolegend | Cat# 115526 RRID:AB_493341 | FACS (1:200) |
| Antibody | α-mCD45 PerCP-Cy5.5 (rat monoclonal) | Biolegend | Cat# 103131 RRID:AB_893344 | FACS (1:200) |
| Antibody | α-mLy6C Brilliant Violet 421 (rat monoclonal) | Biolegend | Cat# 128033 RRID:AB_2562351 | FACS (1:200) |
| Antibody | α-mLy6G FITC (rat monoclonal) | BD | Cat# 561105 RRID:AB_394207 | FACS (1:1000) |
| Antibody | α-mF4/80 APC (rat monoclonal) | Biolegend | Cat# 123115 RRID:AB_893493 | FACS (1:100) |
| Antibody | α-mNK1.1 PE (mouse monoclonal) | Biolegend | Cat# 108707 RRID:AB_313394 | FACS (1:500) |
| Antibody | VD eFluor 506 | eBioscience | Cat# 65-0866-14 | FACS (1:500) |
| Antibody | VD eFluor 780 | eBioscience | Cat# 65-0865-14 | FACS (1:1000) |
| Antibody | Rb α-mBmal1 (rabbit polyclonal) | kind gift from Michael Brunner | WB (1:500) | |
| Antibody | Rb α-mClock (rabbit polyclonal) | Bethyl Laboratories | Cat# A302-618A RRID:AB_10555233 | WB (1:1000) |
| Antibody | Mm α-mβ-Actin (mouse monoclonal) | Sigma-Aldrich | Cat# A-5441 RRID:AB_476744 | WB (1:100000) |
| Antibody | Gt α-mIgG-HRP (goat polyclonal) | SantaCruz Biotechnology | Cat# sc-2005 RRID:AB_631736 | WB (1:1000) |
| Antibody | DK α-rbIgG-HRP (donkey polyclonal) | SantaCruz Biotechnology | Cat# sc-2305 RRID:AB_641180 | WB (1:1000) |
| Commercial assay or kit | Mouse IL-6 ELISA Ready-SET-Go! | Ebioscience | Cat# 88-7064-88 RRID:AB_2574990 | |
| Commercial assay or kit | ProcartaPlex, Mix & Match, mouse 13-plex | Ebioscience | EPX 130-24021-801 | |
| Sequence-based reagent | mCry1 | Qiagen | QT00117012 | |
| Sequence-based reagent | mCry2 | Qiagen | QT00168868 | |
| Sequence-based reagent | mDpb | Qiagen | QT00103089 | |
| Sequence-based reagent | mNr1d1 | Qiagen | QT00164556 | |
| Sequence-based reagent | mNpas2 | Qiagen | QT00108647 | |
| Sequence-based reagent | mPer1 | Qiagen | QT00113337 | |
| Sequence-based reagent | mPer2 | Qiagen | QT00198366 | |
| Sequence-based reagent | mGapdh fw | This paper | qPCR primer | ACGGGAAGCTCACTGGCATGGCCTT |
| Sequence-based reagent | mGapdh rv | This paper | qPCR primer | CATGAGGTCCACCACCCTGTTGCTG |
| Sequence-based reagent | mBmal1 fw | This paper | qPCR primer | GGACACAGACAAAGATGACCC |
| Sequence-based reagent | mBmal1 rv | This paper | qPCR primer | TTTTGTCCCGACGCCTCTTT |
| Sequence-based reagent | mClock fw | This paper | qPCR primer | ATTGGTGGAAGAAGATGACAAGGA |
| Sequence-based reagent | mClock rv | This paper | qPCR primer | TACCAGGAAGCATAGACCCC |
| Sequence-based reagent | Bmal flox com fw | This paper | Genotyping PCR primer | ACTGGAAGTAACTTTATCAAACTG |
| Sequence-based reagent | Bmal flox com rv | This paper | Genotyping PCR primer | CTGACCAACTTGCTAACAATTA |
| Sequence-based reagent | Bmal flox mut fw | This paper | Genotyping PCR primer | CTCCTAACTTGGTTTTTGTCTGT |
| Sequence-based reagent | LysM cre mut rv | This paper | Genotyping PCR primer | CCCAGAAATGCCAGATTACG |
| Sequence-based reagent | LysM cre com fw | This paper | Genotyping PCR primer | CTTGGGCTGCCAGAATTTCTC |
| Sequence-based reagent | LysM cre wt rv | This paper | Genotyping PCR primer | TTACAGTCGGCCAGGCTGAC |
| Sequence-based reagent | Clock flox com fw | This paper | Genotyping PCR primer | CGCTGAGAGCCAAGACAAT |
| Sequence-based reagent | Clock flox com rv | This paper | Genotyping PCR primer | AGCTGGGGTCTATGCTTCCT |
| Sequence-based reagent | Per2 luc com fw | This paper | Genotyping PCR primer | CTGTGTTTACTGCGAGAGT |
| Sequence-based reagent | Per2 luc wt rv | This paper | Genotyping PCR primer | GGGTCCATGTGATTAGAAAC |
| Sequence-based reagent | Per2 luc mut rv | This paper | Genotyping PCR primer | TAAAACCGGGAGGTAGATGAGA |
| Software, algorithm | CFX Manager | BioRad | V2.1 | |
| Software, algorithm | Chronolyse | In house generated software | V2.0 | |
| Software, algorithm | Chronostar | In house generated software | https://www.achim-kramer-lab.de/downloads.html | V3.0 |
| Software, algorithm | FlowJo | FlowJo | V10 | |
| Software, algorithm | GraphPad Prism | GraphPad | V9 | |
| Software, algorithm | photoNgraph | In house generated software | V2.0 | |
| Software, algorithm | ClockLab Analysis | Actimetrix |
Table 1
Scoring system to determine human endpoint in endotoxic shock experiments.
| Score | Behavior, Phenotype |
|---|---|
| 0 | Normal, no behavioral abnormalities |
| 1 | Slightly decreased speed of course of movement |
| 2 | Slightly lethargic |
| 3 | 'Slow motion’ movements, ruffled fur, hunched posture |
| 4 | Lethargic, movements are not specific to cue, strong bar-grip-reflex |
| 5 | Completely lethargy, body position is not self-determined, decreased bar-grip-reflex |
Additional files
-
Source data 1
Folder containing all article related GraphPad figure files.
- https://cdn.elifesciences.org/articles/62469/elife-62469-data1-v2.zip
-
Transparent reporting form
- https://cdn.elifesciences.org/articles/62469/elife-62469-transrepform-v2.docx
Download links
A two-part list of links to download the article, or parts of the article, in various formats.
Downloads (link to download the article as PDF)
Open citations (links to open the citations from this article in various online reference manager services)
Cite this article (links to download the citations from this article in formats compatible with various reference manager tools)
Susceptibility rhythm to bacterial endotoxin in myeloid clock-knockout mice
eLife 10:e62469.
https://doi.org/10.7554/eLife.62469


