Distinct insulin granule subpopulations implicated in the secretory pathology of diabetes types 1 and 2
- Center for Membrane and Cell Physiology, University of Virginia, United States
- Department for Molecular Physiology and Biological Physics, University of Virginia, United States
- Department of Pharmacology, University of Virginia, United States
- Department of Pharmacology, University of Michigan, United States
- Department of Neurobiology, Max Planck Institute for Biophysical Chemistry, Germany
- Cluster of Excellence in Multiscale Bioimaging: from Molecular Machines to Networks of Excitable Cells and Institute for Auditory Neuroscience, University of Göttingen, Germany
- Department of Microbiology, University of Virginia, United States
- Department of Cell Biology, University of Virginia, United States
Figures
Figure 1 with 3 supplements
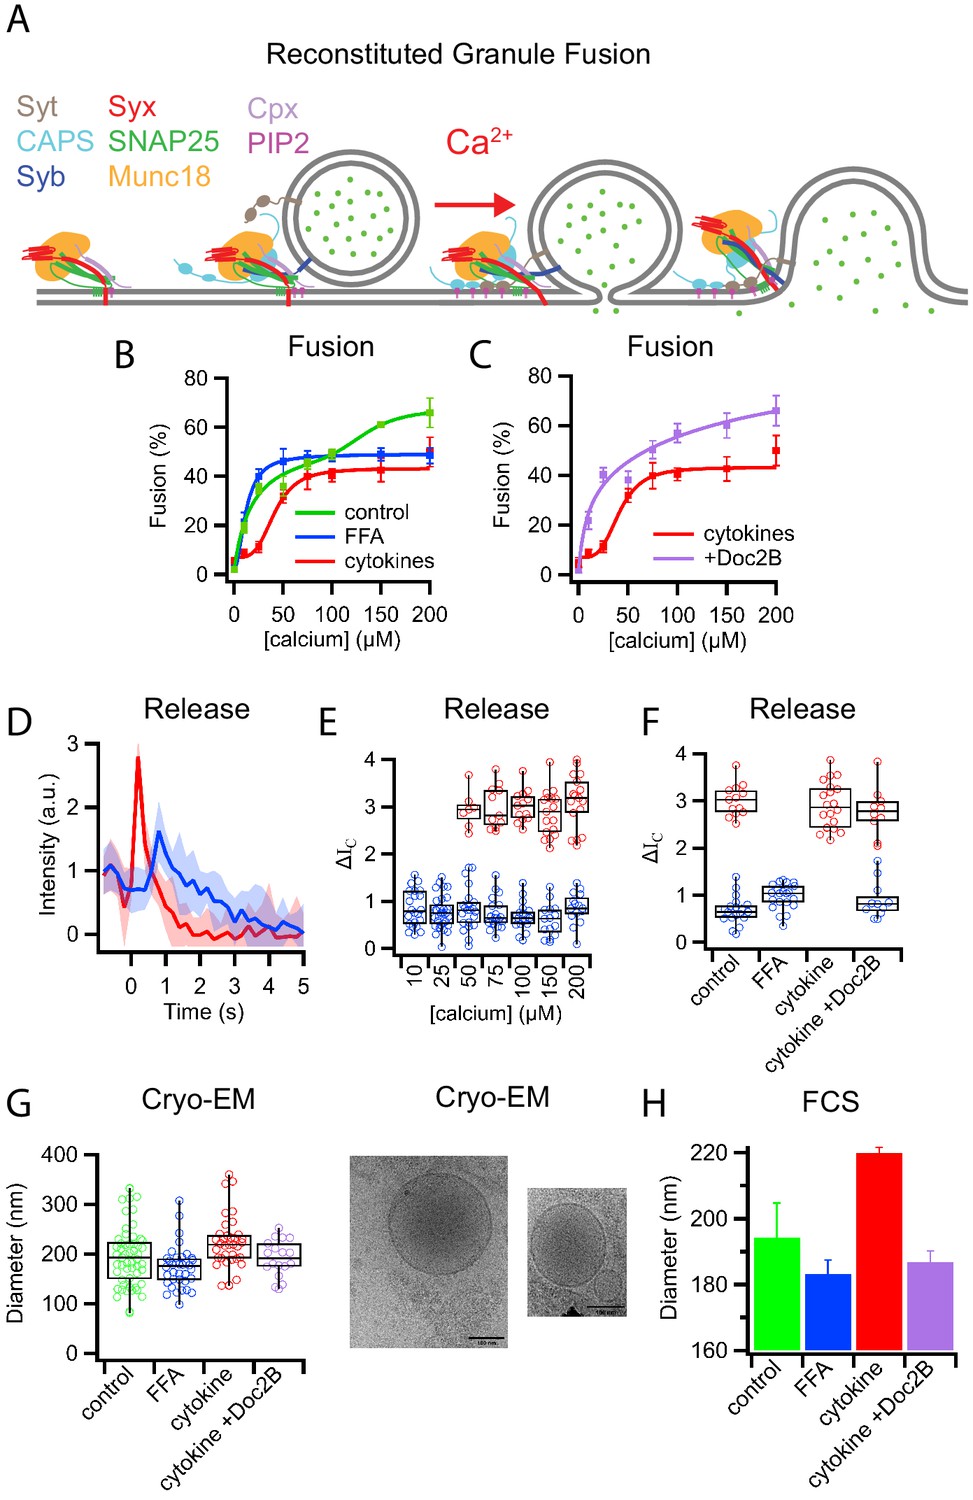
Palmitate (FFA) and cytokine treatments change the properties of insulin granules.
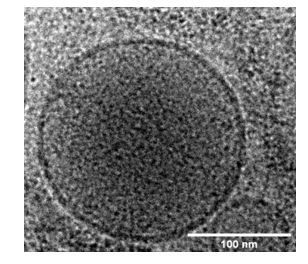
(A) Schematic of components necessary for calcium-dependent reconstitution of insulin granule fusion with planar supported membranes (Kreutzberger et al., 2019). (B) Fusion of insulin granules purified from GRINCH cells as a function of calcium concentration for granules purified from untreated (green), palmitate-treated (blue), or cytokine-treated (red) GRINCH cells measured by TIRF microscopy. (C) Shift in fusion profile caused by cytokines (red) is prevented by the overexpression of Doc2B in GRINCH cells prior to cytokine treatment (purple). (D) Granule-to-planar supported membrane fusion events have slow (blue) or fast (red) release modes. Intensity traces are averages of 20 single events with the shaded region showing the standard deviation. (E) Quantification of intensity change ΔIC (Figure 1—figure supplement 2) during fusion, for granules from untreated cells as a function of calcium showing the slow (blue) and fast (red) release modes. (F) The distribution of ΔIC for granules purified from cells either untreated, palmitate-treated (FFA), cytokine-treated, or overexpressing Doc2B and cytokine-treated at 100 μM calcium. Numerical data of single granule fusion experiments are presented in Supplemental Data Tables. (G and H) Size distributions of purified insulin granules as determined by cryo-EM and FCS. Between 50 and 100 particles were measured in cryoEM micrographs from two different sample preparations per each condition in (G). The hydrodynamic radius was deduced from the FCS measurements (H) using the Stokes-Einstein relation (Equation 4) with correlation curves shown in Figure 1—figure supplement 3.
Figure 1—figure supplement 1
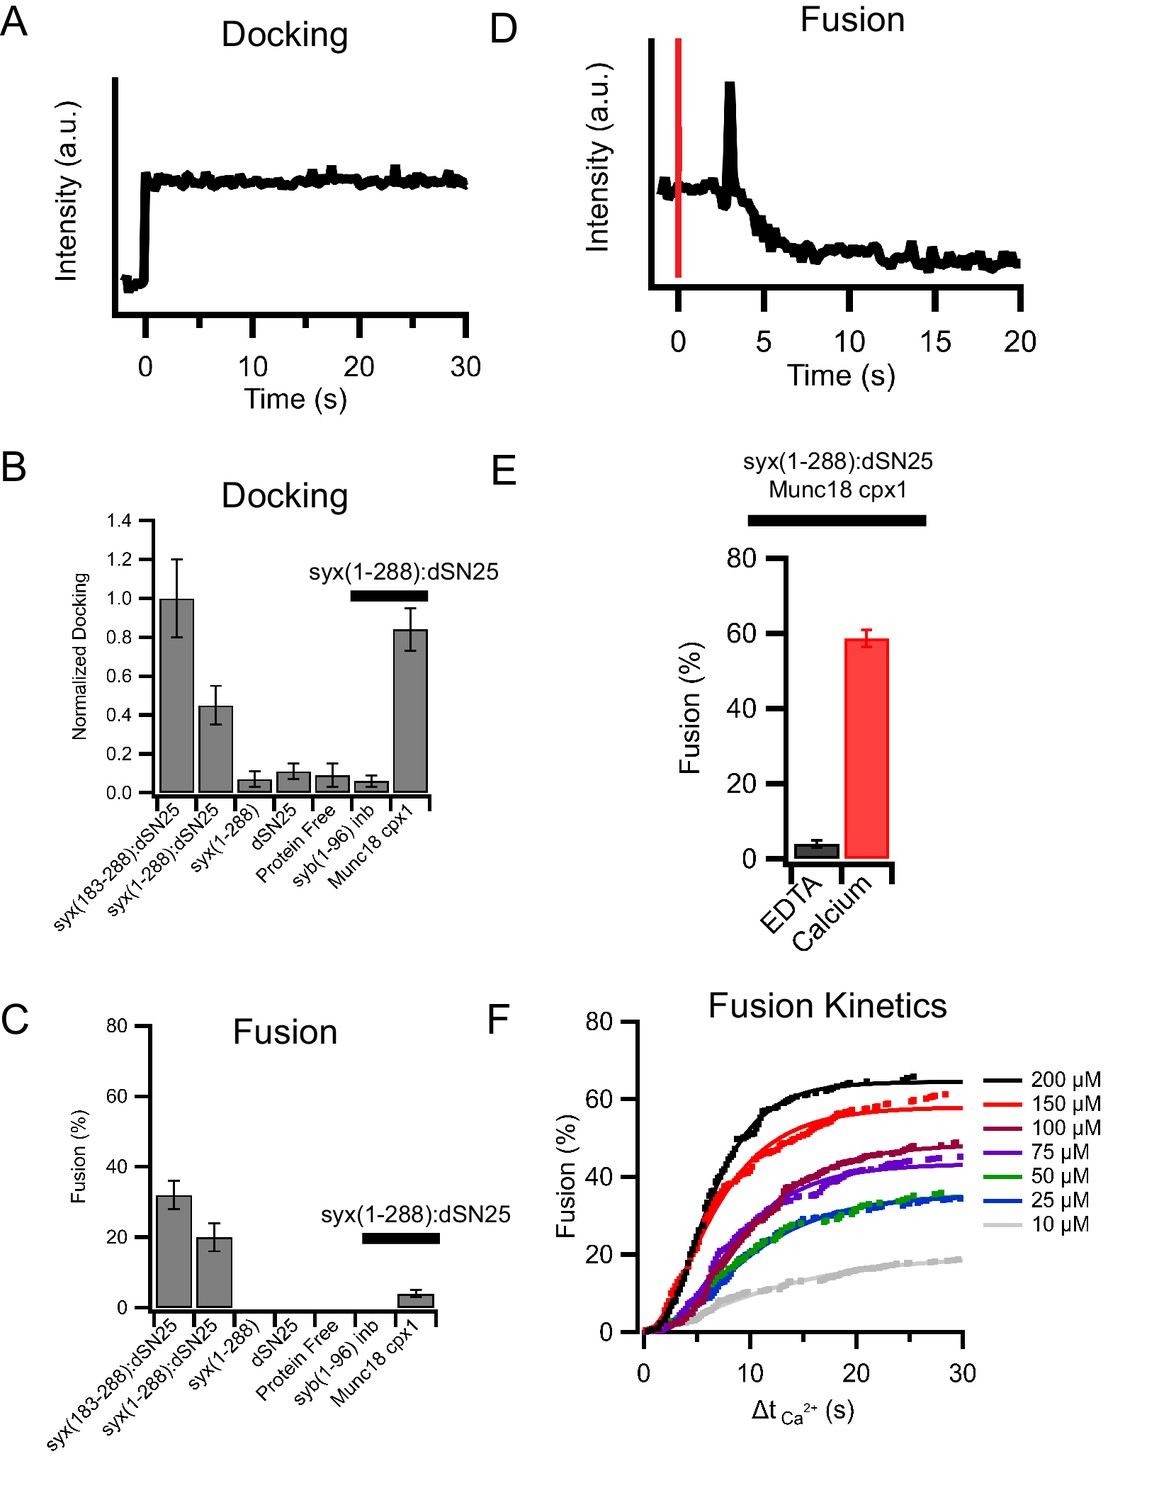
Characterization of insulin granule fusion with reconstituted planar supported membranes containing relevant SNARE proteins by TIRF microscopy.
(A) Example of an insulin granule purified from GRINCH cells (containing C-peptide-GFP) docking to a planar supported membrane. (B) Insulin granule docking to the supported membrane is SNARE-dependent when a minimal SNARE machinery, truncated syntaxin (syx183-288) and dodecylated SNAP25 (dSN25), or syntaxin-1a containing the regulatory Habc domain, syx(1-288), is present. Leaving out dSN25, syntaxin, both proteins, or inhibiting SNAREs with a soluble synaptobrevin-2 (syb1-96) peptide blocks docking. The addition of Munc18 and complexin-1 to syx(1-288):dSN25 increases docking. (C) Fusion in the absence of calcium (0.1 mM EDTA) is SNARE-dependent and blocked by the addition of Munc18 and complexin-1 (while allowing insulin granules to dock). (D) The injection of calcium to granules docked in the presence of syx(1-288):SNAP-25, Munc18, and complexin-1 triggers fusion of some of the docked granules (red line measures the time of calcium arrival in the field of view by a fluorescent tracer dye). (E) Approximately 60% of all docked insulin granules fuse after injection of 100 μM calcium (from typically more than 200 single events recorded from at least five separate supported membranes for each condition). (F) Cumulative distribution of calcium-triggered insulin granule fusion as a function of calcium concentration. Δt(Ca2+) is the time from calcium arrival to the time of the onset of fusion.
Figure 1—figure supplement 2
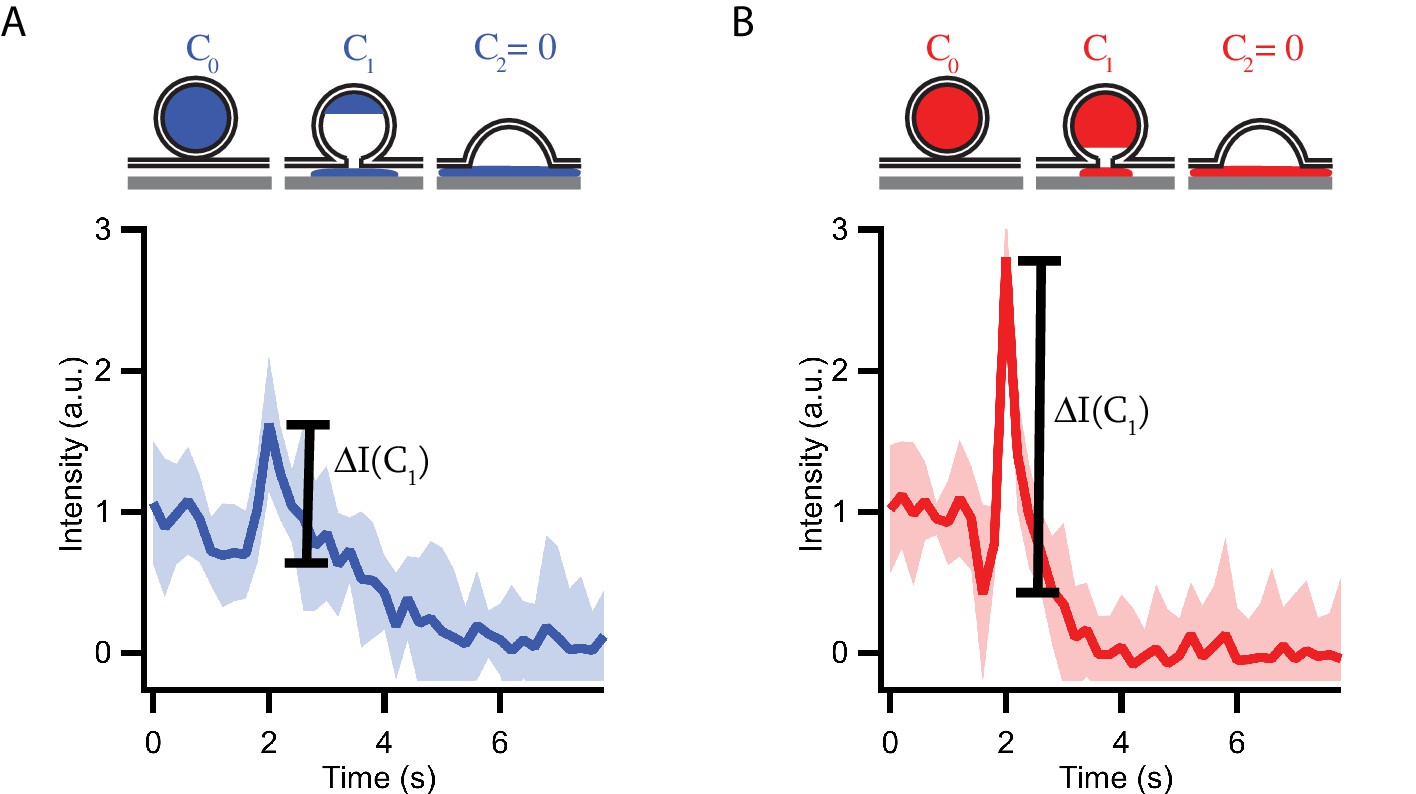
Granules release their content by distinct modes during fusion with planar supported membranes.
Schematic representations and averaged (15 events) fluorescent signals of high calcium affinity (syt7) (A) and low calcium affinity (syt9) (B) granule fusion events. At the onset of fusion, content is released slowly through an initial fusion pore. During the lifetime of the initial fusion pore, the fluorescent content inside the granule decreases from its starting concentration C0 to C1 and the observed C-peptide-GFP fluorescence decreases due to lateral diffusion of the content marker out of the region of interest. The slow release is followed by a collapse of the granule and transfer of the remaining content (C1) into the cleft between membrane and substrate. The fast transfer of fluorescent content in the evanescent field leads to a strong increase in the fluorescent signal ΔI(C1). Note that due to the longer fusion pore lifetime the remaining content C1 is smaller for syt7 granules (A) than for syt9 granules and, therefore, the observed fluorescent peaks ΔI(C1) are also smaller. Overall, syt7 granules release their total fluorescent content over a longer time period then syt9 granules. The fluorescent peak heights are evaluated for single fusion events in Figures 1 and 3. The same traces as shown in Figure 1D are shown here.
Figure 1—figure supplement 3

Averaged FCS correlation curves along with curve fits.
(Equations 1 and 2) of insulin granules purified from palmitate-treated (FFA), cytokine-treated, and Doc2B-expressing cytokine-treated GRINCH cells or immunodepleted with antibodies against syt7 or syt9, and controls without treatments or immunodepletion are averaged from 20, 30 s runs. The hydrodynamic radius for each curve takes into account variations in temperature and viscosity with errors reported between fits. Fractional triplet component is reported where necessary.
Figure 2 with 1 supplement
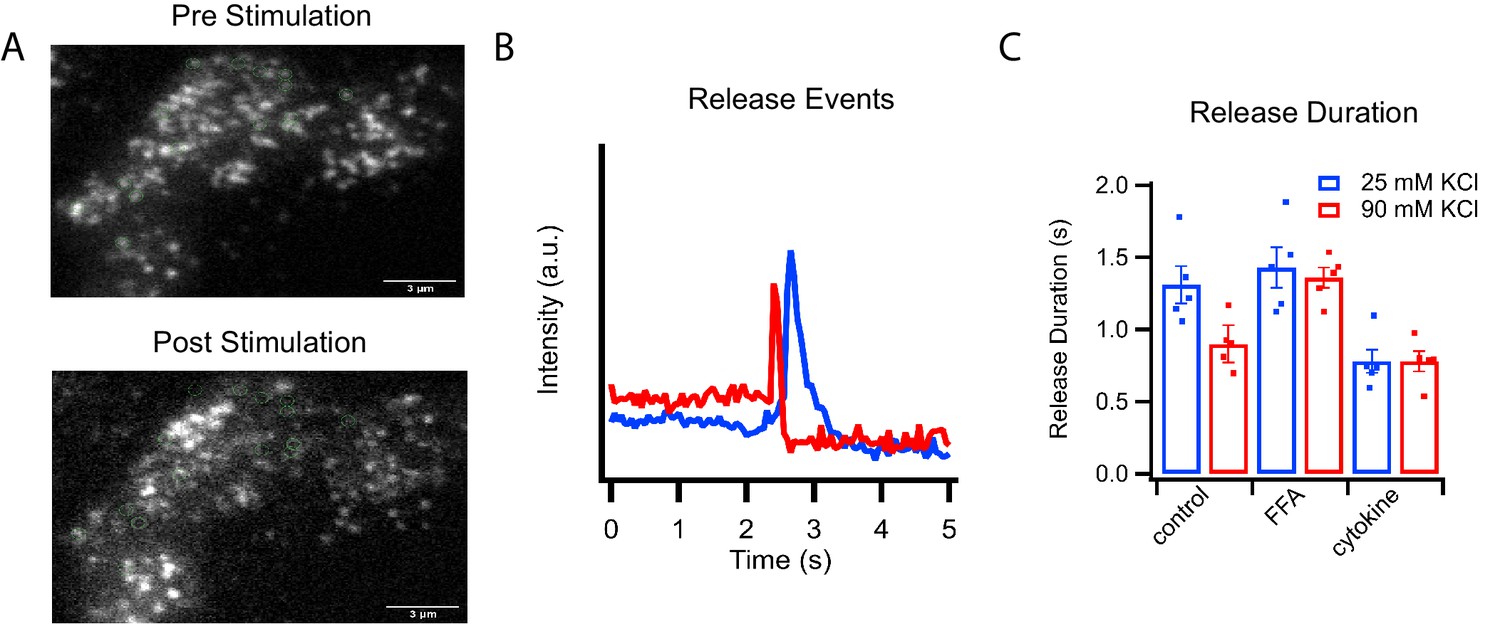
C-peptide-GFP release from GRINCH cells after KCl stimulation.
(A) Representative images of a C-peptide-GFP labeled GRINCH cell before (top) and after stimulation (bottom); scale bar 3 μm. (B) Averaged intensity traces for single events of C-peptide-GFP exocytosis from GRINCH cells illustrating slower (blue) and faster (red) release durations. (C) Quantification of release duration for exocytotic events averaged over all events observed from each observed GRINCH cell following mild (25 mM KCl, blue) or strong (90 mM KCl, red) depolarization of control, palmitate- (FFA), or cytokine-treated cells. Distributions of individual exocytotic events are displayed in Figure 2—figure supplement 1C. Numerical data of cell secretion events are presented in Figure 2—source data 1. For statistics see Figure 2—source datas 2 and 3.
-
Figure 2—source data 1
Numerical data of cell secretion events.
- https://cdn.elifesciences.org/articles/62506/elife-62506-fig2-data1-v2.xlsx
-
Figure 2—source data 2
Significance values of release duration comparing stimulation strengths from Figure 2C.
- https://cdn.elifesciences.org/articles/62506/elife-62506-fig2-data2-v2.docx
-
Figure 2—source data 3
Significance values of release durations comparing different cell treatments from Figure 2C.
- https://cdn.elifesciences.org/articles/62506/elife-62506-fig2-data3-v2.docx
Figure 2—figure supplement 1

Calcium influx and single events of C-peptide-GFP release after KCl stimulation of GRINCH cells.
(A) Fluorescence intensity of GRINCH cells labeled with cell permeable fluo4 at different depolarization strengths showing increasing amounts of calcium influx upon mild and strong depolarization. (B) Sample intensity traces for single events of C-peptide-GFP exocytosis of predocked granules from GRINCH cell illustrating fast or slow release, or a granule that is docking before release. These latter events are relatively rarely observed and excluded from our analysis. (C) Detailed plots showing release duration for all events that are summarized in the bar graph presented in Figure 2C.
Figure 3 with 2 supplements

Subpopulations of insulin granules carry different synaptotagmin isoforms and have different physical and fusion properties that correlate with those observed after type-1 and type-2 diabetes model treatments.
(A) Flow chart for purifying insulin granules from INS 1-derived (GRINCH or INS 832/13) cells over a density gradient, assessing their syt content, and further separation by syt isoform immunodepletion. (B) Western blots of cell lysates for either syt7 or syt9 from untreated cells or cells treated with cytokines and palmitate (FFA); accompanying quantification (from three independent experiments) shows that syt concentrations are unchanged. Gamma-adaptin was used for normalization as previously (Hussain et al., 2018). (C) Western blot of insulin granule fractionation profiles from cells following different treatments; fraction nine was collected as granules. (D) Western blot (top) and quantification (bottom) of insulin granule supernatants following immunodepletion with anti-syt7 or syt9 antibodies (n = 3). (E) Size distributions of total (control) and syt7 or syt9 granules harvested from supernatants following immunodepletion of the other granule type and measured by cryo-EM (left) or FCS (right). (F) Insulin granule fusion with planar supported membranes as a function of calcium concentration. Total (control) granules (green), syt7 granules (blue) and syt9 granules (red). (G) Content release mode (as defined in Figure 1D and Figure 1—figure supplement 2) for syt7 and syt9 insulin granules in the presence of 100 µM calcium. Numerical data of single granule fusion experiments are presented in Figure 3—source data 1.
-
Figure 3—source data 1
Numerical data of single granule fusion experiments.
- https://cdn.elifesciences.org/articles/62506/elife-62506-fig3-data1-v2.xlsx
Figure 3—figure supplement 1
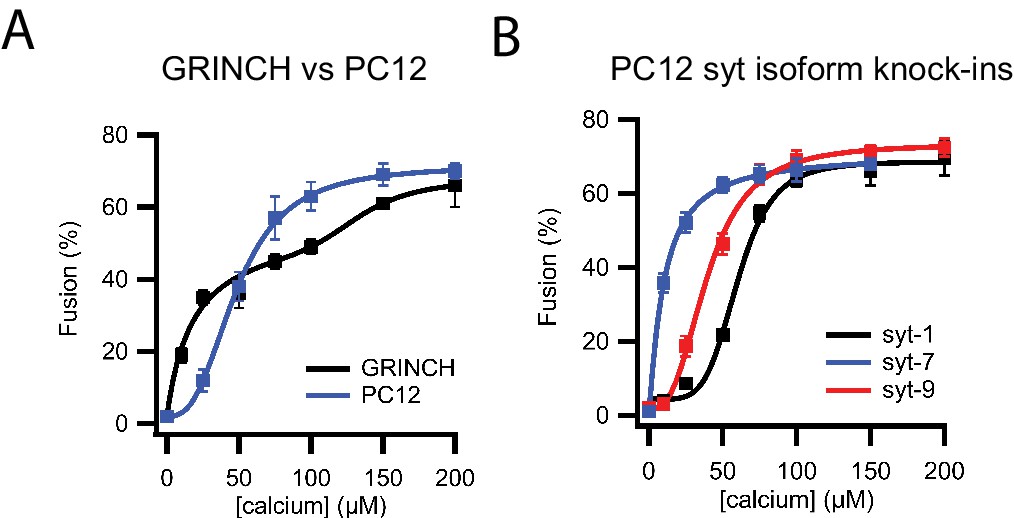
Calcium dependence of granule fusion efficiency is determined by syt isoform.
(A) Comparison of fusion efficiencies for insulin granules purified from untreated GRINCH cells and dense core granules from PC12 cells expressing NPY-Ruby as a function of calcium concentration measured in a single vesicle/supported membrane TIRF microscopy-based fusion assay. (B) Fusion efficiencies of PC12 dense core granules expressing only single synaptotagmin isoforms as a function of calcium concentration in a single vesicle/supported membrane fusion assay.
Figure 3—figure supplement 2
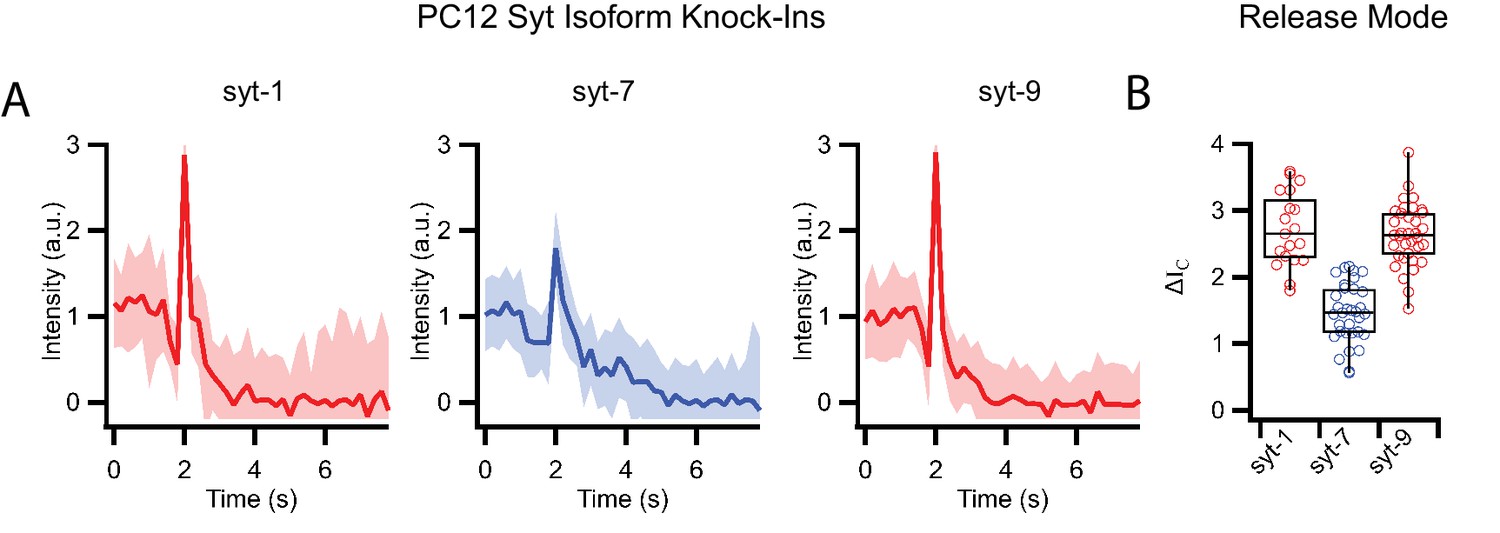
Release modes of PC12 dense core granules expressing only single synaptotagmin isoforms in a single vesicle/supported membrane fusion assay.
(A) Averaged fluorescent line shapes of dense core vesicle release events (20 traces per average) for each synaptotagmin isoform with syt1 and syt9 having fast release rates and syt7 having slow release rates. (B) Release modes of single events measured by the peak intensities ΔIC during fusion of dense core vesicles with supported membranes for different synaptotagmin isoforms.
Figure 4 with 1 supplement

Syt7 and syt9 granule subpopulations have different lipid compositions.
(A) Cholesterol and sphingomyelin contents of syt7 (blue) and syt9 (red) granules measured in lipid extracts using colorimetric assays (Figure 4—figure supplement 1, error bars are standard deviation from three independent samples). (B) Fluorescence spectra of GFP or mKate of intact granules in control and immunodepleted syt7 or syt9 granules purified from INS 832/13 cells. (C) Quantification of the fluorescence (sol-GFP in black and SM-Kate in purple) in control and immunodepleted syt7 or syt9 granules. Numerical data are presented in Figure 4—source data 1. (D) Fluorescence of INS 832/13 cells expressing plasmids that label all granules in the secretory pathway (sol-GFP) and those enriched in sphingomyelin (SM-Kate). Scale bars are 10 μm. (E) The Manders colocalization coefficient defining co-localization of SM-Kate to GFP (Red/Green) or GFP to SM-Kate (Green/Red). Each dot represents a single cell. (F) Volcano plot of mass spectrometry data comparing relative levels of specific lipid species from syt7 and syt9 granules. Data (from Figure 4—source data 2) are expressed as a ratio syt9/syt7 such that values to the right of 0 indicate enrichment in syt9 granules relative to syt7 granules and values to the left of 0 indicate the reverse. The significance of each measurement is plotted on the vertical axis. Blue dots are sphingomyelin species and black dots are all other lipid species. The only lipid showing a significantly different distribution (-log p-value>4.31 (dotted line), that is p<0.05) is SM 42:1, which is enriched in syt7 granules. (G) Bar graph derived from the data in panel F summarizing the compositional differences by lipid class where the fold enrichment in syt7 or syt9 granules is plotted, respectively, to the left and right of 0. At least three independent samples of syt7 and syt9 granules were analyzed by mass spectrometry (see Figure 4—source data 3).
-
Figure 4—source data 1
Sphingomyelin biosensor data.
- https://cdn.elifesciences.org/articles/62506/elife-62506-fig4-data1-v2.xlsx
-
Figure 4—source data 2
Table of lipid species, fold change, and significance of the change.
Input for Figure 4F and G.
- https://cdn.elifesciences.org/articles/62506/elife-62506-fig4-data2-v2.docx
-
Figure 4—source data 3
Lipidomics data.
- https://cdn.elifesciences.org/articles/62506/elife-62506-fig4-data3-v2.xlsx
Figure 4—figure supplement 1
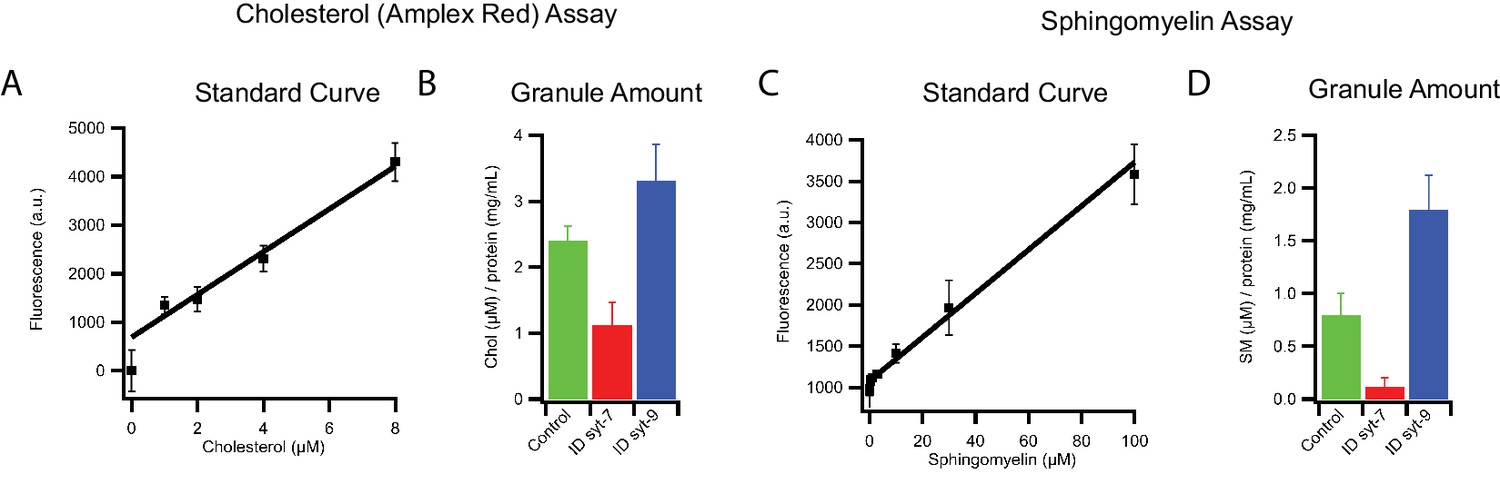
Lipid composition of INS 832/13 cell-derived insulin granule subpopulations.
(A) Standard curve of cholesterol amplex red assay used for calibration. (B) Amount of cholesterol normalized to the protein concentration of insulin granules before and after immunodepletion with antibodies against syt7 or syt9. Data are from three independent experiments and error bars indicate standard errors. (C) Standard curve for sphingomyelin assay used for calibration. (D) Amount of sphingomyelin normalized to the protein concentration of insulin granules before and after immunodepletion with antibodies against syt7 or syt9. Data are from three independent experiments and error bars indicate standard errors.
Figure 5 with 1 supplement
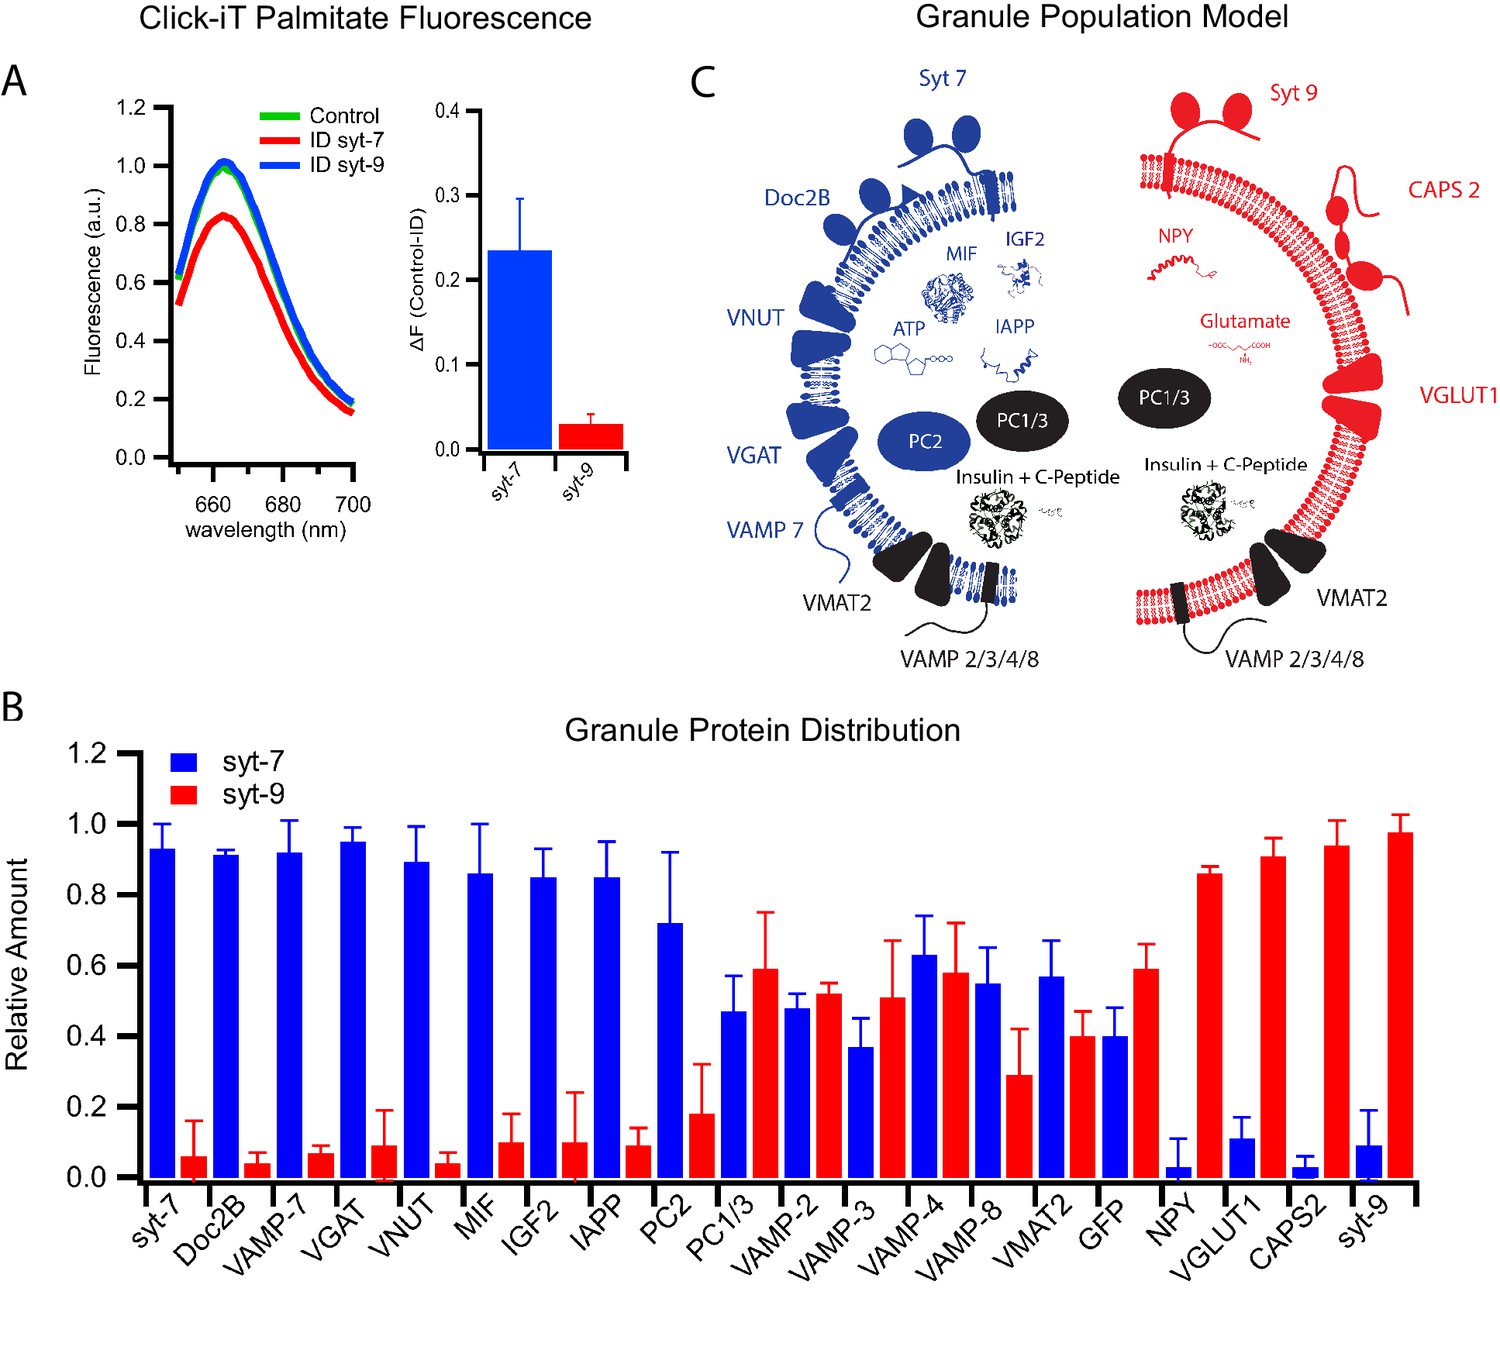
Differential protein distribution into syt7 and syt9 granule subpopulations.
(A) Palmitic acid incorporates more efficiently into INS 832/13 cell-derived syt7 than into syt9 granules. Fluorescence spectra (left) of purified insulin granules with incorporated Click-iT palmitate solubilized in 1% Triton-X and then labeled with Alexa647 (by an Azide-Alkyne Click-iT reaction). The spectra are those of granules before (green) and after immunodepletion with syt antibodies (red, depletion using anti-syt7; blue, depletion using anti-syt9). Quantification of fluorescence change in control and syt7 or syt9 granules (right). The results are from three separate purifications of insulin granules. (B) Distribution of granule proteins between syt7 and syt9 granules that were derived from GRINCH cells. Data show the fraction of the total of each protein associated with syt7 (blue) vs syt9 (red) granules as determined from quantitative western blotting (Figure 5—figure supplement 1); error bars are standard deviation from three independent samples. For statistics see Figure 5—source data 1. (C) Model summarizing the compositions of syt7 (blue) and syt9 (red) insulin granules.
-
Figure 5—source data 1
Significance values of protein contents between different immunodepleted granules obtained from Figure 5B and Figure 5—figure supplement 1.
- https://cdn.elifesciences.org/articles/62506/elife-62506-fig5-data1-v2.docx
Figure 5—figure supplement 1
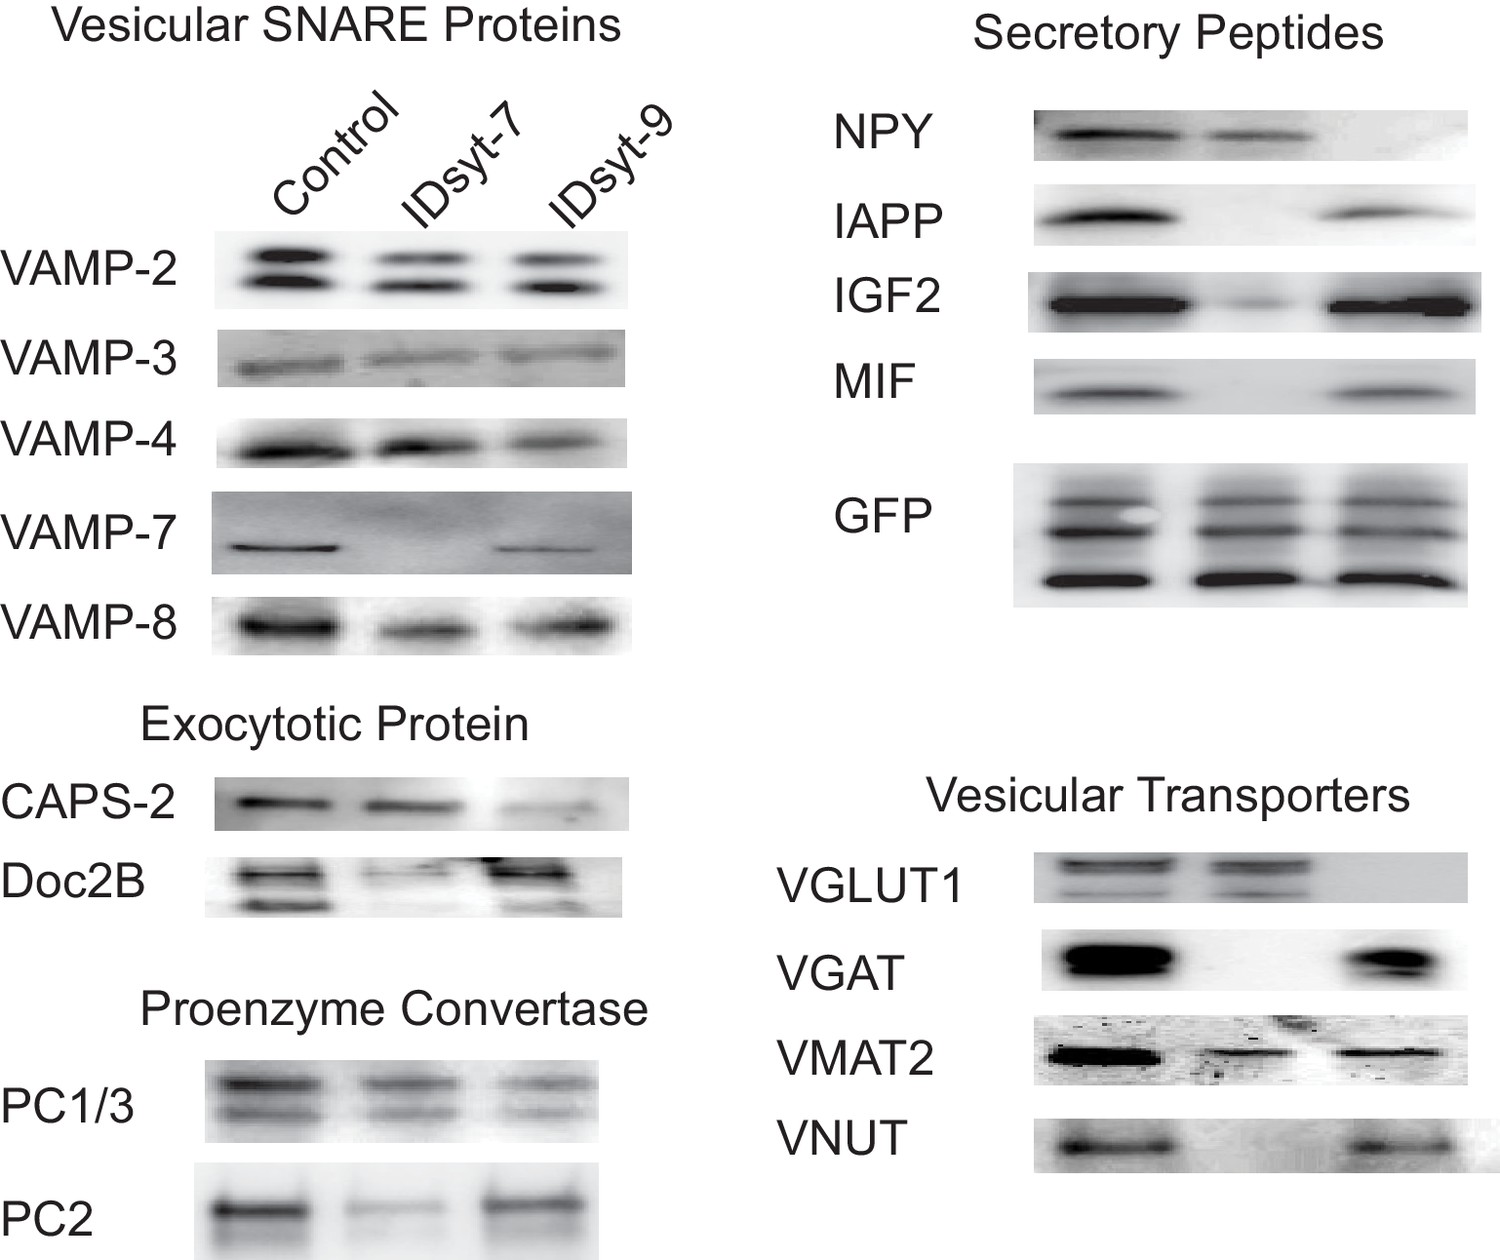
Western blots for proteins associated with GRINCH cell-derived insulin granules before immunodepletion (left lanes) and after immundepletion of intact granules using antibodies against syt7 (middle lanes) or syt9 (right lanes).
Samples were divided into three equal parts: control (unaltered) and each of the other two immunodepleted. All three were solubilized in SDS-loading buffer and western blotting was performed on an equal fraction of the total of each sample. The three bands in the GFP blot are from top to bottom: proinsulin-GFP, conversion intermediate, C-peptide-GFP. The results shown were reproduced in three completely independent experiments.
Figure 6 with 1 supplement
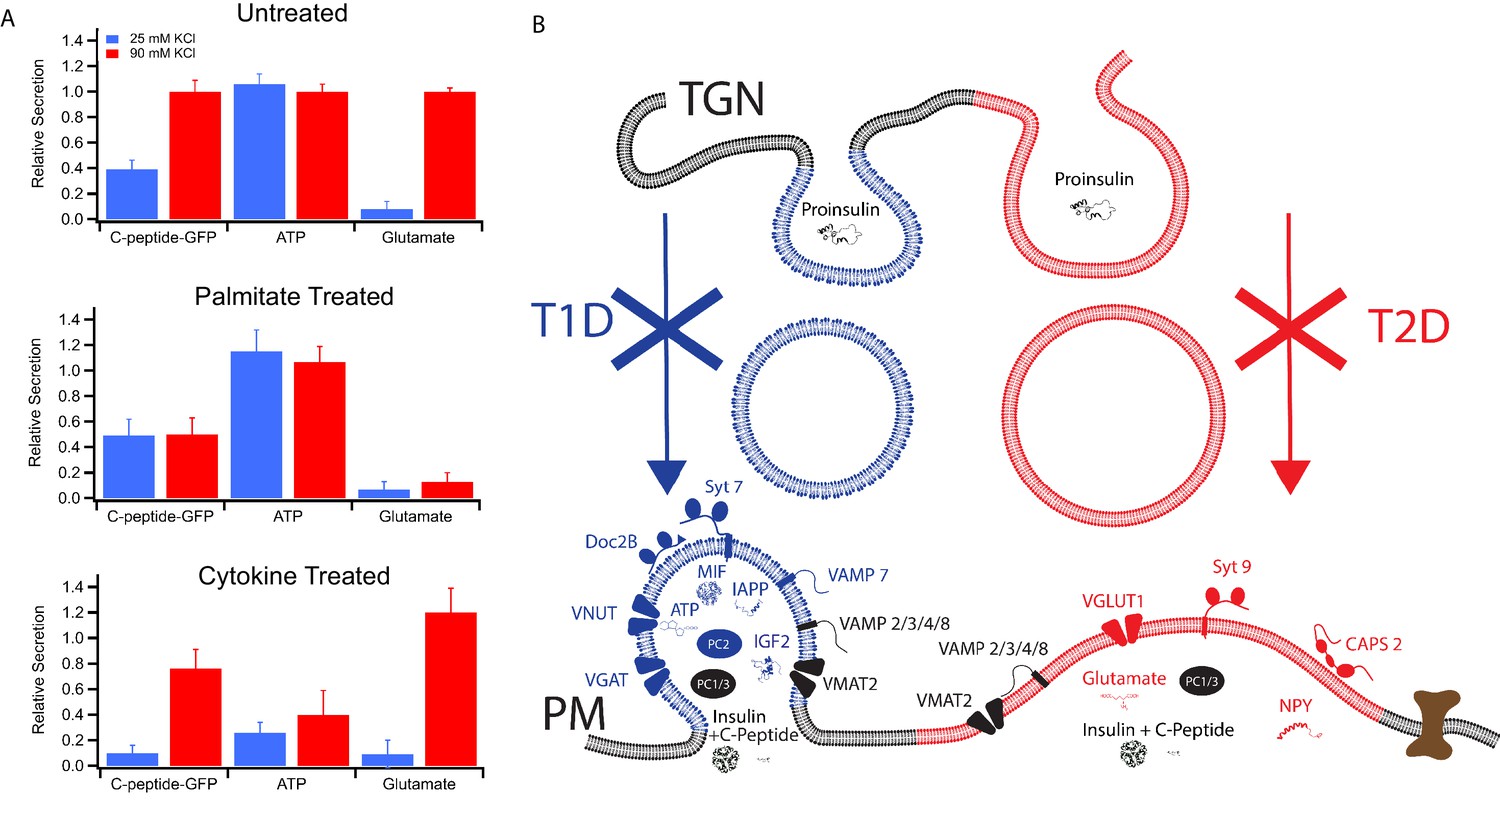
Secretion from GRINCH (C-peptide-GFP) or INS 832/13 (ATP and Glutamate) cells following treatments that model T1D and T2D phenotypes.
(A) Response of secretory content from cells stimulated by 25 mM (blue) or 90 mM (red) KCl. C-peptide-GFP secretion was determined by a bulk secretion assay using GRINCH cells. ATP and glutamate were determined by a luciferase assay or the fluorescence of iGluSnFr glutamate biosensor, respectively, using INS 832/13 cells (error bars are standard deviations from three independent experiments). For statistics see Figure 6—source data 1 and 2. (B) Model of how different types of insulin granules are formed, released and affected in T1D and T2D. TGN, trans-Golgi network; PM, plasma membrane.
-
Figure 6—source data 1
Significance values between different stimulation strengths for secretion experiments from Figure 6A.
- https://cdn.elifesciences.org/articles/62506/elife-62506-fig6-data1-v2.docx
-
Figure 6—source data 2
Significance values between different treatments for secretion experiments from Figure 6A.
- https://cdn.elifesciences.org/articles/62506/elife-62506-fig6-data2-v2.docx
Figure 6—figure supplement 1
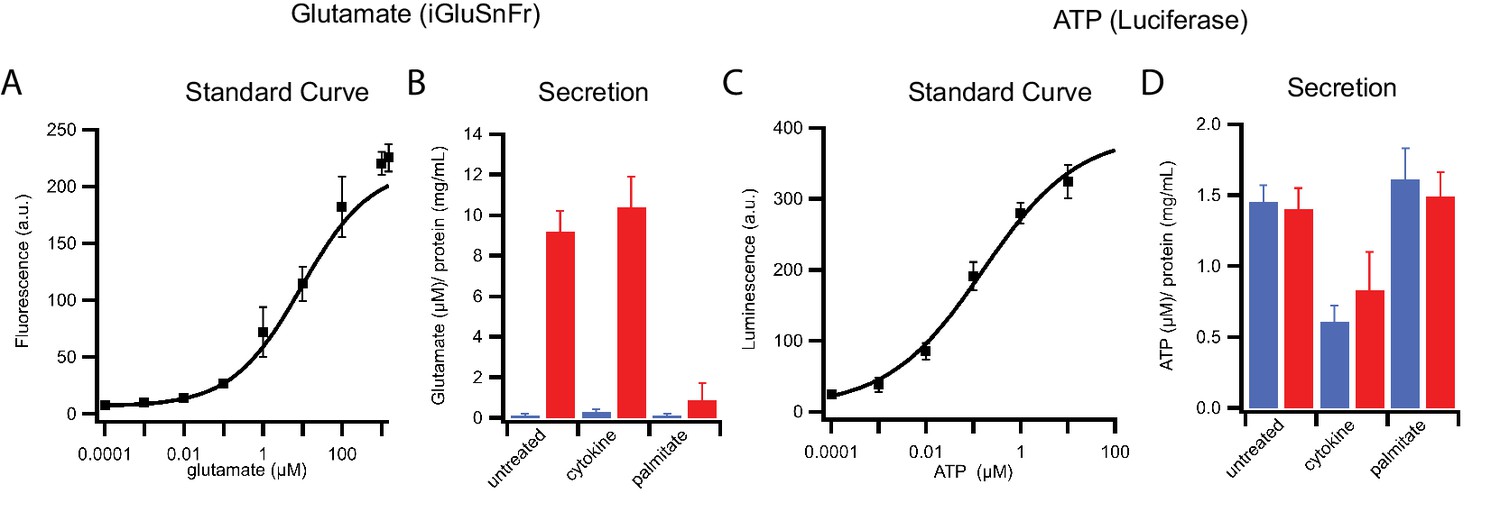
Stimulation-dependent release of glutamate and ATP from INS 832/13 cells.
(A) Standard curve for glutamate as detected by the iGluSnFr biosensor. (B) Glutamate release from control, cytokine-treated, and palmitate-treated cells in response to 25 mM (blue) or 90 mM (red) KCl. (C) Standard curve for ATP determined using luciferase bioluminescence. (D) ATP secretion in response to 25 mM (blue) or 90 mM (red) KCl. For the measurement, cells were plated at equal densities. Following stimulation, media were collected and freed of debris by centrifugation; cells were scraped and lysed, and the total amount of protein was determined to normalize any variations of cell density. Error bars are standard deviations from three independent experiments.
Author response image 1
Tables
Table 1
Characteristics of the granule subpopulations and their correlations to T1D and T2D.
| Characteristic | Syt7 subpopulation | Syt9 subpopulation | Action on or correlation to diabetes | Correlations in literature (references) |
|---|---|---|---|---|
| Calcium affinity (K1/2) | 12 ± 2 µM | 41 ± 4 µM | ||
| Release rate | Slow | Fast | ||
| Size | ~180 nm | ~210 nm | ||
| Exocytosis regulatory | ||||
| VAMP2 | + | + | ||
| VAMP3 | + | + | ||
| VAMP4 | + | + | ||
| VAMP7 | ++ | -- | ||
| VAMP8 | + | + | ||
| CAPS2 | -- | ++ | ||
| Doc2B | ++ | -- | T1D (loss in human, rodent, culture models) | Aslamy et al., 2018a, Aslamy et al., 2018b |
| Prohormone processing | ||||
| PC2 | ++ | -- | ||
| PC1/3 | + | + | ||
| Molecular transporter | ||||
| VGAT | ++ | -- | GABA, immune communication | Bai et al., 2003 |
| VNUT | ++ | -- | GABA, immune communication | Weitz et al., 2018 |
| VMAT2 | + | + | Dopamine, β-cell survival | Garcia Barrado et al., 2015 |
| VGLUT1 | -- | ++ | Glutamate, T1D onset | Oresic et al., 2008 |
| Secretory/diabetes-related | ||||
| MIF | ++ | -- | T1D (decrease), T2D (increase)* | Stojanovic et al., 2012 |
| IGF2 | ++ | -- | T2D (increase)* | Cornu et al., 2009, Casellas et al., 2015 |
| IAPP | ++ | -- | T2D (amyloid aggregates increase)* | Westermark et al., 2011 |
| NPY | -- | ++ | T2D (progression) | Rodnoi et al., 2017 |
-
*Note: for increases in T2D, the correlation is with being the only remaining granule subpopulation.
Additional files
Download links
A two-part list of links to download the article, or parts of the article, in various formats.
Downloads (link to download the article as PDF)
Open citations (links to open the citations from this article in various online reference manager services)
Cite this article (links to download the citations from this article in formats compatible with various reference manager tools)
Distinct insulin granule subpopulations implicated in the secretory pathology of diabetes types 1 and 2
eLife 9:e62506.
https://doi.org/10.7554/eLife.62506


