Variation of connectivity across exemplar sensory and associative thalamocortical loops in the mouse
- McGovern Institute for Brain Research, United States
- Department of Brain and Cognitive Sciences, Massachusetts Institute of Technology, United States
- Department of Anatomy and Neuroscience, School of Medicine, Autónoma de Madrid University, Spain
Figures
Figure 1 with 2 supplements
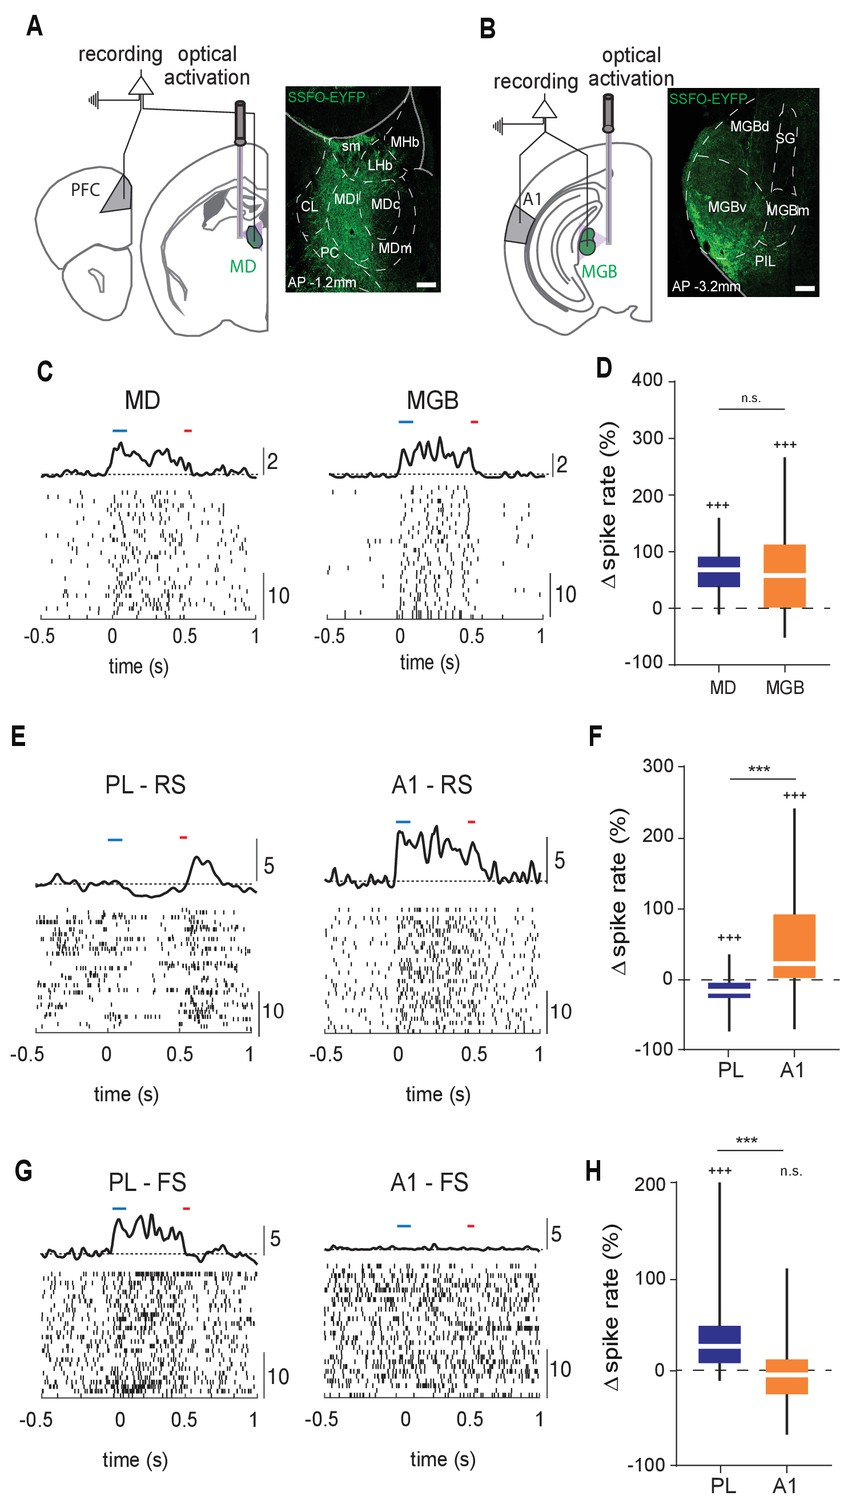
Structural differences between MD→PL and MGB→A1 microcircuits are reflected in functional divergence.
(A) Left: Experimental schematic of combined MD and PL recordings with optical activation of MD using Stabilized Step Function Opsins (SSFO). Right: Anatomical expression of AAV-SSFO-GFP in MD. Scale bar = 200 µm (B) Same as in (A) except for MGB→A1 loop. (C) Example raster and PSTH of single units recorded from MD (left) and MGB (right) during SSFO-induced activation of respective regions SSFO was activated by 100 ms pulse of blue laser (473 nm, blue bar) and terminated with a 50 ms pulse of red laser (633 nm, red bar). (D) MD (blue) and MGB (orange) neurons demonstrate comparably strong increases in spike rates with SSFO stimulation (n = 298 neurons, N = 4 mice for MD, n = 597 neurons, N = 5 mice for MGB, +++p<0.001, compared to baseline rate, Wilcoxon signed rank test; n.s., compared to each other, Mann-Whitney U test). (E) Example raster and PSTH of RS neurons in the PL during SSFO-induced activation of MD (left, blue), and in A1 during SSFO-induced activation of MGB (right, orange). (F) SSFO-induced activation of the MD results in a decrease in spike rate in PFC-RS neurons, while that of the MGB leads to an increase in spike rate in A1-RS neurons (n = 441 PFC-RS neurons, +++p<0.001 compared to baseline, Wilcoxon signed rank test; n = 724 A1-RS neurons, +++p<0.001 compared to baseline, Wilcoxon signed rank test; ***p < 0.001 compared to each other, Mann-Whitney U test; N = 5 mice for each condition). (G) Example raster and PSTH of FS neurons in the PL during SSFO induced activation of the MD (left, blue), and in A1 during SSFO induced activation of the MGB (right, orange). (H) SSFO induced activation of the MD results in an increase in spike rate in PFC-FS neurons, while that of the MGB does not significantly alter the spike rate in A1-FS neurons (n = 265 PFC-FS neurons; +++p<0.001 compared to baseline, Wilcoxon signed rank test, N = 5 mice; n = 194 A1-FS neurons; p=0.6531 compared to baseline, Wilcoxon signed rank test, N = 4 mice, ***p < 0.001 compared to each other, Mann-Whitney U test).
-
Figure 1—source code 1
MD PL firing rates.
- https://cdn.elifesciences.org/articles/62554/elife-62554-fig1-code1-v2.zip
-
Figure 1—source code 2
MGB A1 firing rates.
- https://cdn.elifesciences.org/articles/62554/elife-62554-fig1-code2-v2.zip
-
Figure 1—source code 3
MATLAB Script to calculate spike rate changes .
- https://cdn.elifesciences.org/articles/62554/elife-62554-fig1-code3-v2.zip
-
Figure 1—source data 1
Change in firing rates normalised to baseline firing.
- https://cdn.elifesciences.org/articles/62554/elife-62554-fig1-data1-v2.xlsx
Figure 1—figure supplement 1
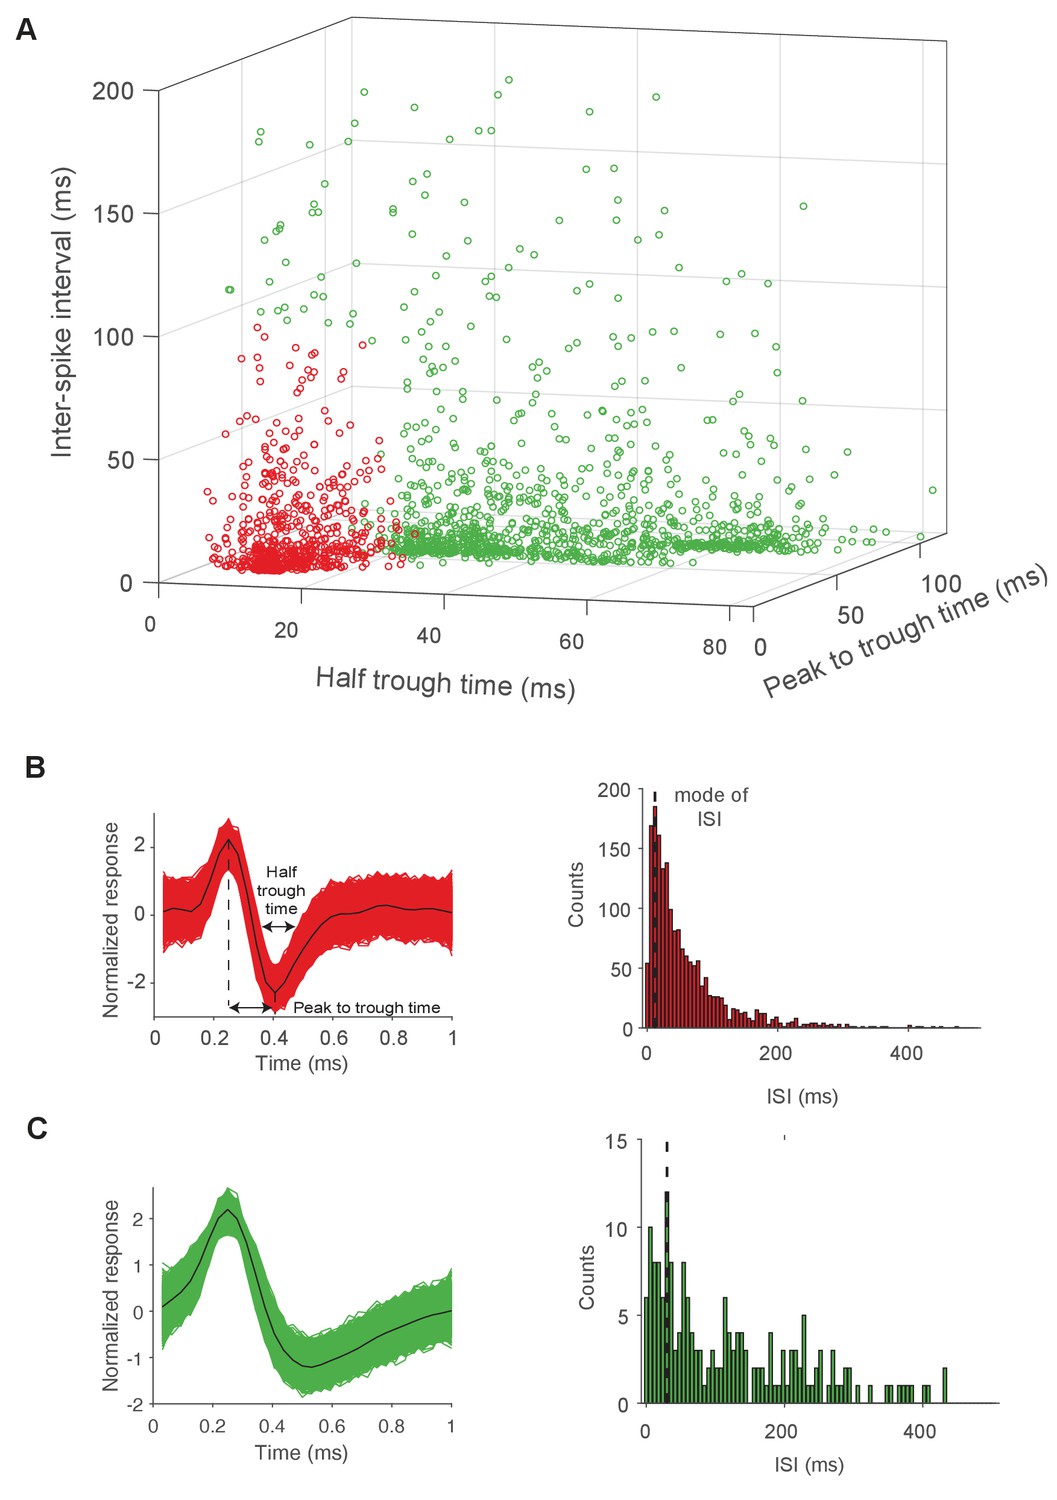
Sorting of units into regular spiking (RS) and fast spiking (FS) neurons.
(A) Recorded units were separated into regular spiking (n = 1372, green) and fast spiking (n = 678, red) cells, via k-means clustering on three feature dimensions: half trough time, peak to trough time, and mode of the inter-spike interval (ISI). Each dot corresponds to a putative single unit. Data is pooled from recordings in the PL and A1. (B) Left: Superimposed waveforms of an example FS unit (red) with peak to trough time and half trough times demarcated. The median waveform is shown in black. Right: Histogram of inter-spike intervals (ISI) of the same FS unit. (C) Left: Superimposed waveforms of an example RS unit (green), where the median waveform is shown in black. Right: Histogram of inter-spike intervals (ISI) of the same RS unit.
Figure 1—figure supplement 2
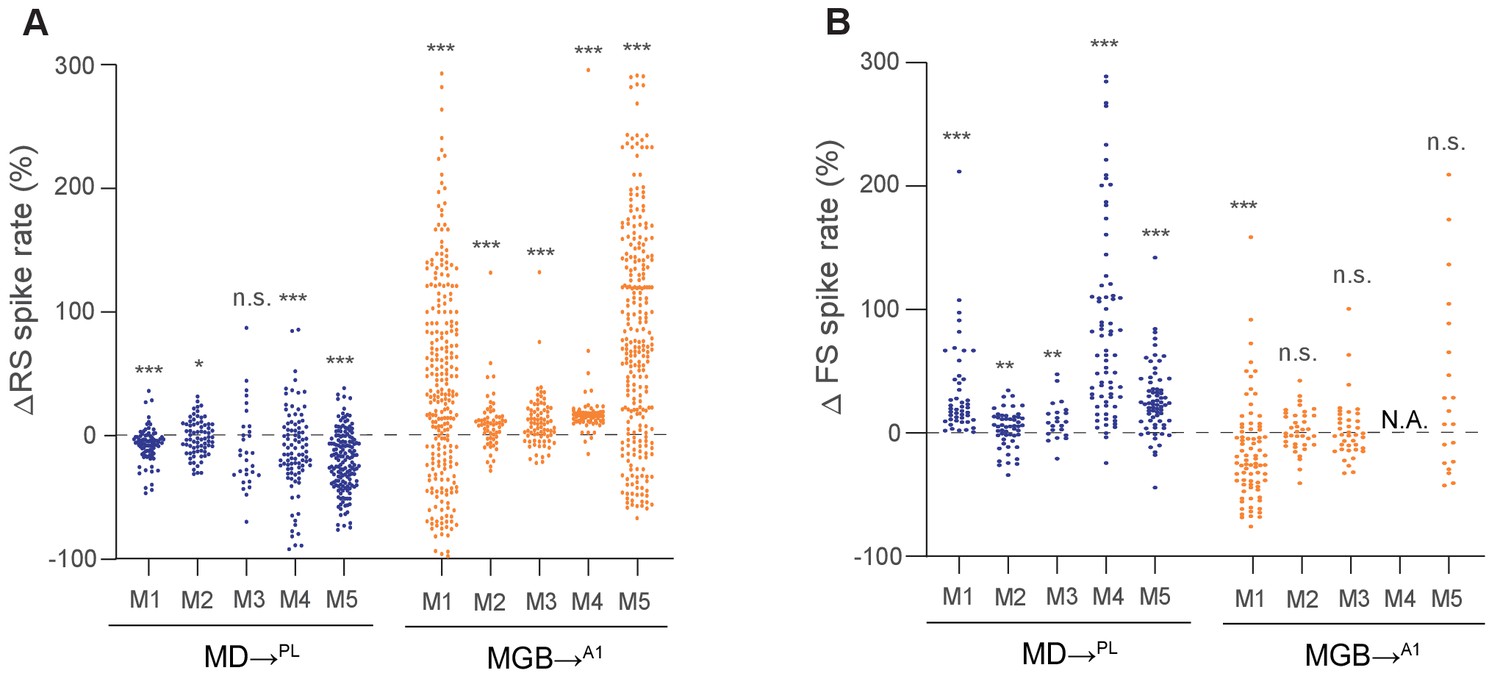
Changes in spike rates of RS and FS neurons recorded in the PL or A1 separated by animals.
(A) Proportional change in spike rate of RS neurons recorded in the PL or A1 produced by SSFO activation of the MD (blue) or MGB (orange) separated by animals. Across animals, a decrease in spike rate was observed in the PL (M1: n = 85 RS neurons, ***p<0.001; M2: n = 73 RS neurons, p=0.286; M3: n = 30 RS neurons, *p=0.0181; M4: n = 93 RS neurons, ***p<0.001; M5: n = 160 RS neurons, ***p<0.001; compared to baseline, Wilcoxon signed rank test), and an increase was observed in A1 (M1: n = 253 RS neurons, ***p<0.001; M2: n = 59 RS neurons, ***p<0.001; M3: n = 65 RS neurons, ***p<0.001; M4: n = 84 RS neurons, ***p<0.001; M5: n = 263 RS neurons, ***p<0.001; compared to baseline, Wilcoxon signed rank test) (B) Proportional change in spike rate of FS neurons recorded in the PL or A1 produced by SSFO activation of MD (blue) or MGB (orange) separated by animals. Across animals, an increase in spike rate was consistently observed in the PL (M1: n = 47 FS neurons, ***p<0.001; M2: n = 53 FS neurons, **p<0.01; M3: n = 22 FS neurons, **p<0.01; M4: n = 73 FS neurons, ***p<0.001; M5: n = 70 FS neurons, ***p<0.001; compared to baseline, Wilcoxon signed rank test), while no consistent change in spike rate was observed in A1 (M1: n = 81 FS neurons, +++p=0.001; M2: n = 38 FS neurons, p=1.000; M3: n = 52 FS neurons, p=0.280; M5: n = 20 FS neurons, p=0.253; compared to baseline, Wilcoxon signed rank test).
-
Figure 1—figure supplement 2—source data 1
Change in RS and FS firing rates normalized to baseline separated by individual animals.
- https://cdn.elifesciences.org/articles/62554/elife-62554-fig1-figsupp2-data1-v2.xlsx
Figure 2 with 1 supplement
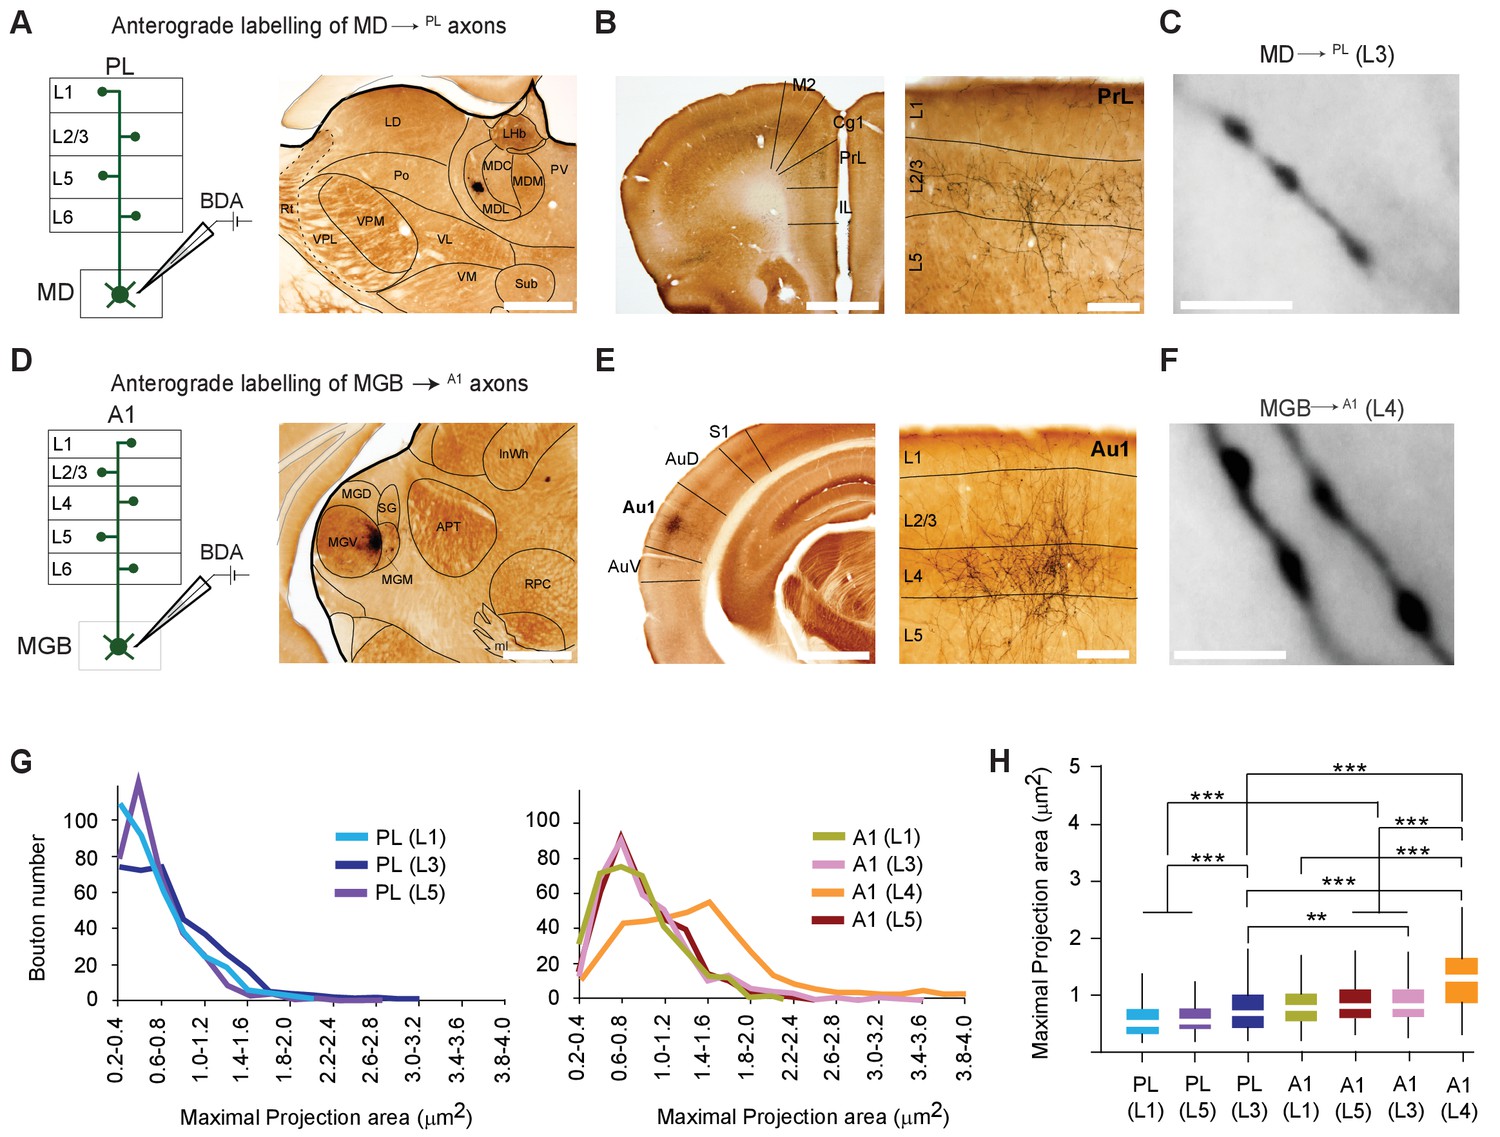
MD→PL axons establish smaller synaptic terminals than MGB→A1 projections.
(A) Schematic diagram of the iontophoretic injection protocol (left) and images of the center of a representative BDA deposit in the lateral MD (right) Scale bar = 500 µm. (B) Low magnification coronal section of the PL showing areal (left) and laminar (right) distribution of BDA-labeled MD→PL axons. (C) High-magnification images show smaller, more frequent MD→PL boutons in layer 3 of PL. Scale bar = 5 µm. (D) Schematics of iontophoretic injection protocol (left) and representative image of BDA deposit in the ventral MGB (right) Scale bar = 500 µm. (E) Low magnification coronal section of A1 showing areal (left) and laminar (right) distribution of BDA-labeled MGB→A1 axons. (F) High-magnification images show larger, less frequent MGB→A1 boutons in layer 4 of A1. Scale bar = 5 µm. (G) Distribution of thalamocortical axonal bouton sizes (maximal projection area, in µm²) in layers 1, 3 and 5 of PL (left chart) can be compared to that of bouton sizes in layers 1, 3, 4 and 5 of A1 (right chart). (H) Comparison of mean maximal projection areas (µm²) among MD→PL boutons (layers 1, 3 and 5) and MGB→A1 boutons (layers 1, 3, 4 and 5). (***p<0.001; Kruskal Wallis test with Dunn’s corrected multiple comparison; See Figure 2—source data 2). Data are plotted from BDA labeling experiments in N = 3 mice for each nucleus where 350 varicosities were measured per cortical layer (2450 varicosities in total).
-
Figure 2—source data 1
Maximal projection areas of BDA labeled boutons.
- https://cdn.elifesciences.org/articles/62554/elife-62554-fig2-data1-v2.xlsx
-
Figure 2—source data 2
p-values table for KS test and Dunn's corrected multiple comparisons post Kruskal Wallis test in Figure 2G, H.
- https://cdn.elifesciences.org/articles/62554/elife-62554-fig2-data2-v2.xlsx
Figure 2—figure supplement 1
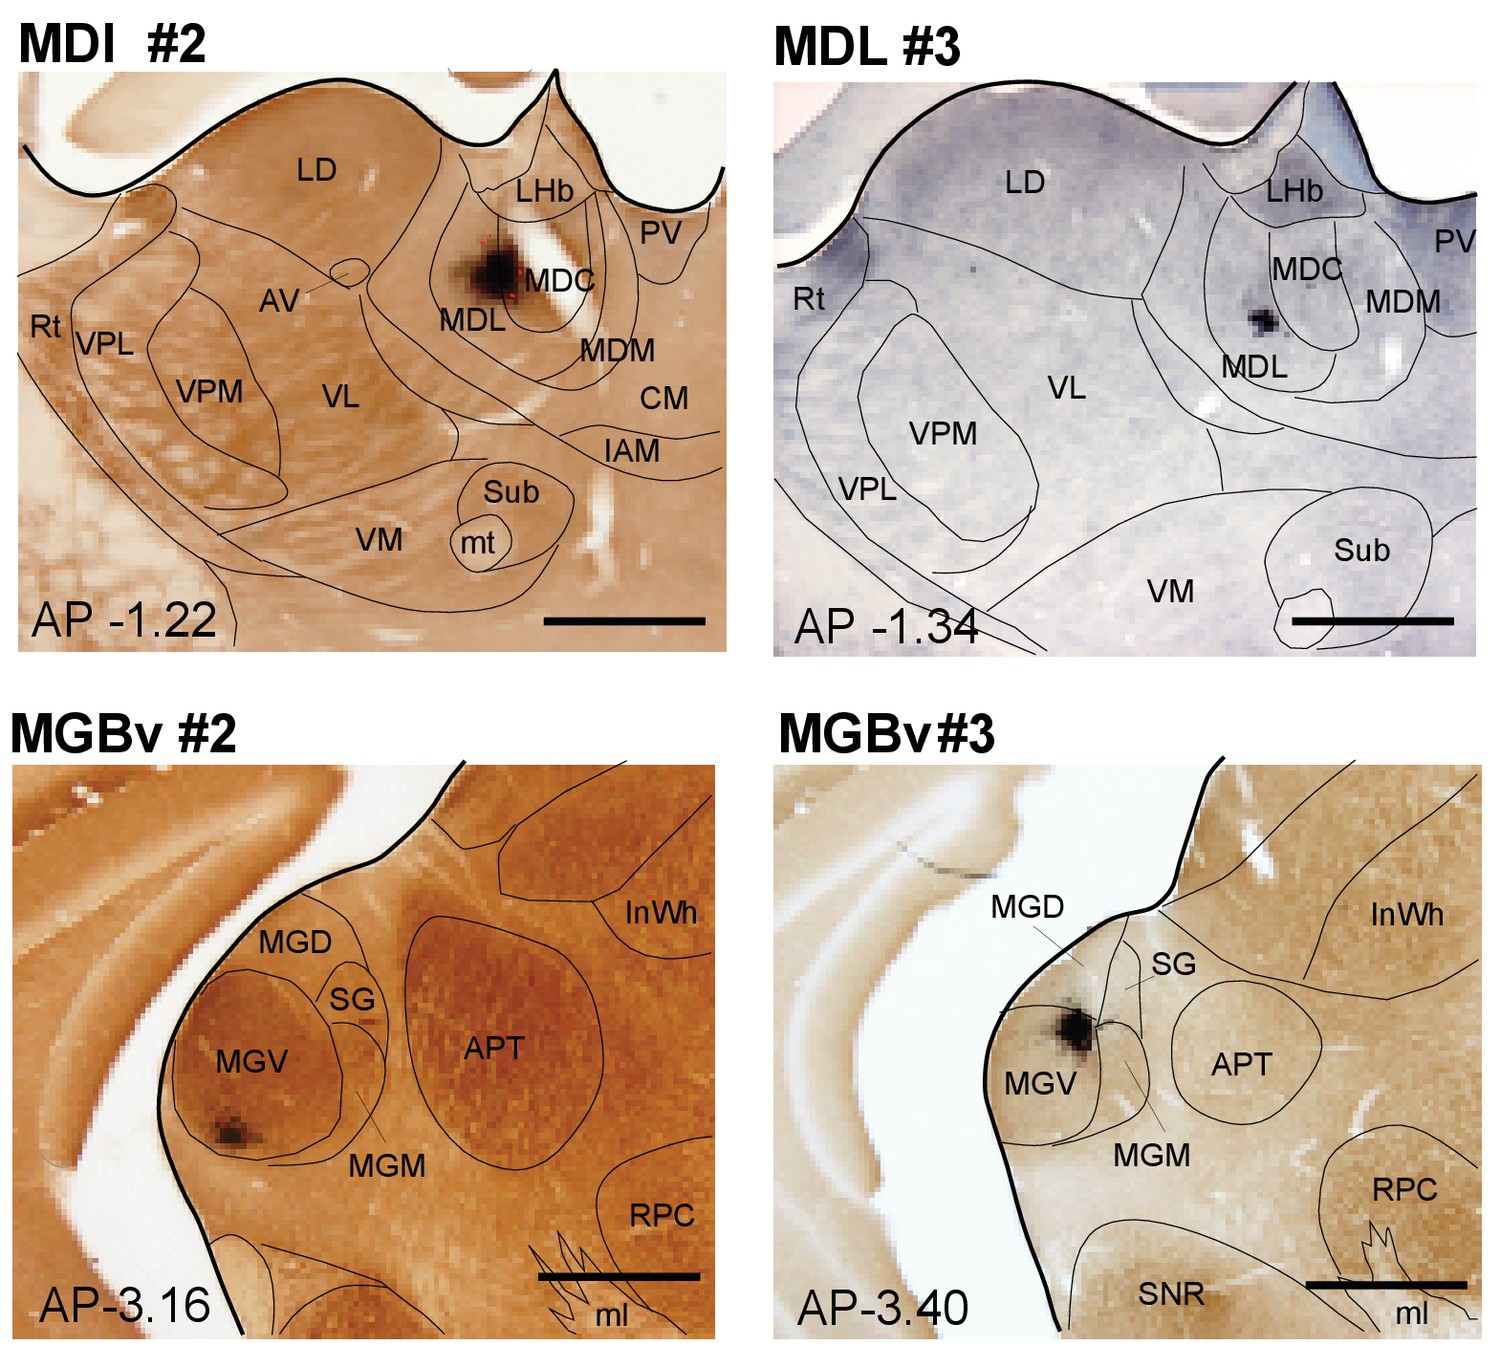
Images of BDA deposits in lateral MD and ventral MGB.
Counterstained with Cytochrome oxidase or thionin (case MDL #3). Scale bar = 500 µm.
Figure 3 with 3 supplements
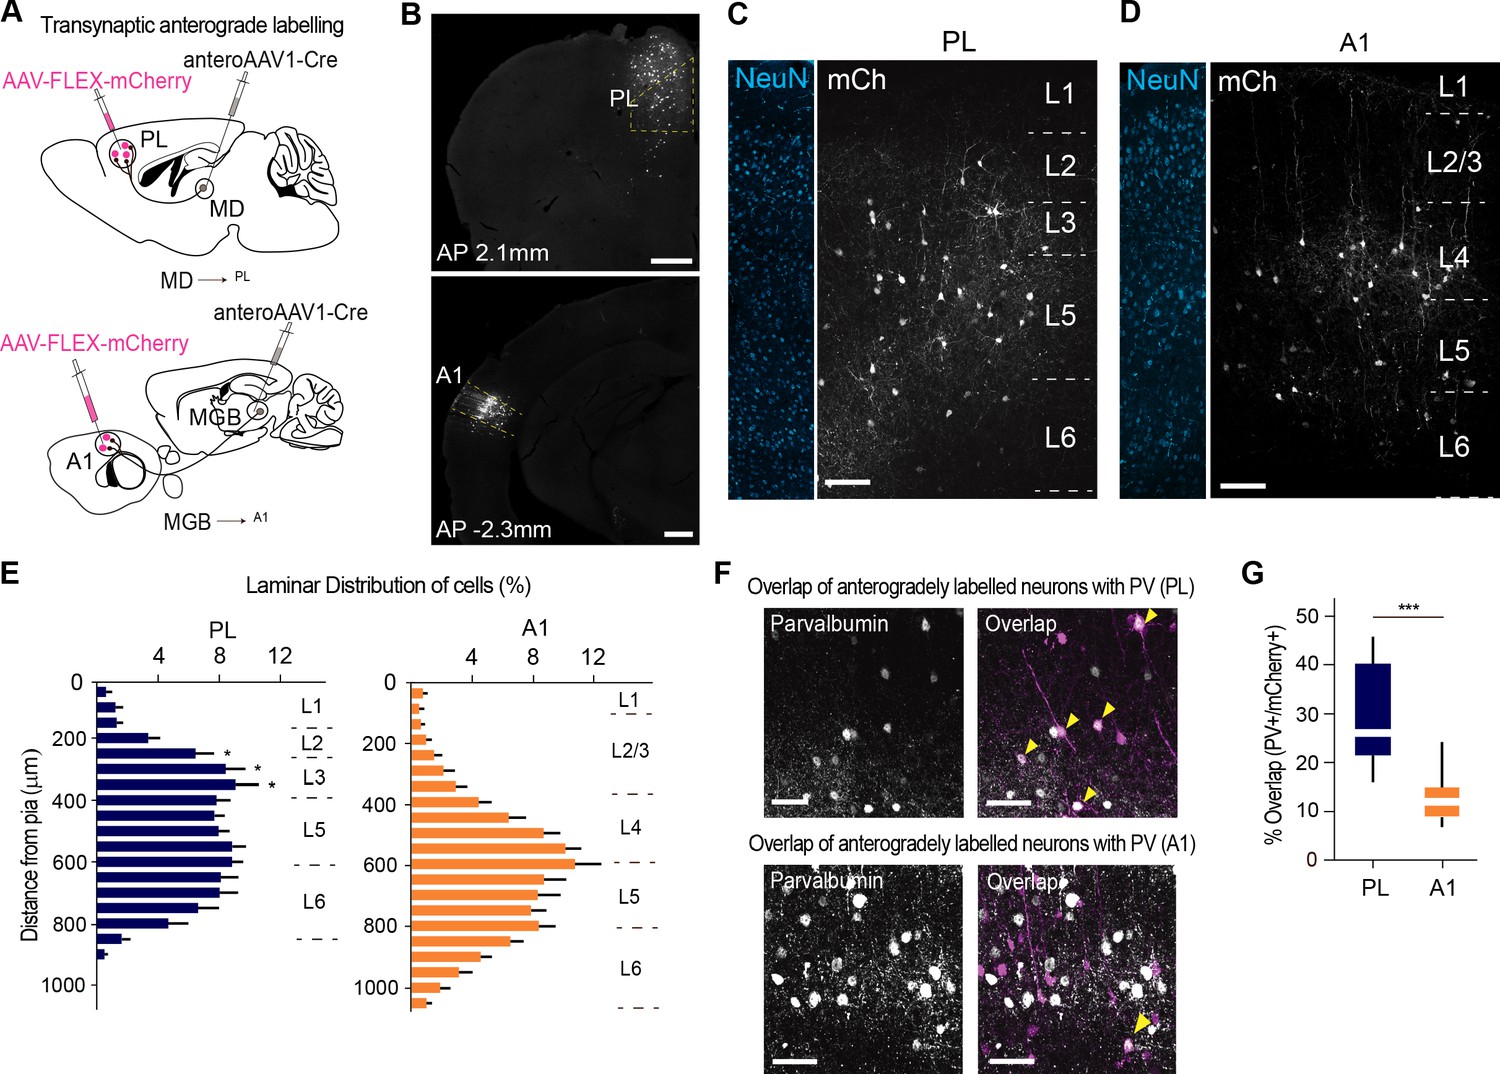
MD→PL projections contact a larger proportion of PV+ inhibitory neurons compared to MGB→A1 projections.
(A) Schematics of trans-synaptic anterograde labeling strategies for output targets of mediodorsal (top) and geniculate (bottom) thalamocortical cells. (B) Representative image of PL (top) and A1 (bottom) showing specificity of cortical injection site and trans-synaptic labeling. Scale bars = 500 µm. (C) Representative confocal images of PL neurons trans-synaptically labeled by the MD show labeling of output neurons across layers 2 to 5. Scale bar = 100 µm. (D) A1 neurons trans-synaptically labeled by the MGB primarily reside in layer 4. Scale bar = 100 µm. (E) Laminar distribution of trans-synaptically labeled cells in PL (left, blue) versus A1 (right, orange) quantitatively confirm the MD’s projections to PL are uniformly expressed across layers 2, 3, and 5, while the MGB’s projections to A1 mainly target layer 4. (***p<0.0001, Kruskal-Wallis test with Dunn’s corrected multiple comparison; p values for the significant differences are (from top to bottom) *p=0.0129, *p=0.0159, *p=0.0206) (F) Representative high-magnification images of immunohistochemically labeled parvalbumin neurons in PL (top panel, left), and their overlap with mCherry+ MD output neurons (top panel, right). Representative high magnification images of immunohistochemically labeled parvalbumin neurons in A1 (left) and their overlap with mCherry+ MGB output neurons (right) are shown in the bottom panel. Yellow arrowheads indicate co-labeled neurons. Scale bars = 50 µm. (G) Quantification of percentage of anterogradely labeled neurons which co express PV reveal significantly higher MD innervation of PV interneurons in the PL (blue) than MGB innervation to PV interneurons in A1 (orange) (***p=0.0004, Mann Whitney U test). Data is plotted from n = 3 sections per mouse and N = 4 mice for each condition.
-
Figure 3—source data 1
Laminar distribution of transsynaptic anterograde labeling and overlap with cortical PV+ neurons .
- https://cdn.elifesciences.org/articles/62554/elife-62554-fig3-data1-v2.xlsx
Figure 3—figure supplement 1
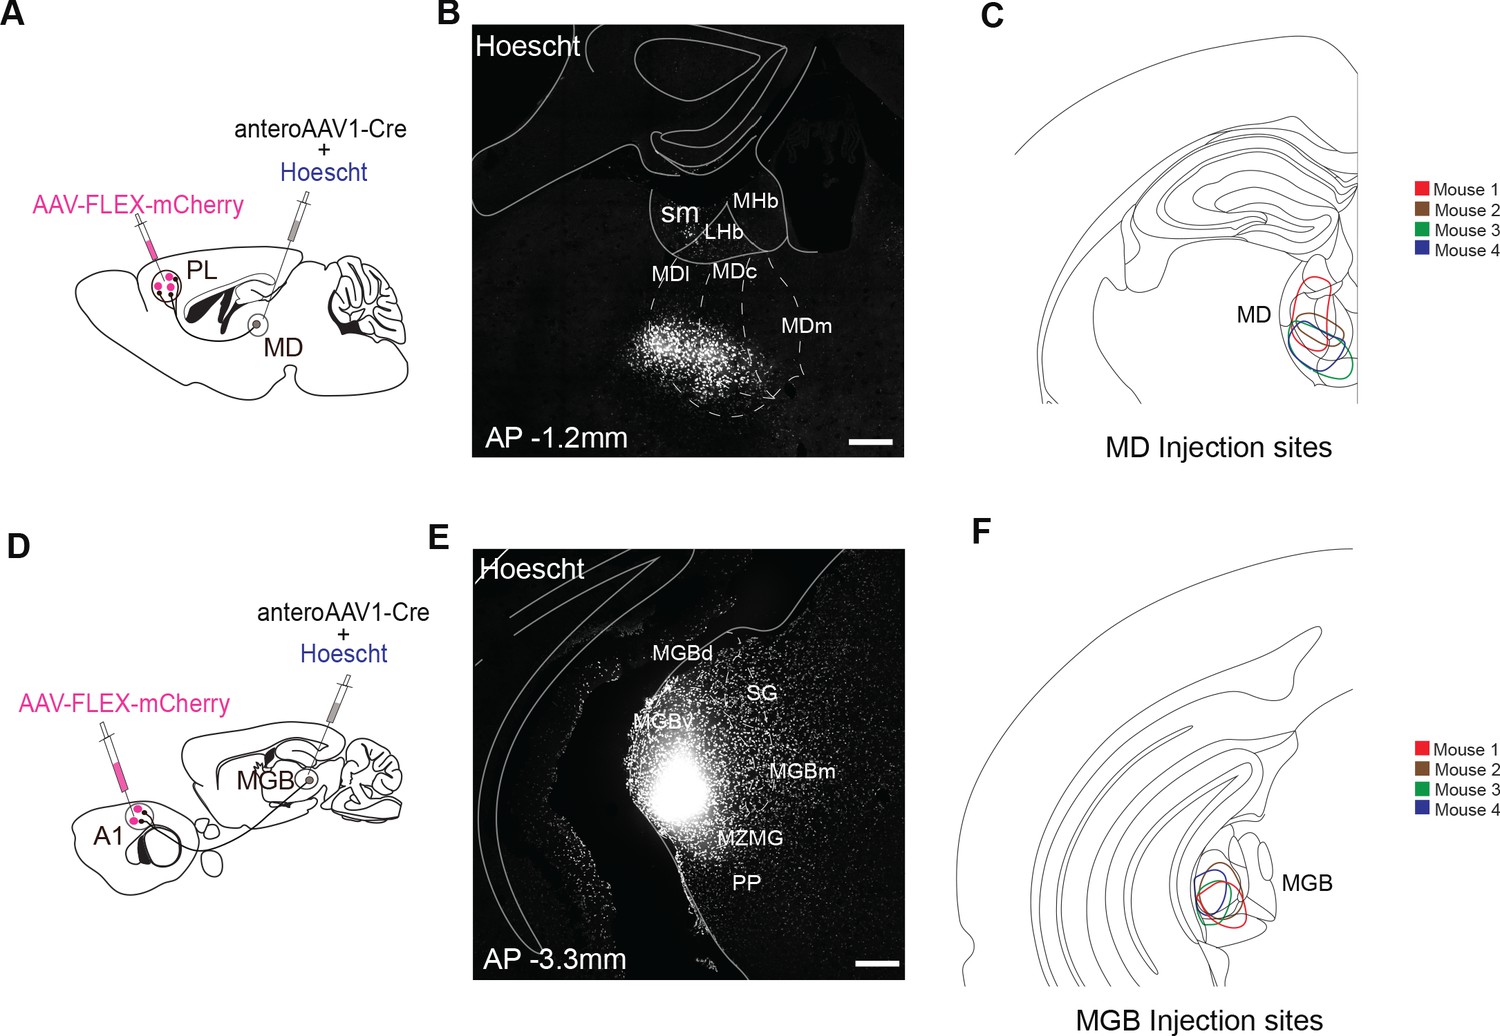
Schematics and injection sites of AAV1 mediated anterograde tracing.
(A) Schematic of anterograde tracing protocol of MD output neurons to PL. (B) Injection site of anterograde AAV1 expressing cre in MD marked by Hoescht333342. Scale bar = 200 µm. (C) Schematic of spread of Hoescht33342 in the MD of the four experimental animals used. (D) Schematic of anterograde-tracing protocol of MGB output neurons to A1. (E) Injection site of anterograde AAV1 expressing cre in MGB marked by Hoescht333342. Scale bar = 200 µm. (F) Schematic of spread of Hoescht33342 in the MGB of the four experimental animals used.
Figure 3—figure supplement 2
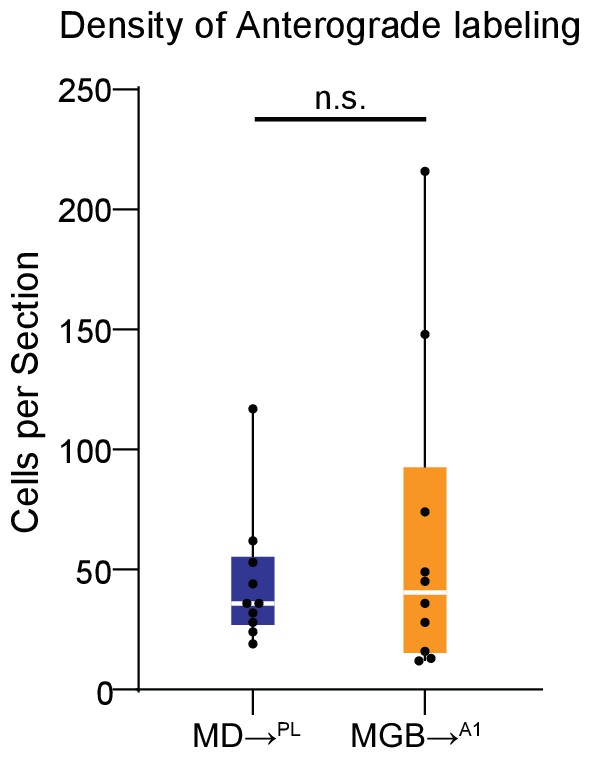
Anterograde transsynaptic labeling distributions in PL and A1.
Distribution of the number of mCherry+ neurons per section labeled by the anterograde AAV1-cre shows no significant difference between PL neurons labeled by the MD (blue) and A1 neurons labeled by the MGB (orange). (n.s., Mann Whitney U test). Data is plotted from N = 4 mice for each condition. Each solid black dot corresponds to one data point i.e. one section.
-
Figure 3—figure supplement 2—source data 1
Quantification of number of transynaptic anterograde neurons in PL vs A1.
- https://cdn.elifesciences.org/articles/62554/elife-62554-fig3-figsupp2-data1-v2.xlsx
Figure 3—figure supplement 3
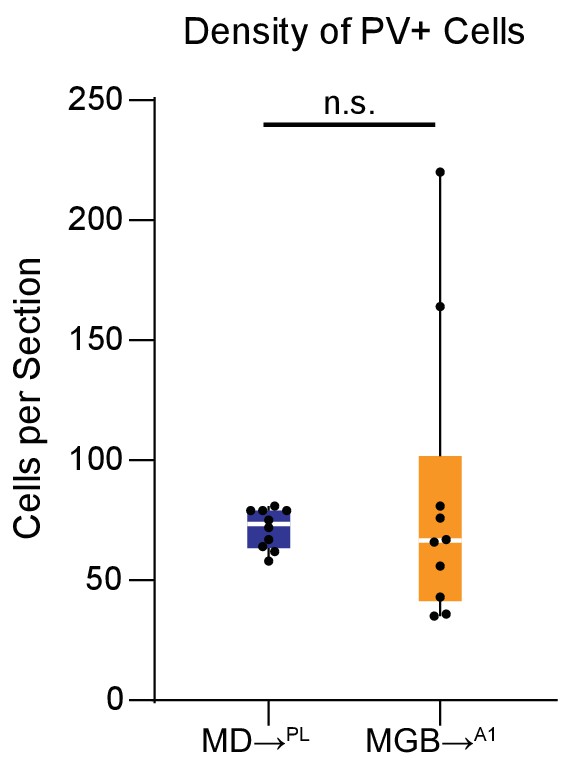
Immunolabeled PV positive neuron distribution in PL and A1.
Distribution of immunohistochemically labeled parvalbumin positive neurons in the PL (blue) versus A1 (orange) reveal no significant difference between the two cortices. (n.s., Mann Whitney U test). Data is plotted from N = 4 mice for each condition. Each solid black dot corresponds to one data point i.e. one section.
Figure 4 with 1 supplement
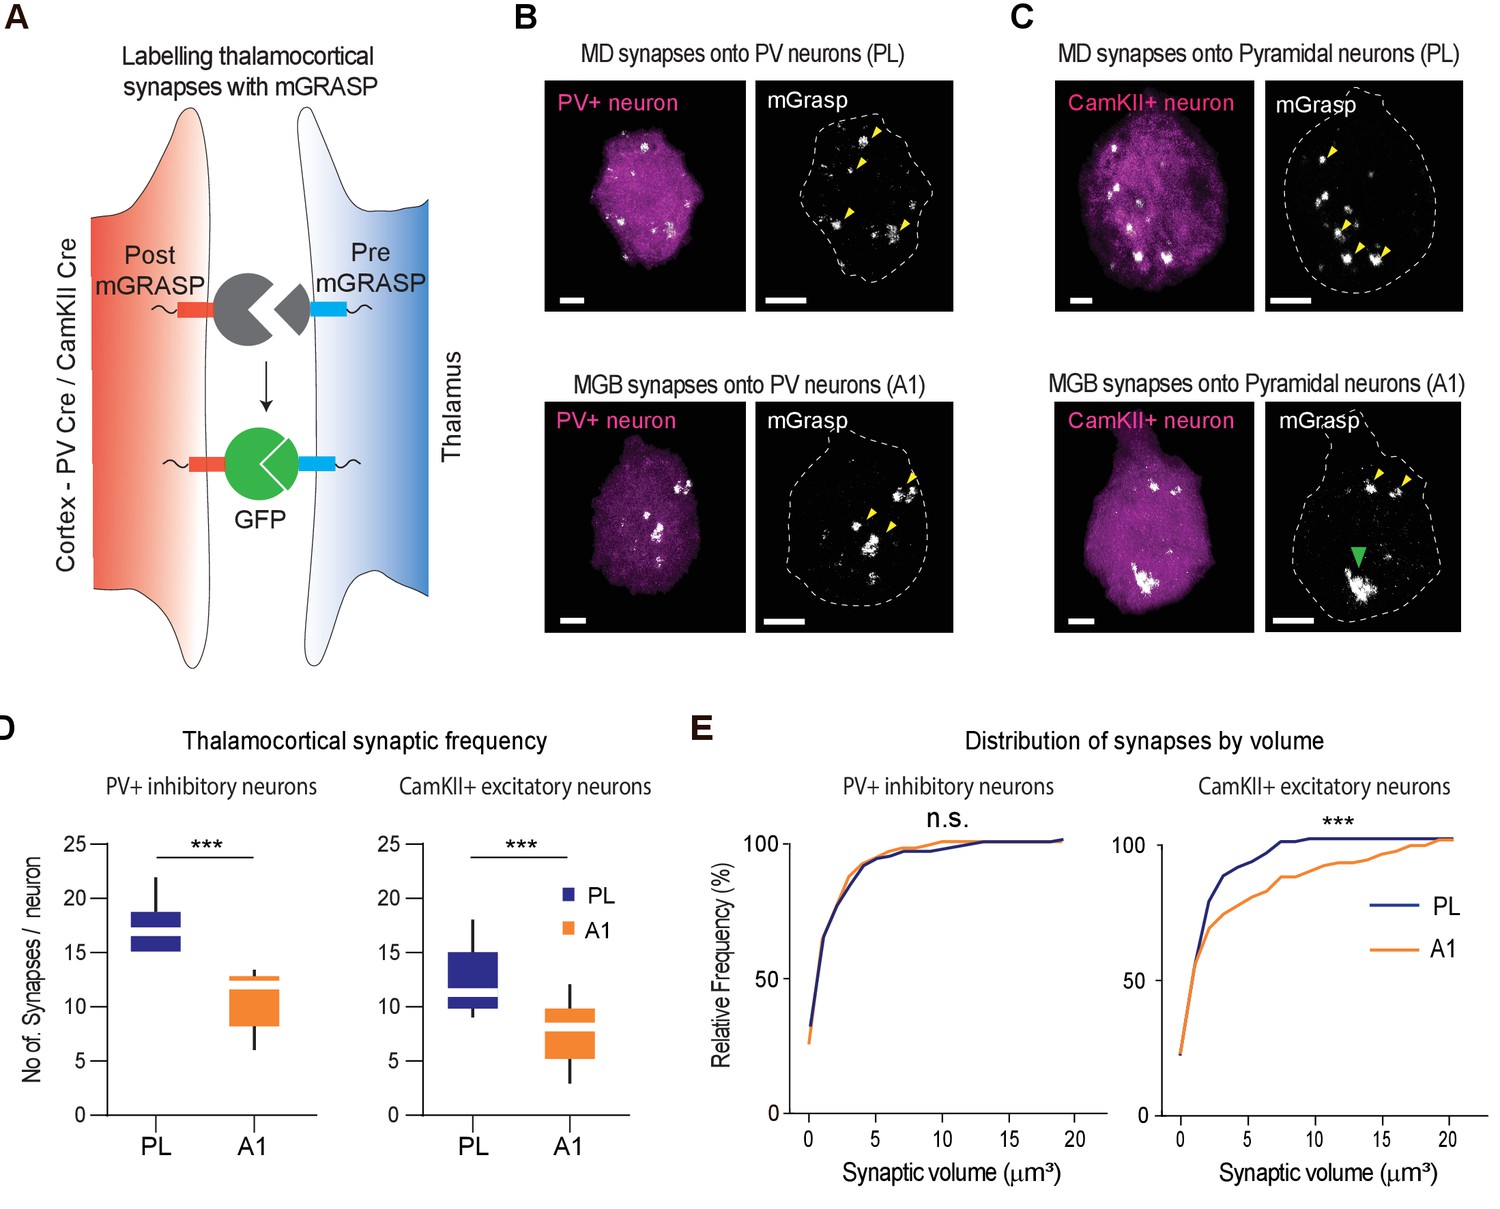
MGB→A1 neurons innervate excitatory cortical neurons with larger synaptic terminals compared to MD→PL neurons.
(A) Schematic of synaptic labeling mechanism using PV-Cre driver lines or CamKII-Cre virus to label inhibitory or excitatory synapses, respectively. (B) High magnification confocal image of a post-mGRASP labeled PV+ neuron (magenta) in the PL (top) and A1 (bottom) merged with synaptic labeling by mGRASP (white). Arrowheads indicate putative synapses. Scale bars = 3 µm. (C) High magnification confocal images of a post-mGRASP labeled CamKII+ neuron (magenta) in the PL (top) and A1 (bottom) merged with synaptic expression from mGRASP (white). Scale bars = 3 µm. (D) Quantification of thalamocortical synaptic frequency in PV+ inhibitory neurons (left), and CamKII+ excitatory neurons (right), shows the PL (blue) receives significantly higher frequency of thalamocortical synapses than A1 (orange). (***p<0.0001 for PV neurons, ***p<0.0001 for Pyramidal neurons, Mann Whitney U test). (E) Left: Cumulative frequency distribution of synapses by volume in PV+ inhibitory neurons show no significant difference of volume between the thalamocortical synapses in the PL (blue) and A1 (orange) (n.s., p=0.1703, Kolmogorov-Smirnov test). Right: Cumulative frequency distribution of synapses by volume in CamKII+ excitatory neurons show a significant difference in synaptic volume between thalamocortical synapses in PL (blue), and A1 (orange), with larger synapses on A1 excitatory neurons from MGB. (***p=0.0007, Kolmogorov-Smirnov test). Data is plotted from n = 40 individual PV+ and CamKII+ neurons each from N = 4 mice for each condition.
-
Figure 4—source data 1
Synaptic counts and volumes of mGRASP labeled synapses.
- https://cdn.elifesciences.org/articles/62554/elife-62554-fig4-data1-v2.xlsx
Figure 4—figure supplement 1
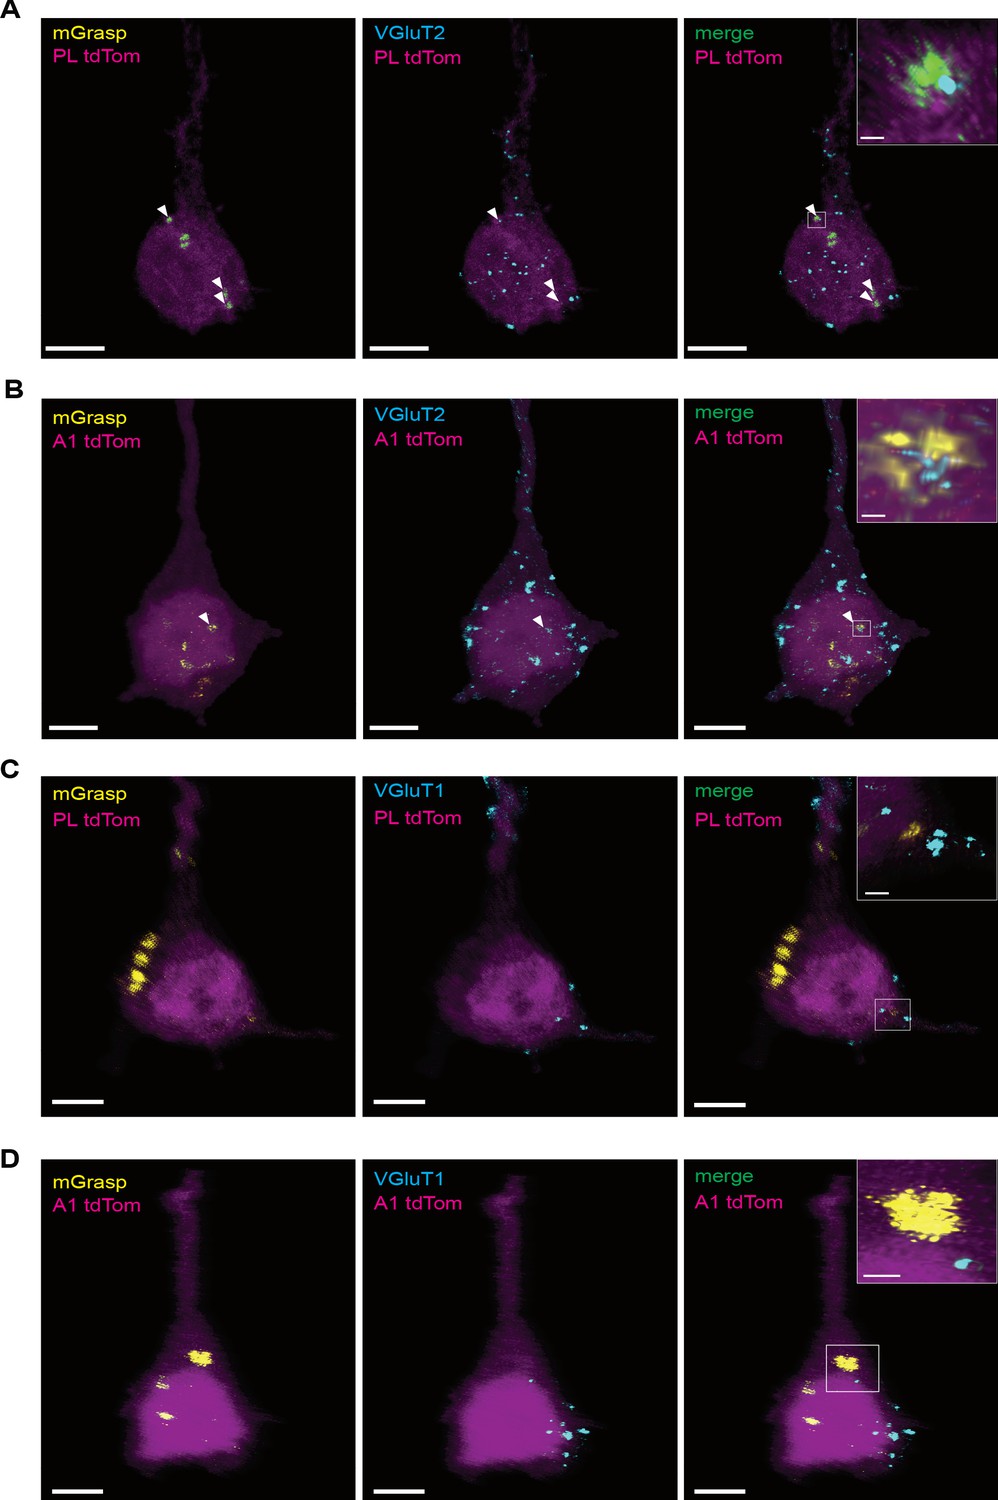
Overlap of mGRASP labeled synapses with vGlut1 and vGlut2.
(A) Representative image of a post-mGRASP labeled pyramidal neuron (magenta) in the PL with, MD→PL synapses labeled by mGRASP in yellow (left), immunohistochemical labelling of Vglut2+ synapses of thalamocortical origin in cyan (middle) and merged image of Vglut2 signal, and mGRASP signal (right; 27.23 ± 3.04% mean overlap). Arrowheads indicate putative VGlut2+ synapses labeled by mGRASP. Scale bar = 5 µm. Inset shows a zoomed in view of a co-labeled synapse. Scale bar = 1 µm. (B) Representative image of a post-mGRASP labeled pyramidal neuron (magenta) in the A1 with, MGB→A1 synapses labeled by mGRASP in yellow (left), immunohistochemical labelling of Vglut2+ synapses of thalamocortical origin in cyan (middle) and merged image of Vglut2 and mGRASP signal (right; 38.28 ± 5.99% mean overlap). Arrowheads indicate putative VGlut2+ synapses labeled by mGRASP. Scale bar = 5 µm Inset shows a zoomed in view of a co-labeled synapse. Scale bar = 1 µm. (C) Representative image of a post-mGRASP labeled pyramidal neuron (magenta) in the PL with, MD→PL synapses labeled by mGRASP in yellow (left), immunohistochemical labeling of Vglut1+ synapses of corticocortical origin in cyan (middle) and merged image of Vglut1 signal, and mGRASP signal (right; 4.04 ± 1.39% mean overlap). Arrowheads indicate putative VGlut1+ synapses labeled by mGRASP. Scale bar = 5 µm. Inset shows a zoomed in view of a co-labeled synapse. Scale bar = 1 µm. (D) Representative image of a post-mGRASP labeled pyramidal neuron (magenta) in the A1 with, MGB→A1 synapses labeled by mGRASP in yellow (left), immunohistochemical labeling of Vglut1+ synapses of corticocortical origin in cyan (middle) and merged image of Vglut1 signal, and mGRASP signal (right; 3.86 ± 1.99% mean overlap). Arrowheads indicate putative VGlut1+ synapses labeled by mGRASP. Scale bar = 5 µm. Inset shows a zoomed in view of a co-labeled synapse. Scale bar = 1 µm. Data is plotted from n = 5 neurons per animal from N = 2 mice for each condition.
-
Figure 4—figure supplement 1—source data 1
Quantification of overlap of mGRASP labeled synapses with vGluT1 and vGluT2.
- https://cdn.elifesciences.org/articles/62554/elife-62554-fig4-figsupp1-data1-v2.xlsx
Figure 5 with 3 supplements
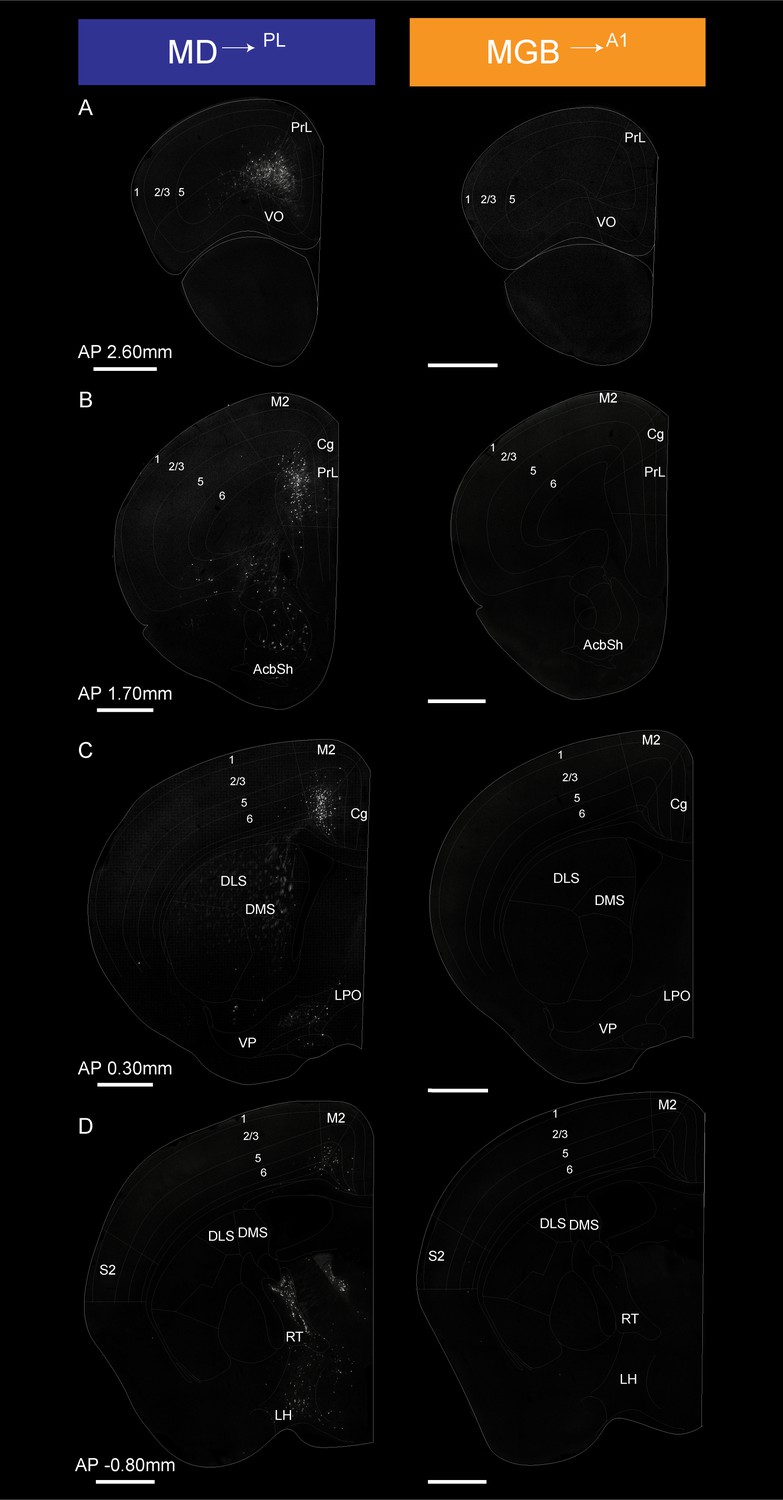
Detailed map of retrograde inputs to geniculate microcircuit compared to mediodorsal microcircuit (Anterior half, AP 2.60 mm to −0.80 mm).
(A–D) Representative confocal images of monosynaptic inputs MD→PL neurons (left) and MGB→A1 neurons (right) across the rostro-caudal axis illustrate distinct input patterns in each microcircuit. Distance from bregma appears between each pair of images. N = 5 mice for each condition. Scale bars = 1 mm.
Figure 5—figure supplement 1
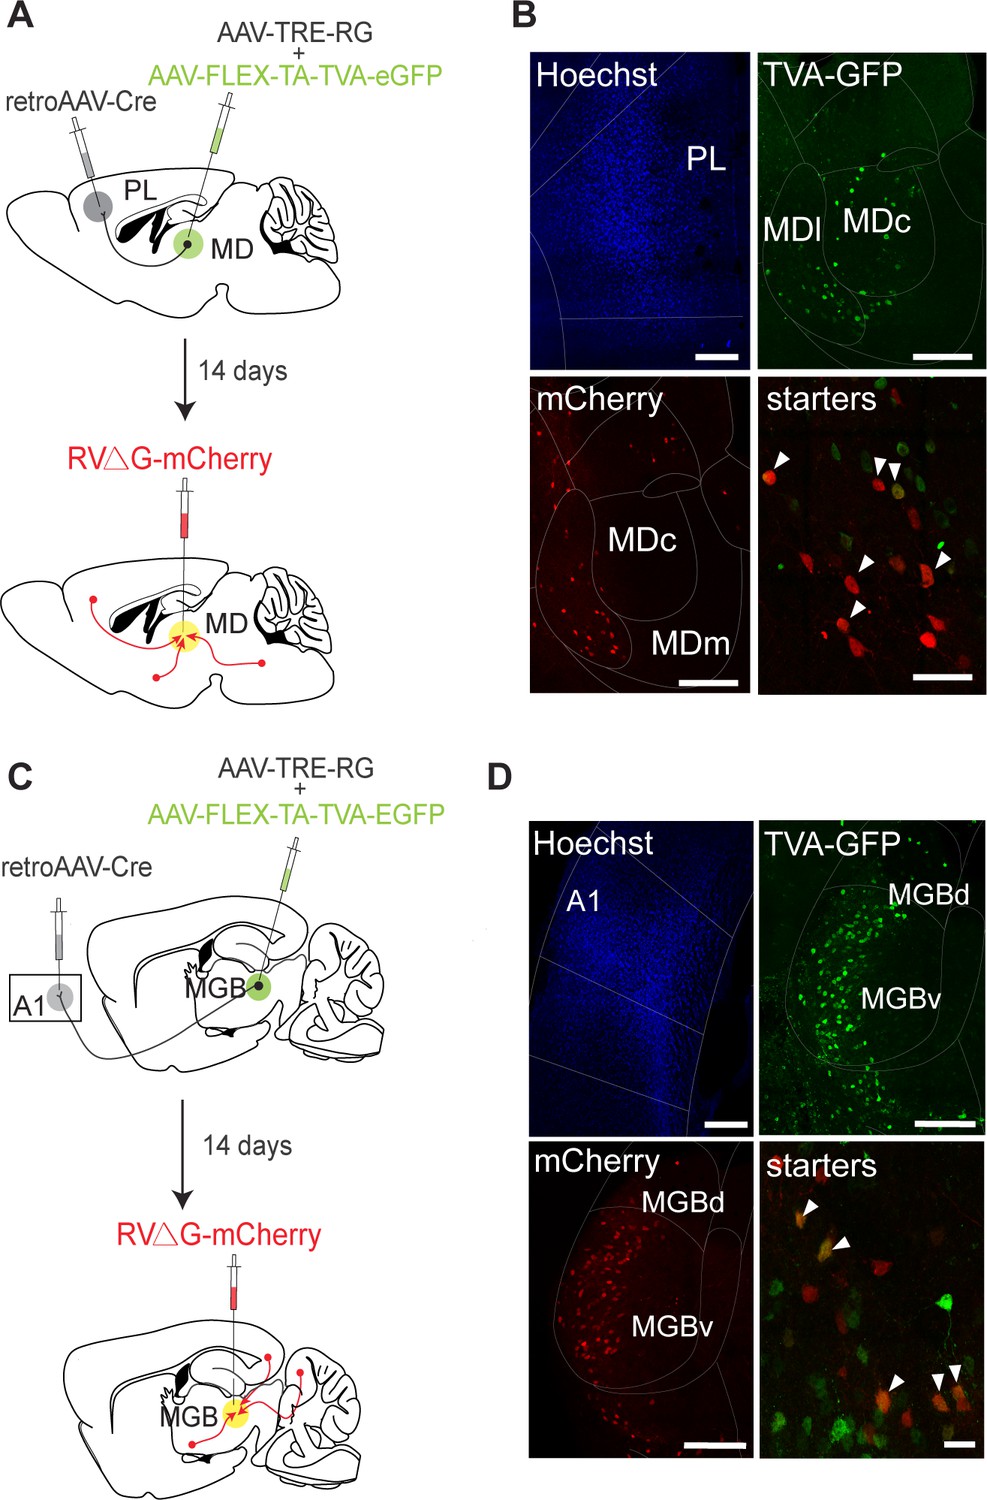
Monosynaptic retrograde tracing from MD→PL and MGB→A1 neurons.
(A) Schematic of monosynaptic input tracing protocol of MD→PL neurons. (B) Top-left: Injection site of retrograde AAV expressing cre in PL marked by Hoescht333342. Top-right: Helper virus expression (shown in green). Bottom-left: Rabies virus expression (shown in red) in the MD. Bottom-right: Starter neurons in MD co-expressing GFP and mCherry. White arrowheads indicate co-labeled neurons. (C) Schematic of monosynaptic input-tracing protocol of A1 projecting MGB neurons. (D) Top-left: Injection site of retrograde AAV expressing cre in A1 marked by Hoescht 333342. Top-right: Helper virus expression (shown in green). Bottom-left: Rabies virus expression (shown in red) in the MGB. Bottom-right: Starter neurons in MGB co-expressing GFP and mCherry. White arrowheads indicate co-labeled neurons.
Figure 5—figure supplement 2
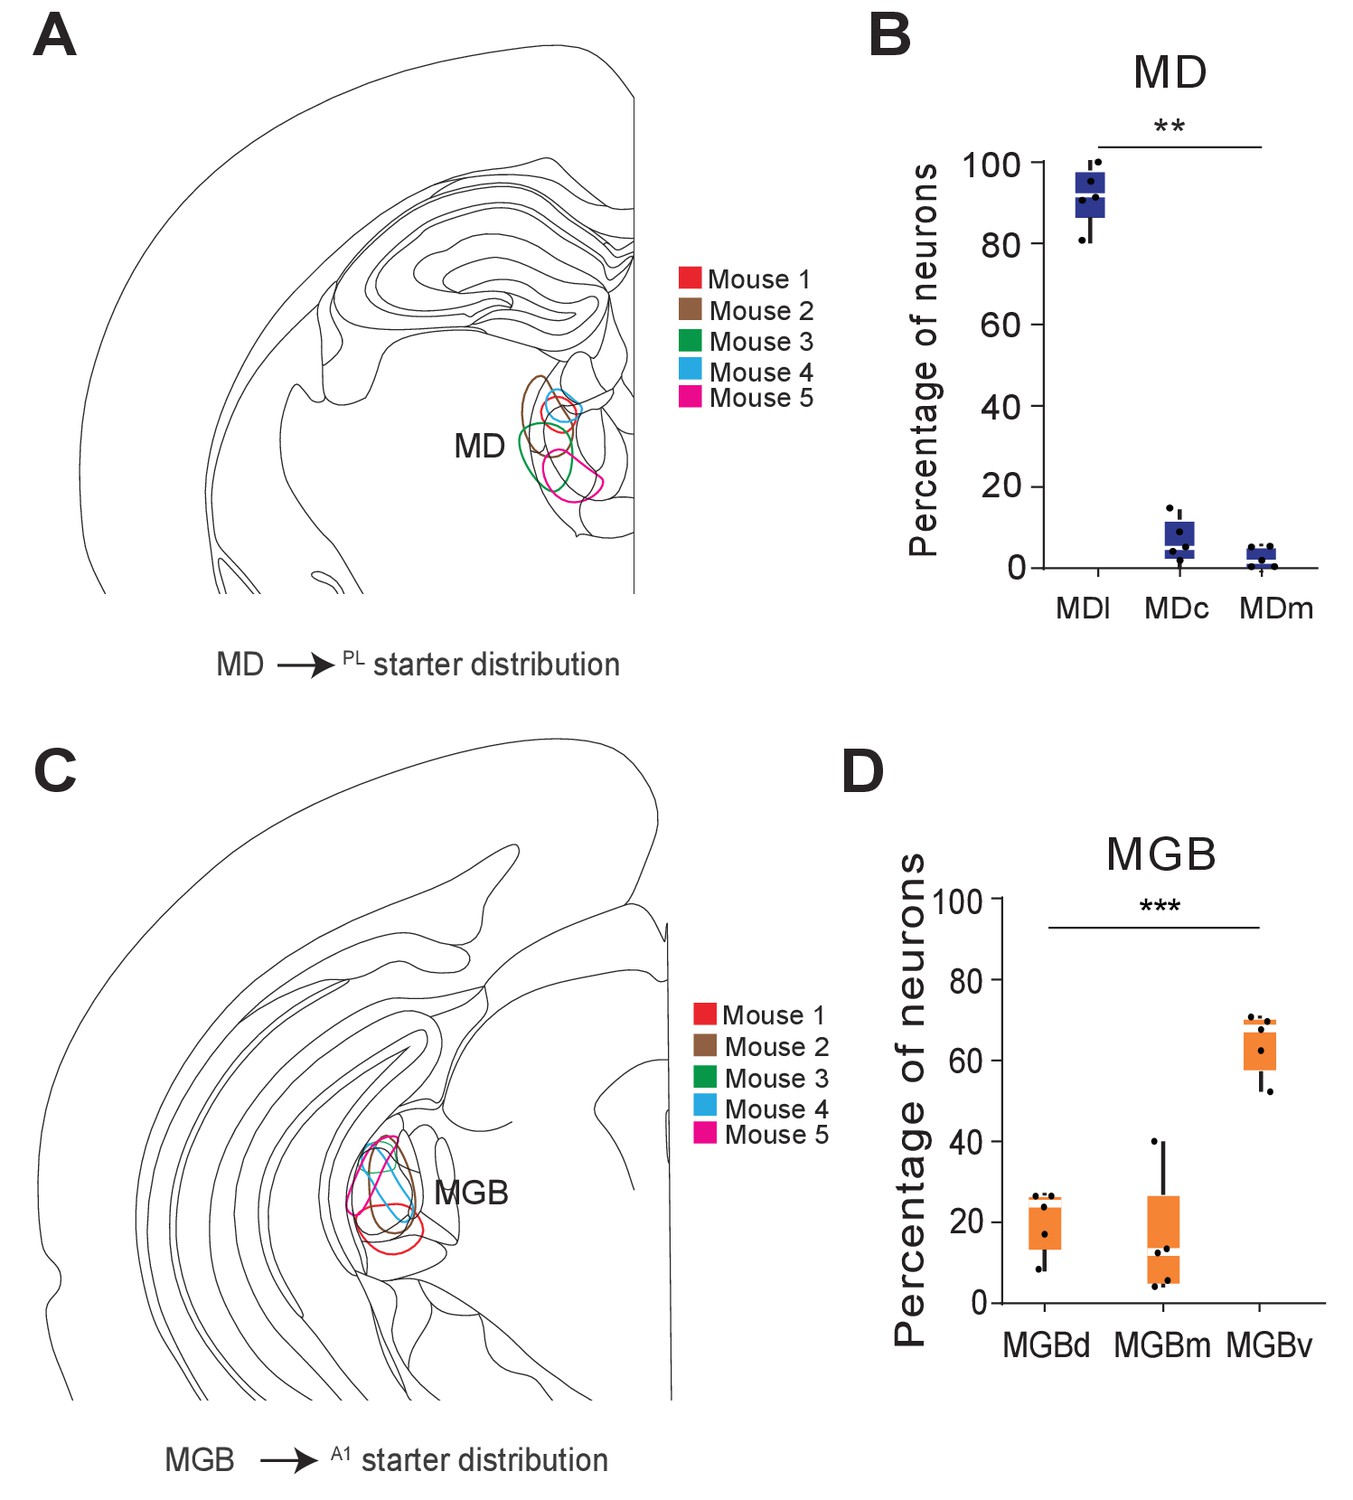
Distribution of starters for monosynaptic retrograde tracing from MD→PL and MGB→A1 neurons.
(A) Schematic of starter population distribution across individual animals in the MD (B) Fraction of starter neurons in the thalamus show predominant expression in the lateral MD compared to the central or medial division (**p=0.001, Kruksal-Wallis test). Each solid black dot corresponds to one data point that is one section. (C) Schematic of starter population distribution across individual animals in the MGB. (D) Fraction of starter neurons in the MGB show significantly biased expression in the ventral division of the MGB, compared to the dorsal or medial divisions (***p=0.0009, Kruksal-Wallis test). Each solid black dot corresponds to one data point that is one animal. Scale bars = 200 µm (left and middle), 50 µm (right). Data is plotted from N = 5 mice for each condition.
-
Figure 5—figure supplement 2—source data 1
Starter counts for monosynaptic retrograde tracing with rabies viruses.
- https://cdn.elifesciences.org/articles/62554/elife-62554-fig5-figsupp2-data1-v2.xlsx
Figure 5—figure supplement 3
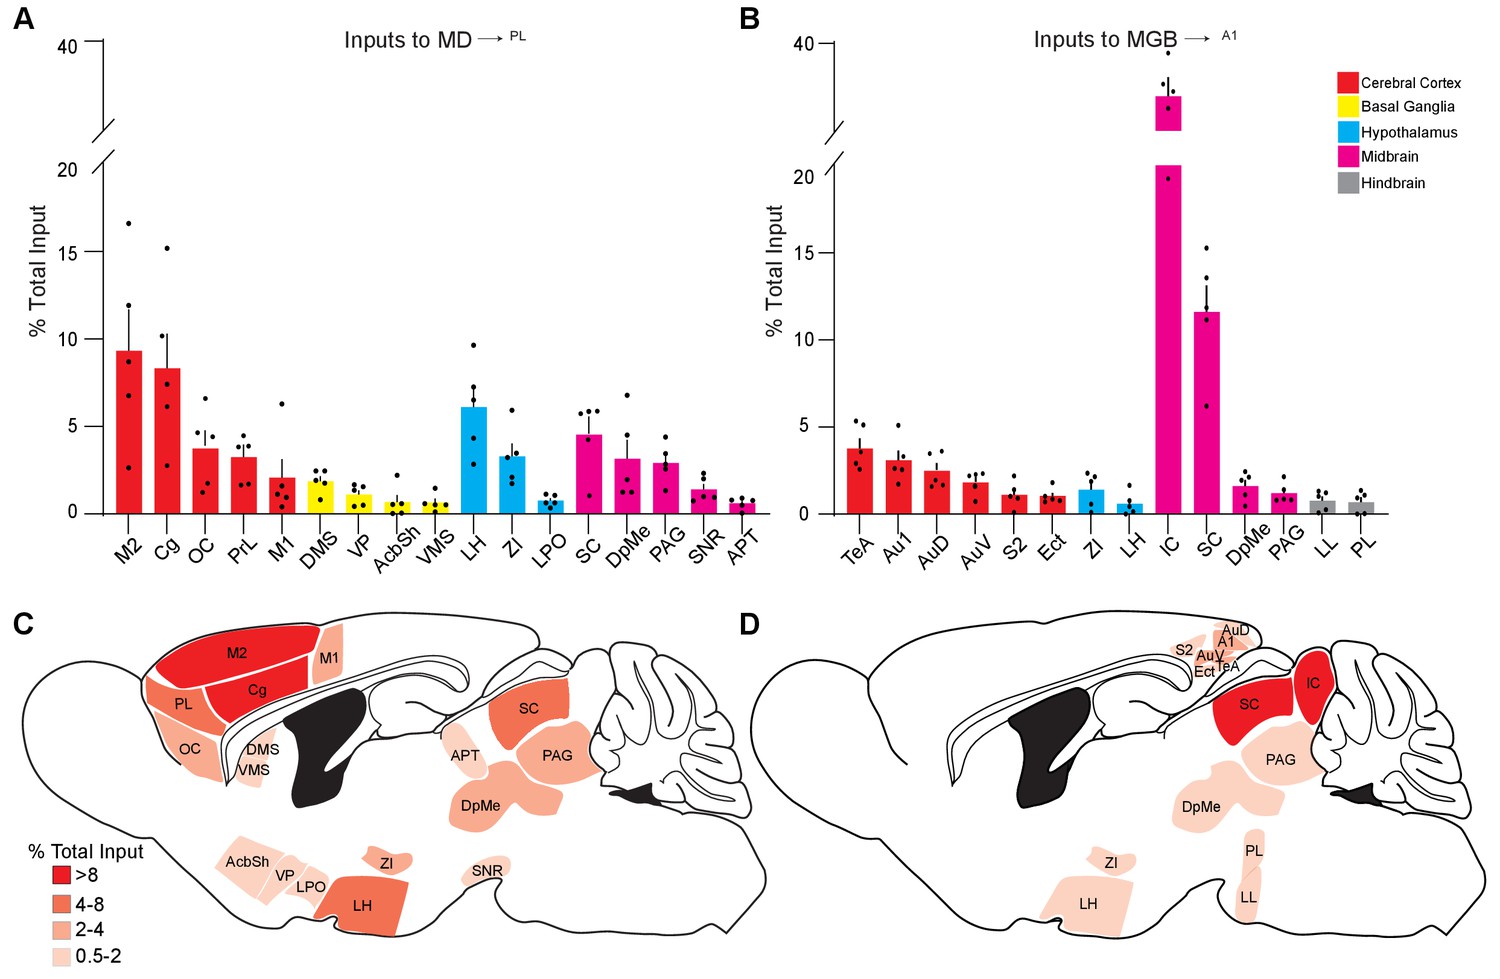
Quantitative summary of retrograde monosynaptic input tracing from MD→PL and MGB→A1 neurons.
(A, B) Significant inputs (>0.5% total input) to MD→PL (A) and MGB→A1 (B) thalamic neurons measured from different brain regions. (c, d) Sagittal schematic of inputs to MD→PL (C) and MGB→A1 (D). Shading in red corresponds to contribution towardsproportion of total input. Each solid black dot corresponds to one data point that is one animal. Data is plotted from N = 5 mice for each condition.
-
Figure 5—figure supplement 3—source data 1
Retrograde inputs to MD vs MGB expressed as a percentage of total inputs.
- https://cdn.elifesciences.org/articles/62554/elife-62554-fig5-figsupp3-data1-v2.xlsx
Figure 6
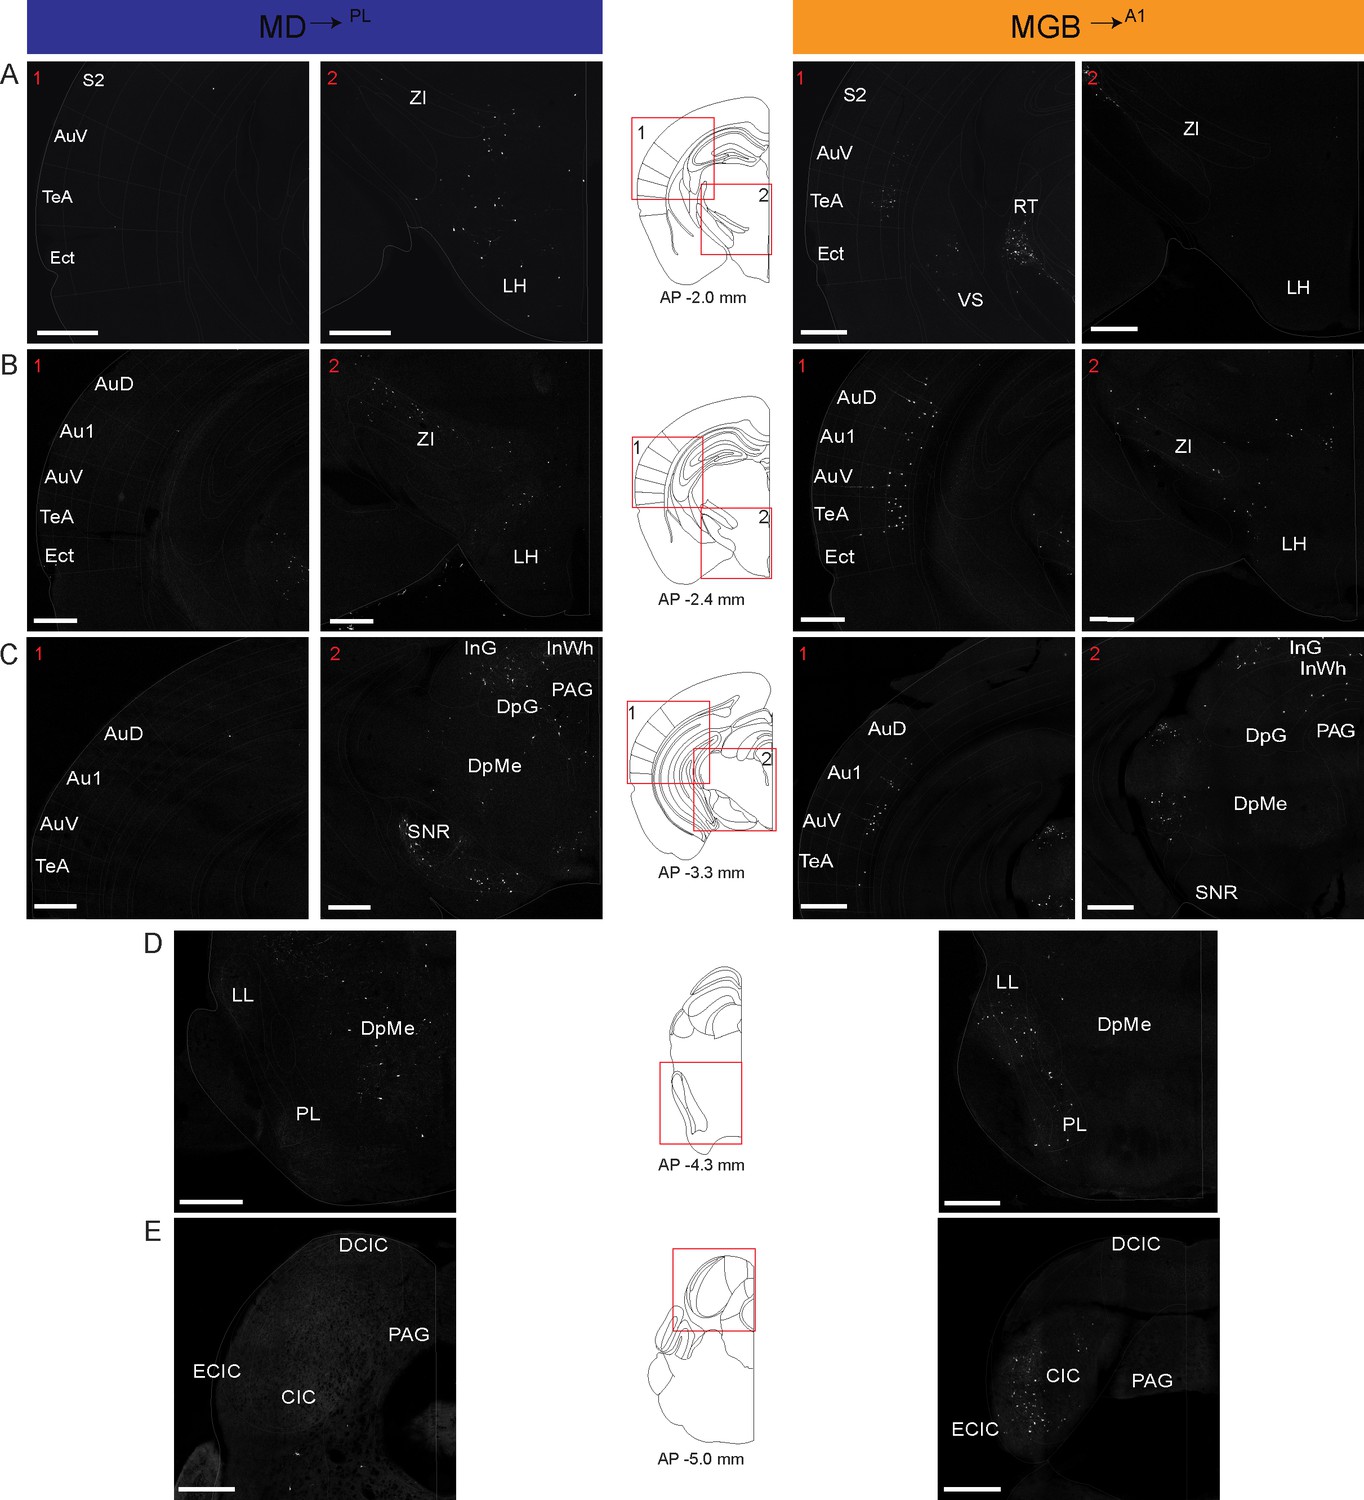
Detailed map of retrograde inputs to geniculate microcircuit compared to mediodorsal microcircuit (Rostral half, AP 2.60 mm to −0.80 mm).
(A–E) Representative confocal images of monosynaptic inputs to inputs MD→PL neurons (left) and MGB→A1 neurons (right) across the rostro-caudal axis illustrate distinct input patterns in each microcircuit. Distance from bregma appears beneath the corresponding unified anatomical atlas (Chon et al., 2019) section shown (middle). Regions showed are depicted as numbered (A–C) red boxes on each corresponding atlas section for reference. N = 5 mice for each condition. Scale bars = 500 µm.
Figure 7 with 1 supplement
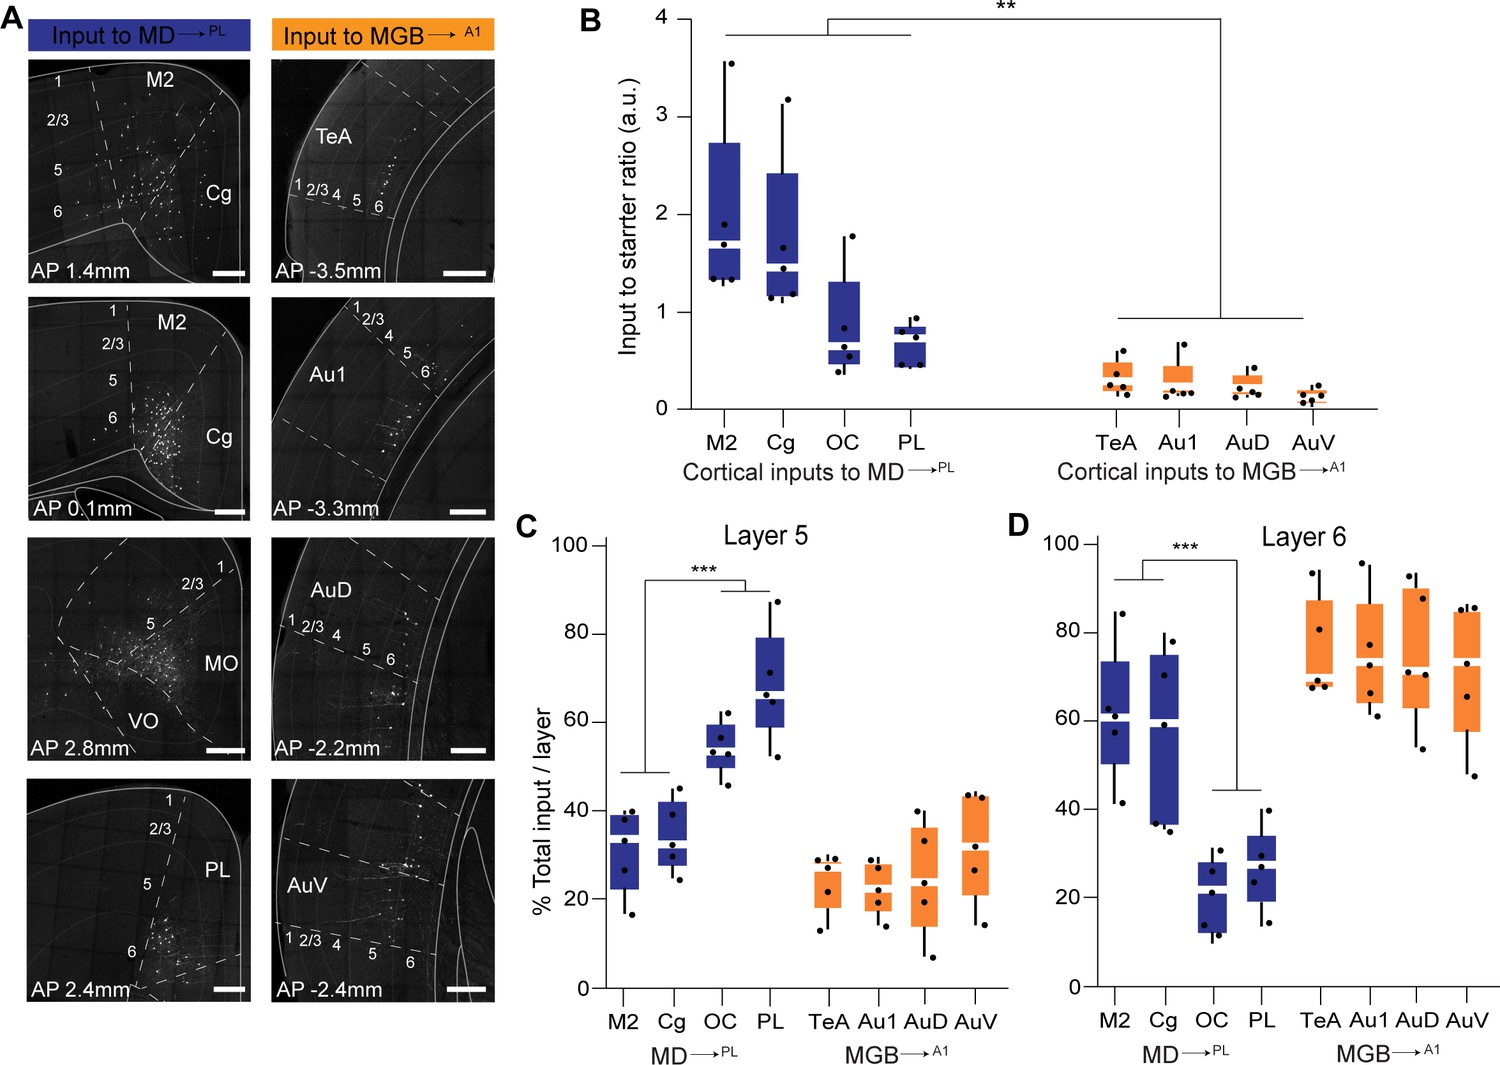
Representation and quantification of inputs to the mediodorsal microcircuit compared to the geniculate microcircuit.
(A) Representative images of major cortical inputs to MD→PL loop (left) versus MGB→A1 (right). Scale bars = 200 µm. (B) Quantification of input to starter ratios for each major cortical input region to MD→PL neurons (left, blue) versus MGB→A1 neurons (right, orange) reveal significantly denser cortical inputs per thalamic neuron in the MD→PL loop compared to the MGB→A1 loop (**p=0.0079; Mann Whitney U test with all cortical inputs to MD→PL neurons treated as one group and compared to all cortical inputs to MGB→A1neurons). Each solid black dot corresponds to one data point that is one animal (C) Contribution of layer five neurons to the net cortical input from each major cortical region to MD→PL neurons (left, blue) versus MGB→A1 neurons (right, orange) reveal significantly higher layer five inputs from the OC and PL than those from M2 and Cg to the MD→PL neurons (**p<0.0001; Mann Whitney U test with all layer 5 cortical inputs to MD→PL neurons arising from M2 and Cg treated as one group and compared to all cortical to MD→PL neurons arising from OC and PL). Layer 5 inputs to MGB→A1 neurons constitute only a minor fraction of their cortical inputs. Each solid black dot corresponds to one data point i.e. one animal. (D) Contribution of layer 6 neurons to the net cortical input from each major cortical region to MD→PL neurons (left, blue) versus MGB→A1 neurons (right, orange) reveal a predominant layer 6 input from all major cortical input regions to the MGB→A1 loop. Of all major cortical inputs to MD→PL neurons, the M2 and Cg provide significantly higher layer six input than the OC and PL (***p=0.0004; Mann Whitney U test with all layer five cortical inputs to MD→PL neurons arising from M2 and Cg treated as one group and compared to all cortical to MD→PL neurons arising from OC and PL). Each solid black dot corresponds to one data point that is one animal. Data is plotted from N = 5 mice for each condition.
-
Figure 7—source data 1
Retrograde monosynaptic labeling input counts, input to starter ratios and layerwise distribution of inputs.
- https://cdn.elifesciences.org/articles/62554/elife-62554-fig7-data1-v2.xlsx
Figure 7—figure supplement 1
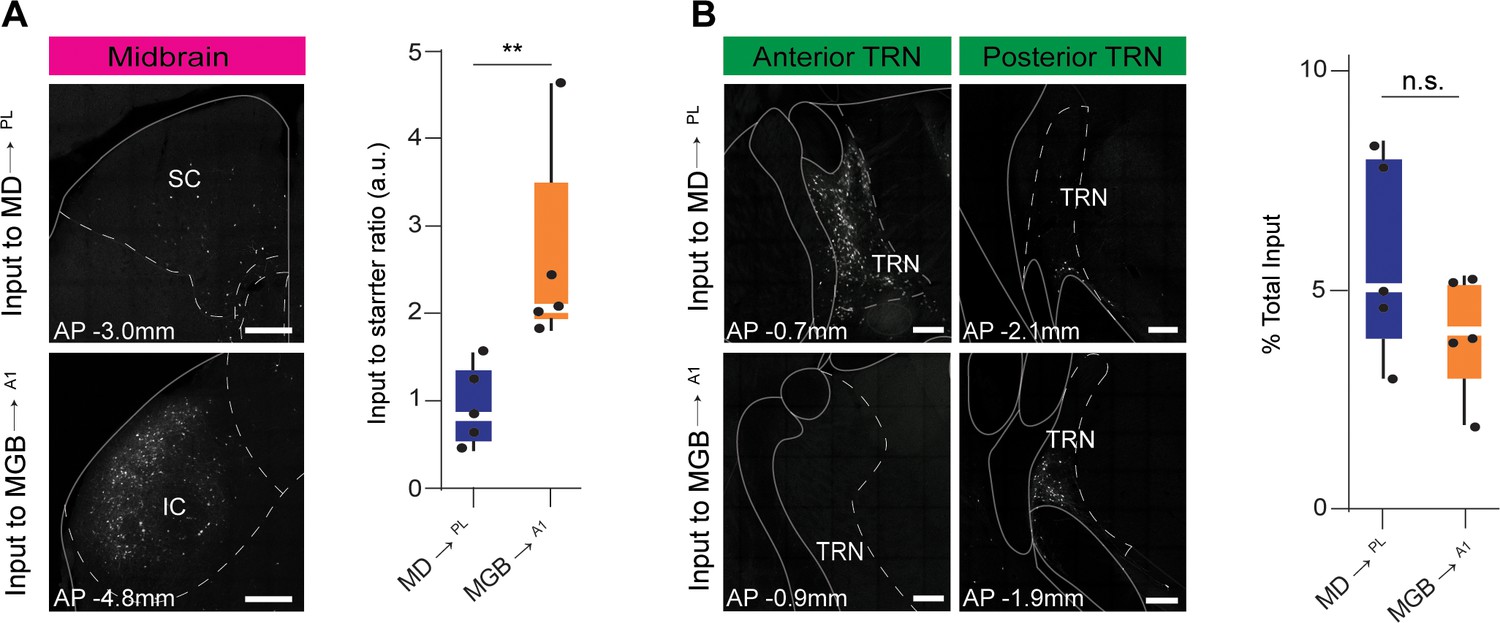
Mid brain to starter ratios and TRN inputs to MD→PL and MGB→A1 neurons.
(A) Left: Representative confocal image of the major midbrain input to MD→PL neurons (top), and MGB→A1 neurons (bottom). Right: Quantification of input to starter ratio reveals higher number of midbrain inputs per starter in MGB→A1 neurons (orange) than in MD→PL neurons (blue). (**p=0.0079, Mann Whitney U test). Each solid black dot corresponds to one data point i.e. one animal (B) Left: Representative confocal image of anterior TRN inputs MD→PL neurons (top) versus MGB→A1 neurons (bottom). Middle: Representative confocal image of posterior TRN inputs to MD→PL neurons (top) versus MGB→A1 neurons (bottom). Right: Quantification of the fraction of total TRN input to the MD→PL neurons (blue) show no significant difference from total TRN input to MGB→A1 neurons (orange) (n.s., p=0.4206, Mann Whitney U test). Each solid black dot corresponds to one data point that is one animal. Data is plotted from N = 5 mice for each condition. Scale bars = 200 µm.
Tables
Key resources table
| Reagent type (species) or resource | Designation | Source or reference | Identifiers | Additional information |
|---|---|---|---|---|
| Antibody | Anti-GFP antibody (chicken polyclonal) | Aves Labs | GFP1010 RRID:AB_2307313 | (1:1000) |
| Antibody | Alexa Fluor 488 goat anti-chicken IgG (goat polyclonal) | Thermo Fisher Scientific | A32931 RRID:AB_2762843 | (1:500) |
| Antibody | Rabbit anti-PV (rabbit polyclonal) | Swant | PV-27 RRID:AB_2631173 | (1:1000) |
| Chemical compound, drug | BDA (10 KDa) | Thermo Fisher Scientific | D1956 | 3% solution |
| Chemical compound, drug | Hoechst 33342 | Thermo Fisher Scientific | H3570 | 1:1000 solution |
| Software, algorithm | ImageJ | NIH | ||
| Software, algorithm | Imaris | Oxford Instruments | Version 9.3.2 | |
| Software, algorithm | Prism 8 | Graphpad | Version 8.0 | |
| Other | EnvA-RVdG-mCherry | Gift; Dr. Ian Wickersham, MIT Chatterjee et al., 2018 | Rabies virus expressing mCherry | |
| Other | AAV1-TREtight-B19G | Gift; Dr. Ian Wickersham, MIT Chatterjee et al., 2018 | AAV expressing B19 variant of G protein | |
| Other | AAV1-syn-FLEX-TA-TVA-GFP | Gift; Dr. Ian Wickersham, MIT Chatterjee et al., 2018 | AAV expressing cre dependent TVA, tTA, and GFP | |
| Other | AAV2/8-CAG-pre-mGRASP-mCerulean | Gift; Dr. Michael Baratta, Univ. of Colorado | N.A. | AAV expressing pre-mGRASP and mCerulean |
| Other | AAV2/8.CAG.Jx-rev.post-mGRASP-2A-dTomato | Gift; Dr. Michael Baratta, Univ. of Colorado | N.A. | AAV expressing cre dependent post-mGRASP and tdTomato |
| Other | AAVrg-hSyn-Cre-WPRE-hGH (retrograde) | Addgene Vector Core | Lot#: 105553-AAVrg | AAV expressing cre recombinase |
| Other | AAV1-hSyn-Cre-WPRE-hGH | Addgene Vector Core | Lot#: 105553-AAV1 | AAV expressing cre recombinase |
| Other | AAV1-pCAG-FLEX-tdTomato-WPRE | Addgene Vector Core | Lot# 51503 | AAV expressing cre dependent tdTomato |
| Other | AAV1-CamKIIa-SSFO-GFP | UNC vector core | N.A. | AAV expressing SSFO and GFP under CamKII promoter |
| Other | pENN-AAV-CamKII-0.4.-Cre-SV40 | Addgene Vector Core | Lot#: 105540 | AAV expressing cre under CamKII promoter |
Additional files
Download links
A two-part list of links to download the article, or parts of the article, in various formats.
Downloads (link to download the article as PDF)
Open citations (links to open the citations from this article in various online reference manager services)
Cite this article (links to download the citations from this article in formats compatible with various reference manager tools)
Variation of connectivity across exemplar sensory and associative thalamocortical loops in the mouse
eLife 9:e62554.
https://doi.org/10.7554/eLife.62554


