The integration of Gaussian noise by long-range amygdala inputs in frontal circuit promotes fear learning in mice
- University of Bordeaux, CNRS, Interdisciplinary Institute for Neuroscience, IINS, France
Figures
Figure 1 with 2 supplements

Gaussian auditory stimulation depolarizes FrA pyramidal neurons.
(A) Membrane potential (Vm) was recorded from L2/3 FrA pyramidal under urethane anesthesia with 2P visual guidance. Depth of recorded cells is indicated. (B) Example of recorded FrA neuron showing typical spontaneous slow wave fluctuations. Black bar indicates timing of Gaussian stimulation. Right, membrane potential probability histogram. (C) Example traces of postsynaptic membrane potential recorded from an individual FrA L2/3 pyramidal neuron upon white Gaussian noise (WGN) auditory stimulation (gray bars: 27 pips, 50 ms in duration, 0.9 Hz, 30 s). Bottom right panels, auditory-evoked cVm changes were calculated by subtracting the cumulative Vm (cVm, solid black line) by its linear regression during the baseline period (solid black line). (D) Left, averaged cVm change (±sem) evoked by WGN, with or without the blockade of NMDARs (dAP5 or iMK801). Auditory stimulation is depicted by the blue bar; arrows, analysis time points 1 (end of stimulation) and 2 (30 s later). Right, effect of dAP5 and iMK801 on cVm change at time points 1 (left) and 2 (right). Boxplots represent median and interquartile range. (E, F) Same representation as (C, D) but for pure 8 kHz-evoked cVm change. The effect of both stimuli was tested on the same cell. ***, p<0.001; **, p<0.01; *, p<0.05.
-
Figure 1—source data 1
Sound-evoked depolarization.
- https://cdn.elifesciences.org/articles/62594/elife-62594-fig1-data1-v1.xlsx
Figure 1—figure supplement 1
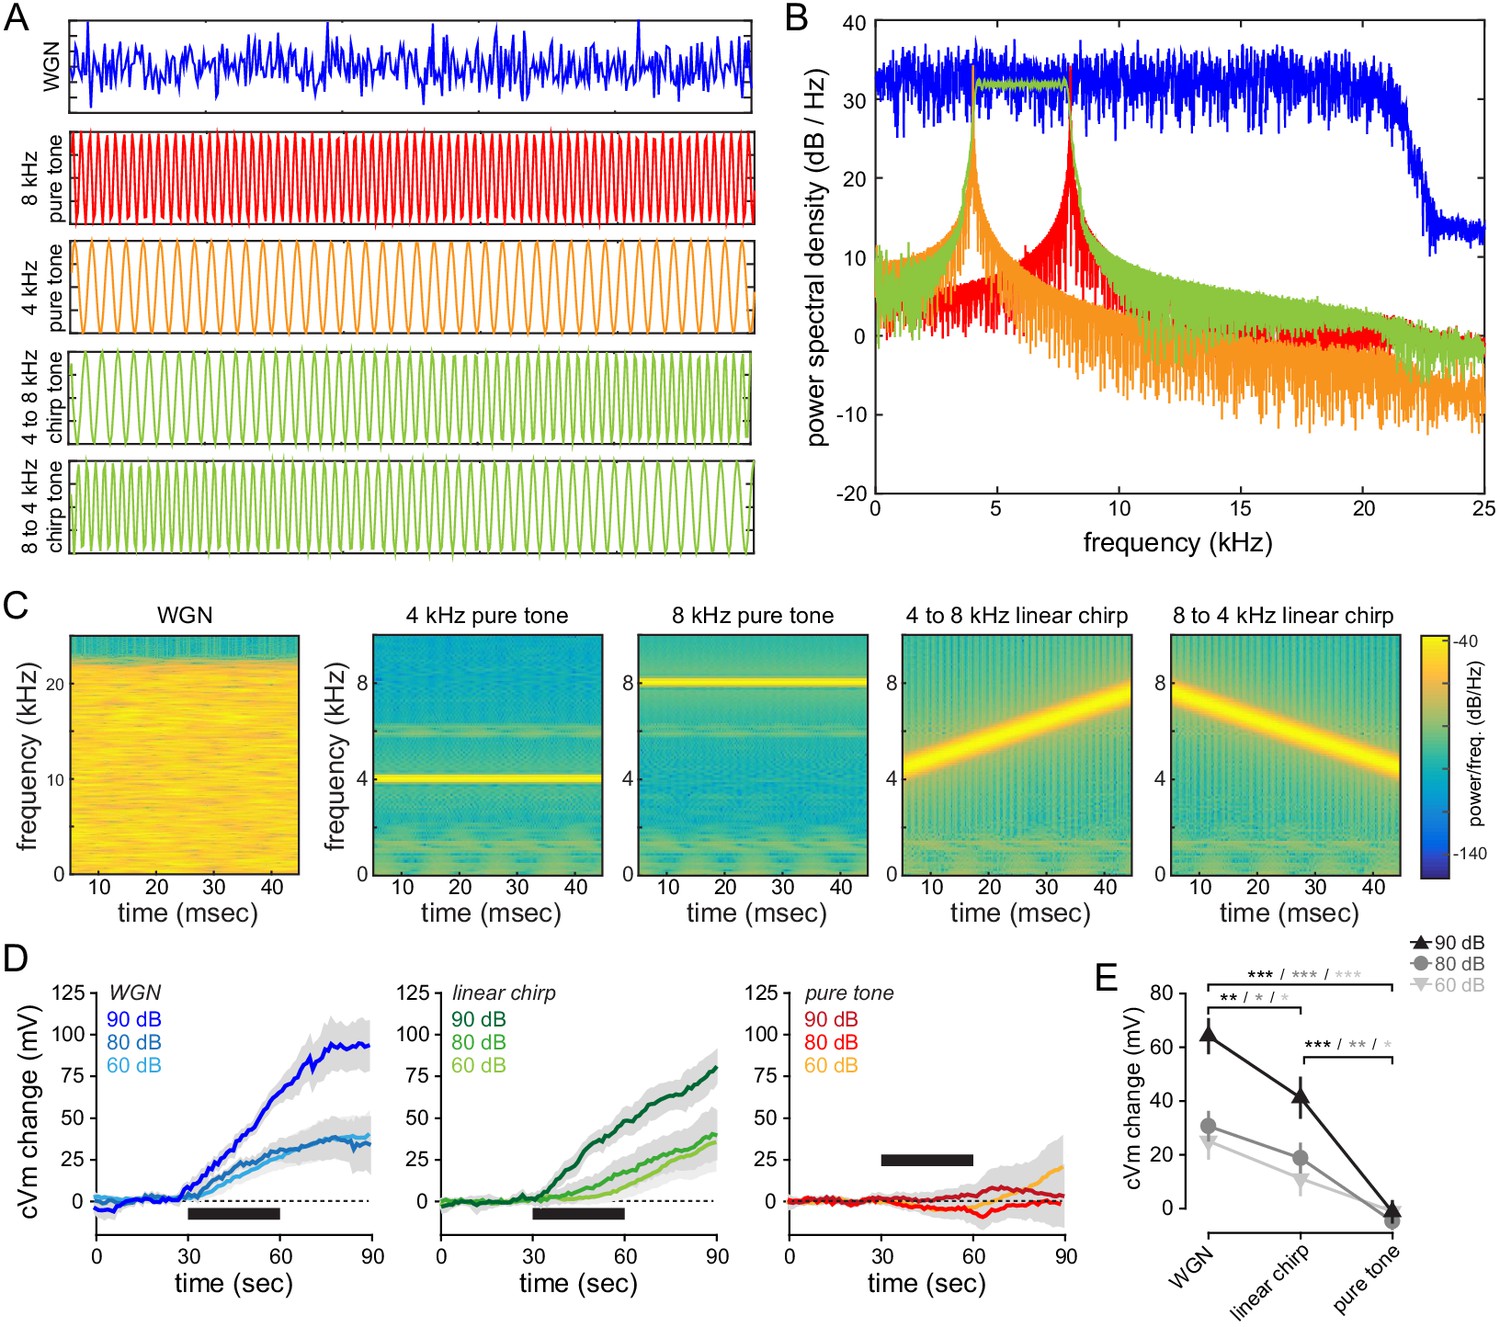
Spectral properties of the auditory tones used in our study, and their effect on membrane potential of FrA L2/3 pyramidal neurons.
(A) 50 ms-long pips (sampling frequency: 44100 Hz) were generated by producing 2205 samples (i) following a Gaussian distribution for WGN, (ii) of a sinusoidal signal for pure tones, and (iii) of a swept-frequency cosine signal for linear chirp tones. For clarity, pips have been cut at 10 ms in the figure. Each presented sound lasts 30 s and is composed of 27 pips (50 ms each). (B) Power spectral density obtained by Fourier Transform of digitalized WGN (blue), pure 4 kHz (orange) and 8 kHz (red) tones, and linear chirp tones (green). Note that the power spectral density of WGN is constant (flat) across all the frequencies below 20 kHz (the signal is low pass filtered to avoid aliasing and ultrasonic frequencies that generate innate defensive behaviors). (C) Spectrograms generated by the short-time Fourier transform of a single pip (50 ms). (D) Averaged cVm change (±sem) evoked by WGN, linear chirps (4-to-8 kHz and 8-to-4 kHz pooled together), and pure frequency tones (4 and 8 kHz pooled together), at different intensities. All tones and intensities were tested on the same cell (n = 6 cells). Black bar, 30 s-long sound (27 pips). (E) Mean cVm change at the end of the tone presentation (t = 60 s).
-
Figure 1—figure supplement 1—source data 1
Spectral and sound pressure properties.
- https://cdn.elifesciences.org/articles/62594/elife-62594-fig1-figsupp1-data1-v1.xlsx
Figure 1—figure supplement 2

dAP5 application affects spontaneous and auditory-evoked FrA membrane potential changes.
(A) Single-cell example of typical spontaneous slow wave fluctuations. (B) WGN-evoked cVm change (light blue) is calculated by subtracting the cumulative Vm (cPSP, blue) by its linear regression during the baseline period (black line). (C) Experimental protocol: L2/3 pyramidal neurons were patched 1 to 5 hr after craniotomy and dAP5 (1 µM) was applied topically and present for the entire duration of the experiment. (D) Left, examples of single-cell spontaneous membrane potential (Vm) fluctuations during anesthesia in controls (black) and upon dAP5 injection (green). Right, mean (±sem) membrane potential probability histograms (control, n = 22; dAP5, n = 19). (E) Left, average (±sem) fast Fourier transform (FFT) of spontaneous membrane potentials in controls (black) and upon dAP5 injection (green). Right, blocking NMDARs significantly decreases the 0.5–2 Hz range (p=0.048, Mann-Whitney rank sum test). Box plot represents median and interquartile range (control, n = 22; dAP5, n = 19). (F) Left, average (±sem) cumulative PSP (cPSP) of spontaneous membrane potentials in controls (black) and upon dAP5 injection (green). Right, blocking NMDARs significantly decreases cVm amplitude after 30 s (p=0.007, Mann-Whitney rank sum test). Box plot represents median and interquartile range (control, n = 22; dAP5, n = 19). (G) Single cell example of Vm fluctuation upon WGN (left) and 8 kHz (right) before and after dAP5 application. Colored bars represent averaged Vm over 1 s time window. The NMDARs-mediated component is calculated by subtracting the averaged Vm before and after dAP5 application. (H, I) Average cVm (±sem) change before and after dAP5 application. Circles and lines, paired cells.
-
Figure 1—figure supplement 2—source data 1
Effect of dAP5 application.
- https://cdn.elifesciences.org/articles/62594/elife-62594-fig1-figsupp2-data1-v1.xlsx
Figure 2 with 2 supplements
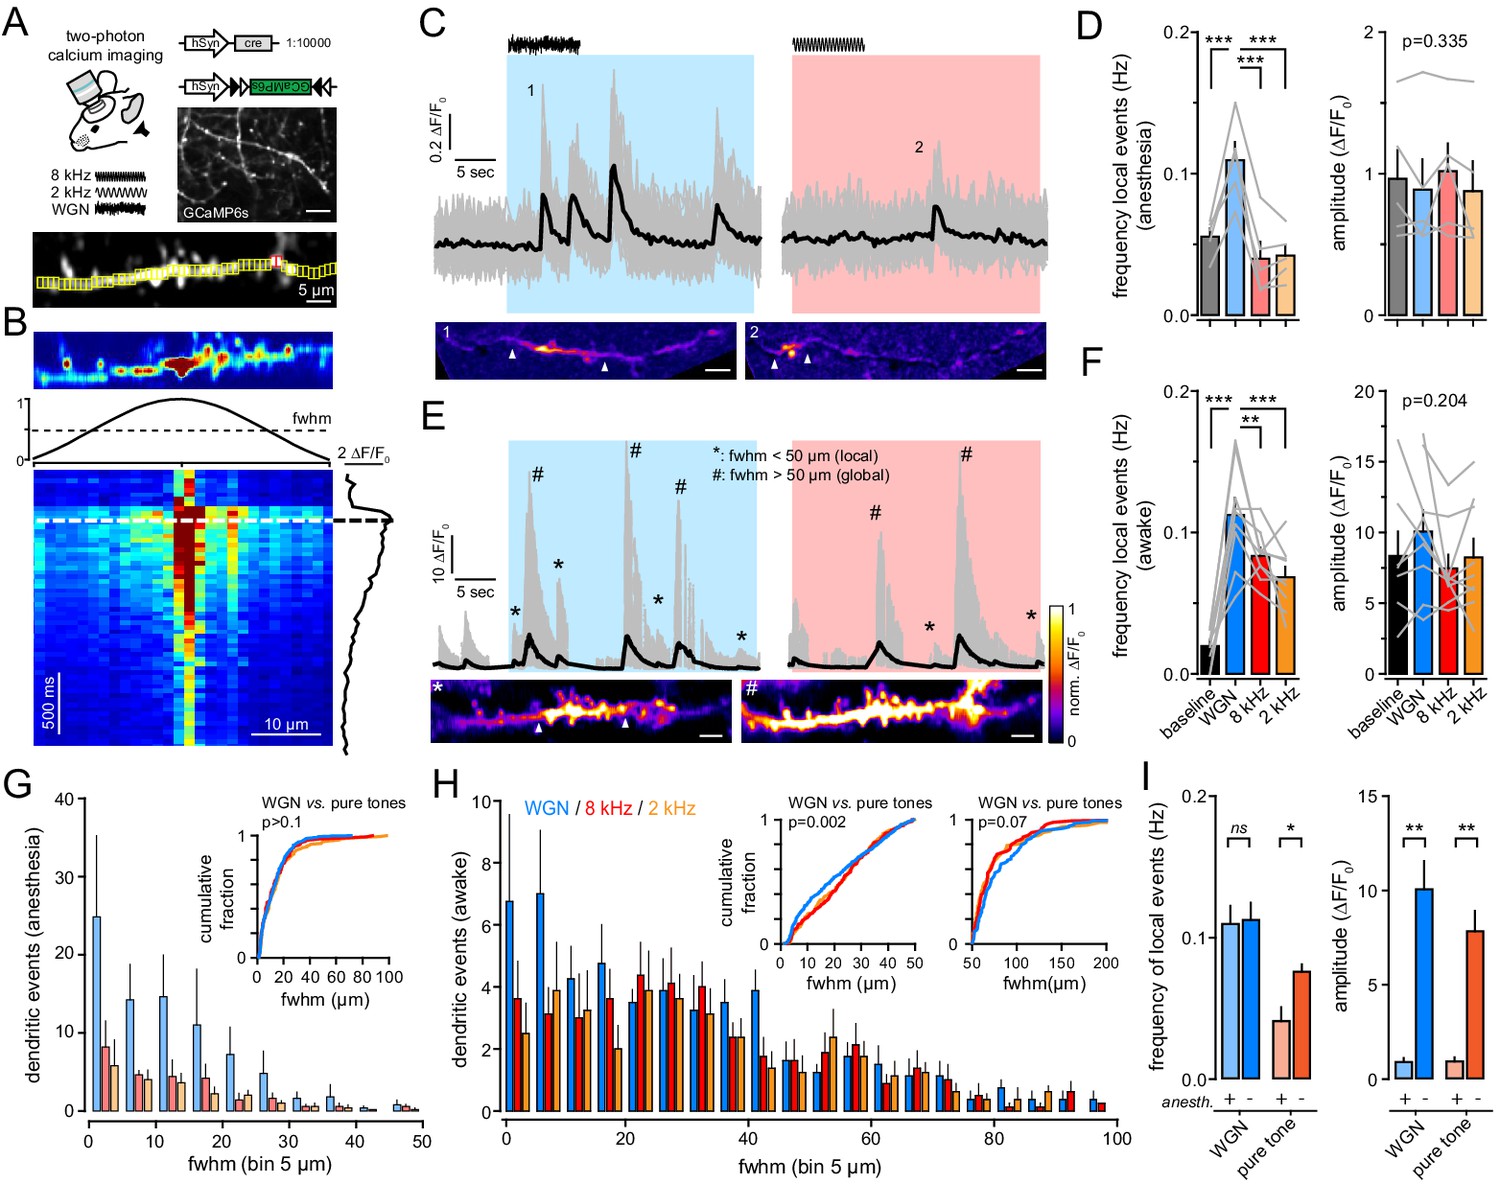
Gaussian auditory stimulation evokes more local dendritic events than pure frequency tones in anesthesia and awake.
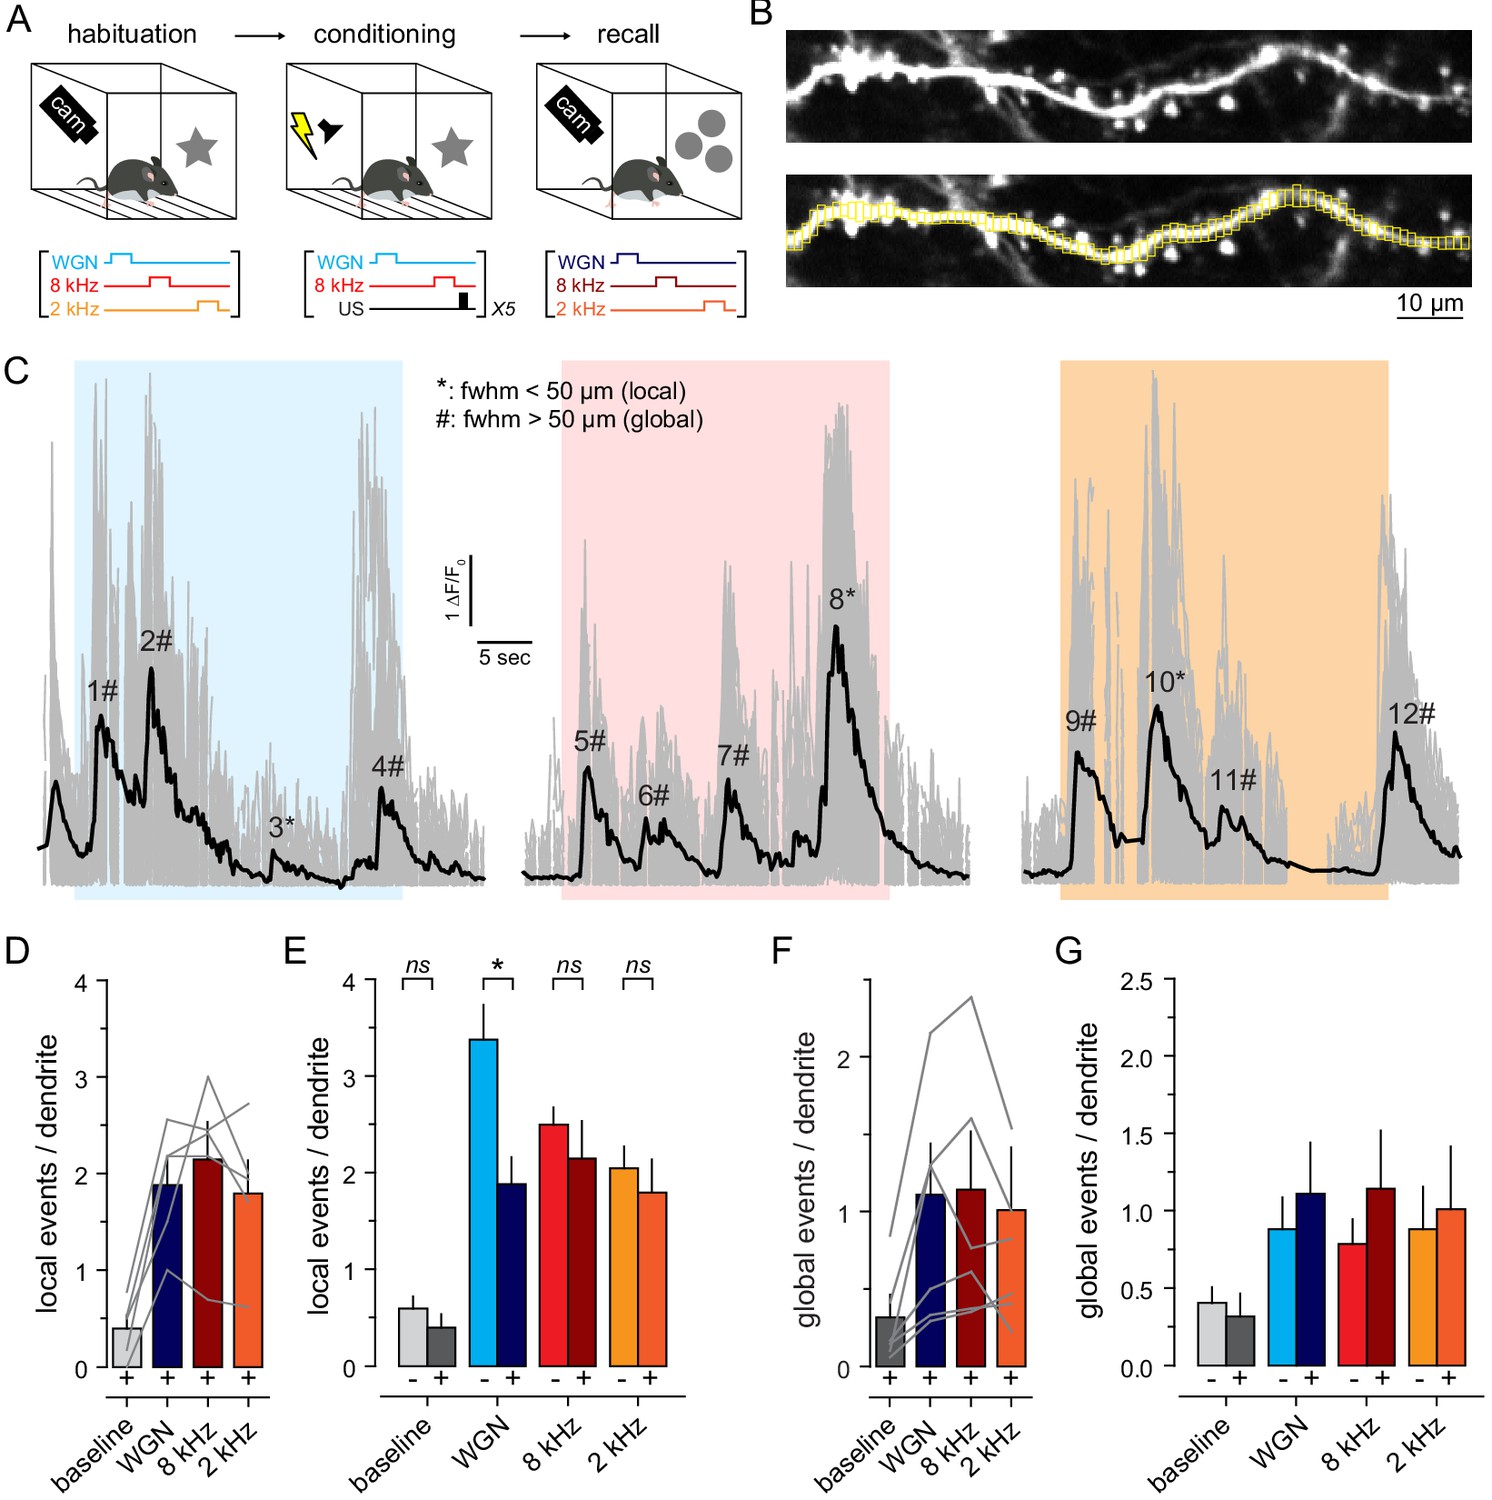
(A) Top, experimental strategy resulting in the sparse expression of GCaMP6s. Scale bar, 10 µm. Ca2+ events in individual dendrites were imaged in L1 upon auditory stimulation in awake or anesthetized mice. Bottom, example of GCaMP6s fluorescence standard deviation image with ROIs in yellow. Red ROIs overlapped with another dendrite and were excluded from the analysis. (B) The spread of Ca2+ events was quantified by calculating the full-width at half-max (fwhm, dashed line) of the normalized Gaussian fit at the time when the averaged ΔF/F0 was maximal. (C) Top, example of multiple Ca2+ transients (ΔF/F0) recorded in a single dendrite in anesthetized mouse, during baseline and upon WGN (blue) and 8 kHz (red). Gray lines, ΔF/F0 measured from small ROIs (all ROIs superimposed). Black line, mean ΔF/F0 averaged over all ROIs, respectively. Bottom, examples of local dendritic Ca2+ events upon WGN (1) and 8 kHz (2). Scale bar, 5 µm. (D) The frequency (left) and amplitude (right) of all Ca2+ events observed during baseline and upon auditory stimulations was averaged over five anesthetized mice. Gray lines represent individual mice. (E) Top, same representation as (C) but in awake mouse. Bottom, example of local (*) and global (#) dendritic Ca2+ events. Scale bar, 5 µm. (F) Same presentation as in (D) but for local events from nine awake mice. Gray lines represent individual mice. (G, H) Distribution histogram of dendritic events fwhm upon WGN (blue), 8 kHz (red) and 2 kHz (orange) tone presentation, from anesthetized (G) and awake (H) mice. Inset, cumulative probability histograms of auditory-evoked events fwhm. (I) Dendritic events evoked by WGN and pure tones (8 kHz and 2 kHz tones pooled together) in anesthetized (+) and awake (-) mice. *, p<0.05; **, p<0.01; ***, p<0.001.
-
Figure 2—source data 1
Frequency of dendritic calcium events.
- https://cdn.elifesciences.org/articles/62594/elife-62594-fig2-data1-v1.xlsx
Figure 2—figure supplement 1
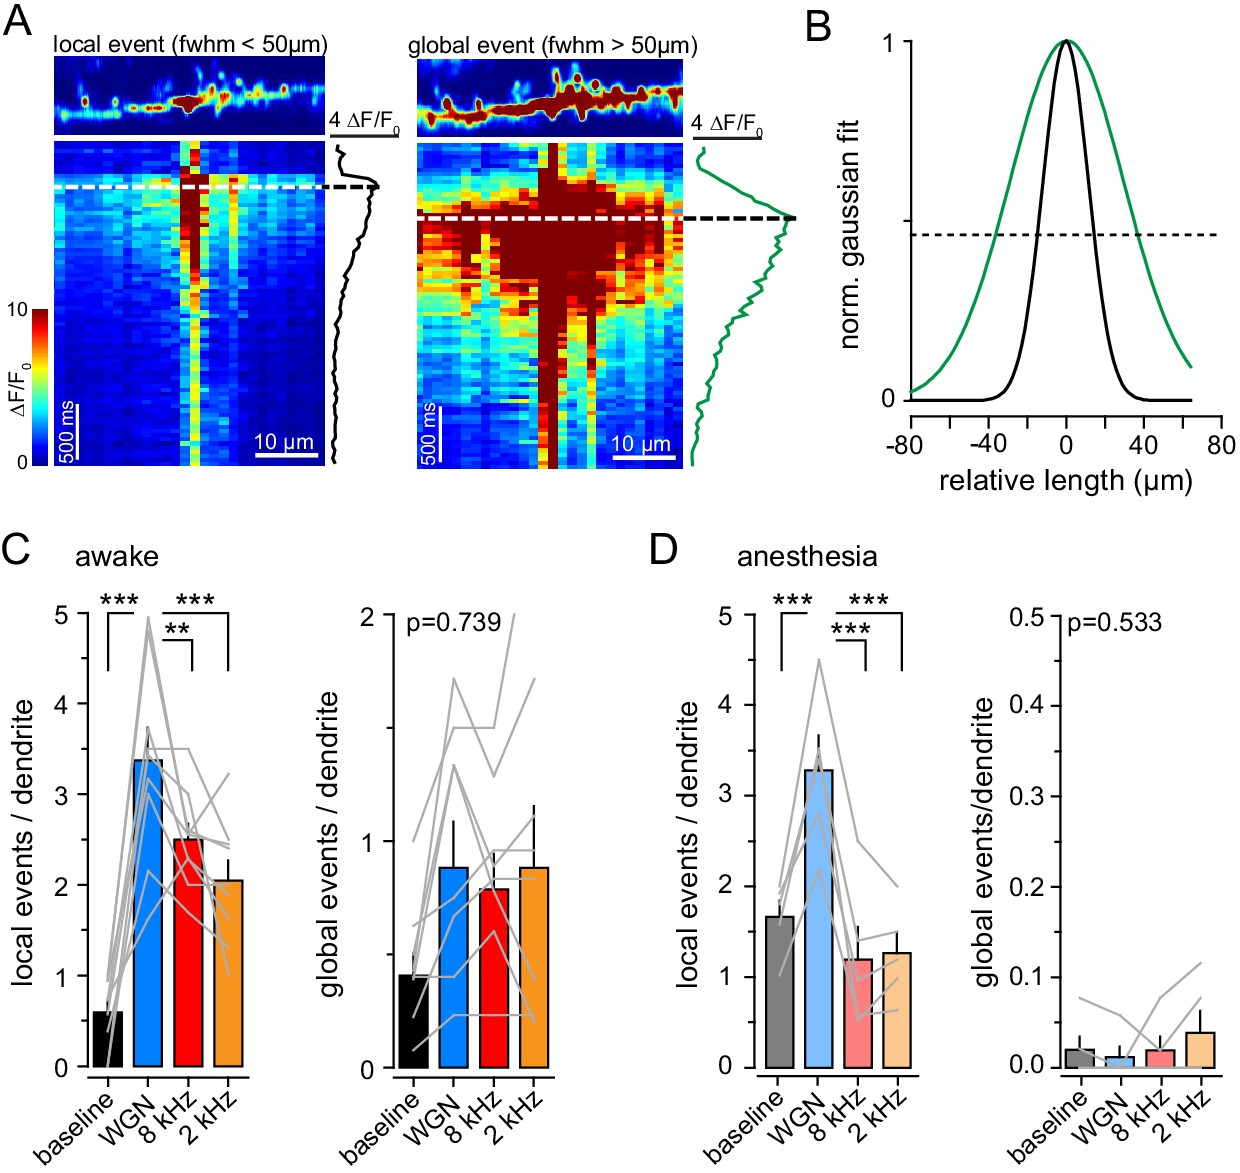
Auditory-evoked calcium events in dendritic tufts are similar between brain states.
(A) Top, example of single-dendrite local (left) and global (right) Ca2+ events. Bottom, raster plot of ΔF/F0 for multiple ROIs along the dendrite represented above. Right, average ΔF/F0. Dashed line, time point of the maximum peak amplitude of averaged ΔF/F0. (B) Gaussian fits (normalized to max) of the local (black) and global (green) Ca2 events shown in (A). (C, D) number of local (left) and global (right) Ca2+ events observed during baseline and upon auditory stimulations in awake (E) and anesthetized (F) mice (n = 9 and 5, respectively). p<0.001, one-way repeated measures anova: **, p<0.01; ***, p<0.001, (Holm-Sidak multiple comparisons). Gray lines represent individual mice.
-
Figure 2—figure supplement 1—source data 1
Number of dendritic calcium events.
- https://cdn.elifesciences.org/articles/62594/elife-62594-fig2-figsupp1-data1-v1.xlsx
Figure 2—figure supplement 2
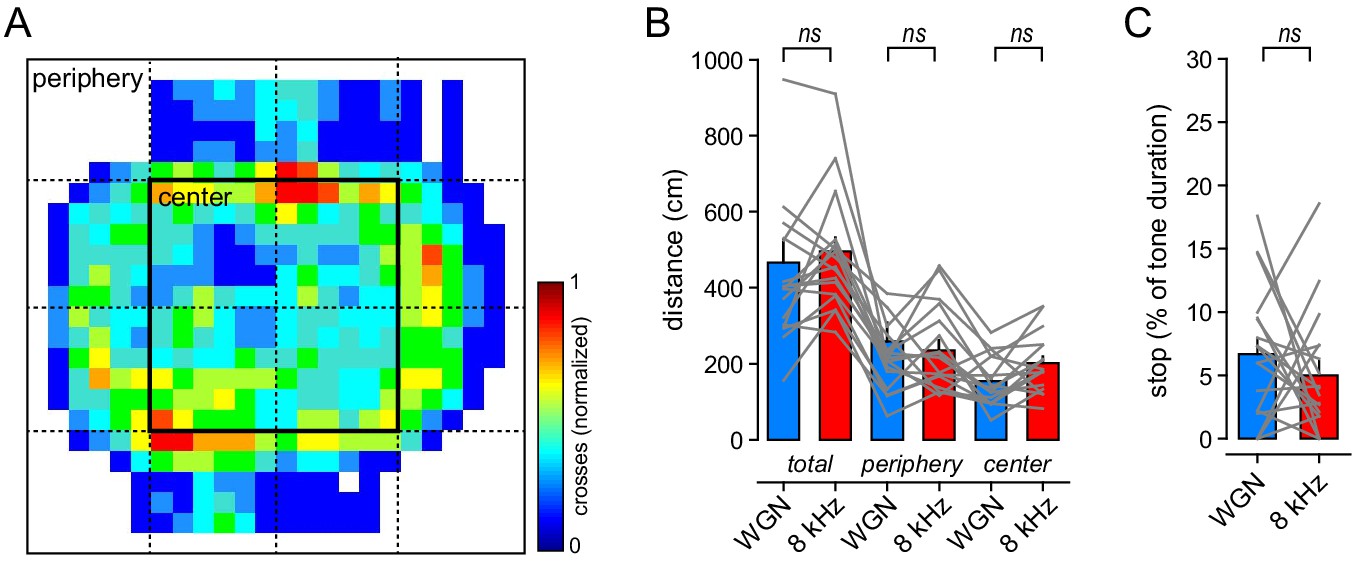
Auditory tones do not affect locomotor activity.
(A) Heatmap representation of mouse activity over 12 min. Each auditory tone was presented four times for 30 s, every 10 to 60 s. (B) Averaged distance travelled (total, in the periphery, and in the center of the open field) upon WGN and 8 kHz tone presentation. Gray lines, individual mouse (n = 17). ns, non-significant, post-hoc comparison after repeated measures anova. (C) Averaged stop duration upon tone presentation. Gray lines, individual mouse (n = 17). ns, paired t-test.
-
Figure 2—figure supplement 2—source data 1
Locomotor activity.
- https://cdn.elifesciences.org/articles/62594/elife-62594-fig2-figsupp2-data1-v1.xlsx
Figure 3 with 3 supplements
The FrA is engaged during fear learning when WGN is used as a CS-.
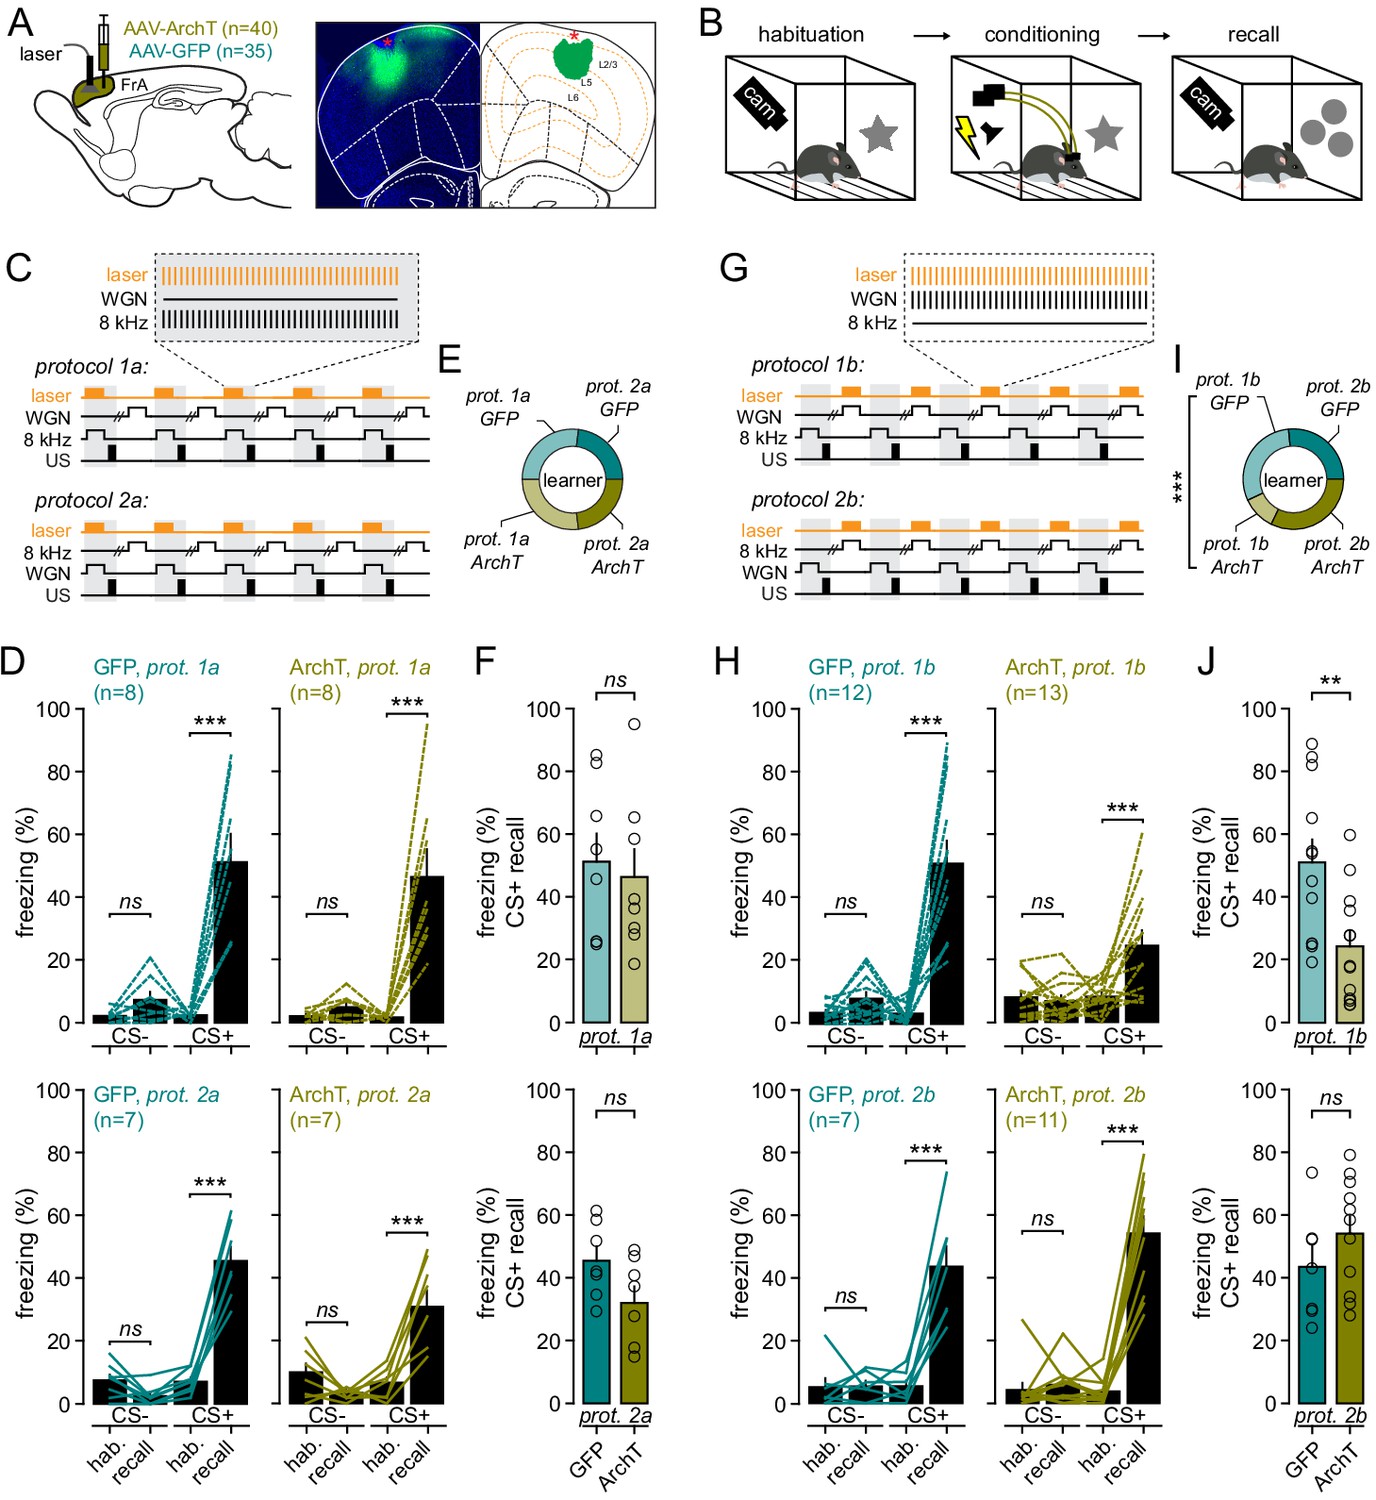
(A) Left, experimental strategy. Mice were infected with AAV9.CaMKII.ArchT (n = 39) or AAV9.CaMKII.eGFP for controls (n = 34) in the FrA, and implanted bilaterally with optical fibers in the FrA. Right, expression profile of ArchT (in green) in the FrA (bregma: +2.58). DAPI staining in blue. Entropy thresholding was used to determine the expression of ArchT across layers. (B) Timeline of auditory fear-conditioning behavioral protocol, with habituation and fear conditioning done in one context and fear learning quantified 24 hr later in a new context. (C) Experimental fear-conditioning protocols. FrA neurons expressing ArchT (or GFP) were photo-stimulated during the presentation of CS+ (8 kHz for protocol 1a or WGN for protocol 1b). US, unconditional stimulus (footshock). (D) Effect of light during learning on freezing behaviors during recall as compared to habituation (hab.) in GFP-expressing mice (left; n = 15) and ArchT-expressing mice (right, n = 15). Turquoise and khaki lines represent individual mice. (E) Fraction of mice that learned the cue-shocked association for each protocol. (F) Freezing behaviors quantified during CS+ in GFP- and ArchT-expressing mice. Circles, individual mice. (G–J) Same representation as (C–F) but for experiments with photo-stimulations delivered during CS-.
-
Figure 3—source data 1
Freezing responses.
- https://cdn.elifesciences.org/articles/62594/elife-62594-fig3-data1-v1.xlsx
Figure 3—figure supplement 1
Effect of FrA opto-inhibition during conditioning on freezing responses and learning during recall.
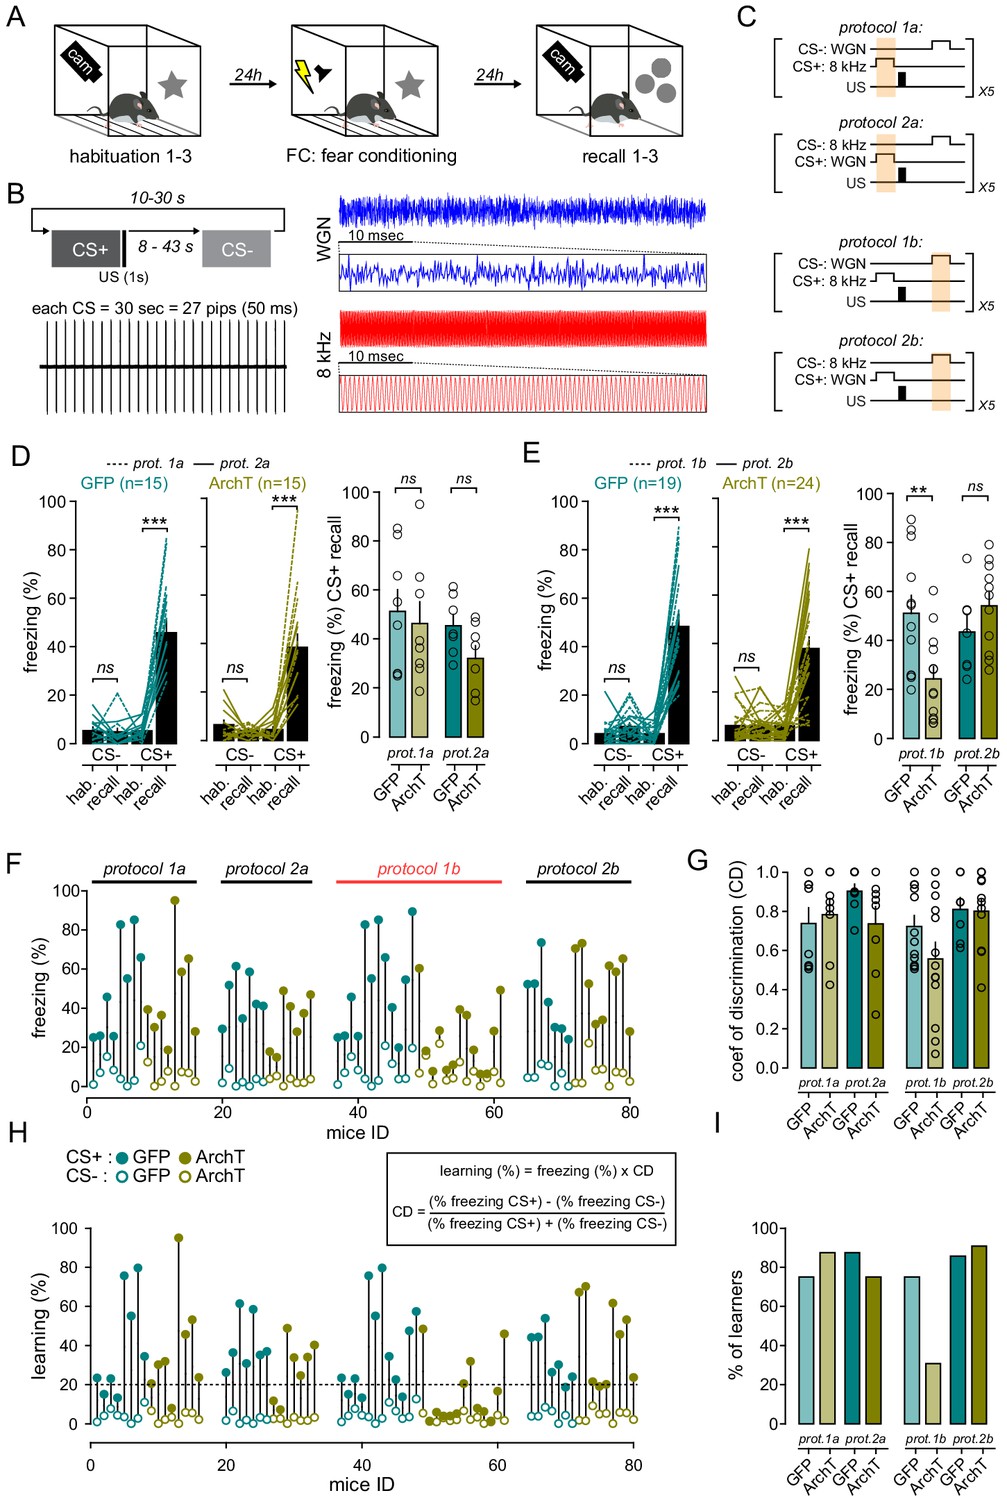
(A) Timeline of behavioral experiments. Random delays (between 10 and 60 s) between CS were used and one example is indicated below. (B) Fear conditioning is performed on day 2 by pairing the CS+ with a US (1 s foot shock, 0.6 mA, 5 CS+/US pairings). The onset of the US coincides with the offset of the CS+. The CS− is presented after each CS+/US association with random delays (8–43 s) and is never reinforced. The next pairing is performed after random delays (10–30 s) from the offset of the CS−. Each CS lasts 30 s and is composed of 27 pips of 50 ms presented at 0.9 Hz. The frequencies used for CS+ and CS− were counterbalanced across animals (protocols 1 and 2). (C) Fear-conditioning protocols. FrA neurons expressing ArchT (or GFP) were photo-stimulated during the presentation of CS+ (8 kHz for protocol 1a or WGN for protocol 2a) or CS- (WGN for protocol 1b or 8 kHz for protocol 2b). US, footshock. Photo-simulations (orange box) were given during CS+ (protocols 1a and 2a) or CS- (protocols 1b and 2b). (D) Left, effect of light during learning on freezing behaviors during recall as compared to habituation (hab.) in GFP-expressing mice (left; n = 15) and ArchT-expressing mice (right, n = 15). Turquoise and khaki lines represent individual mice. Right, freezing behaviors quantified during CS+ in GFP- and ArchT-expressing mice. Circles, individual mice. (E) Same representation as (D) but for experiments with photo-stimulations delivered during CS-. (F) Freezing responses during recall upon CS+ (filled circles) and CS- (open circles) in GFP (turquoise) and ArchT (khaki) expressing mice. Significant differences between GFP and ArchT-mice were seen only for protocol 1b (red). (G) Coefficient of discrimination (CD) was calculated as follows: CD = (CS+ % freezing- CS- % freezing) / (CS+ % freezing+ CS- % freezing). Circles, individual mice. (H) Learning index was quantified for each CS by multiplying the % of freezing in each condition by the corresponding coefficient of discrimination. Mice with a learning index below 20% (dotted line) were considered as non-learners. (I) Fraction of mice that learned the cue-shock association (learning >20%).
Figure 3—figure supplement 2
Fear conditioning (protocol 1) specifically decreases WGN-induced local dendritic events.
(A) Top, Experimental protocol. GCAMP6s-expressing dendrites were imaged in awake mice before and after fear conditioning during presentation of WGN, 8 kHz and 2 kHz tones. Bottom, fear-conditioning protocol. Only WGN and 8 kHz were used during conditioning, while 2 kHz served as a neutral tone that was only presented before and after conditioning. (B) Example of GCaMP6s fluorescence standard deviation projection (top) with ROIs in yellow (bottom). (C) Example of multiple Ca2+ transients (ΔF/F0) recorded in a single dendrite, upon WGN (blue), 8 kHz (red) and 2 kHz (orange). Gray lines, ΔF/F0 measured from small ROIs (all ROIs superimposed). Black line, mean ΔF/F0 averaged over all ROIs, respectively. (D, E) Number of local Ca2+ events per dendrite observed during baseline and upon auditory stimulations in awake mice before (-, n = 9) and after (+, n = 5) fear conditioning. The averaged number of local dendritic events per dendrite observed upon WGN presentation in awake mice was significantly lower after fear learning (WGN-: 3.37 ± 0.3, n = 9 naive mice; WGN+: 1.88 ± 0.3, n = 5 conditioned mice; p=0.025, t-test). (F, G) Same presentation as in (D, E) for global events.
-
Figure 3—figure supplement 2—source data 1
Dendritic calcium events after fear learning.
- https://cdn.elifesciences.org/articles/62594/elife-62594-fig3-figsupp2-data1-v1.xlsx
Figure 3—figure supplement 3
Fear conditioning (protocol 1) occludes WGN-evoked somatic plateau potentials.
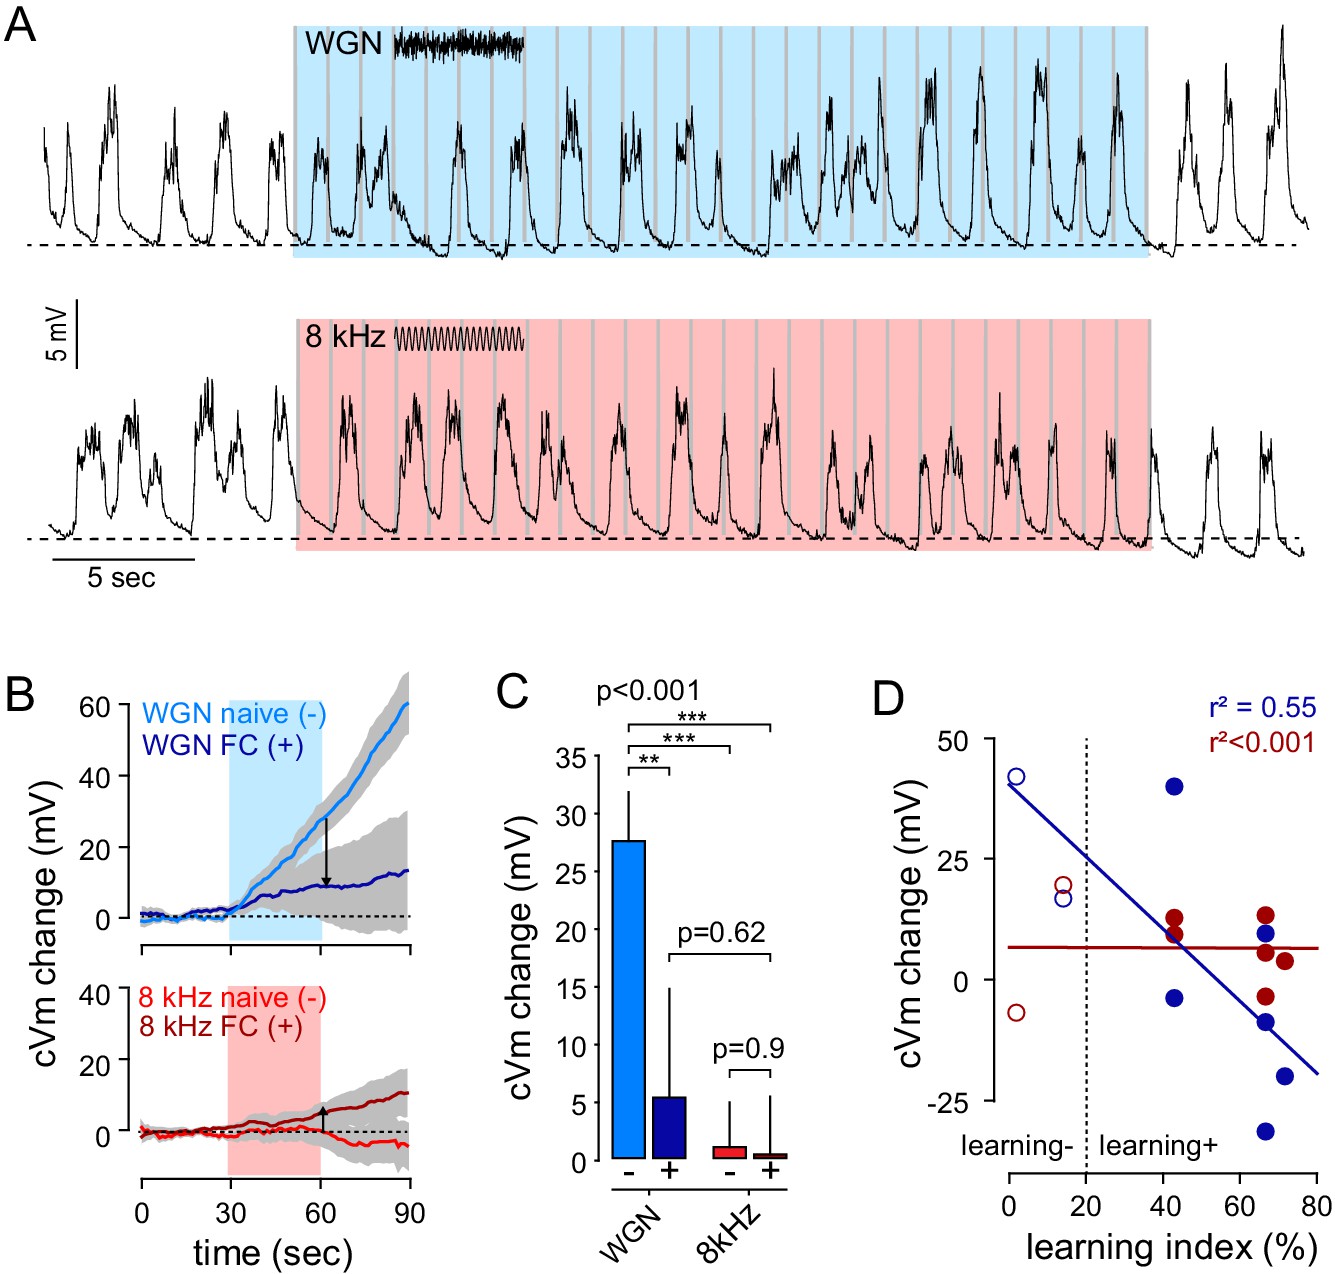
(A) Example traces of postsynaptic membrane potential recorded from an individual FrA pyramidal neuron upon WGN (CS-, top) and 8 kHz (CS+, bottom) auditory stimulation after fear conditioning. The effect of both stimuli was tested on the same cell. (B) Averaged cVm change (±sem) evoked by WGN (top) and 8 kHz tones (bottom) before (naive (-)) and after fear conditioning (FC (+)). (C) Effect of WGN and pure 8 kHz tone on cVm change before (-, n = 22) and after learning (+; n = 8). As compared to naive mice, WGN failed to activate FrA pyramidal neurons in conditioned mice (WGN+: 5.4 ± 9 mV, n = 8; WGN-: 27.6 ± 4 mV, n = 22; p=0.008). Thus, the difference between WGN and 8 kHz-induced cVm change observed in naive mice (14 naive mice; WGN-: 27.6 ± 4 mV; 8kHz-: 1.1 ± 4 mV; n = 22; p<0.001; paired t-test) disappeared after fear conditioning (five conditioned mice; WGN+: 5.4 ± 9 mV; 8 kHz+: 0.5 ± 5 mV; n = 8; p=0.698; paired t-test). p<0.001, one-way anova; ***, p<0.001; **, p<0.01, Holm-Sidak comparisons. (D) Relation between the learning index and WGN (blue)- and 8 kHz (red)-induced cVm change after conditioning. As opposed to 8kHz-cVm change that was not different between behavioral performance (r²<0.001), WGN induced stronger cVm change in low freezing mice indicating that WGN- somatic plateaus are negatively correlated with behavioral performance (WGN: r²=0.55; 8 kHz: r²<0.001). Open/filled circles, individual cells from non-learning/learning mice, respectively.
-
Figure 3—figure supplement 3—source data 1
Sound-evoked depolarization after fear learning.
- https://cdn.elifesciences.org/articles/62594/elife-62594-fig3-figsupp3-data1-v1.xlsx
Figure 4 with 1 supplement
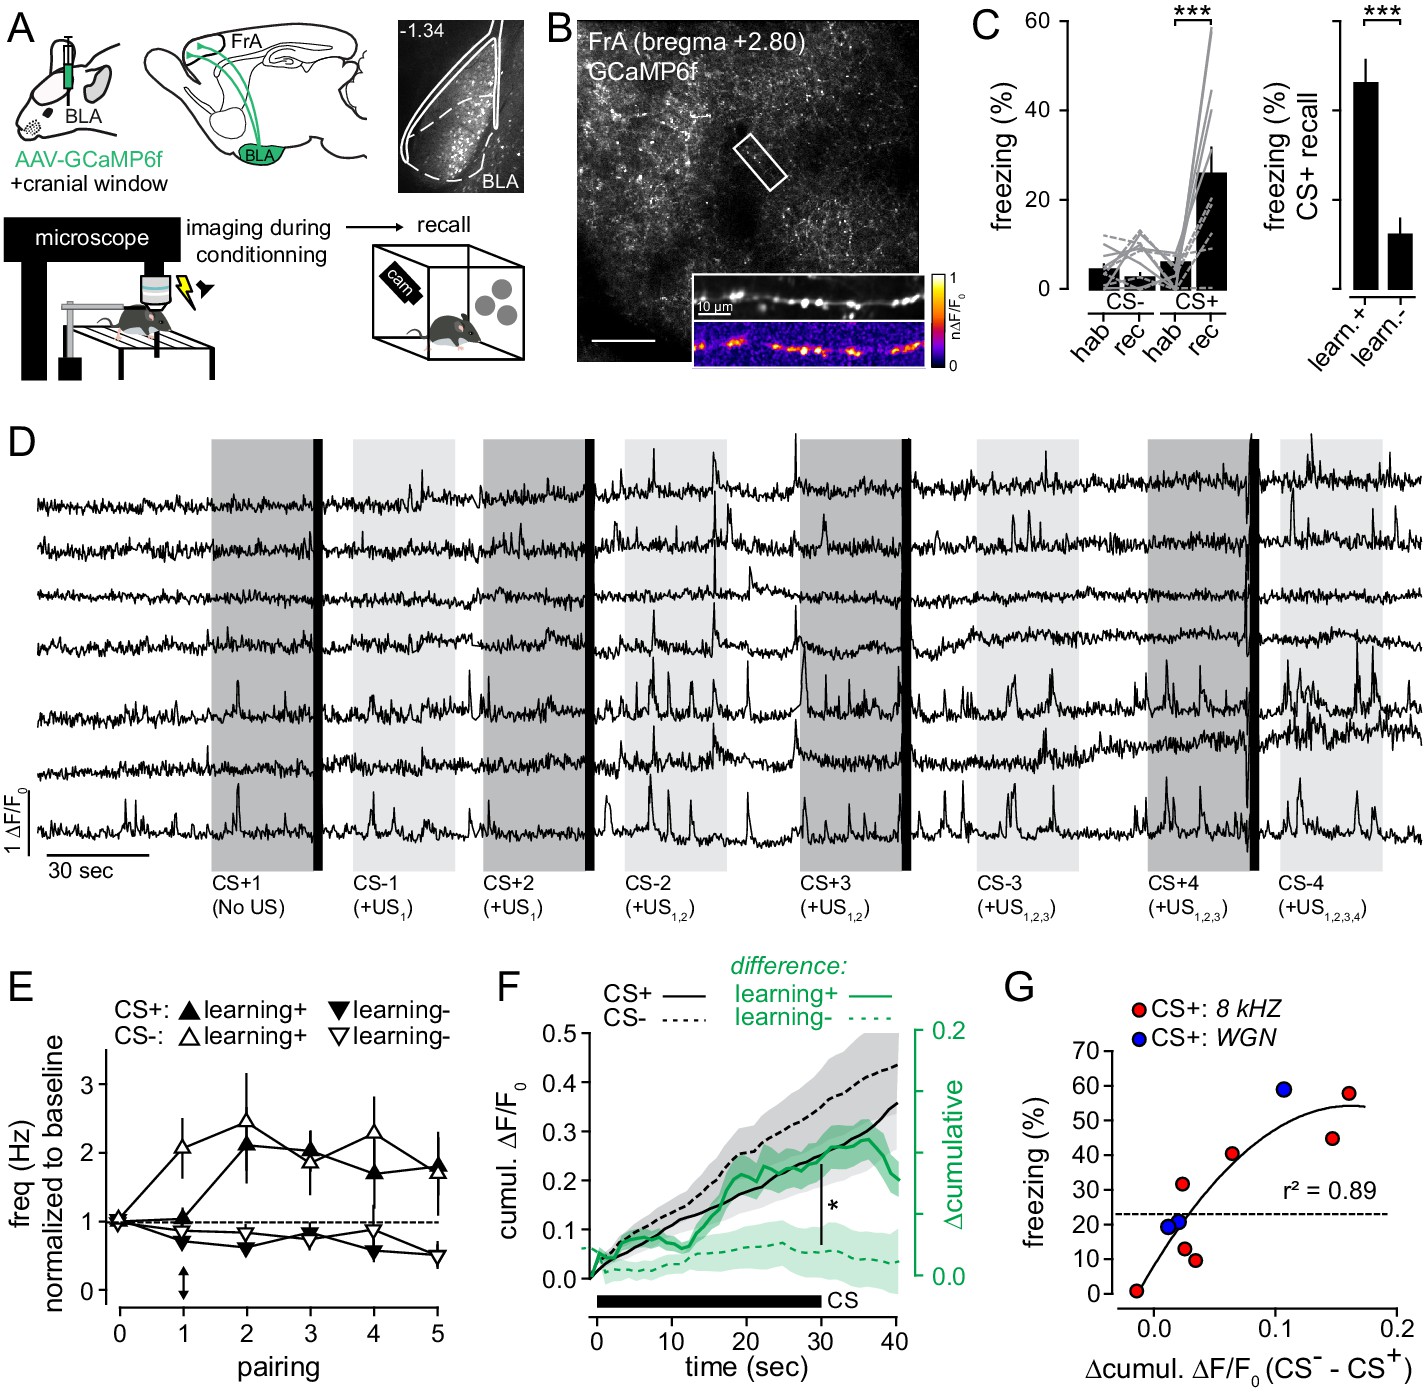
The activation of BLA-to-FrA axons between conditioning trials predicts the level of auditory fear learning.
(A) Top left, experimental protocol. BLA-to-FrA axons were imaged in the superficial layer of the FrA. Top Right, expression profiles of GCaMP6f in the BLA. Bottom, GCaMP6f-expressing mice were fear conditioned under the 2P microscope (conditioning protocols 1 and 2 pooled together), and fear learning was quantified 24 hr later in a new context. (B) GCaMP6f-expressing axons were imaged in the FrA of awake mice (scale bar, 200 µm). Inset, example of Ca2+ transients in individual BLA-to-FrA axon. (C) Left, conditioning under the microscope-induced robust fear behaviors: in contrast to CS-, CS+ increased freezing responses during recall as compared to habituation (hab.). Gray solid lines, % of freezing of mice with learning index >20% (learning+, n = 5); gray dashed lines, % of freezing of mice with learning index <20% (learning-, n = 5). Right, freezing responses induced by CS+ during recall for learners (learn. +) and non-learners (learn. -) mice. (D) Examples of Ca2+ transients (ΔF/F0) from individual boutons recorded from one mouse upon consecutive CS+/US pairings. Dark gray bars, CS+; light grey bars, CS-; black bars, footshock (US). (E) Frequency of axonal Ca2+ transients recorded during successive CS. For the first CS+, the activity of boutons was monitored in absence of footshock. Black arrow points to the difference between the first CS+ (before the first footshock) and the first CS- (after the first footshock). 0 corresponds to the baseline period before conditioning. (F) Cumulative ΔF/F0 averaged (±sem) across all CS+ (solid black lines, n = 10) and CS-(dotted black lines, n = 10). Green lines, difference between CS+ and CS- related axonal activity (Δcumulative: ΔF/F0 CS- - ΔF/F0 cs+) in mice that learned (learning+, solid green line, n = 5) or not (learning-, dotted green line, n = 5) the association. (G) Relation between the Δcumulative during conditioning and the % of freezing during recall for protocol 1 (blue, CS+: 8 kHz) and protocol 2 (red, CS+: WGN). Circles, mice. *, p<0.05; ***, p<0.001.
-
Figure 4—source data 1
Frequency of calcium events in axons.
- https://cdn.elifesciences.org/articles/62594/elife-62594-fig4-data1-v1.xlsx
Figure 4—figure supplement 1
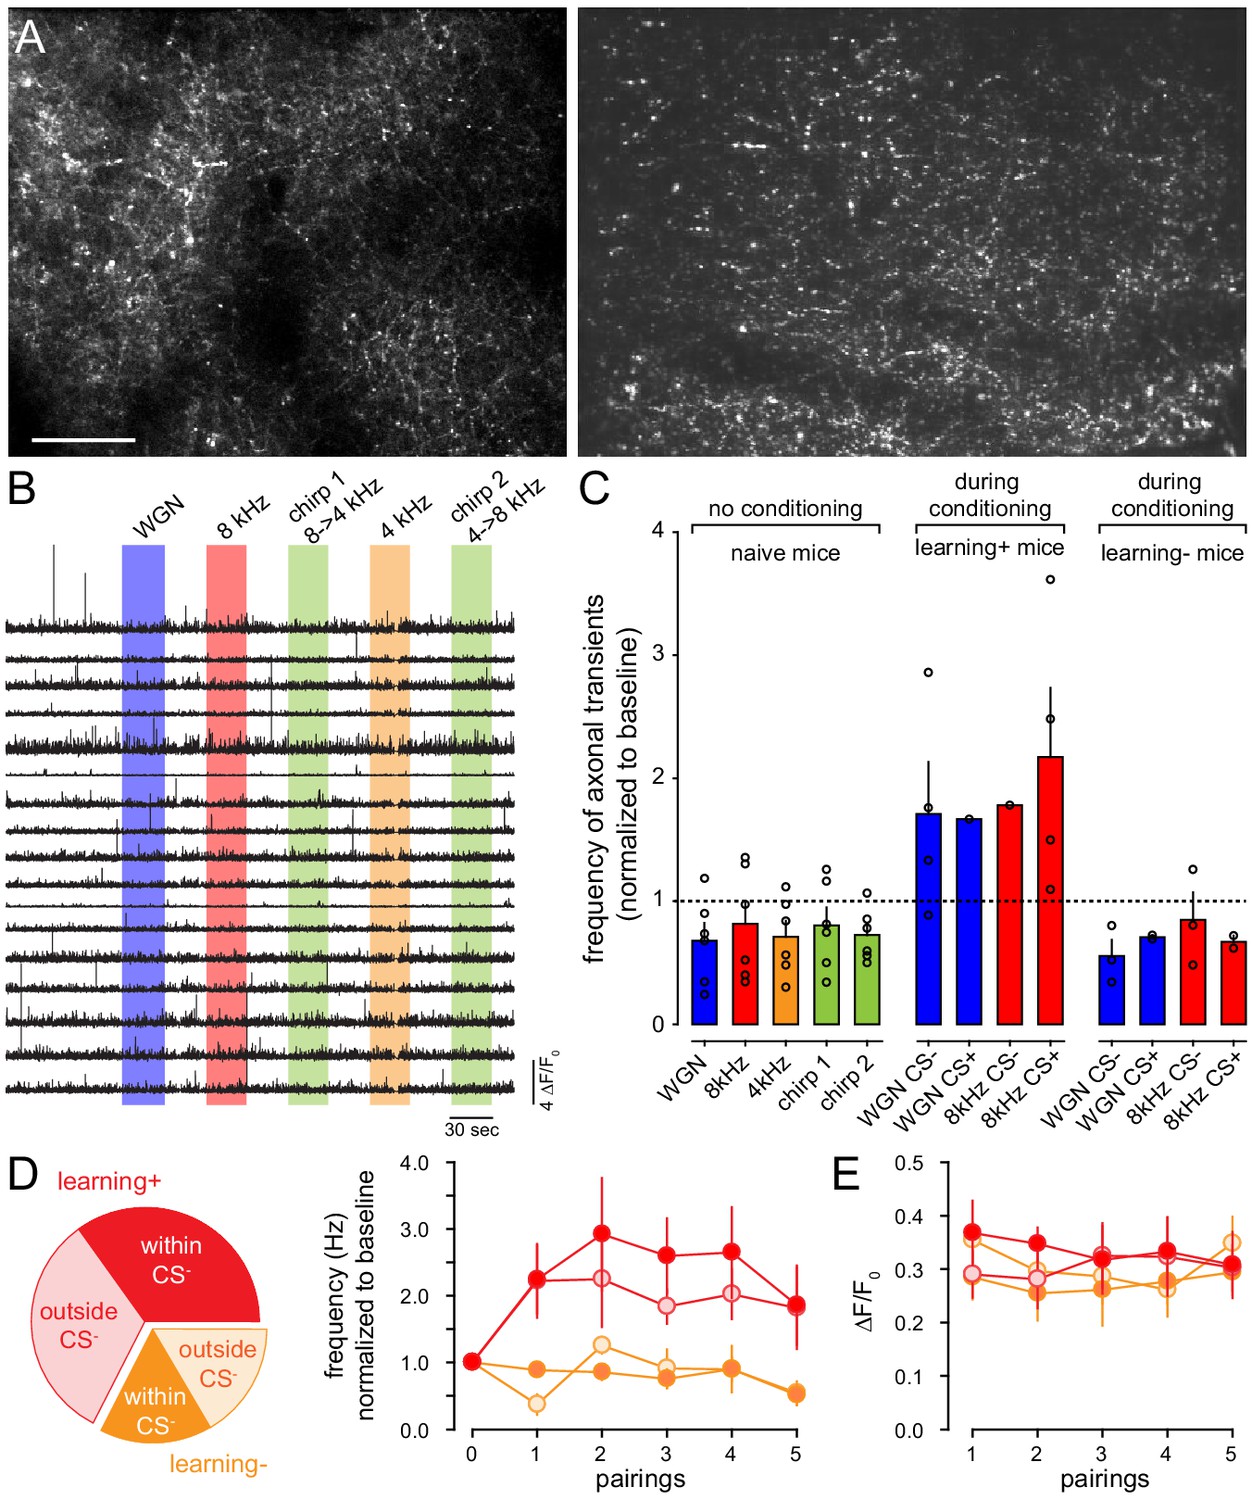
BLA-to-FrA axons do not encode the nature nor the valence of auditory tones.
(A) Two illustrative examples of BLA-to-FrA axons expressing GCaMP6f. BLA neurons were transfected with AAV1.Syn.GCaMP6f. GCaMP6f-expressing axons were imaged in the FrA of awake mice through a cranial window. (B) Examples of Ca2+ transients (ΔF/F0) from individual boutons recorded from one mouse upon different auditory tones. (C) Frequency of axonal Ca2+ transients (normalized to baseline) recorded in naive mice (no conditioning, n = 6 mice) and during auditory fear conditioning (n = 10 mice) with protocol 1 (CS+: 8 kHz, CS-: WGN, n = 7) and protocol 2 (CS+: WGN, CS-: 8 kHz, n = 3). (D) Left, fraction of axonal calcium transients detected in mice that learned (red, learning +) or not (orange, learning-) the protocol, inside and outside CS- presentation (excluding those that occurred during CS+). Right, normalized frequency of axonal Ca2+ transients recorded between conditioning trials (CS+/US) within (filled circles) and outside (open circles) CS- presentation, in mice that learned (red) or not (orange) the protocol. (E) Amplitude in ΔF/F0 of detected calcium transients (same presentation as in D).
Figure 5 with 2 supplements

The activation of BLA-to-FrA axons supports the non-linear integration of auditory tones.
(A) Left, co-activation protocol. ChR2-expressing BLA neurons were photo-stimulated during auditory stimulation. Right, representative example of the ChR2-GFP expression profile in the mouse BLA and FrA (ChR2-expressing axons were imaged in superficial layer 1 with 2P microscopy before recording). (B) Single-cell example of depolarizations in FrA by the rhythmic photostimulation of BLA neurons (27 square stimulations, 50 ms, 0.9 Hz for 30 s). (C) Averaged cVm change (±sem) evoked by the photostimulation of BLA neurons. Photo-stimulation is depicted by the black bar. (D) Example of traces of postsynaptic membrane potential recorded from individual FrA L2/3 pyramidal neurons upon WGN paired (top) or not (bottom) with the photo-stimulation of ChR2-expressing BLA neurons. Black and blue bars below the traces indicate the duration of the stimulation. (E) Averaged cVm change (±sem) observed upon paired stimulation (solid line) or expected from the arithmetic sum of individual depolarizations evoked by the stimulation of BLA or auditory tones alone (dotted line). Blue and black bars, auditory and BLA stimulations, respectively. (F, G) Same representation as in (D, E) but for 8 kHz. (H) Left, relation between observed and expected cVm. Circles, individual cells, squares, mean ±sem. Right, Averaged cVm (±sem). **, p<0.01; ****, p<0.001. Gray lines indicate paired experiments. (I) Left, averaged observed cVm change (±sem). Arrows, analysis time points 1 (end of stimulation) and 2 (30 s later). Right, effect of photostimulation (+) on WGN (dark blue) and 8 kHz (black red)-evoked cVm at time points 1 and 2. **, p=0.003; *, p=0.035. Circles, individual cells.
-
Figure 5—source data 1
Sound and BLA-evoked depolarization.
- https://cdn.elifesciences.org/articles/62594/elife-62594-fig5-data1-v1.xlsx
Figure 5—figure supplement 1

BLA-mediated synaptic inputs onto FrA L2/3 pyramidal neurons.
(A) Experimental strategy. Left, BLA neurons were transfected with AAV9-CamKIIa-hChR2-eYFP, and ChR2-expressing BLA neurons were then photo-stimulated in vivo with a DPSSL (λ = 473 nm) through an implanted optical fiber. Middle, example of a cortical coronal slice with ChR2-YFP fluorescence in the FrA. PL, prelimbic cortex; MO, medial orbital cortex. Right, fluorescence intensity profiles measured in the FrA (white box) of six different animals in which injections targeted BLA. (B) Examples of ChR2-expressing axons imaged in superficial layer 1 with 2P microscopy. (C) Left, representative example of the ChR2-YFP expression profile in the mouse BLA. Right, coronal diagrams of the brains from six mice showing the expression profiles (in black) of ChR2-YFP. Diagrams were adapted from Paxinos and Franklin, 2001. (D) Schematic of the slice experiment. BLA-to-FrA axons expressing ChR2 were photo-activated through the objective. Right, gray and black lines, representative examples of excitatory post-synaptic current (EPSCs) and feed-forward inhibitory post-synaptic currents (IPSCs) respectively evoked on L2/3 pyramidal neurons with an ultrahigh power 488 nm LED. (E) Amplitude (left) and jitter (right) of light-evoked EPSCs. Gray lines indicate pairs. Open circles indicate individual cells. (F) Single-cell examples of depolarizations in FrA neuron evoked by the photostimulation of BLA neurons. Gray lines, single trials; black line, average of 20 trials. (G) Peak amplitude (left) and fwhm (right) of evoked PSP. Triangles, cells.
Figure 5—figure supplement 2
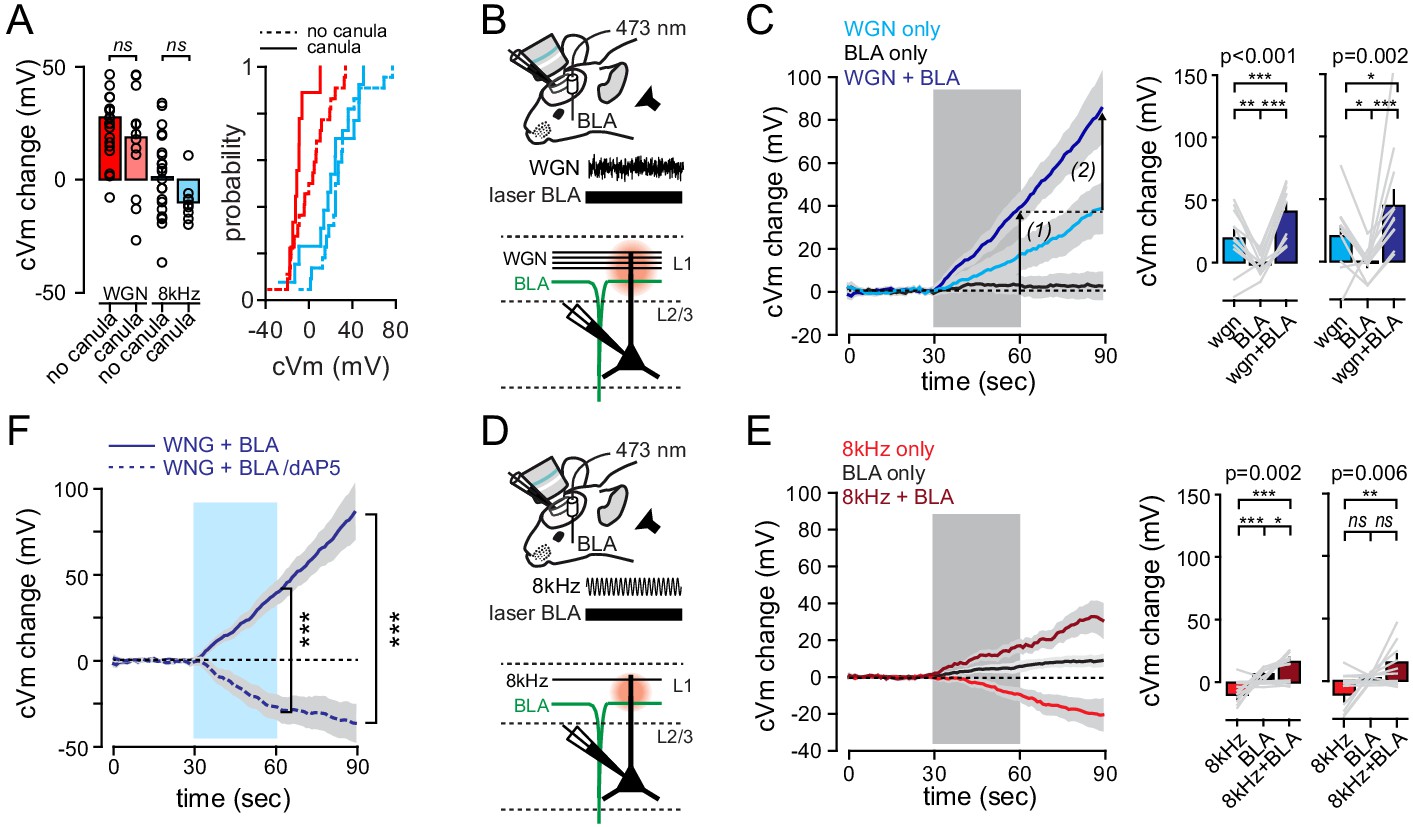
The activation of BLA-to-FrA axons supports the non-linear integration of auditory tones.
(A) Optical fibers implantation (canula) do not affect auditory-induced cVm changes as compared to non-implanted mice (no canula). (B) Co-activation protocol. ChR2-expressing BLA neurons were photo-stimulated during WGN auditory stimulation. (C) Averaged cVm changes (±sem) in response to BLA photo-stimulation alone (black), WGN presentation alone (light blue) and WGN+BLA (dark blue). Arrows, analysis time points 1 (end of stimulation) and 2 (30 s later). *, p<0.05; **, p<0.01; ***, p<0.001; Holm-Sidak multiple comparisons after one-way anova (p<0.001 for time point 1; p=0.002 for time point 2). (D, E) Same presentation as in (B, C) but for 8 kHz. (F) Averaged cVm change (±sem) during WGN+BLA co-stimulation in controls (solid line) and after dAP5 application (dashed line). ***, p<0.001; t-test.
-
Figure 5—figure supplement 2—source data 1
Sound and BLA-evoked depolarization.
- https://cdn.elifesciences.org/articles/62594/elife-62594-fig5-figsupp2-data1-v1.xlsx
Figure 6 with 1 supplement
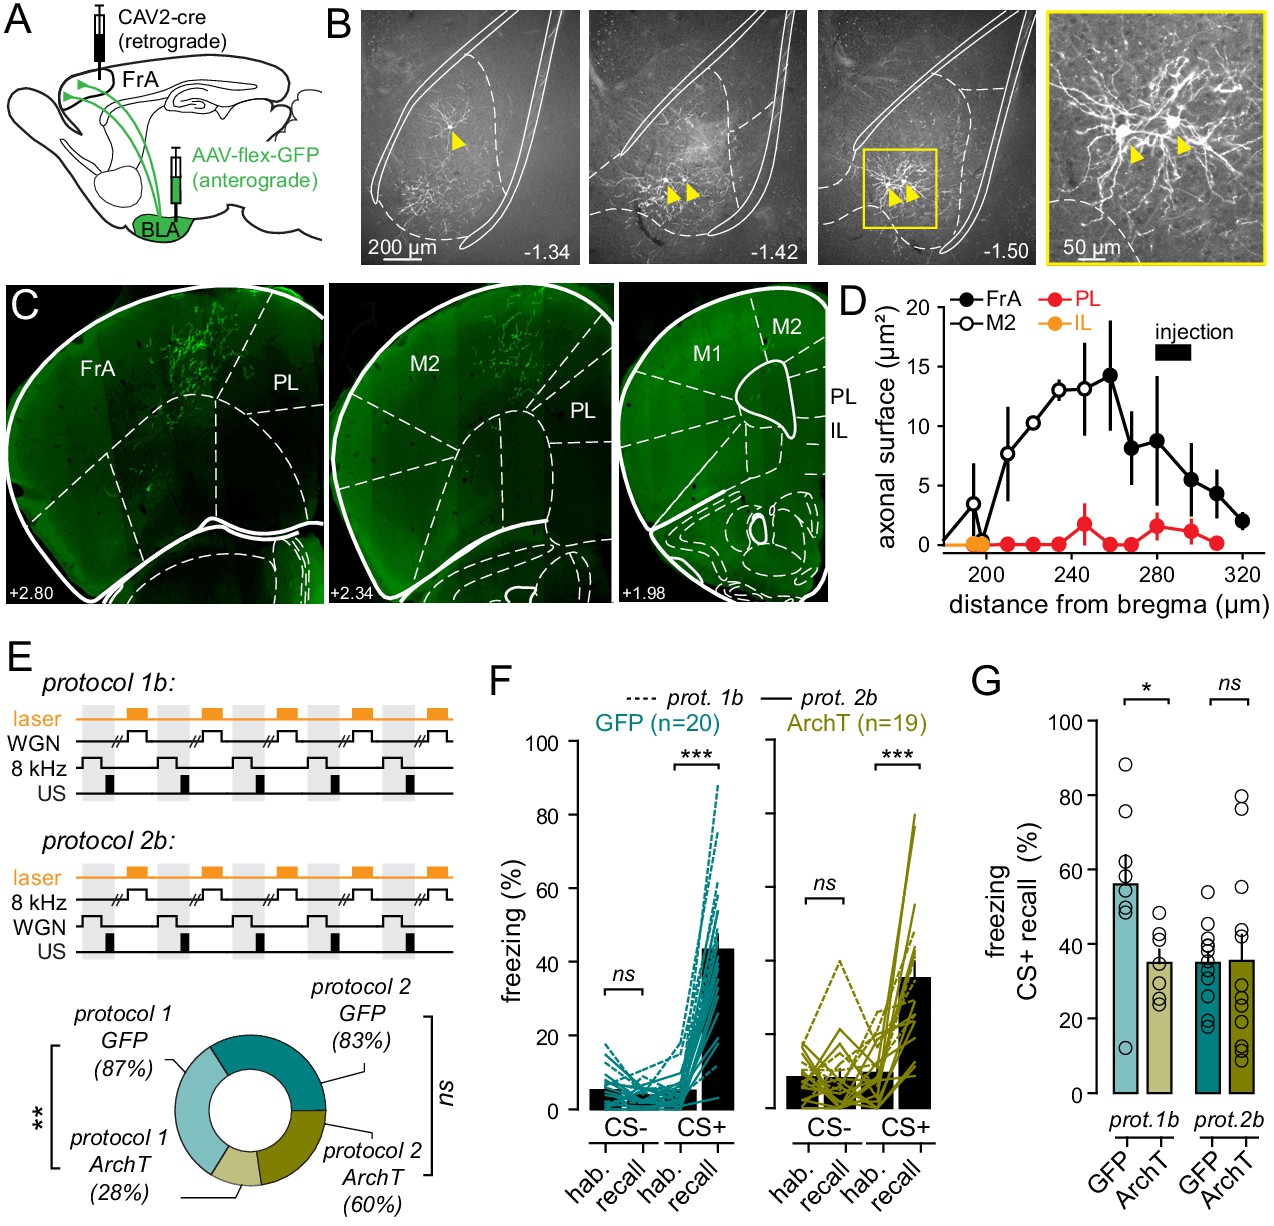
BLA-to-FrA projecting neurons are required for auditory fear learning when WGN is used as a CS-.
(A) Experimental strategy. Mice were infected with AAV9.CBA.Flex.ArchT-GFP (or AAV9.CAG.Flex.eGFP for controls) in BLA and CAV2.CMV.CRE in FrA, and chronically implanted with optical fibers in both BLA. (B) Neurons expressing GFP were found throughout the entire BLA, but not the LA. (C) Example of expression profile of GFP in the FrA and the M2. Note the absence of GFP-expressing axons in the prelimbic (PL) and infralimbic (IL) subdivisions of the mPFC. (D) Distribution of GFP-expressing axons; in different frontal structure; as a function of the distance from the bregma. (E) Top, experimental fear-conditioning protocols. FrA neurons expressing ArchT (or GFP) were photo-stimulated during the presentation of CS- (WGN for protocol 1b or 8 kHz for protocol 2b). US, unconditional stimulus (footshock). Bottom, fraction of mice that learned the cue-shocked association for each protocol. (F) Effect of light during learning on freezing behaviors during recall as compared to habituation (hab.) in GFP-expressing mice (left; n = 20) and ArchT-expressing mice (right, n = 19). Turquoise and khaki lines represent individual mice. (G) Freezing behaviors quantified during CS+ in GFP- and ArchT-expressing mice (p=0.235). Circles, individual mice. ***, p<0.001; **, p<0.01; ns, non-significant.
-
Figure 6—source data 1
Freezing responses.
- https://cdn.elifesciences.org/articles/62594/elife-62594-fig6-data1-v1.xlsx
Figure 6—figure supplement 1
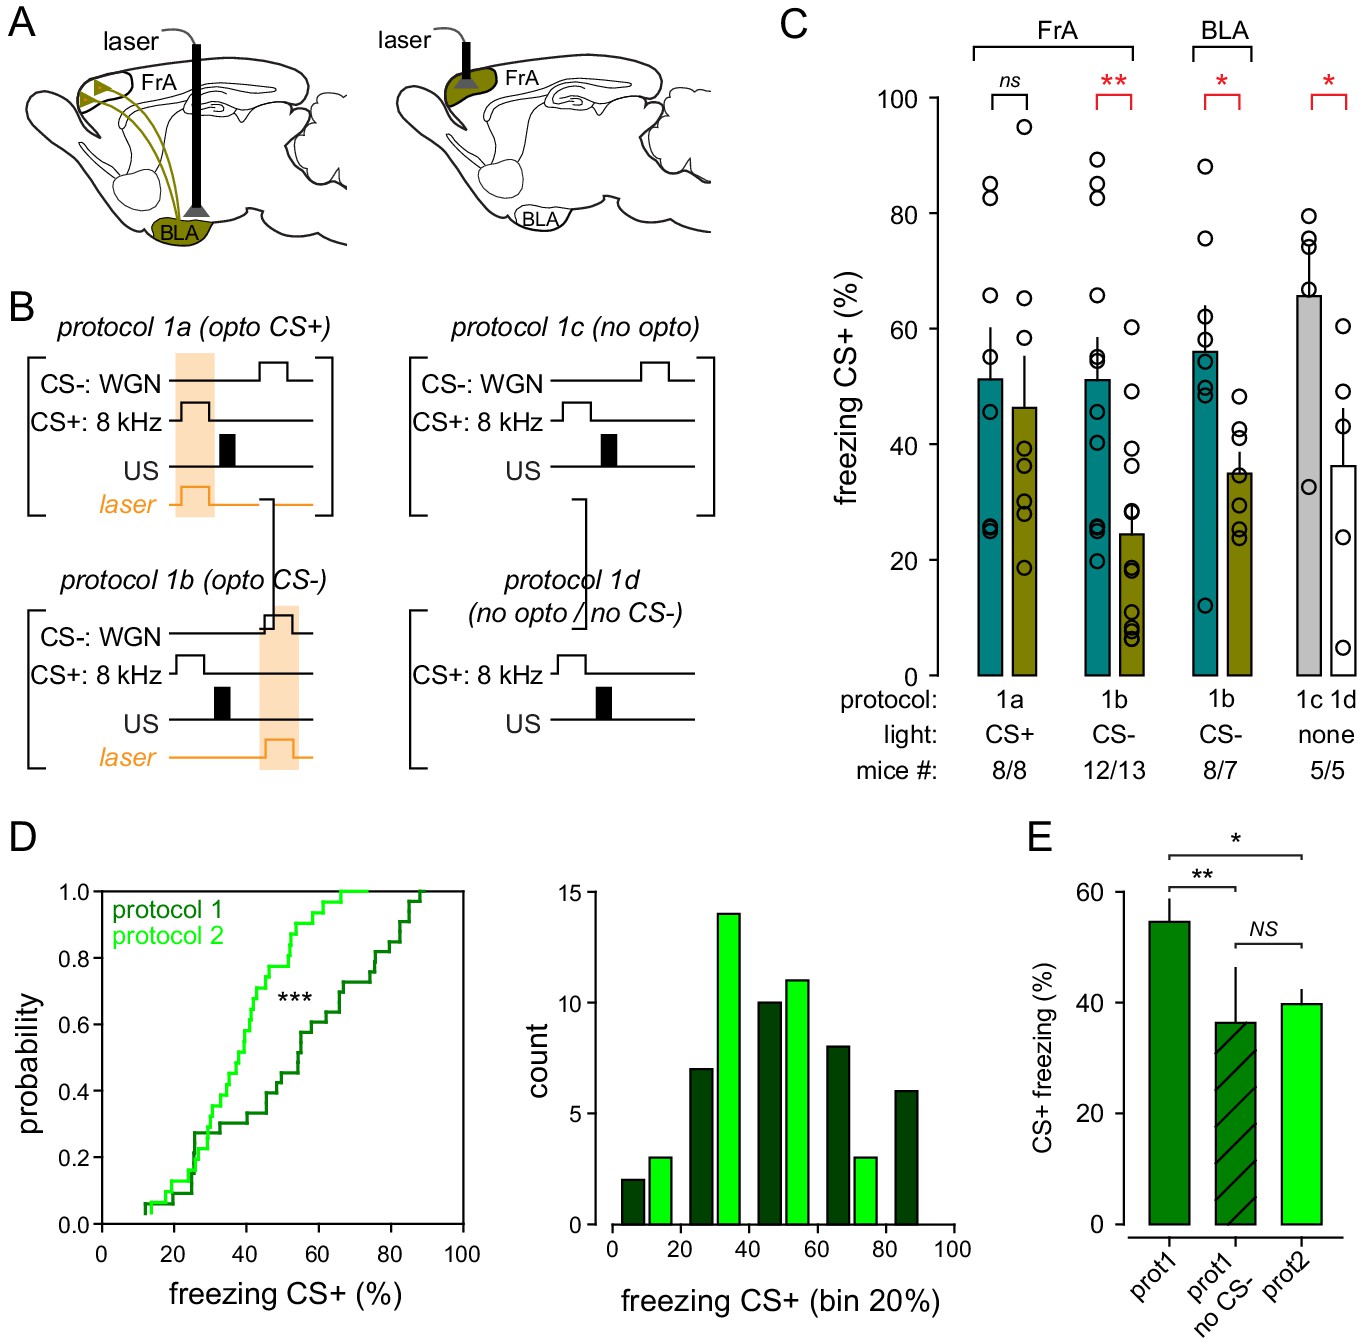
Fear-conditioning protocol 1: comparisons between behavioral conditions.
(A) Experimental strategies for optogenic. Left, mice were infected with AAV9.CBA.Flex.ArchT or AAV9.CAG.flex.eGFP in the BLA and CAV2.CMV.Cre in the FrA, and chronically implanted with optical fibers bilaterally in the BLA. Right, mice were infected with AAV9-CAG-ArchT or AAV9-CaMKII-eGFP for controls in the FrA, and chronically implanted with optical fibers bilaterally in FrA. (B) Fear-conditioning protocols. Left, BLA-to-FrA neurons or FrA neurons expressing ArchT (or GFP) were photo-stimulated during the presentation of CS+ (8 kHz) or CS- (WGN). US, footshock. Photo-simulations (orange box) were given during CS+ (protocols 1a) or CS- (protocols 1b). Right, fear conditioning was performed in the absence of photostimulation, in presence (top, protocol 1 c) or absence (bottom, protocol 1d) of CS-. (C) Freezing responses during recall upon CS+ for all behavioral conditions. (D, E) Protocol 1 (with CS-) produces more freezing responses than protocol 1 (with CS- omitted) and protocol 2. All control mice were pooled together.
Additional files
Download links
A two-part list of links to download the article, or parts of the article, in various formats.
Downloads (link to download the article as PDF)
Open citations (links to open the citations from this article in various online reference manager services)
Cite this article (links to download the citations from this article in formats compatible with various reference manager tools)
The integration of Gaussian noise by long-range amygdala inputs in frontal circuit promotes fear learning in mice
eLife 9:e62594.
https://doi.org/10.7554/eLife.62594


