Glutamine deprivation triggers NAGK-dependent hexosamine salvage
- Department of Cancer Biology, University of Pennsylvania, United States
- Abramson Family Cancer Research Institute, University of Pennsylvania, United States
- Department of Systems Pharmacology and Translational Therapeutics, University of Pennsylvania, United States
- Meyer Cancer Center and Department of Pharmacology, Weill Cornell Medicine, United States
- Pancreatic Cancer Research Center, Perelman School of Medicine, University of Pennsylvania, United States
- Center for Metabolic Disease Research, Department of Microbiology and Immunology, Lewis Katz School of Medicine, Temple University, United States
Figures
Figure 1 with 1 supplement
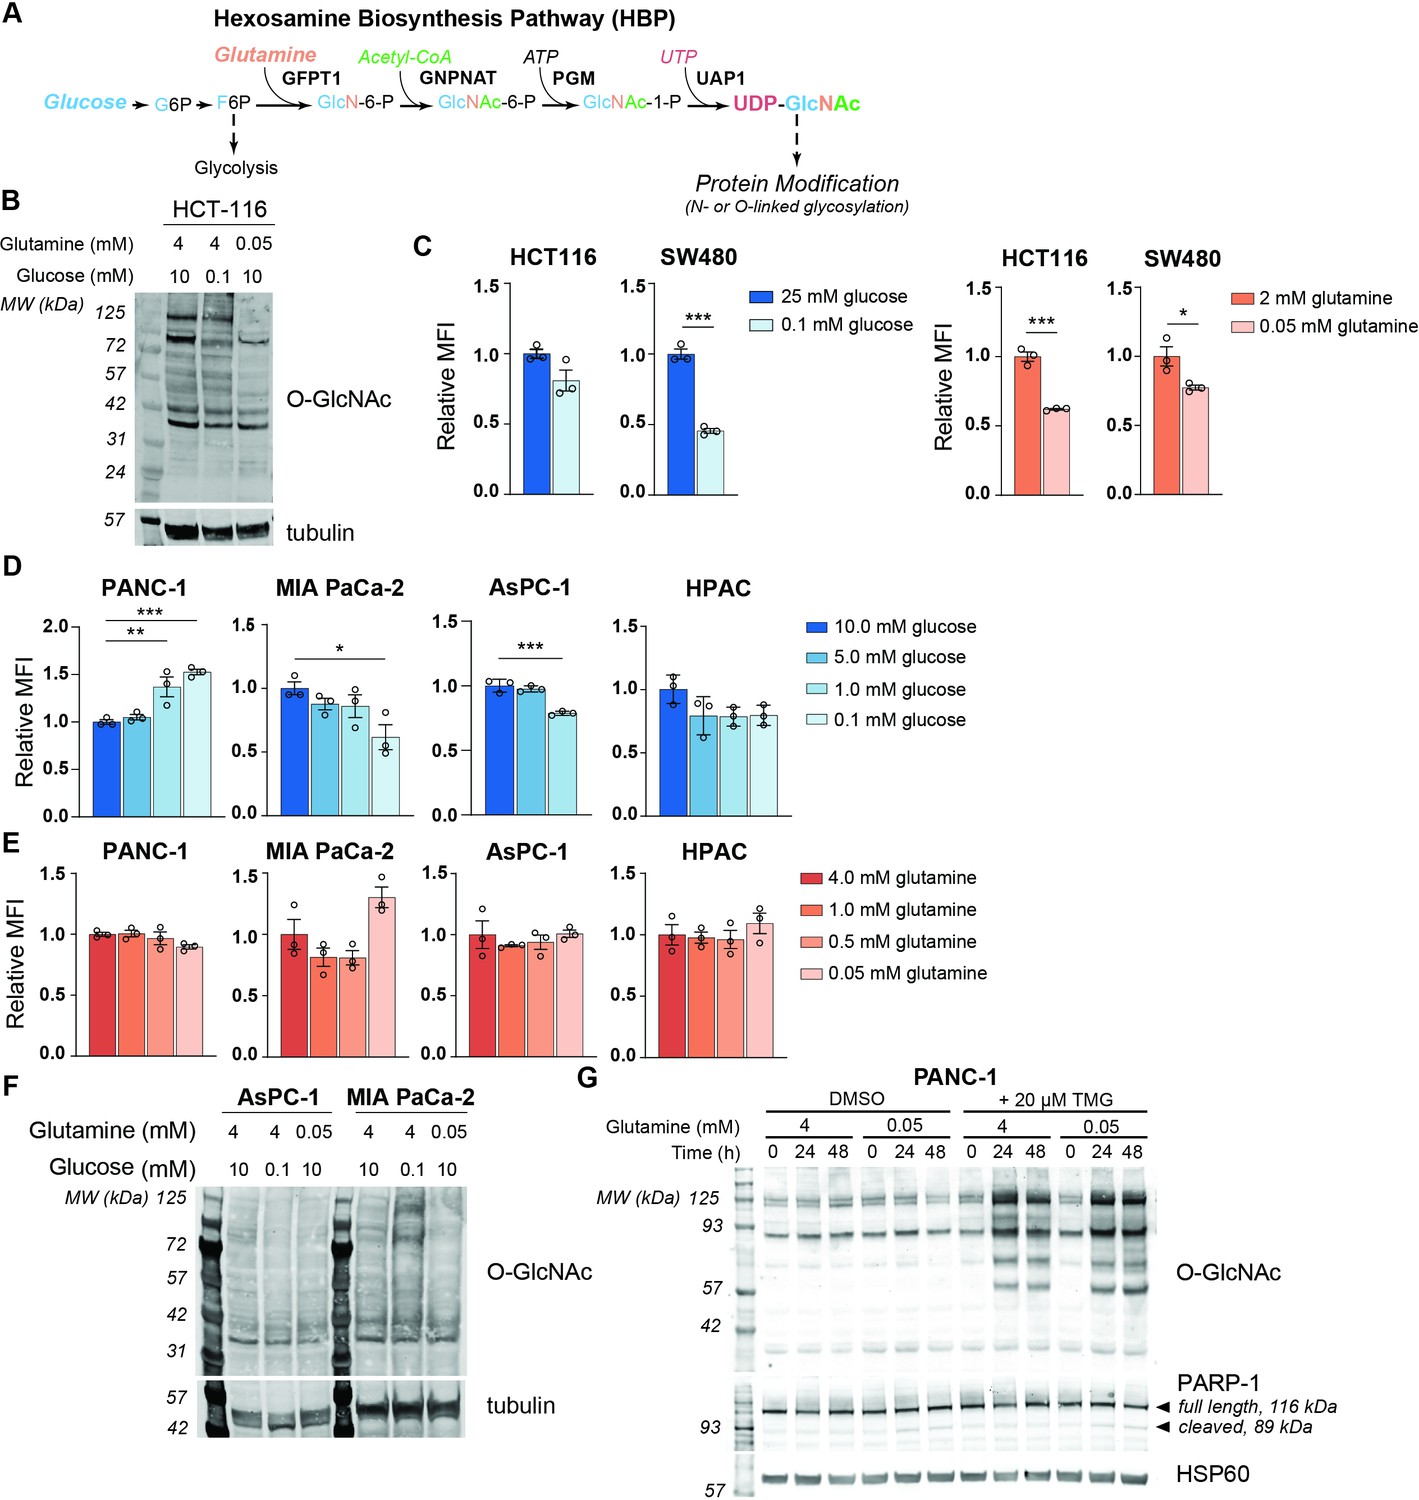
MGAT5-dependent N-glycans are minimally impacted by glucose or glutamine deprivation in PDA cells.
(A) Overview of the hexosamine biosynthesis pathway (HBP). (B) O-GlcNAc levels in HCT-116 cells in high and low nutrients; cells were incubated in indicated concentrations of glucose and glutamine for 48 hr. (C) Phytohemagglutinin-L (L-PHA) binding in colon cancer cells. Cells were incubated in the indicated concentrations of glucose (left) or glutamine (right) for 48 hr and then analyzed by flow cytometry. Graph shows mean fluorescence intensity (MFI) relative to control condition. Statistical significance was calculated by unpaired t-test. (D, E) L-PHA binding in pancreatic ductal adenocarcinoma (PDA) cells in low nutrients. Cells were incubated in the indicated concentrations of glucose (D) or glutamine (E) for 48 hr and then analyzed by flow cytometry. Statistical significance was calculated by one-way ANOVA. (F) O-GlcNAc levels in PDA cells in high and low nutrients. Cells were incubated in the indicated concentrations of glutamine for 48 hr. (G) Western blot for O-GlcNAc in PANC-1 cells cultured in the indicated concentrations of glutamine with or without Thiamet-G (TMG) treatment for the indicated time. For all bar graphs, mean ± standard error of the mean (SEM) of three biological replicates is represented. Panels (B–G) are representative of at least two independent experimental replicates. *p≤0.05; **p≤0.01; ***p≤0.001.
Figure 1—figure supplement 1
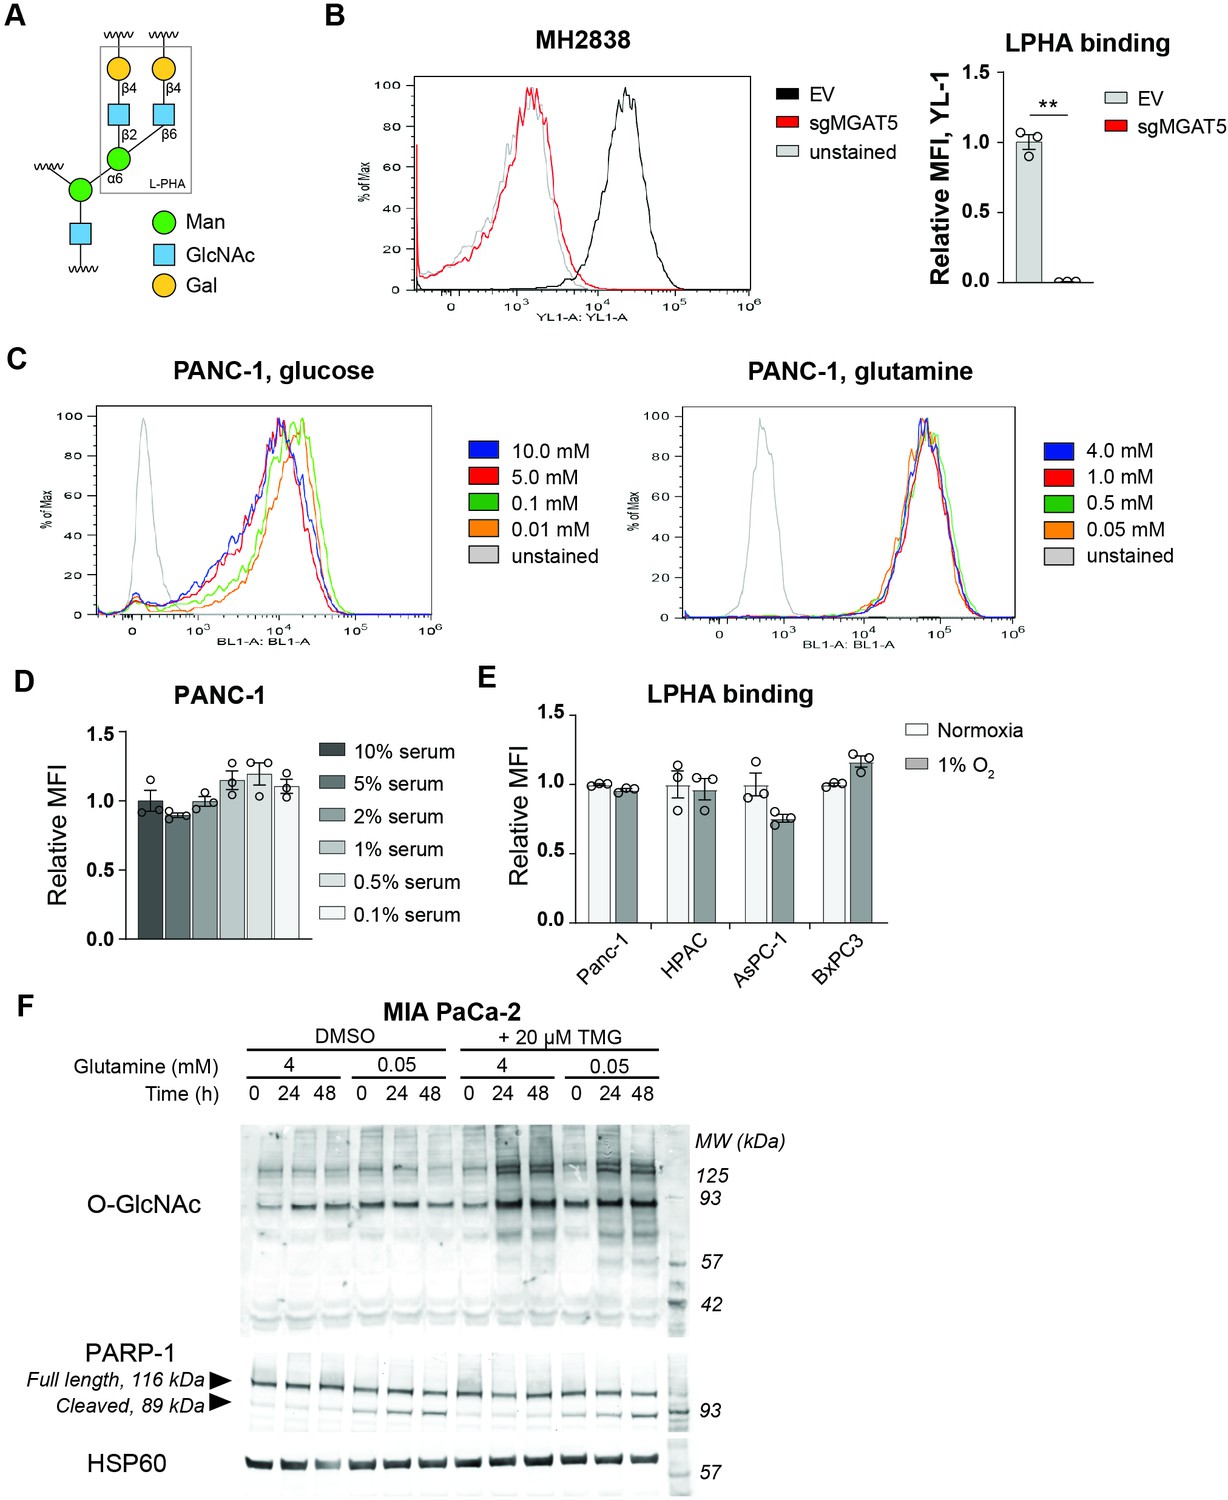
L-PHA binding detects MGAT5-dependent glycans.
(A) Diagram of L-PHA binding. L-PHA recognizes specifically the β1–6 linkage established by MGAT5. (B) L-PHA binding on MGAT5 knockout cells isolated from a KPCY tumor (Li et al., 2018), representative flow plot and quantification. Graph shows MFI relative to control cells. Statistical significance was calculated by unpaired t-test. (C) Representative flow plots for L-PHA binding graphed in Figure 1D,E on PANC-1 cells in low glucose and low glutamine. (D–E) L-PHA binding in PDA cells in low nutrients. Cells were incubated in the indicated concentrations of serum (D) or oxygen (E) for 48 hr and then analyzed by flow cytometry. Graph shows MFI relative to control condition. (F) Western blot for O-GlcNAc and PARP in MIA PaCa-2 cells cultured in the indicated concentrations of glutamine with or without TMG for the indicated time. Statistical significance was calculated by one-way ANOVA (D) and unpaired t-test (E). Panels (B–E) are representative of at least two independent experimental replicates. *p≤0.05; **p≤0.01; ***p≤0.001.
Figure 2 with 3 supplements
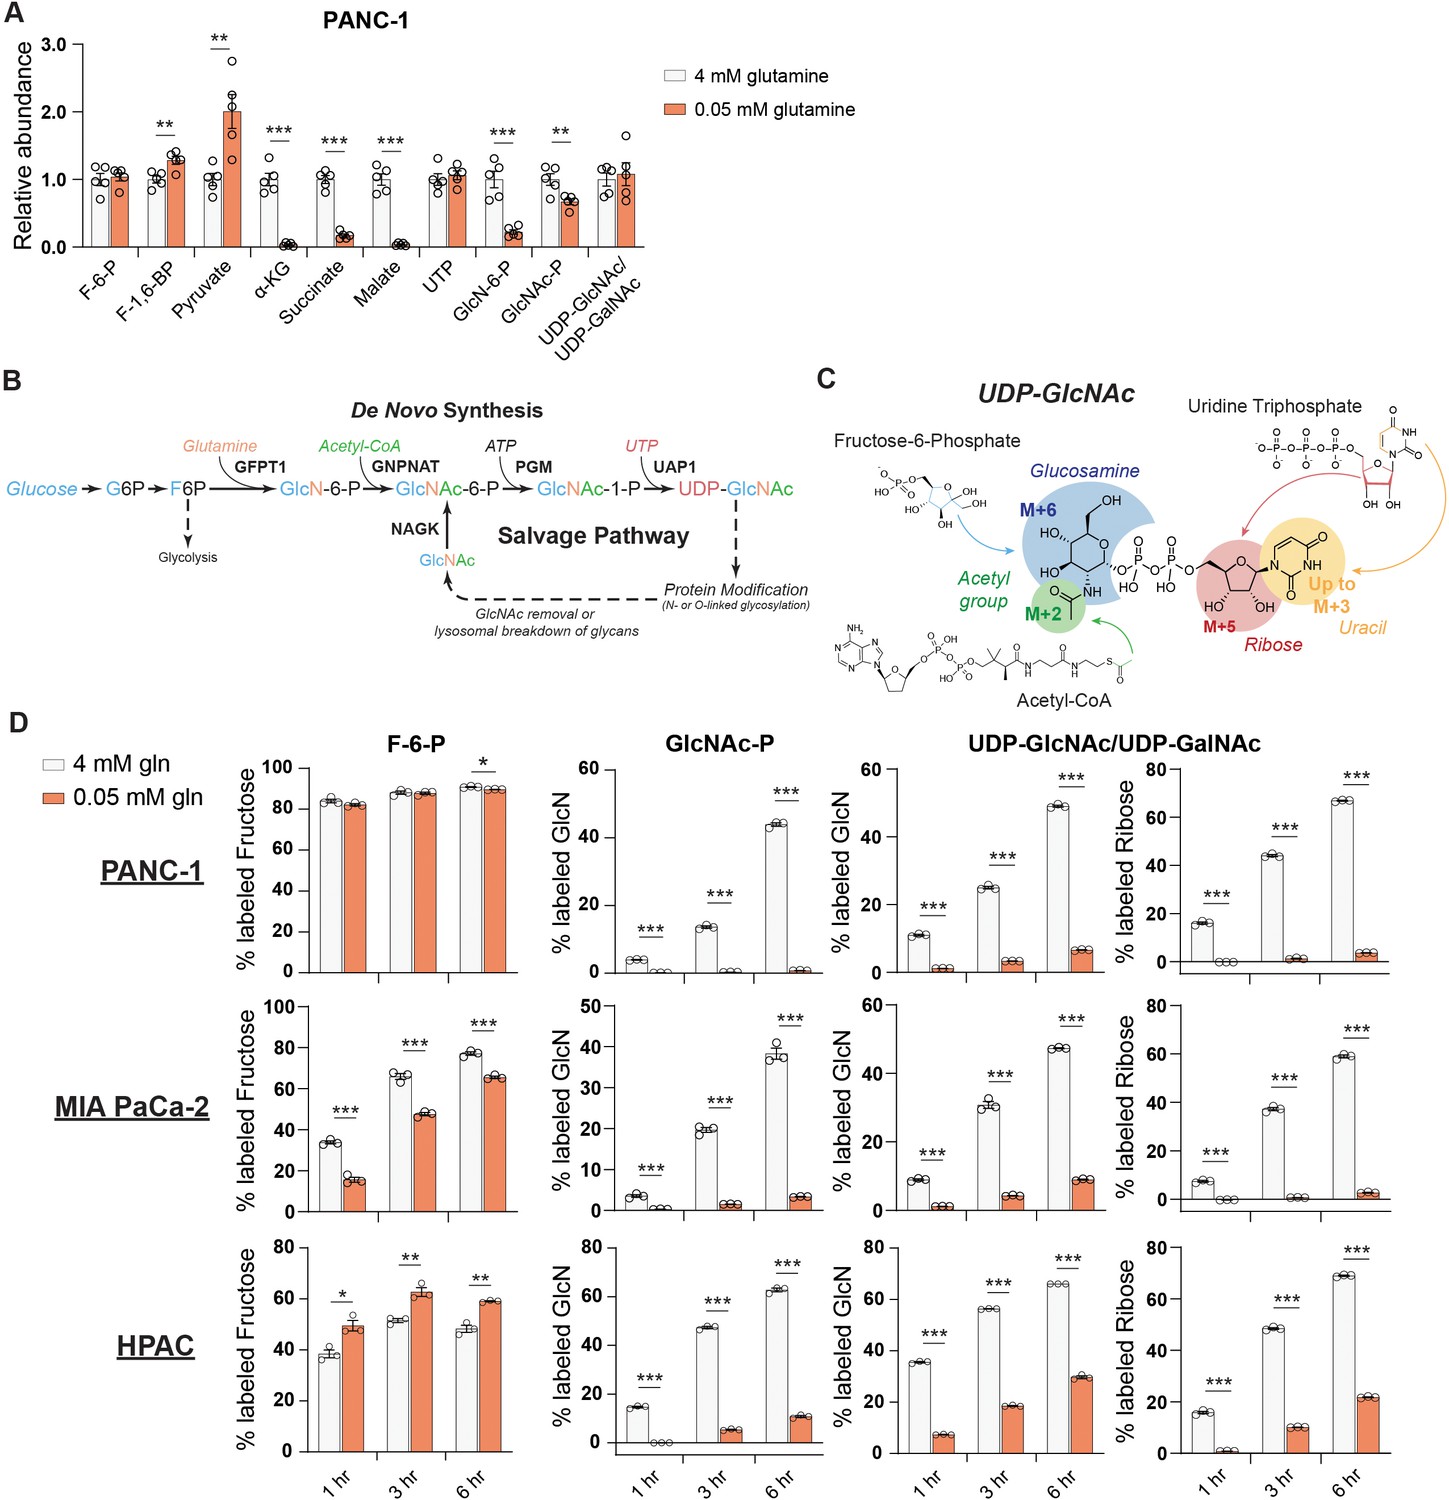
De novo UDP-GlcNAc synthesis is suppressed upon glutamine deprivation.
(A) Metabolite measurements in PANC-1 cells after culture for 48 hr in 0.05 mM glutamine. Quantification is normalized to 4 mM glutamine condition. Statistical significance was calculated by unpaired t-test. Mean ± SEM of five biological replicates is represented. (B) Overview of the GlcNAc salvage pathway feeding into the HBP. GlcNAc scavenged from O-GlcNAc removal or lysosomal breakdown of glycans can be phosphorylated by NAGK and used to regenerate UDP-GlcNAc. (C) Overview of the incorporation of 13C glucose into UDP-GlcNAc. Different parts of the molecule can be labeled from glucose-derived subunits; thus, isotopologs up to M+16 can be derived from glucose. (D) 13C glucose tracing into F-6-P, GlcNAc-P, and UDP-GlcNAc in indicated glutamine concentrations. % labeled GlcN indicates sum of M+6 and M+8 isotopologs for GlcNAc-P and sum of M+6, M+8, M+11, and M+13 for UDP-GlcNAc. % labeled Ribose indicates sum of M+5, M+7, M+11, and M+13 for UDP-GlcNAc. All isotopologs are graphed in Figure 2—figure supplement 1A. Statistical significance was calculated by unpaired t-test. Mean ± SEM of three biological replicates is represented. *p≤0.05; **p≤0.01; ***p≤0.001.
Figure 2—figure supplement 1
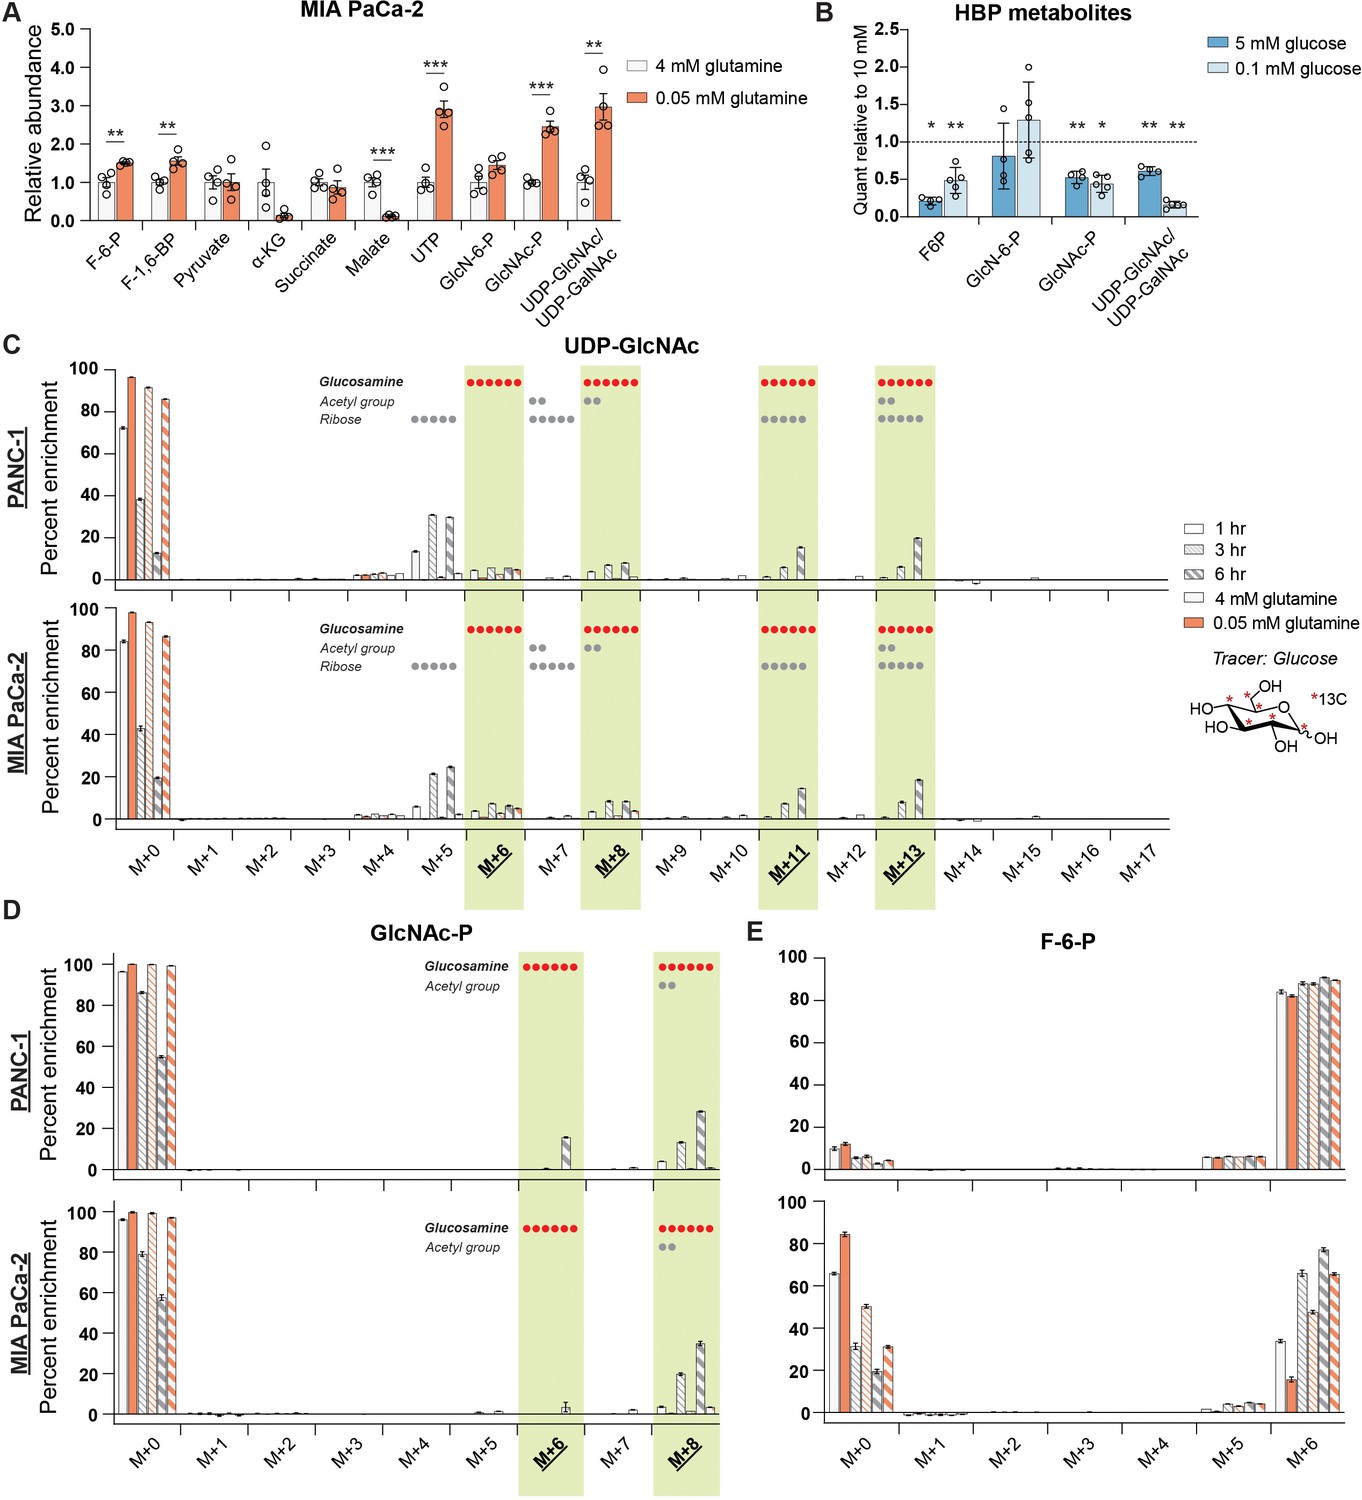
De novo hexosamine synthesis is suppressed in low glutamine conditions.
(A) Metabolite measurements in MIA PaCa-2 cells after culture for 48 hr in 0.05 mM glutamine. Quantification is normalized to 4 mM glutamine condition. Statistical significance was calculated by unpaired t-test. Mean ± SEM of four biological replicates is represented. (B) Measurement of HBP metabolites in PANC-1 cells after culture for 48 hr in 5 mM or 0.1 mM glucose. Mean ± SEM of four (5 mM) or five (0.1 mM) biological replicates is represented. Statistical significance was calculated by unpaired t-test comparing each low glucose condition to the 10 mM glucose control in each experiment. (C) Measurement of 13C glucose incorporation into UDP-GlcNAc in high and low glutamine. Mean ± SEM of three biological replicates is represented. (D) Measurement of 13C glucose incorporation into GlcNAc-P in high and low glutamine. Mean ± SEM of three biological replicates is represented. For (C, D), components of molecule labeled in each isotopolog are indicated, with dots representing the number of carbons; highlighted panels identify glucosamine ring labeling. (E) Measurement of 13C glucose into fructose-6-phosphate in high and low glutamine. Mean ± SEM of three biological replicates is represented. *p≤0.05; **p≤0.01; ***p≤0.001.
Figure 2—figure supplement 2
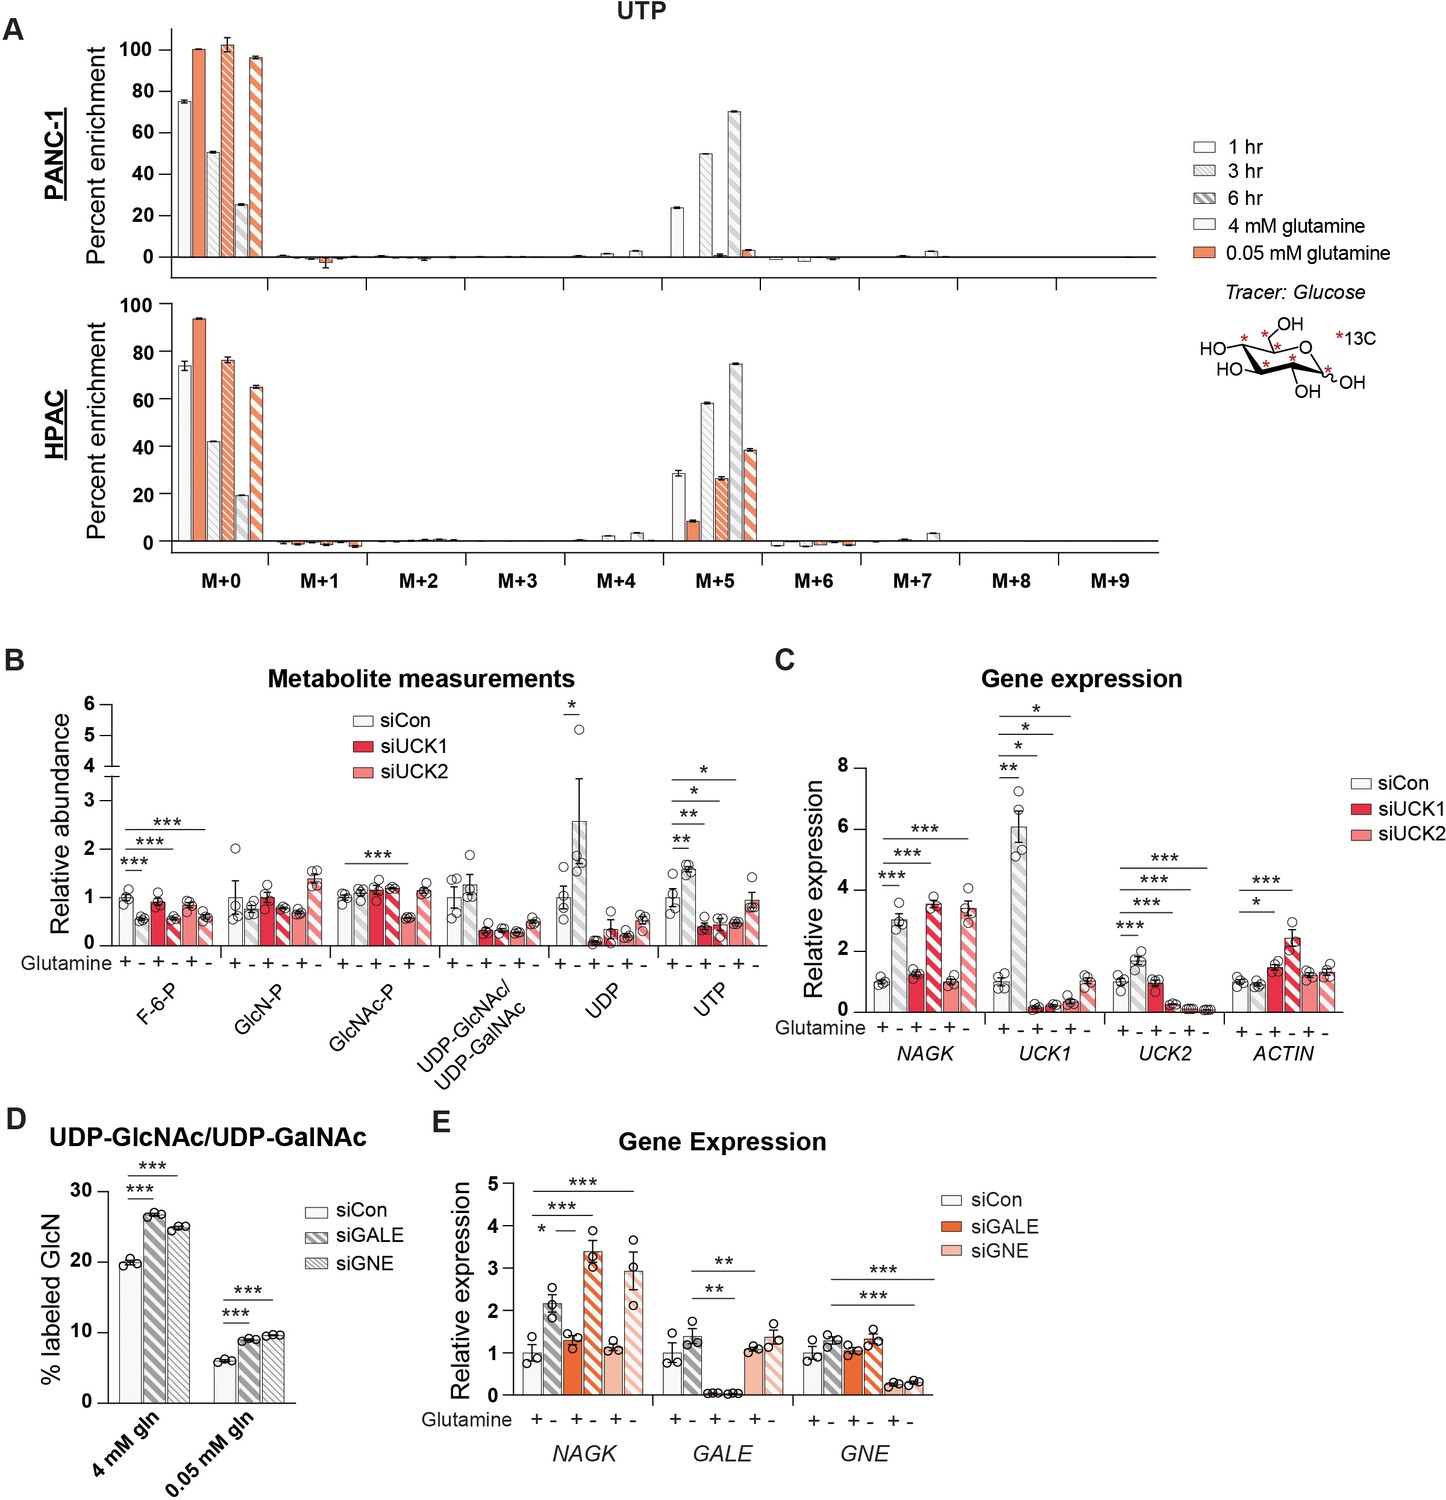
Uridine is salvaged in glutamine-restricted conditions.
(A) Measurement of incorporation of 13C glucose into uridine triphosphate (UTP) in high and low glutamine. Mean ± SEM of three biological replicates is represented. (B) Measurement of metabolites in PANC-1 cells after transfection with the indicated siRNAs and incubation in 4 mM (+) or 0.05 mM (−) glutamine for 48 hr. Mean ± SEM of four biological replicates is represented. (C) Gene expression of the indicated genes in PANC-1 cells after transfection with the indicated siRNAs and incubation in 4 mM (+) or 0.05 mM (−) glutamine for 48 hr. Mean ± SEM of four biological replicates is represented. (D) Measurement of incorporation of 13C glucose into UDP-GlcNAc in PANC-1 cells transfected with the indicated siRNAs and incubated in 4 mM or 0.05 mM glutamine for 48 hr. Mean ± SEM of three biological replicates is represented. (E) Gene expression of the indicated genes in PANC-1 cells after transfection with the indicated siRNAs and incubation in 4 mM (+) or 0.05 nM (−) glutamine for 48 hr. Mean ± SEM of three biological replicates is represented. *p≤0.05; **p≤0.01; ***p≤0.001.
Figure 2—figure supplement 3

NAGK protein expression does not increase in low glutamine despite increase in NAGK gene expression.
(A) Gene expression of the indicated genes in PDA cell lines after incubation in 4 mM or 0.05 mM glutamine for 48 hr. Mean ± SEM of three biological replicates is represented. Statistical significance was determined by unpaired t-test. (B) Gene expression of the indicated genes in PDA cell lines after incubation in 10 mM or 0.1 mM glucose for 48 hr. Mean ± SEM of three biological replicates is represented. Statistical significance was determined by unpaired t-test. (C) Western blot for NAGK in low nutrient conditions. PANC-1 and MIA PaCa-2 cells were cultured in the indicated concentrations of glucose and glutamine for 48 hr. (D) Western blot for NAGK in low nutrient conditions, using large electrophoresis system. PANC-1 cells were cultured in the indicated glutamine concentrations and lysates were prepared with or without phosphatase inhibitors. A band shift is observed for NAGK in lysates with Na3VO4. *p≤0.05; **p≤0.01; ***p≤0.01.
Figure 3 with 2 supplements
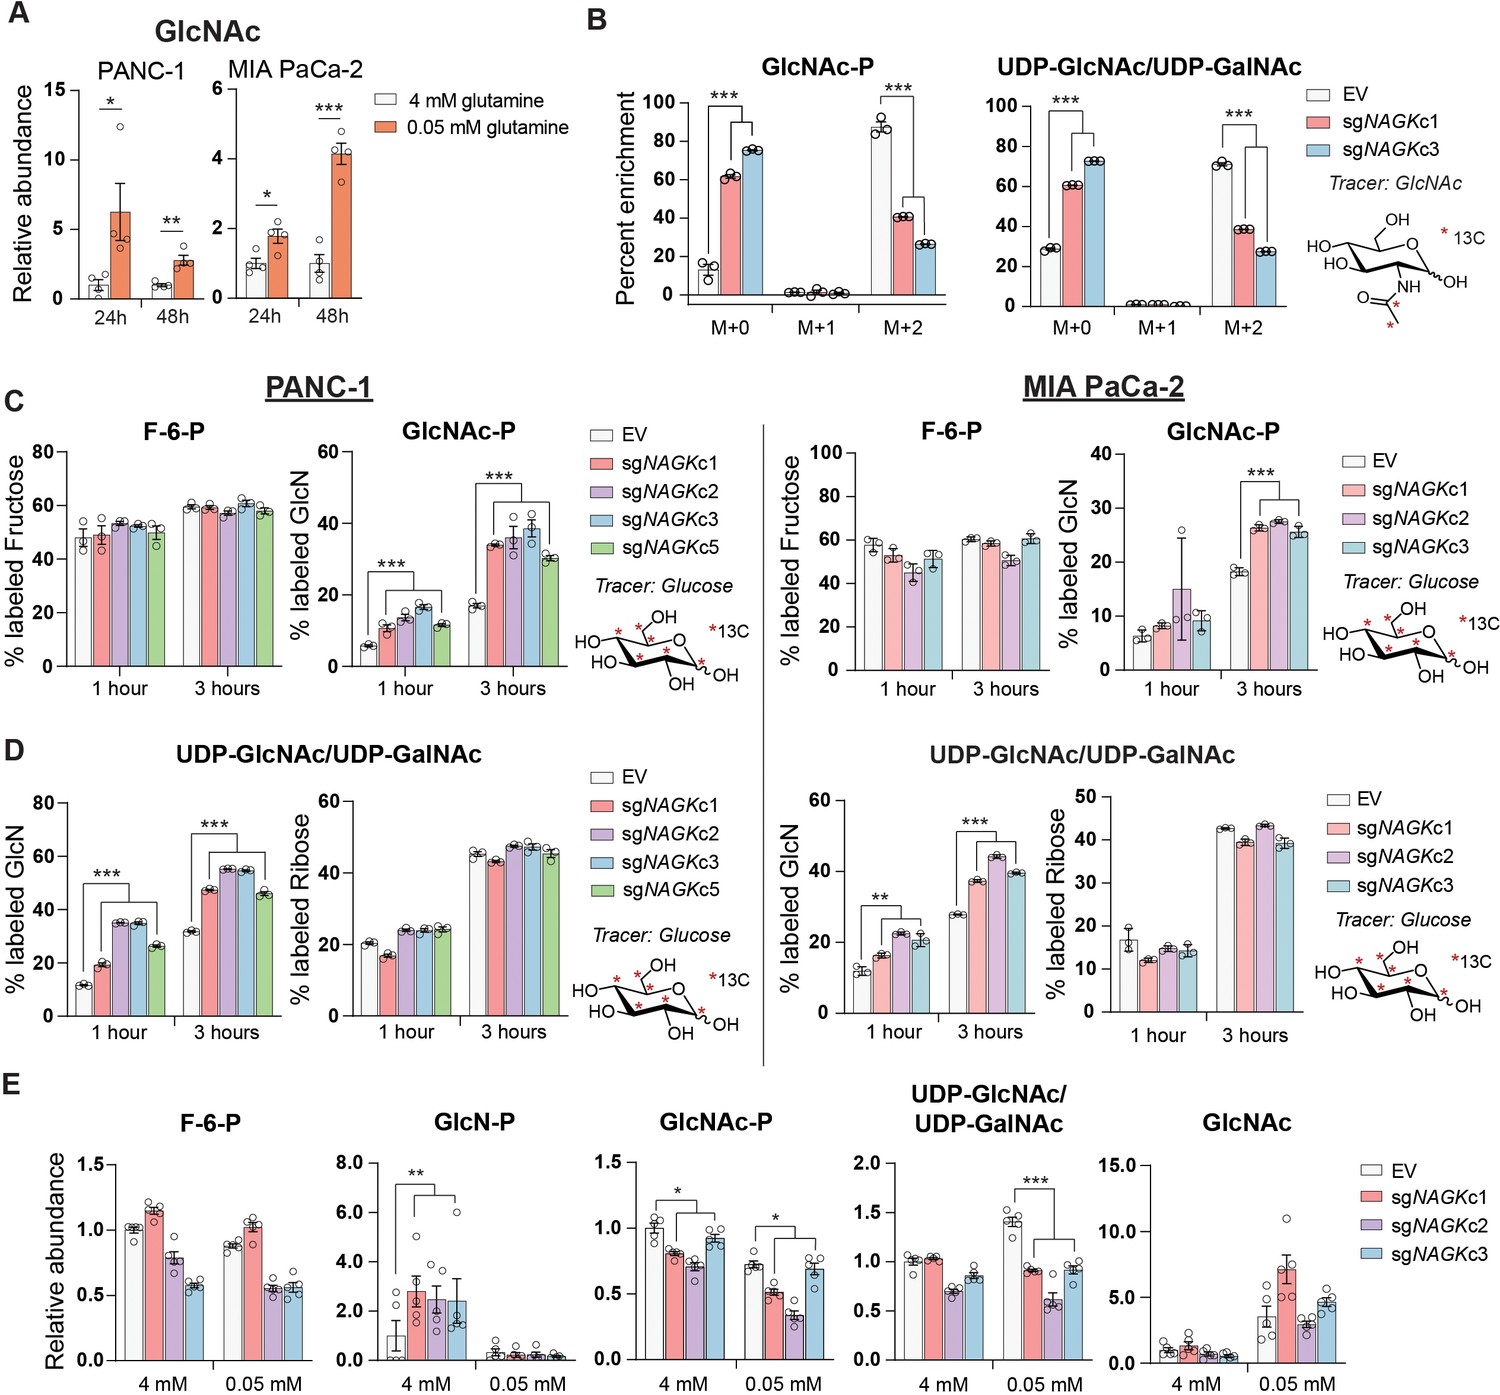
GlcNAc salvage feeds UDP-GlcNAc pools in pancreatic cancer cells.
(A) Measurement of GlcNAc in PANC-1 and MIA PaCa-2 cells after incubation in the indicated concentrations of glutamine for 24 and 48 hr. Mean ± SEM of four biological replicates is represented. Statistical significance was calculated by unpaired t-test. (B) Measurement of 13C GlcNAc labeled on the acetyl group into GlcNAc-P and UDP-GlcNAc in NAGK knockout cells. Cells were incubated with 10 mM 13C GlcNAc for 6 hr. Mean ± SEM of three biological replicates is represented. Statistical significance was calculated by unpaired t-test comparing the mean incorporation of the two CRISPR clones and the empty vector (EV) control. (C) Labeling of F-6-P and GlcNAc-P from 13C glucose in PANC-1 (left) and MIA PaCa-2 (right) NAGK knockout cells. Statistical significance was calculated by unpaired t-test comparing the mean incorporation of the four CRISPR clones and the EV control. Mean ± SEM of three biological replicates is represented. (D) Percent of combined UDP-GlcNAc isotopologs containing a labeled glucosamine ring or a labeled ribose from UTP, calculated from S3.1 (E). Statistical significance was calculated by unpaired t-test comparing the mean incorporation of the four CRISPR clones and the EV control. Mean ± SEM of three biological replicates is represented. (E) Measurement of HBP metabolites in PANC-1 NAGK knockout cells cultured in the indicated concentrations of glutamine. Statistical significance was calculated by unpaired t-test comparing the mean incorporation of the four CRISPR clones and the EV control. Mean ± SEM of four biological replicates is represented. *p≤0.05; **p≤0.01; ***p≤0.01.
Figure 3—figure supplement 1
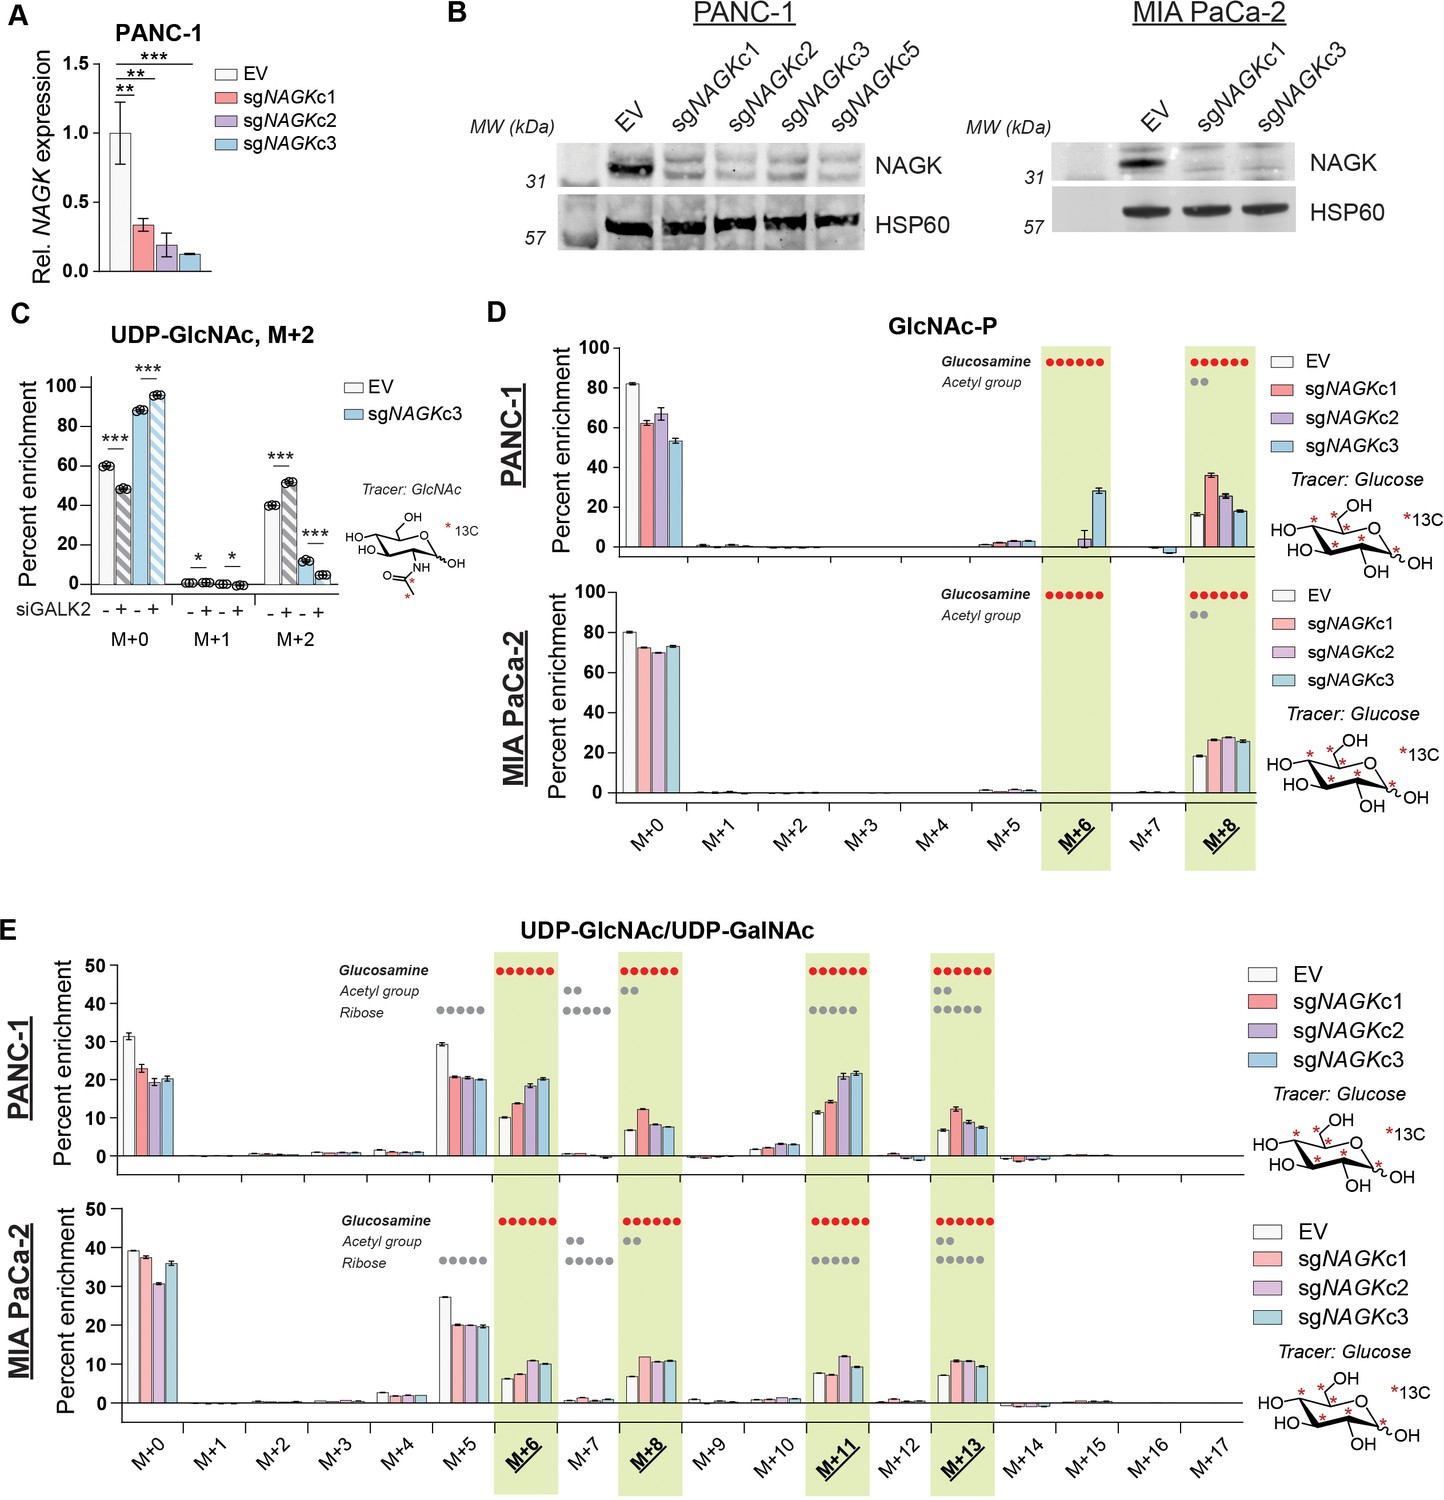
NAGK knockout cells show increased enrichment of 13C glucose into hexosamine intermediates.
(A) Gene expression of NAGK in PANC-1 NAGK knockout cells. Mean ± SEM of three biological replicates is represented. Statistical significance was determined by one-way ANOVA. (B) Western blot for NAGK and HSP60 in PANC-1 (left) and MIA PaCa-2 (right) NAGK knockout cells. (C) Measurement of incorporation of 13C GlcNAc labeled on the acetyl group into UDP-GlcNAc in PANC-1 NAGK knockout cells. Cells were incubated with 10 mM 13C GlcNAc for 3 hr. Mean ± SEM of three biological replicates is represented. Statistical significance was determined by unpaired t-test comparing siCon and siGALK2 for each clone. (D) Measurement of incorporation of 13C glucose into GlcNAc-P in NAGK knockout cells. Mean ± SEM of three biological replicates is represented. (E) Measurement of incorporation of 13C glucose into UDP-GlcNAc in NAGK knock (D–E), components of molecule labeled in each isotopolog are indicated, with dots representing the number of carbons; highlighted panels identify glucosamine ring labeling. *p≤0.05; **p≤0.01; ***p≤0.01.
Figure 3—figure supplement 2
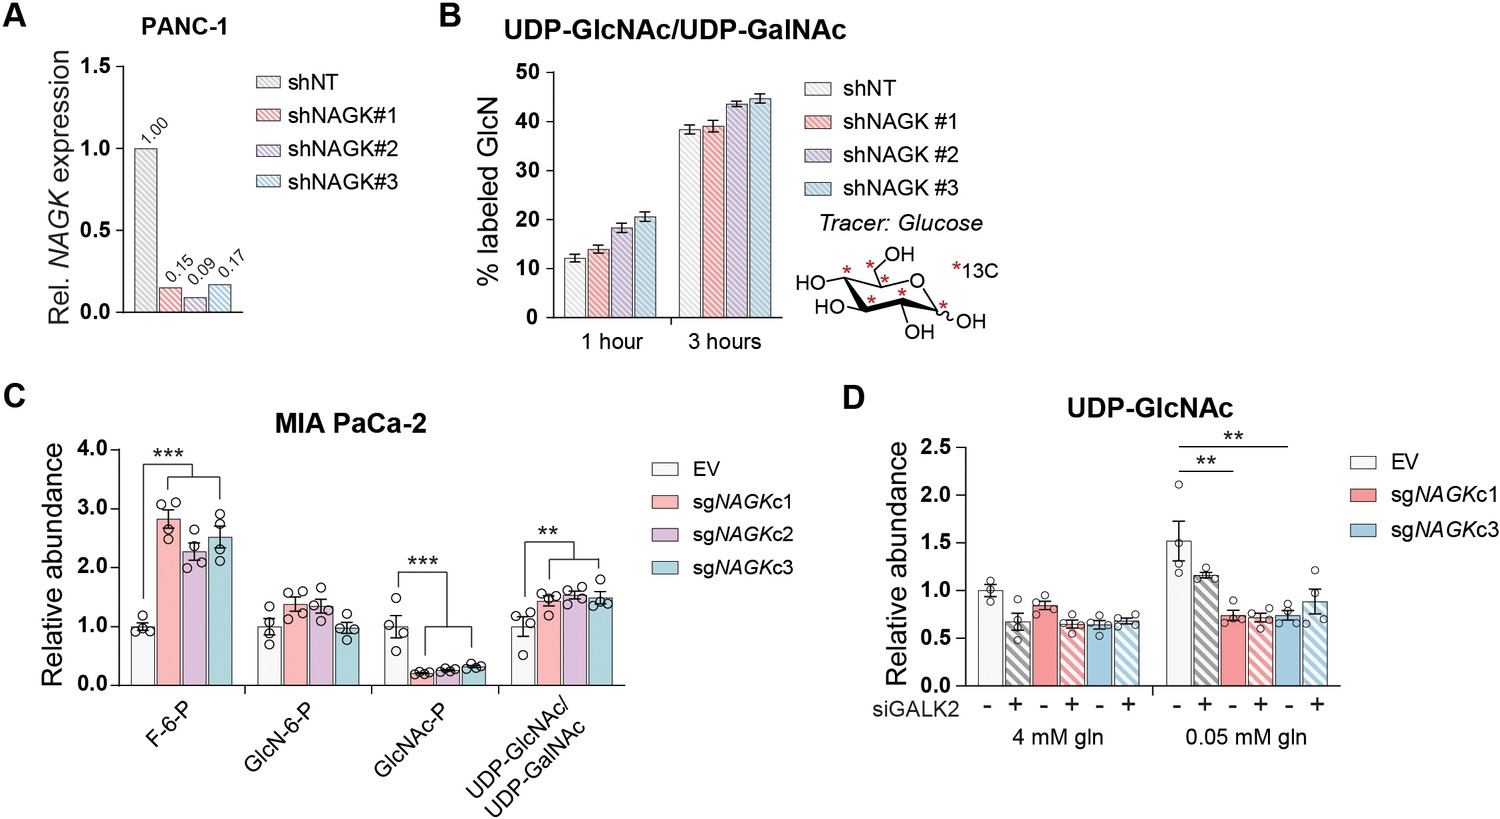
HBP metabolites in NAGK KO cells.
(A) Gene expression of NAGK in PANC-1 cells transfected with shRNA against NAGK. One biological sample is represented. (B) Incorporation of 13C glucose into the glucosamine ring of UDP-GlcNAc in PANC-1 cells transfected with the indicated shRNAs targeting NAGK. Mean ± SEM of three biological replicates is represented. (C) Measurement of HBP metabolites in MIA PaCa-2 NAGK knockout cells cultured in 4 mM glutamine. Mean ± SEM of four biological replicates is represented. Statistical significance was calculated by unpaired t-test comparing the mean of the three CRISPR clones and the empty vector control. (D) Measurement of UDP-GlcNAc in PANC-1 NAGK knockout cells. Mean ± SEM of four biological replicates is represented. Statistical significance was calculated by one-way ANOVA comparing each knockout to the EV control. *p≤0.05; **p≤0.01; ***p≤0.001.
Figure 4 with 1 supplement
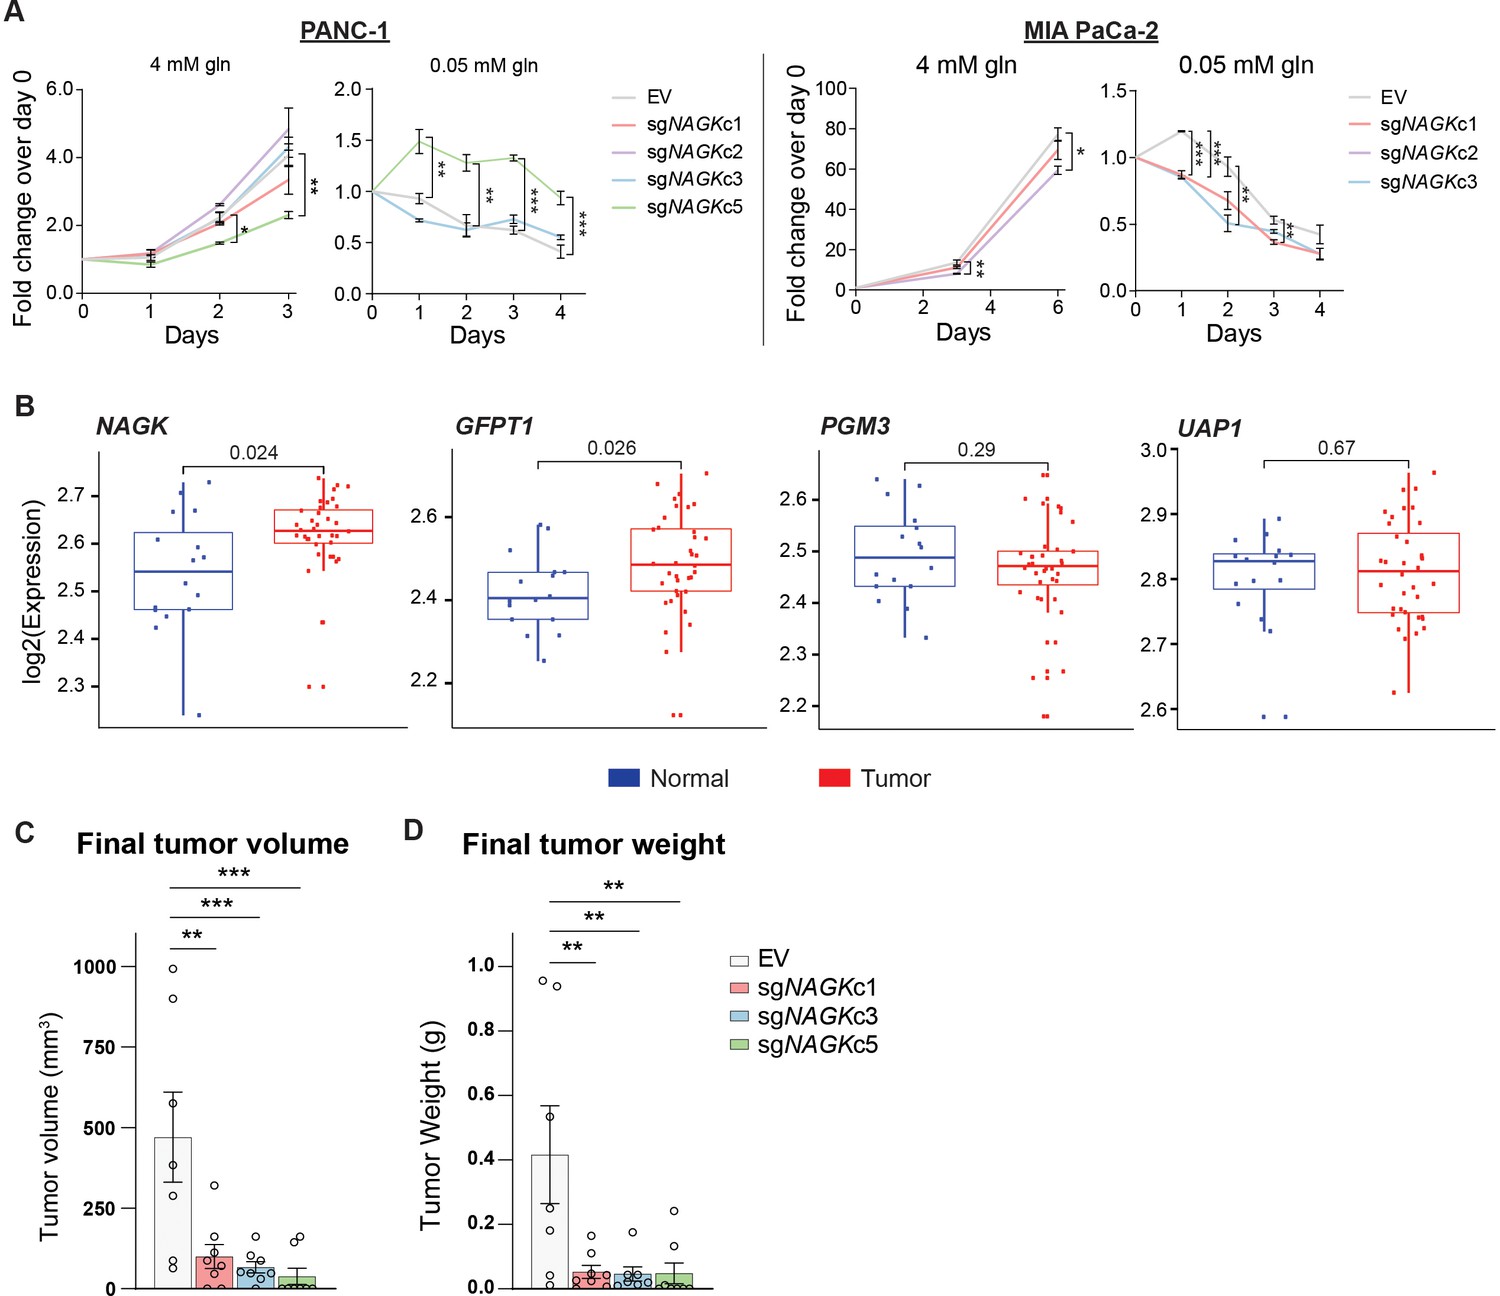
NAGK expression is increased in human PDA tumors and NAGK knockout reduces tumor growth in vivo.
(A) 2D proliferation assay by cell count in PANC-1 and MIA PaCa-2 NAGK knockout cells. Mean ± SEM of three technical replicates is represented. Statistical significance was calculated using one-way ANOVA at each time point. (B) Gene expression data for NAGK, GFPT1, PGM3, and UAP1 in human PDA tumors compared with matched normal tissue. Statistical analysis was conducted by one-way ANOVA, and level of significance was defined as p≤0.01. (C) Final tumor volume and (D) final tumor weight of subcutaneous tumors generated from PANC-1 NAGK knockout cells in vivo. Cells were injected into the right flank of NCr nude mice, and tumor volume was calculated from caliper measurements. Statistical significance was calculated by one-way ANOVA comparing each mean to the EV control mean. Mean ± SEM of biological replicates is represented (n = 8 each group). *p ≤ 0.05; **p ≤ 0.01; ***p ≤ 0.001.
Figure 4—figure supplement 1

NAGK knockout tumors show increased L-PHA binding.
(A) Soft agar colony formation in NAGK knockout and control cells. Mean ± SEM of three biological replicates is represented. (B) Gene expression data plotted using GEPIA2 comparing TCGA pancreatic cancer samples with TCGA normal pancreas samples and GTEx data. Differential analysis between tumor and normal tissues was analyzed by one-way ANOVA. *p<0.05. (C) Tumor volume of NAGK knockout tumors at earlier time points in the experiment. Initial growth of NAGK knockout cells in vivo was comparable to control cells, but over time NAGK knockout tumors either stopped growing or regressed. (D) Western blots for NAGK and α-SMA, and blot probed for L-PHA binding, in whole tumor lysate samples. Blot for HSP60 as loading control.
Tables
Key resources table
| Reagent type (species) or resource | Designation | Source or reference | Identifiers | Additional information |
|---|---|---|---|---|
| Cell line (Homo sapiens) | MIA PaCa-2 | ATCC | CRL-1420 (RRID:CVCL_0428) | |
| Cell line (Homo sapiens) | PANC-1 | ATCC | CRL-1469 (RRID:CVCL_0480) | |
| Cell line (Homo sapiens) | HPAC | ATCC | CRL-2119 (RRID:CVCL_3517) | |
| Cell line (Homo sapiens) | AsPC-1 | ATCC | CRL-1682 (RRID:CVCL_0152) | |
| Cell line (Homo sapiens) | BxPC-3 | ATCC | CRL-1687 (RRID:CVCL_0186) | |
| Cell line (Homo sapiens) | HCT 116 | ATCC | CCL-247 (RRID:CVCL_0291) | |
| Cell line (Homo sapiens) | SW480 | ATCC | CCL-228 (RRID:CVCL_0546) | |
| Recombinant DNA reagent | lentiCRISPRv2 | Addgene | 98290 (RRID:Addgene_98290) | |
| Antibody | O-GlcNAc CTD1106, mouse monoclonal | Cell Signaling | 9875S (RRID:AB_10950973) | WB (1:1000) |
| Antibody | Tubulin, mouse monoclonal | Sigma | T6199 (RRID:AB_477583) | WB (1:1000) |
| Antibody | HSP60, rabbit monoclonal | Cell Signaling | 12165S (RRID:AB_2636980) | WB (1:1000) |
| Antibody | NAGK, rabbit polyclonal | Atlas Antibodies | HPA035207 (RRID:AB_10602031) | WB (0.4 ug/mL) |
| Antibody | NAGK, rabbit polyclonal | Proteintech | 15051–1-AP (RRID:AB_2152368) | WB (1:1000) |
| Antibody | AKT phosphoS473, rabbit monoclonal | Cell Signaling | 4060 (RRID:AB_2315049) | WB (1:1000) |
| Antibody | Viniculin, mouse monoclonal | Sigma | V9264 (RRID:AB_10603627) | WB (1:10000) |
| Chemical compound | [U-13C]-glucose | Cambridge Isotopes | CLM-1396–1 | |
| Chemical compound | 13C GlcNAc | Omicron Biochemicals | GLC-006 | |
| Strain, strain background (Mus musculus) | NCr nude mice | Taconic | CrTac:NCr-Foxn1nu (RRID:IMSR_TAC:ncrnu) | |
| Sequence-based reagent | GFPT1 forward | This paper | RT-qPCR primers | CTCTGGCTTTGGTGGATAAA |
| Sequence-based reagent | GFPT1 reverse | This paper | RT-qPCR primers | GCAACCACTTGCTGAAGA |
| Sequence-based reagent | NAGK forward | This paper | RT-qPCR primers | GTGCTCATATCTGGAACAGG |
| Sequence-based reagent | NAGK reverse | This paper | RT-qPCR primers | ACCCTCATCACCCATCATA |
| Sequence-based reagent | HPRT forward | This paper | RT-qPCR primers | ATTATGCCGAGGATTTGGAA |
| Sequence-based reagent | HPRT reverse | This paper | RT-qPCR primers | CCCATCTCCTTCATGACATCT |
| Sequence-based reagent | RPL19 forward | This paper | RT-qPCR primers | CAAGAAGGAGGAGATCATCAAG |
| Sequence-based reagent | RPL19 reverse | This paper | RT-qPCR primers | ATCACAGAGGCCAGTATGTA |
| Sequence-based reagent | sgMGAT5 mouse forward | Doench et al., 2016 | CRISPR deletion primers | CACCGGCTGTCATGACACCAGCGTA |
| Sequence-based reagent | sgMGAT5 mouse reverse | Doench et al., 2016 | CRISPR deletion primers | AAACTACGCTGGTGTCATGACAGCC |
| Sequence-based reagent | sgNAGK#1 forward | Doench et al., 2016 | CRISPR deletion primers | CACCGTTGACGTAGCCGATATCATG |
| Sequence-based reagent | sgNAGK#1 reverse | Doench et al., 2016 | CRISPR deletion primers | AAACCATGATATCGGCTACGTCAAC |
| Sequence-based reagent | sgNAGK#2 forward | Doench et al., 2016 | CRISPR deletion primers | CACCGTGCTTGGTGTGCGATCCAGT |
| Sequence-based reagent | sgNAGK#2 reverse | Doench et al., 2016 | CRISPR deletion primers | AAACACTGGATCGCACACCAAGCAC |
| Sequence-based reagent | sgNAGK#3 forward | Doench et al., 2016 | CRISPR deletion primers | CACCGCTCTACACCCCCATAGATCG |
| Sequence-based reagent | sgNAGK#3 reverse | Doench et al., 2016 | CRISPR deletion primers | AAACCGATCTATGGGGGTGTAGAGC |
| Transfected construct (human) | siRNA non-targeting control | Santa Cruz Biotechnology | SC-37007 | |
| Transfected construct (human) | siGALE | Santa Cruz Biotechnology | SC-78950 | |
| Transfected construct (human) | siGNE | Santa Cruz Biotechnology | SC-60693 | |
| Transfected construct (human) | siGALK2 | Santa Cruz Biotechnology | SC-90002 |
Additional files
Download links
A two-part list of links to download the article, or parts of the article, in various formats.
Downloads (link to download the article as PDF)
Open citations (links to open the citations from this article in various online reference manager services)
Cite this article (links to download the citations from this article in formats compatible with various reference manager tools)
Glutamine deprivation triggers NAGK-dependent hexosamine salvage
eLife 10:e62644.
https://doi.org/10.7554/eLife.62644


