Systematic identification of cis-regulatory variants that cause gene expression differences in a yeast cross
- Department of Genetics, Cell Biology, & Development, University of Minnesota, United States
- Department of Chemistry & Biochemistry, University of California, Los Angeles, United States
- Department of Human Genetics, University of California, Los Angeles, United States
- Department of Biological Chemistry, University of California, Los Angeles, United States
- Howard Hughes Medical Institute, University of California, Los Angeles, United States
Figures
Figure 1 with 8 supplements
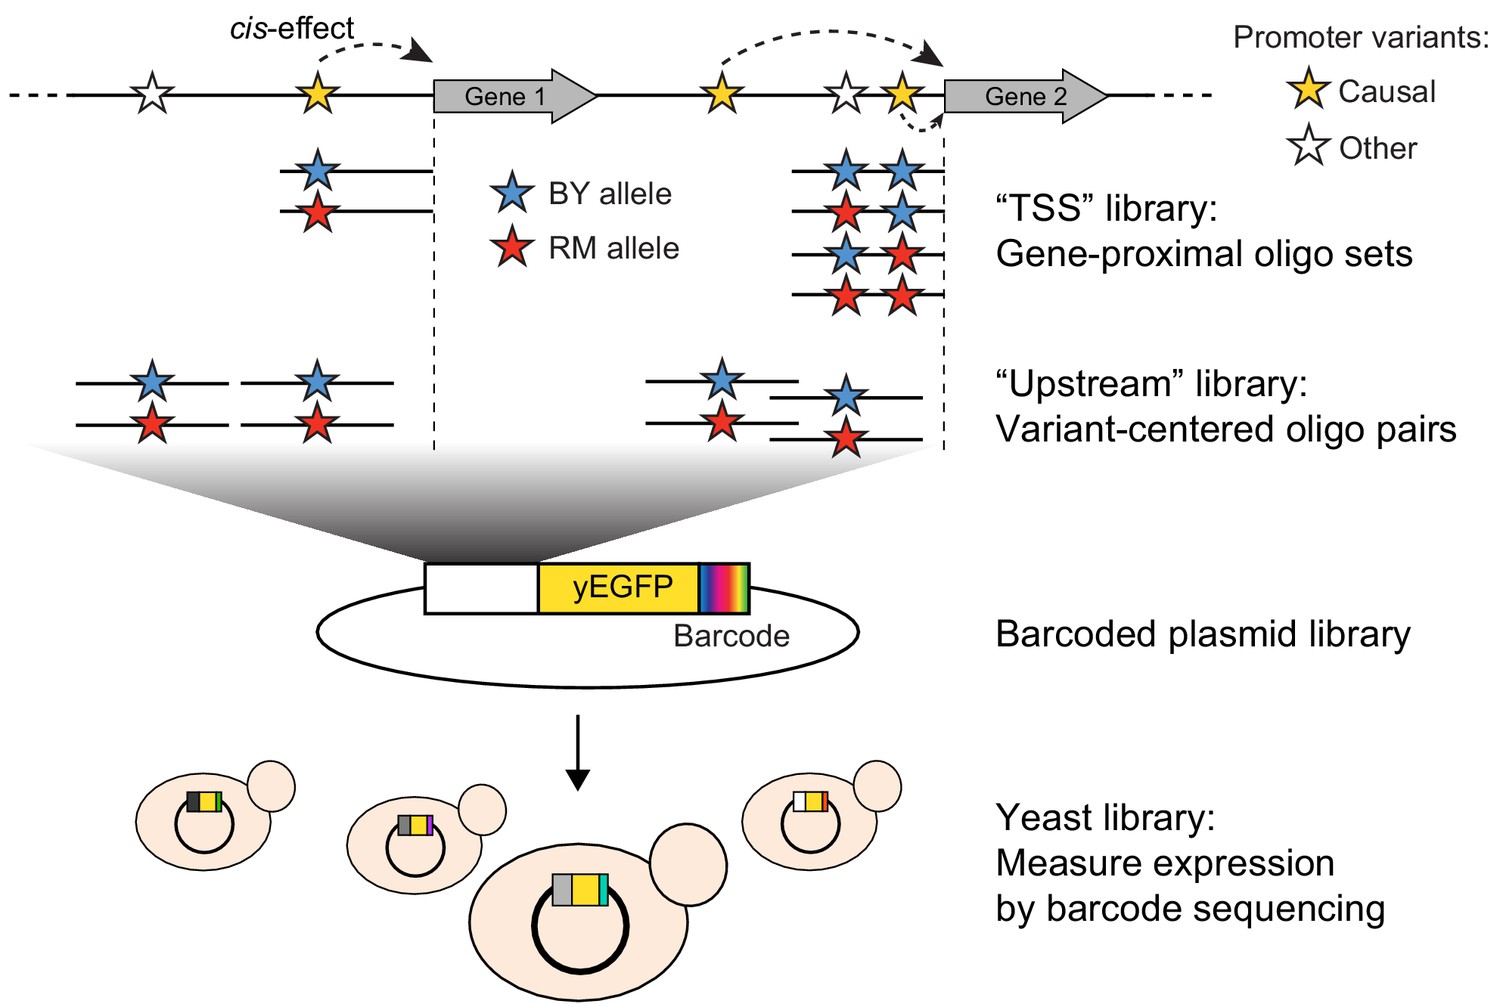
Schematic of MPRA design.
At the top, two native genes in the genome with multiple promoter variants (stars) are shown. Below the two genes, the TSS and Upstream MPRA library designs are illustrated. The TSS library tests all variants within 144 bp of the transcription start site (dashed vertical lines), while the Upstream library tests a subset of TSS variants along with variants located further away from the transcription start site.
Figure 1—figure supplement 1
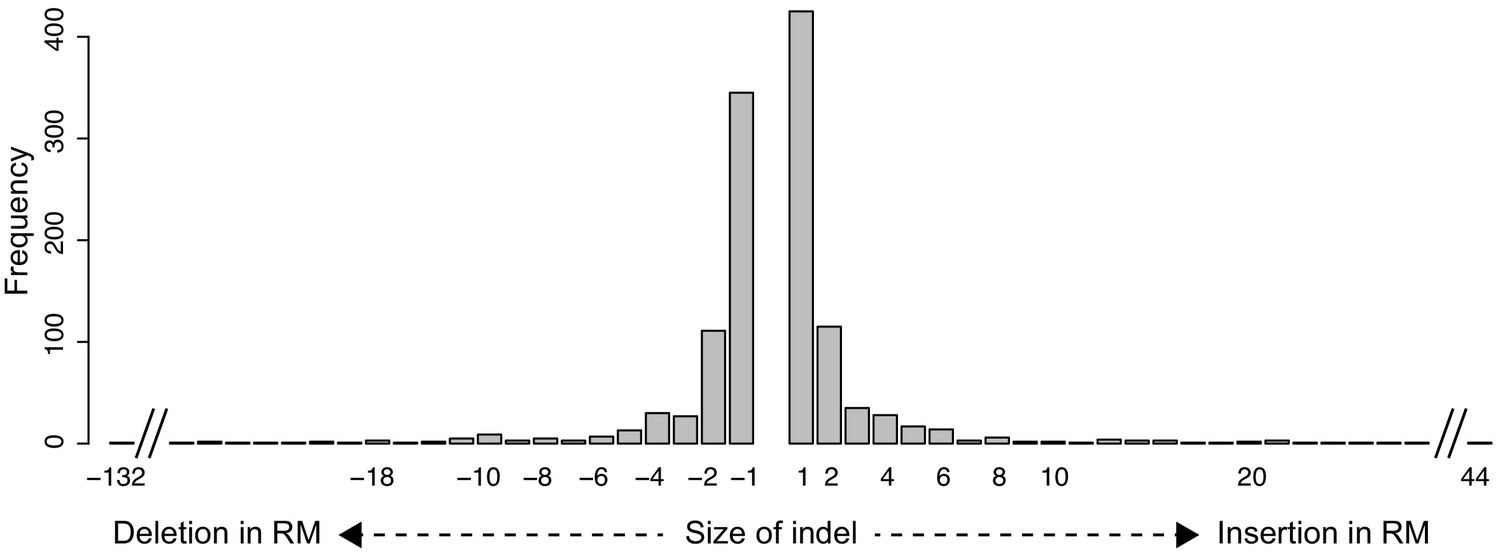
Size distribution of indels in the MPRA design.
Figure 1—figure supplement 2
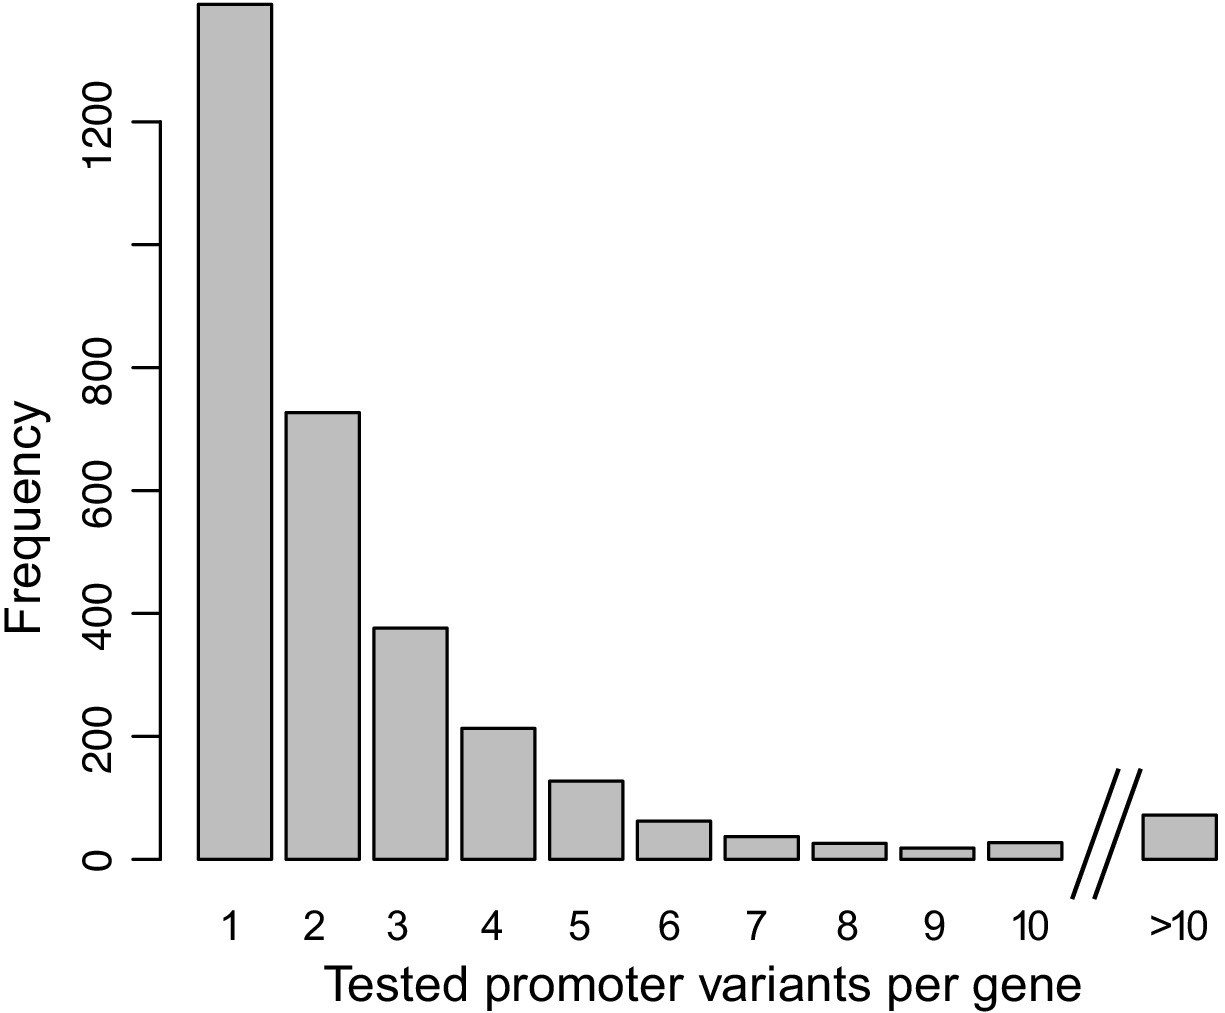
Distribution of the number of promoter variants per gene in the MPRA design.
Figure 1—figure supplement 3
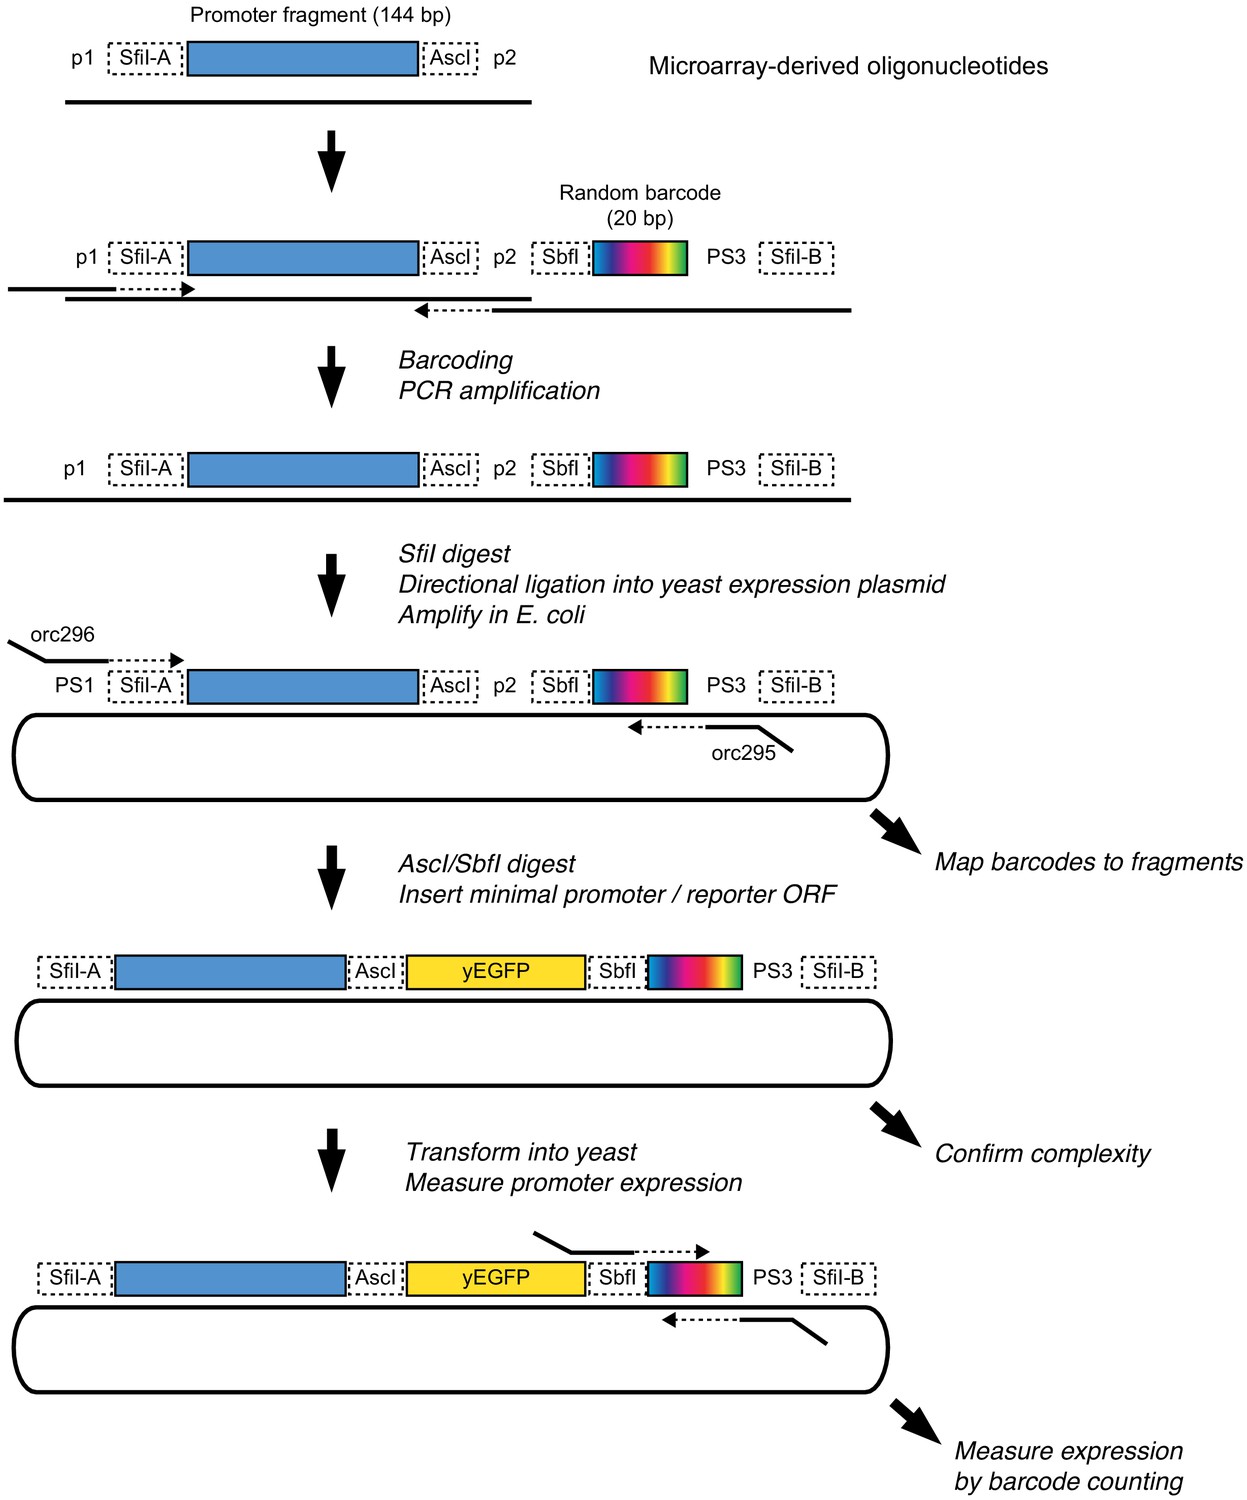
Schematic of the library cloning procedure.
Figure 1—figure supplement 4
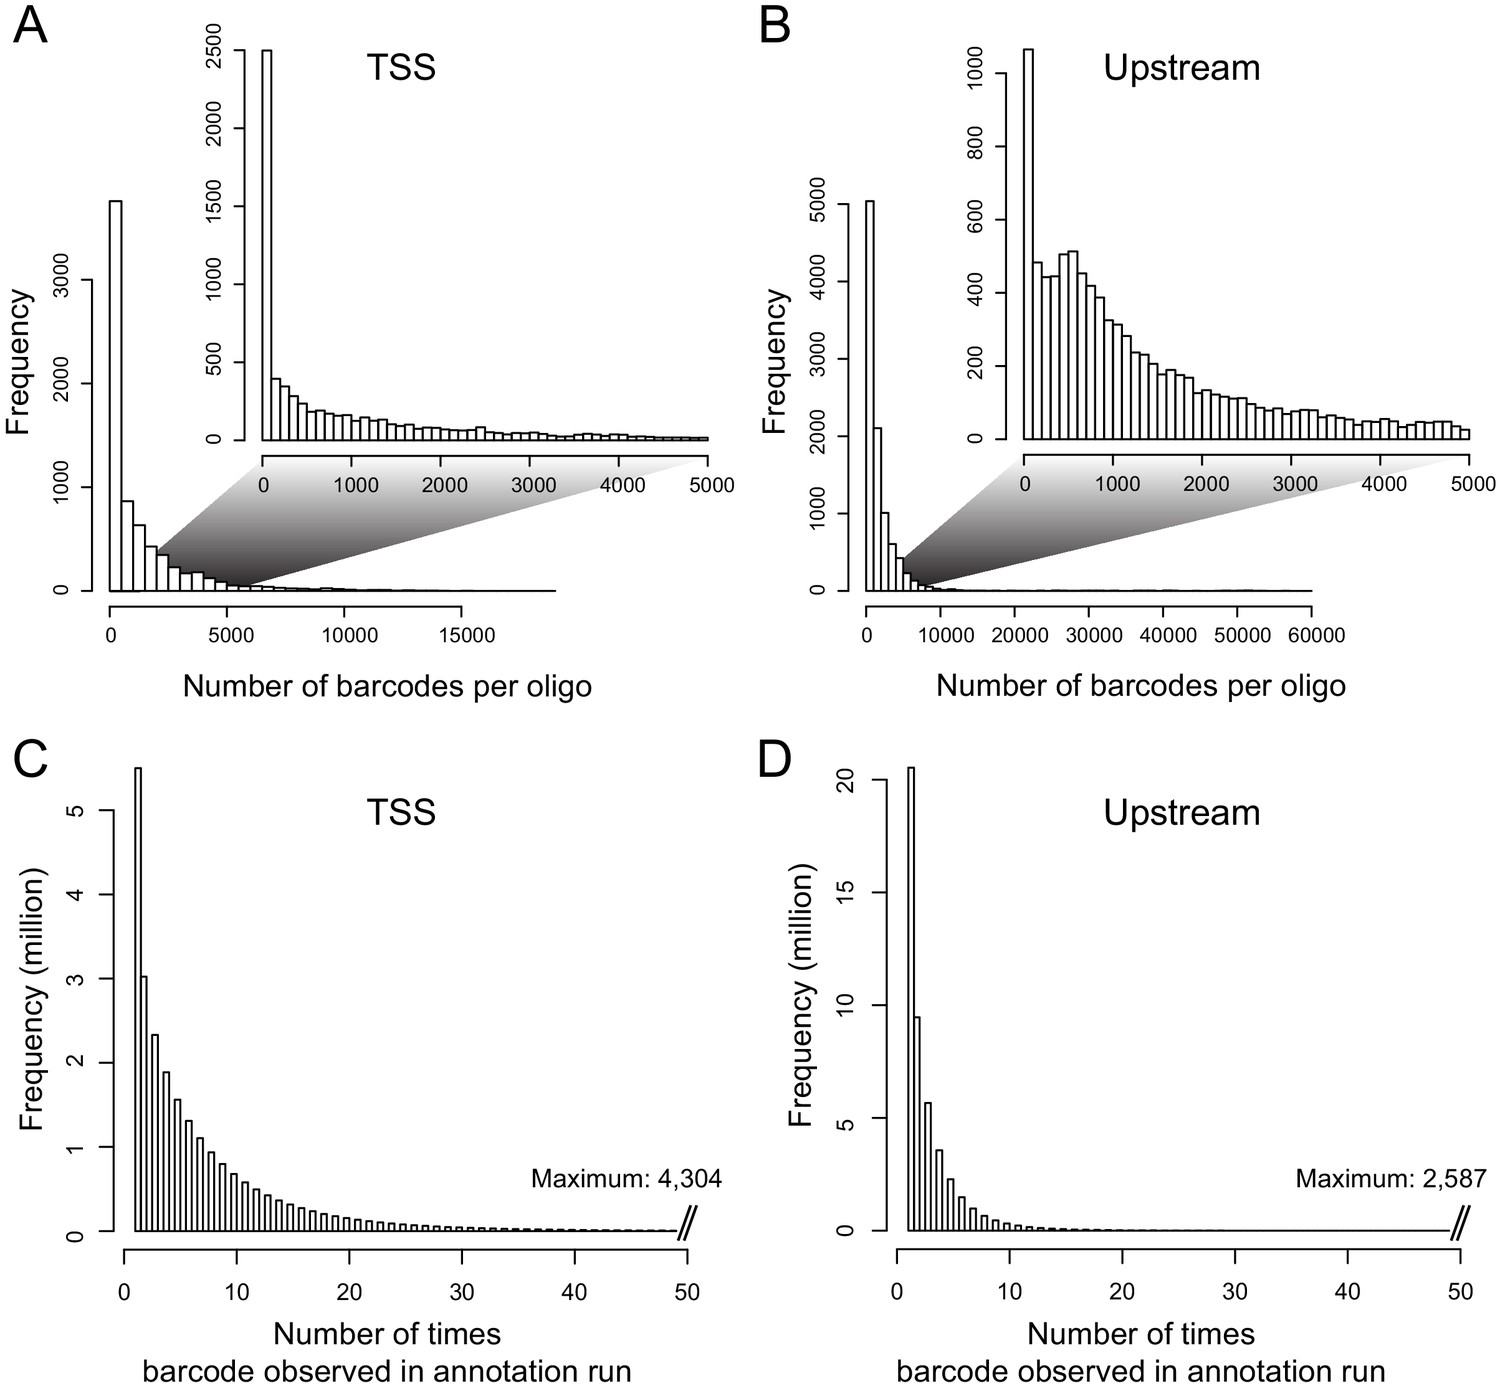
Distributions of barcodes.
(A) Number of barcodes tagging a given oligo in the TSS library. The inset shows the range from zero to 5000 barcodes, which contains the majority of the distribution. (B) as in (A), but for the Upstream library. (C) Distribution of the number of times a given barcode was observed in the TSS annotation sequencing run. (D). As in (C), but for the Upstream library.
Figure 1—figure supplement 5
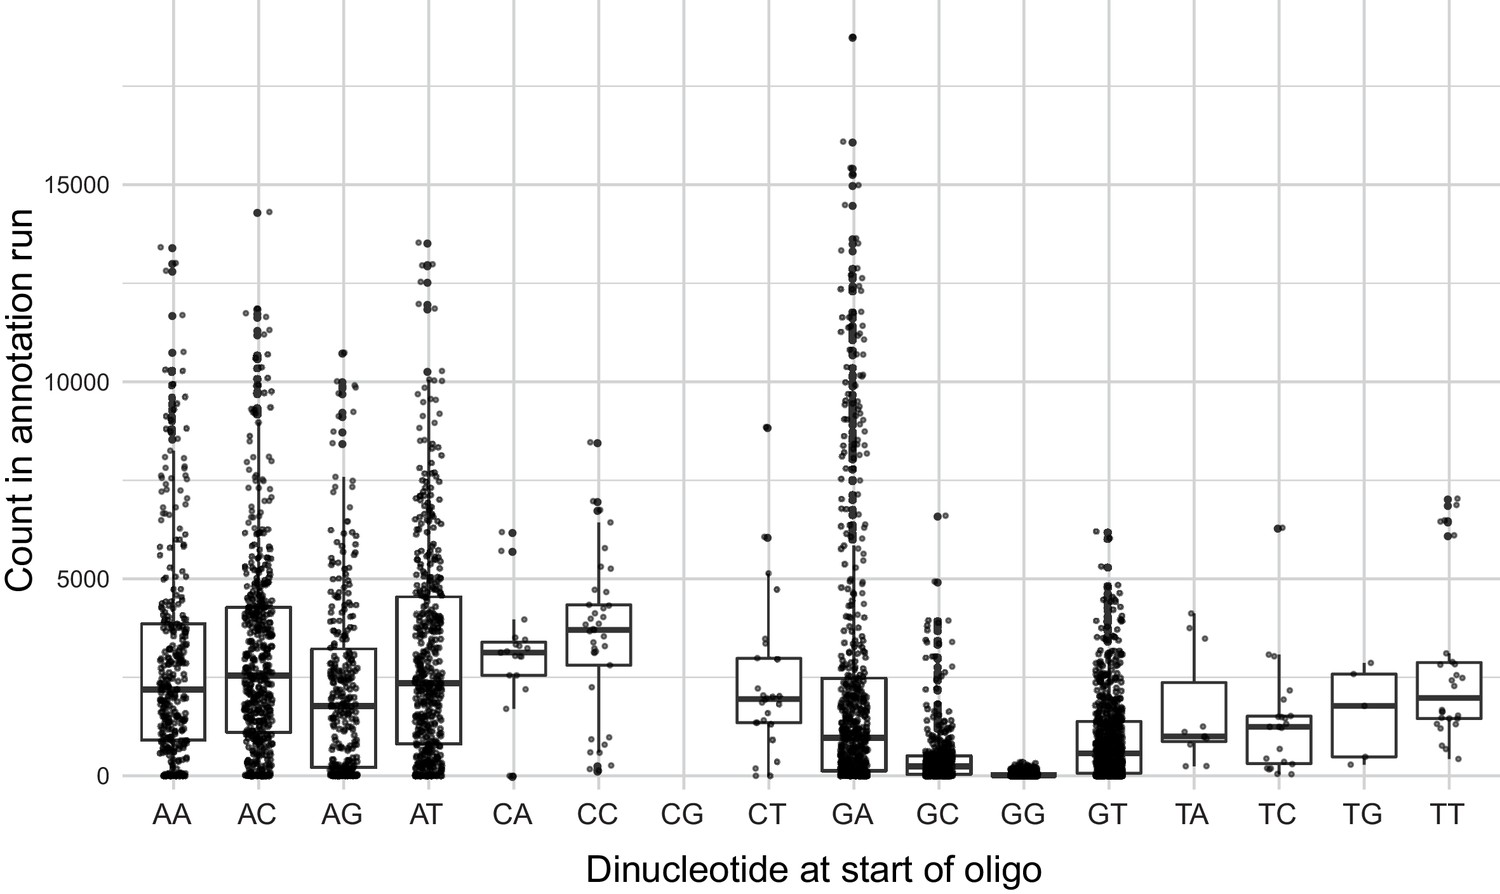
Number of times a given designed oligo was observed in the TSS annotation sequencing run as a function of the first two nucleotides of the oligo.
Boxplots show the median as thick horizontal line, with the box showing the 25th and 75th percentiles. Whiskers show the largest value no further than 1.5 times the inter-quartile range; data points beyond this range are shown as individual dots. Note the reduced counts for oligos starting with a ‘G’, in particular those that started with a ‘GG’.
Figure 1—figure supplement 6
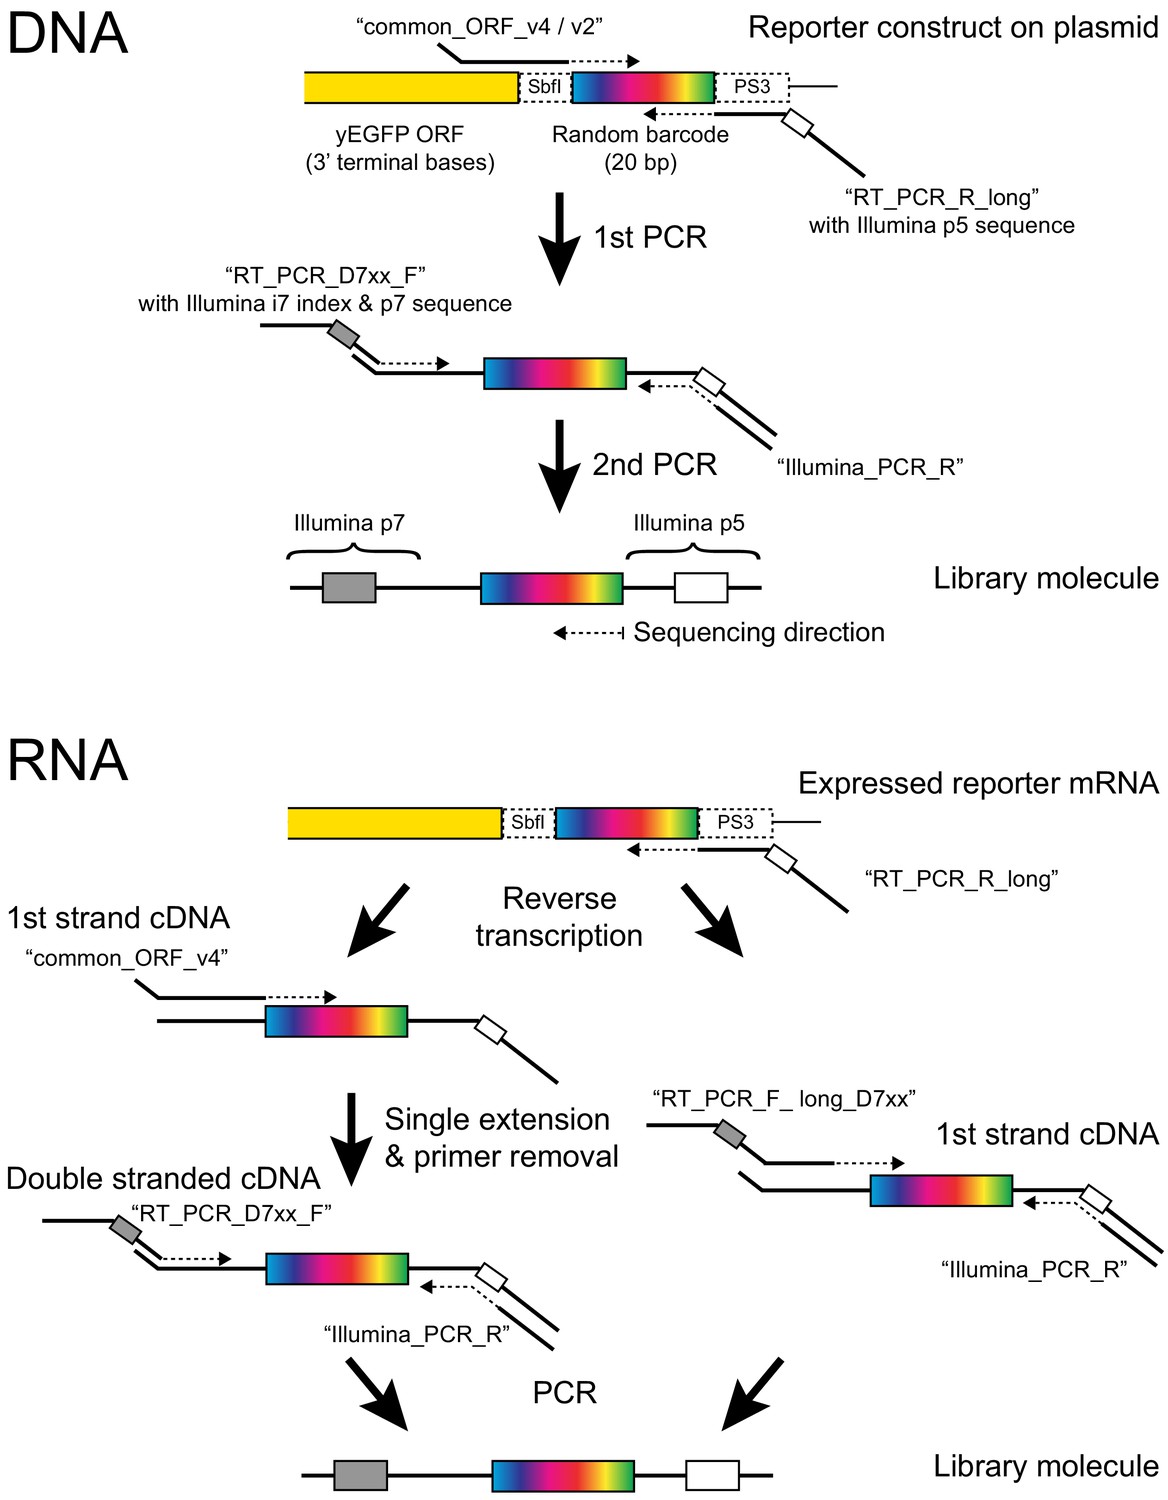
Barcode amplification.
The figure shows details of the molecular reactions used to make Illumina sequencing libraries for barcode counting. Primer names are given in quotes. For RNA, Protocol one is on the left and Protocol two is on the right (see Materials and methods for details). Note that in Protocol 1, the PCR step can exponentially amplify only cDNA but not plasmid molecules that may have escaped DNA degradation during RNA extraction because both PCR primers bind to overhangs added in the previous steps. If, during the single extension step, ‘common_ORF_v4’ uses plasmid DNA as a template, the product lacks the p5 overhang, which contains the binding site for ‘Illumina_PCR_R’. Conversely, if during single extension, ‘RT_PCR_R_long’ (which is still present in the reaction) primes off a plasmid molecule, the product lacks the p7 overhang required by ‘RT_PCR_D7xx_F’. In protocol 2, the primers ‘common_ORF_v2’ and ‘RT_PCRPD7xx_F’ are replaced by primers ‘RT_PCR_F_long_D7xx’. These primers permit direct amplification from plasmids and from first strand cDNA but require multiple long primers for multiplexing and provide less protection against inadvertent plasmid amplification.
Figure 1—figure supplement 7
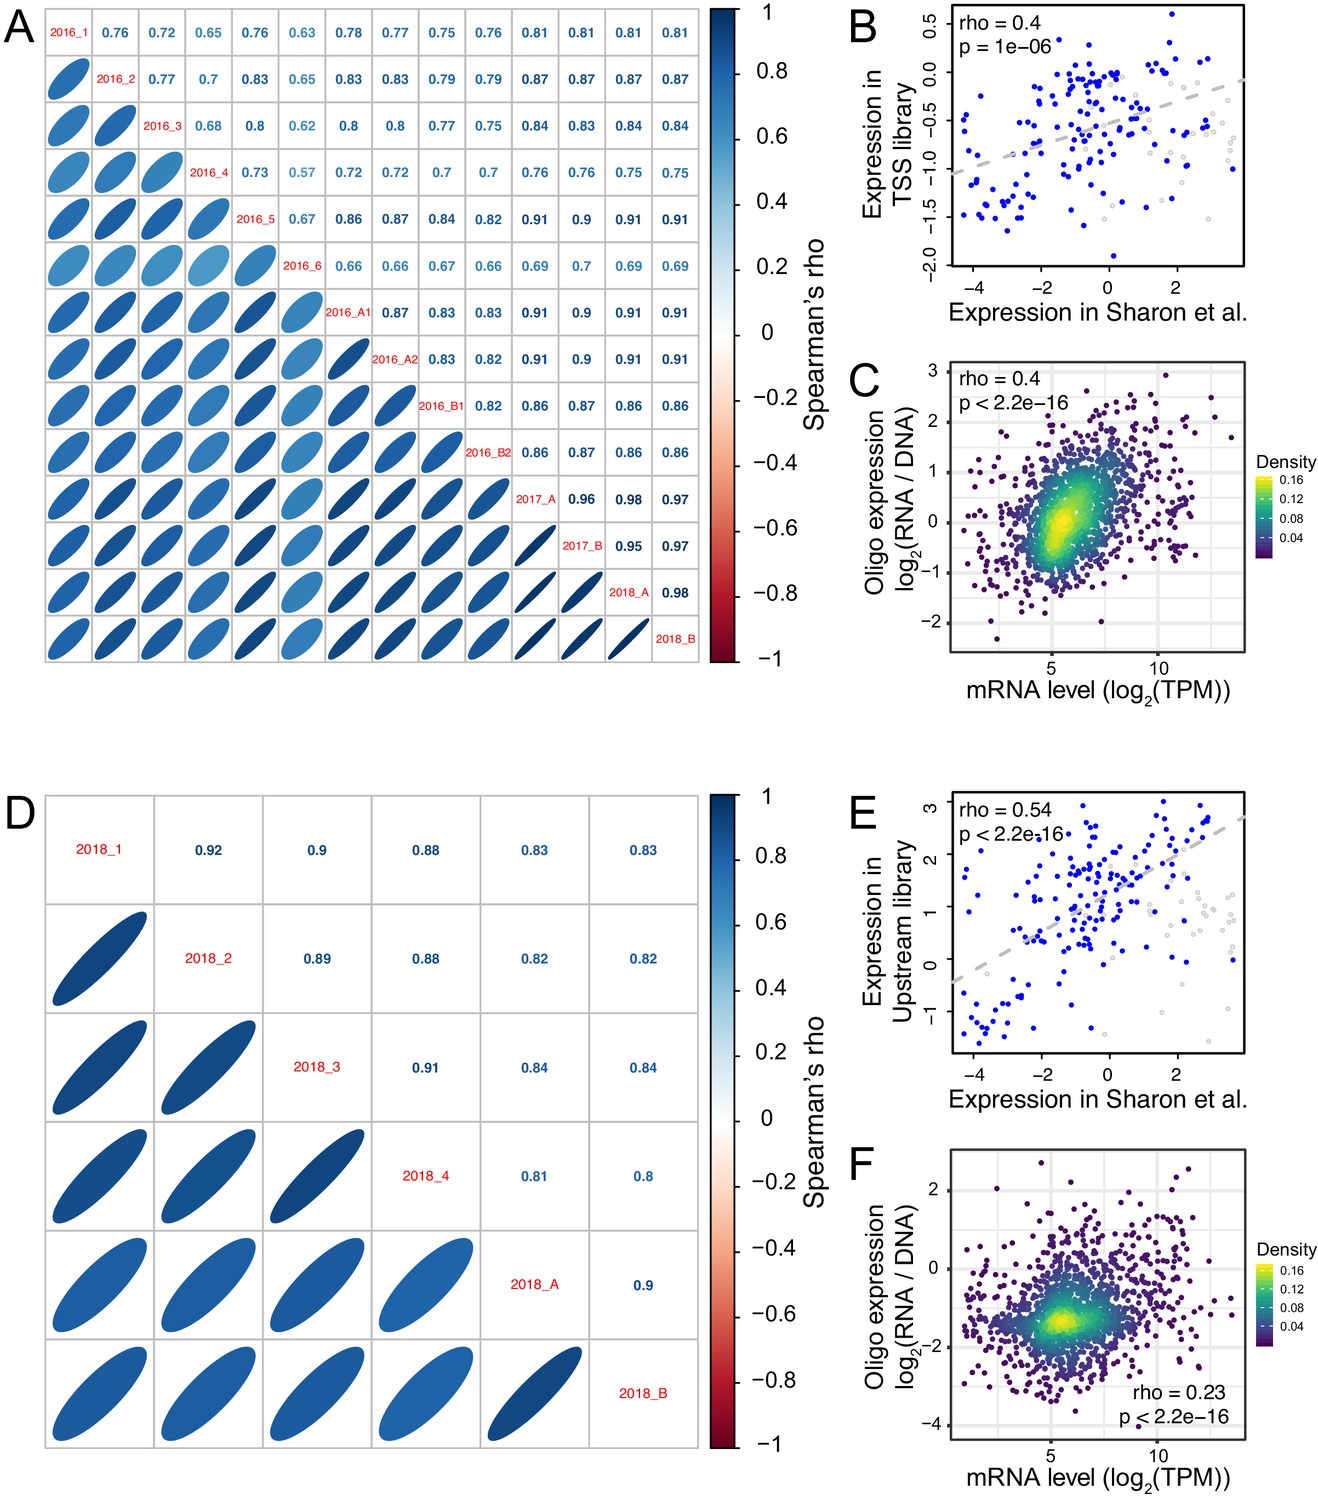
Reproducibility of oligo expression.
(A) Correlations of expression driven by oligos among replicates in the TSS library. (B) Average expression across TSS replicates driven by the 200 oligos from Sharon et al., 2012 compared to their published values. Blue points show oligos that did not include a Gal4 binding site; gray points show oligos that did include such a site. The indicated correlation was computed on oligos without Gal4 sites, because promoters with Gal4 sites are not expected to drive expression in the absence of galactose, as in the medium used here. Note that the correlation between observed and published data exists despite the different growth media between studies, and although Sharon et al. quantified expression by FACS-seq instead of our RNA-seq-based measurements. (C) Average expression driven by TSS oligos from a given gene promoter compared to that gene’s mRNA level in the genome (Albert et al., 2018). TPM: transcripts per million. (D – F) as A – C, but for the Upstream library. The oligos in B and E showed higher correlations in the Upstream library than the TSS library, perhaps because the Upstream library but not the TSS library contained the same minimal HIS3 promoter fragment used in Sharon et al. The correlation with native genes (C and F) was stronger in the TSS than the Upstream library, perhaps because TSS oligos more closely resembled a native promoter due to their closer proximity to the transcription start sites and the TSS library’s lack of the minimal HIS3 promoter.
Figure 1—figure supplement 8
Correlations of expression driven by 200 oligos common to the TSS and Upstream library.
Figure 2 with 1 supplement
Identification of single causal variants.
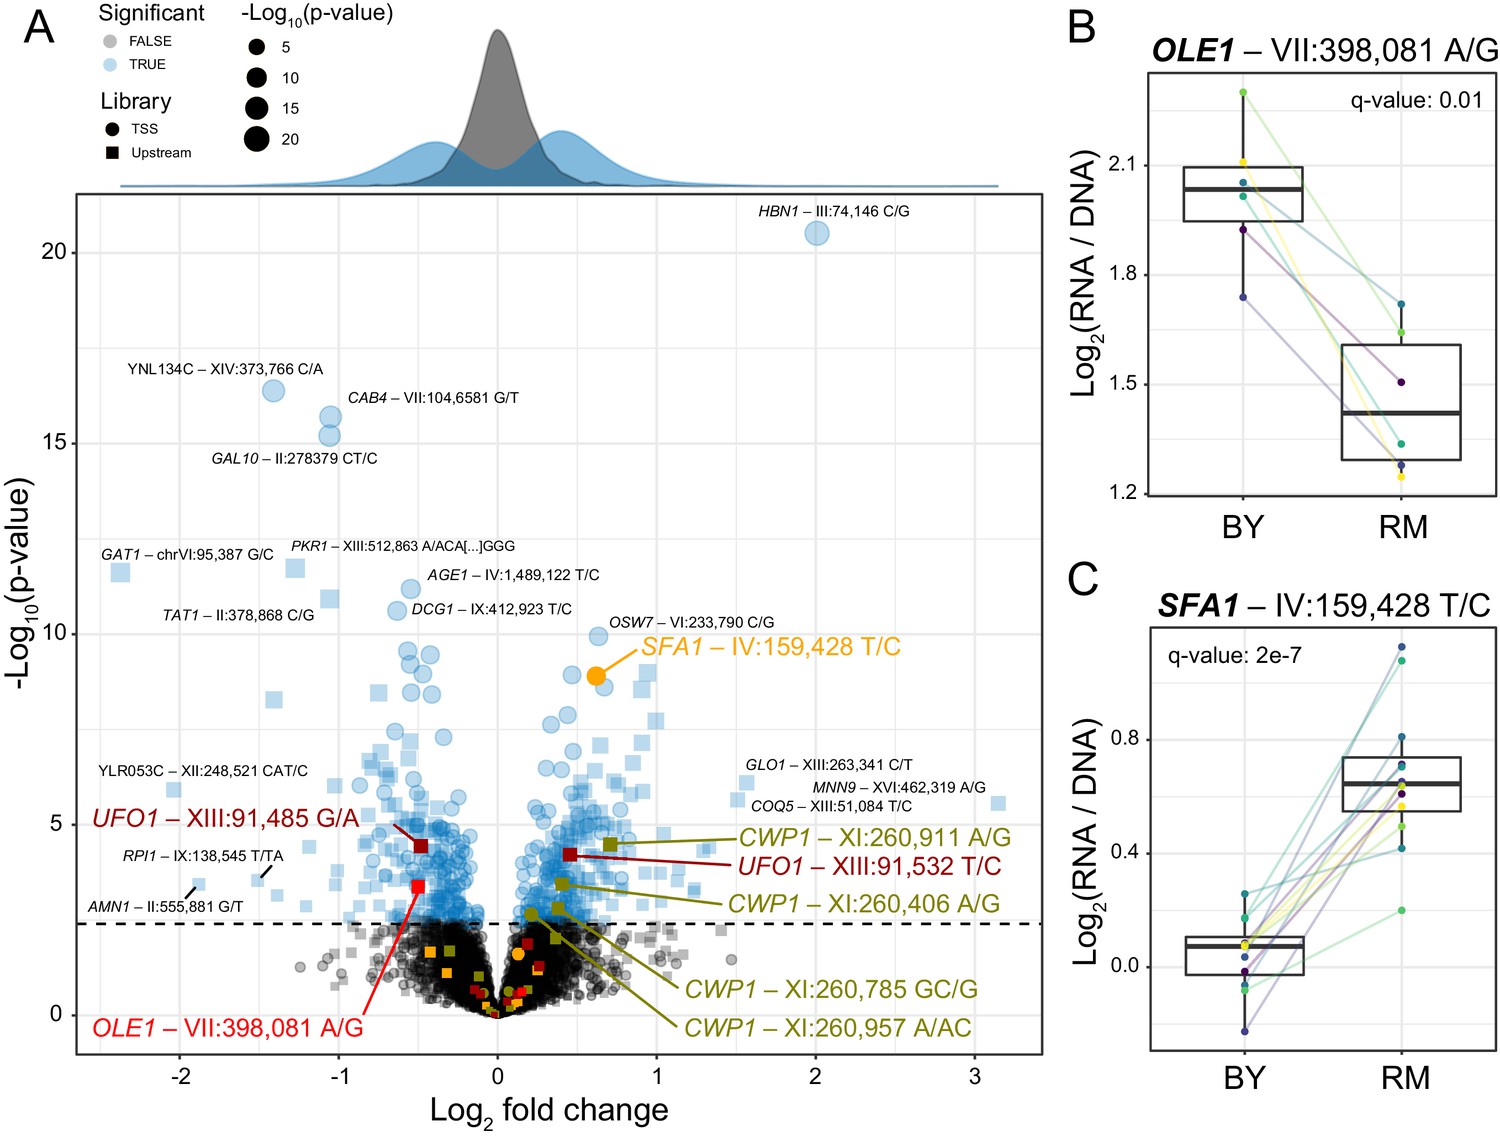
(A) A scatterplot showing the effect size and significance for each variant. The genome-wide significance threshold is shown as a dashed horizontal line. Variants with the most significant effects, along with the genes they affect, are indicated. Variants and genes highlighted in color are described in the text. The histograms at the top shows the distribution of effect sizes for causal (blue) and non-causal (gray) variants. (B) A variant in the promoter of OLE1 known to affect OLE1 expression has a significant effect in the Upstream MPRA. The figure shows expression values for oligos carrying the two alleles. Colored lines and dots indicate different biological replicate experiments. Boxplots show the median as thick line, with the box showing the 25th and 75th percentiles. Whiskers show the largest value no further than 1.5 times the inter-quartile range; points beyond this range are shown as individual points. (C) As in (B) for a variant in the SFA1 promoter, which was detected in the TSS library. To identify individual causal variants, we tested each promoter variant for its effect on reporter gene expression. We detected 166 variants with significant effects in the TSS library and 293 variants in the Upstream library at a false discovery rate (FDR) of 5% (Figure 2—source data 1). The π1 statistic (Storey and Tibshirani, 2003) computed across all variants suggested that at least 26 and 31% of variants had effects on gene expression in the TSS and Upstream libraries, respectively, even if these variants could not all be detected with individual significance. There were 451 unique variants that reached significance across the two partially overlapping libraries (A, Figure 2—source data 2).
-
Figure 2—source data 1
Statistical tests for each variant.
Results for the TSS and Upstream libraries are in separate worksheets.
- https://cdn.elifesciences.org/articles/62669/elife-62669-fig2-data1-v2.xlsx
-
Figure 2—source data 2
Statistical results for each variant after aggregating across the two sub libraries.
- https://cdn.elifesciences.org/articles/62669/elife-62669-fig2-data2-v2.xlsx
Figure 2—figure supplement 1
Reproducibility of variant effects.
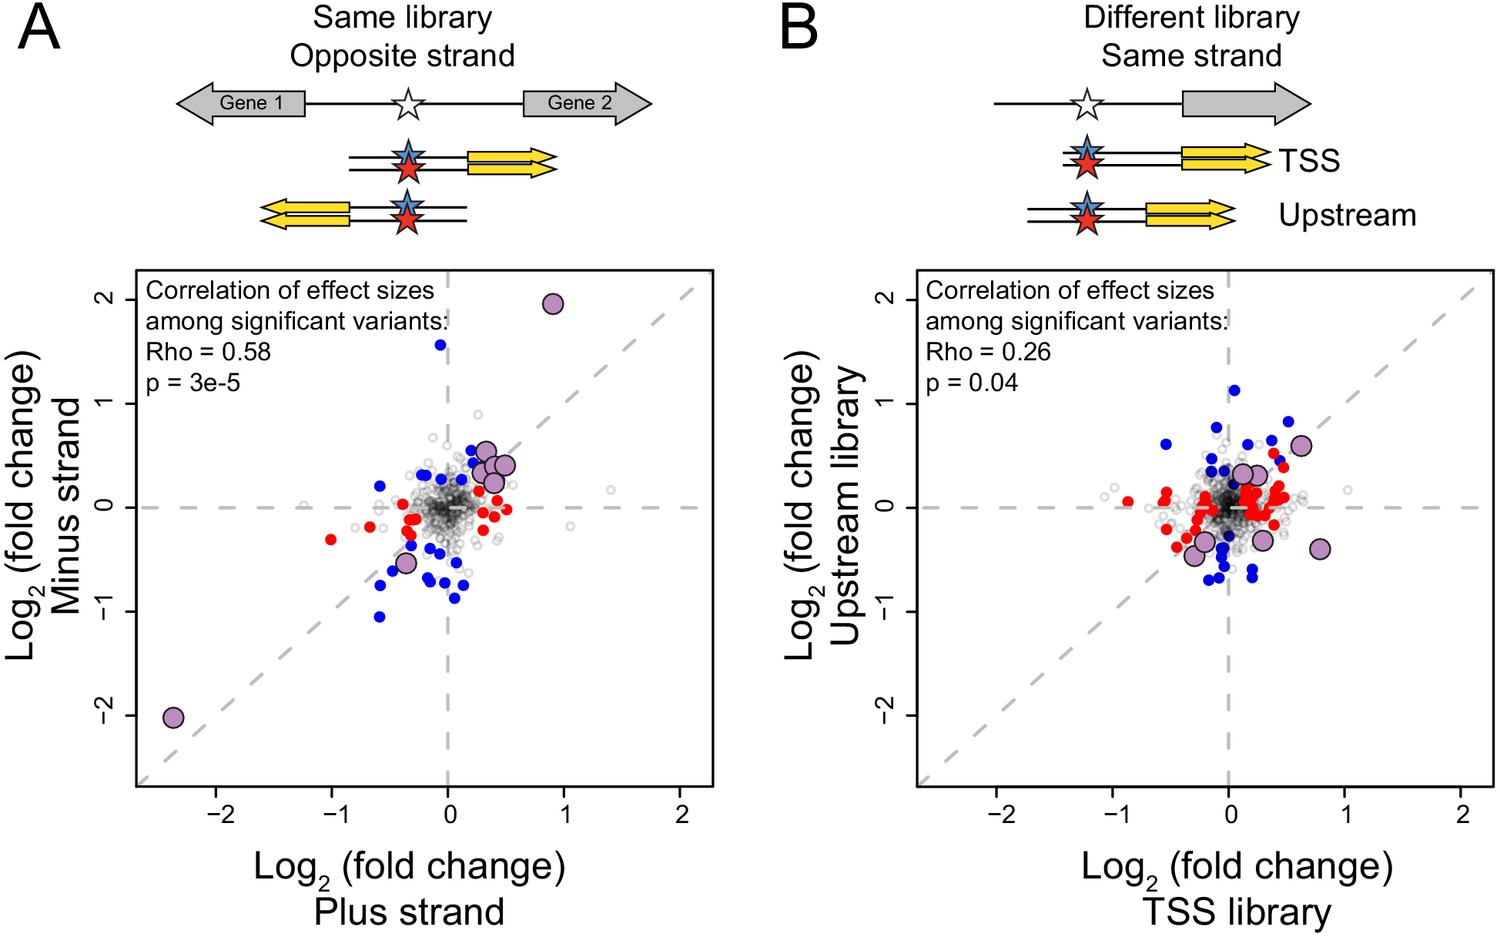
(A) Variants measured in the same library (TSS or Upstream) but in opposite orientation (‘strand’) with respect to the reporter gene. Blue points: variants with significant (5% FDR) effects on the plus strand. Red points: variants with significant effects on the minus strand. Purple, larger points: variants significant in both orientations. The indicated correlations were computed for variants that were significant in at least one of the two orientations. (B) As in (A) but comparing effects of variants measured on the same strand but in the two different libraries.
Figure 3

Comparison of variant effects to local eQTLs.
(A) Scatterplot showing the MPRA effect of the most significant causal variant per gene (y-axis) versus the effect of the local eQTL (x-axis). Red dots indicate local eQTLs with a LOD score of at least 50. Genes describes in the text and in panel (C) are highlighted in bold. Other genes also present in panel (B) are indicated in regular font. The dashed diagonal shows the case of equal MPRA and local eQTL effects. Dashed horizontal and vertical lines indicate no effect. The panel only shows variants with a significant MPRA effect. (B) As in (A), but for the second-most significant causal variant per gene. Note the different scale of the y-axis between A and B. (C). Examples of summed MPRA effects of individual variants compared to the local eQTL for the given gene. (D). Spearman correlation coefficients MPRA variants versus local eQTLs as a function of whether a variant is bound by a nucleosome in the genome. Significance of the correlation is indicated. Error bars show 95% confidence intervals for the strength of the correlation.
-
Figure 3—source data 1
Local eQTLs and variant results.
- https://cdn.elifesciences.org/articles/62669/elife-62669-fig3-data1-v2.xlsx
Figure 4 with 1 supplement

Epistasis among promoter variants.
Each panel shows, for one gene, MPRA expression driven by four oligos with the indicated combination of BY and RM alleles at the two variants. Each panel states the gene name in bold along with multiple-testing adjusted and raw interaction p-values. Variants are given as “chromosome:position reference/alternative allele”. Colored lines between boxplots connect the data for a given oligo in the different biological replicates. Boxplots show the median as thick line, with the box showing the 25th and 75th percentiles. Whiskers show the largest value no further than 1.5 times the inter-quartile range; any observations beyond this range are shown as individual points. (A). Promoter variants for DAD2. (B) Promoter variants for RTT101.
-
Figure 4—source data 1
Results from the test for epistatic interactions.
- https://cdn.elifesciences.org/articles/62669/elife-62669-fig4-data1-v2.xlsx
Figure 4—figure supplement 1
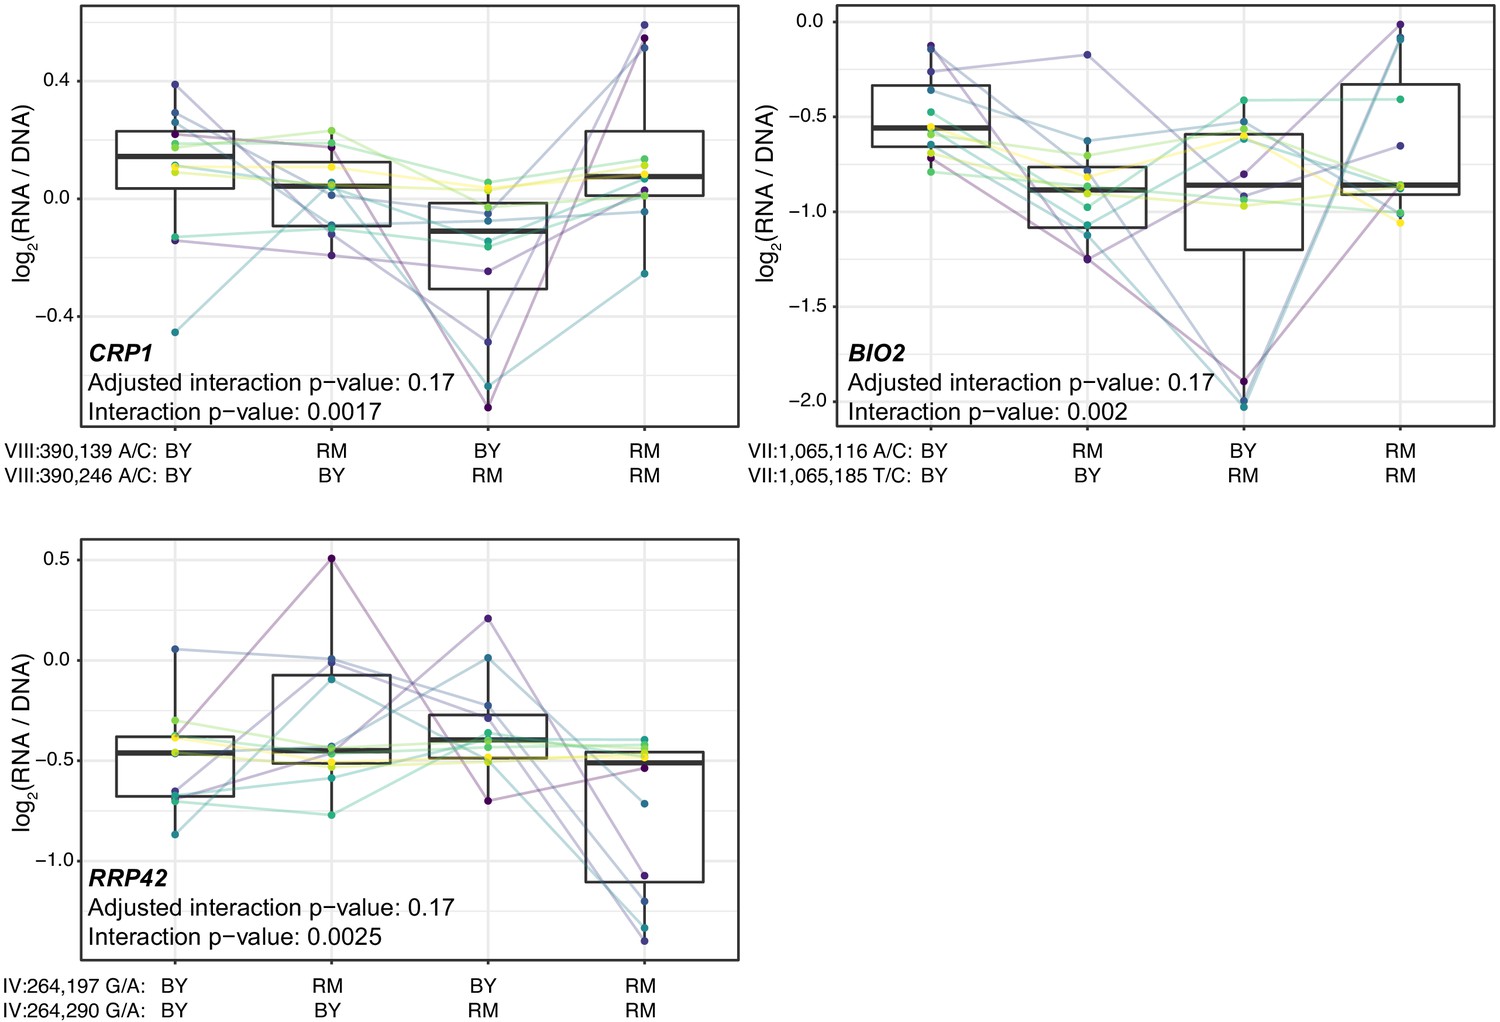
Additional cases of significant epistasis between promoter variants.
Each panel shows, for one gene, MPRA expression driven by four oligos with the indicated combination of BY and RM alleles at the two variants. Each panel states the gene name in bold along with multiple-testing adjusted as well as raw interaction p-values. Variants are given as ‘chromosome:position reference/alternative allele’. Colored lines between boxplots connect the data for a given oligo in the different biological replicates. Boxplots show the median as thick line, with the box showing the 25th and 75th percentiles. Whiskers show the largest value no further than 1.5 times the inter-quartile range; any observations beyond this range are shown as individual points.
Figure 5 with 1 supplement
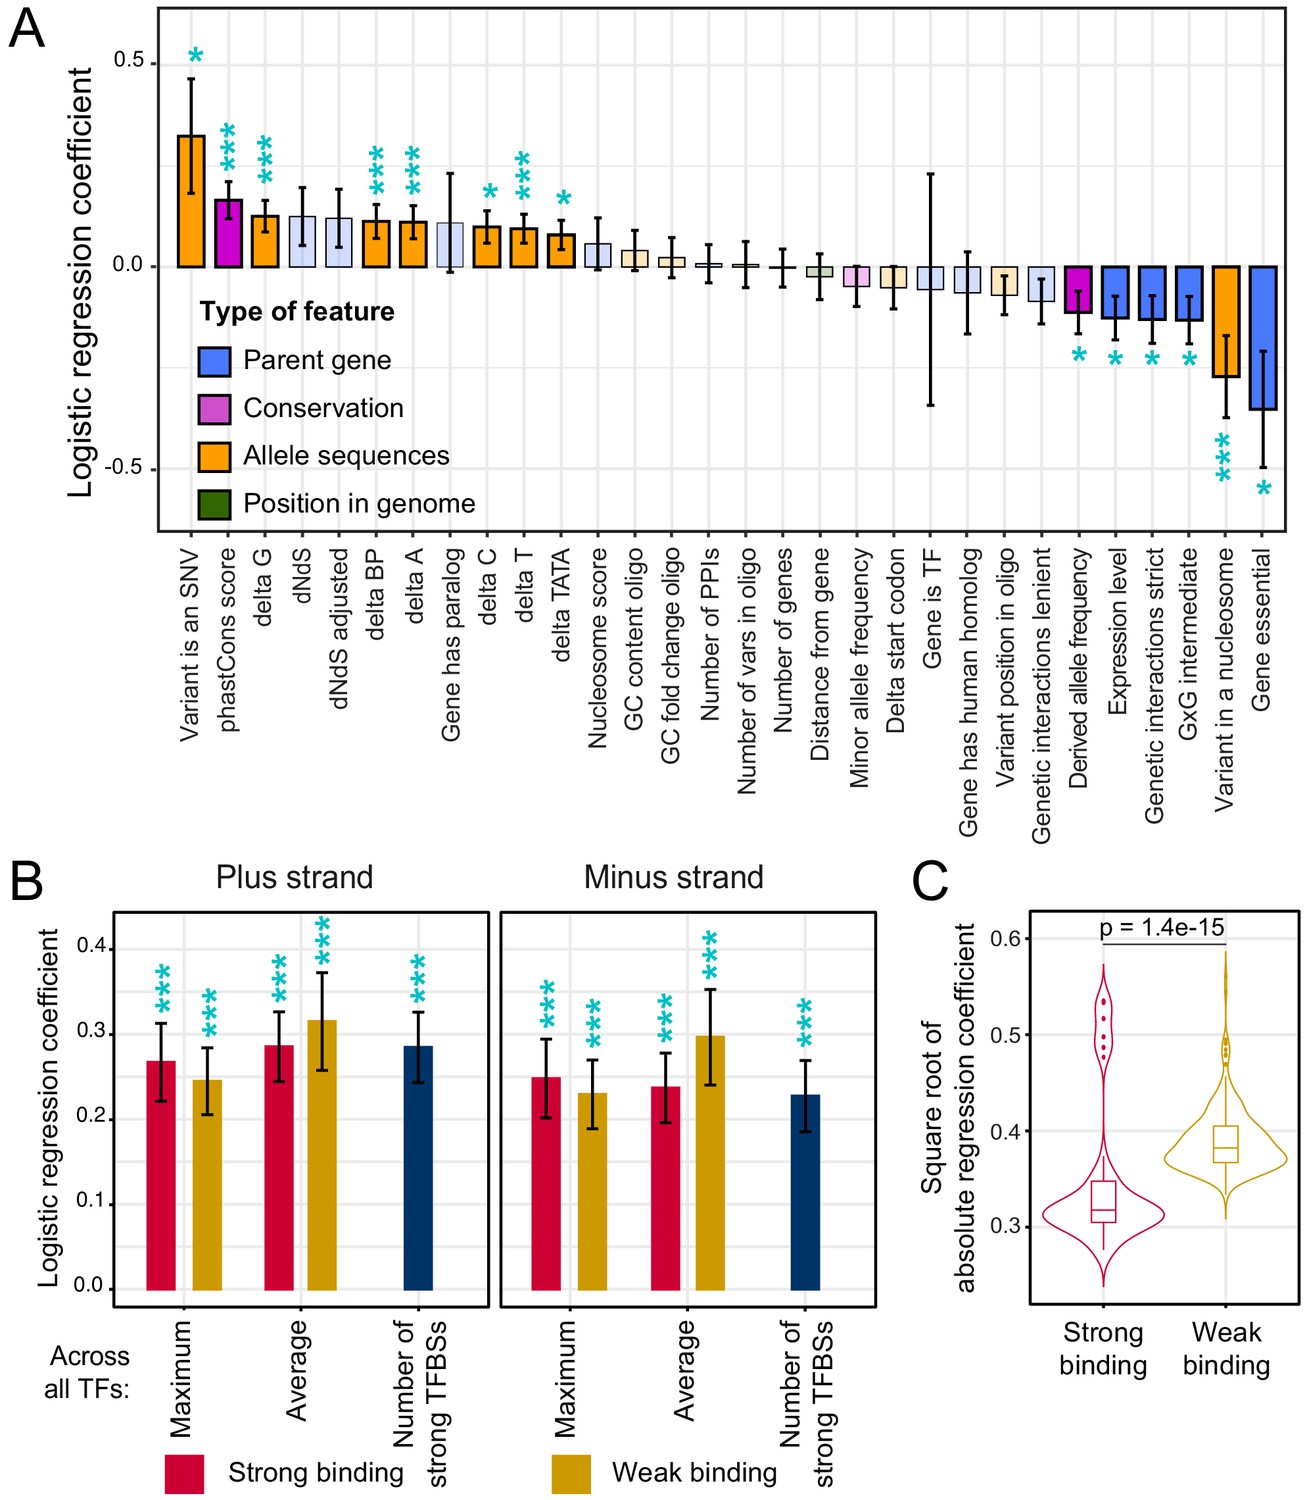
Association of features with variant causality.
(A) Non-TF features. The figure shows the strength of association between each feature and variant causality. Error bars show the standard error of the mean. Significant associations are indicated by three stars (FDR < 5%) or one star (nominal p-value<0.05). Non-significant features are shown in lighter coloring. (B) TF summary features aggregated across all 196 TFs, separated by strand, mode of aggregation across TFs, strength of binding (weak or strong), and mode of comparing allelic PWM scores across sliding sequence windows spanning each variant (Materials and methods). Each of these summary features was significantly associated with variant causality at an FDR of <5%. (C) Distributions of logistic regression estimates for strong vs. weak binding for individual TFs. The p-value shows the result of a Wilcoxon rank test. See also Figure 5—figure supplement 1.
-
Figure 5—source data 1
Single-feature regression analyses of causal variants.
Logistic and linear regression (to predict log-fold change) are in separate worksheets.
- https://cdn.elifesciences.org/articles/62669/elife-62669-fig5-data1-v2.xlsx
Figure 5—figure supplement 1
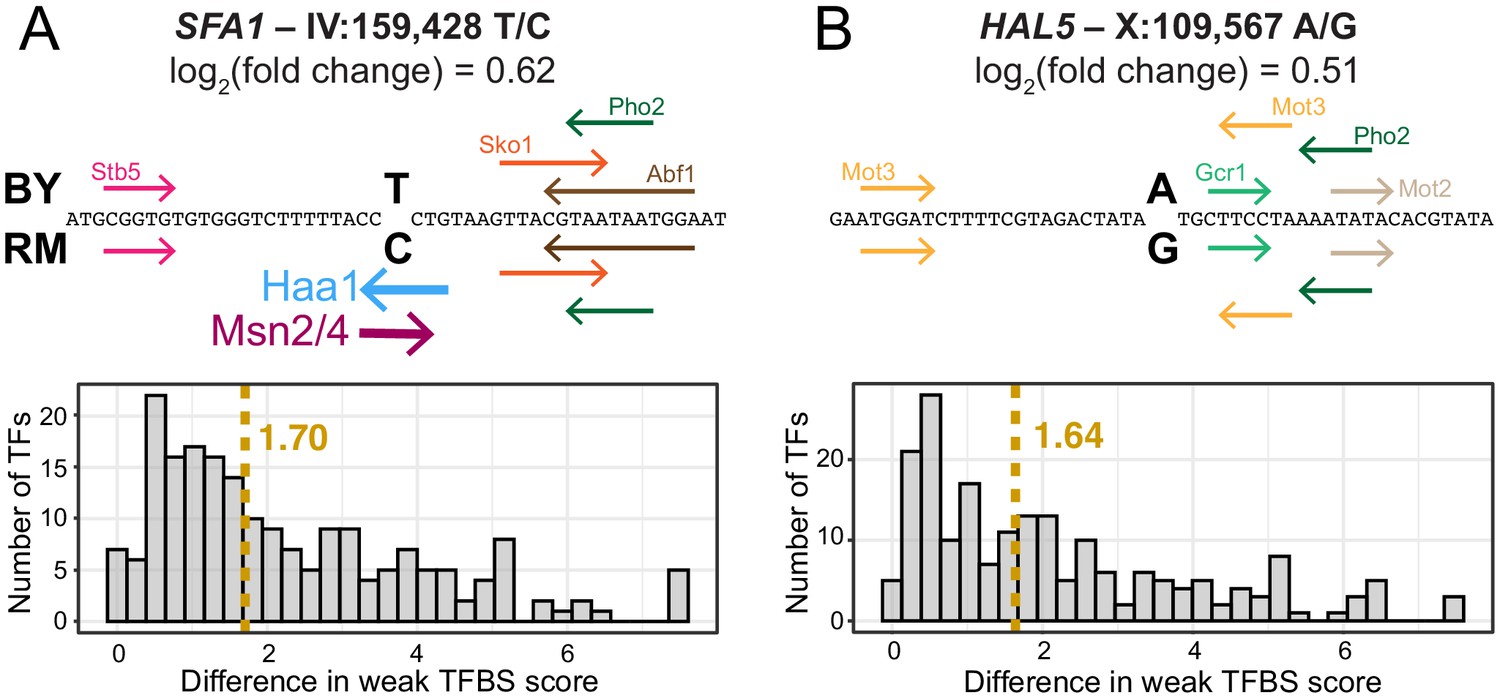
Examples of predicted TFBS changes at individual variants.
(A) A variant in the promoter of the SFA1 gene alters a strong Msn2/4 motif (Yeastract consensus motif: CCCCT); as well as a strong Haa1 motif (SMGGSG). TFBSs detected by the Yeastract website in the given sequence are shown as colored arrows indicating the strand on which the motif match was detected. TFBSs above the sequence were detected for the BY allele, while those below the sequence were detected for the RM allele. Two TFBSs that differ between the alleles are shown as stronger lines. The histogram shows the distribution of change in TFBS score to weak TFBSs. The dashed yellow line indicates the median change in TFBS score. TFBS scores correspond to log2(predicted likelihood of binding). (B) A variant in the promoter of the HAL5 gene that did not alter strong TFBSs. Nevertheless, this variant caused a similar change in gene expression, accompanied by a similar median change to weak TFBSs, as the variant in (A).
Figure 6
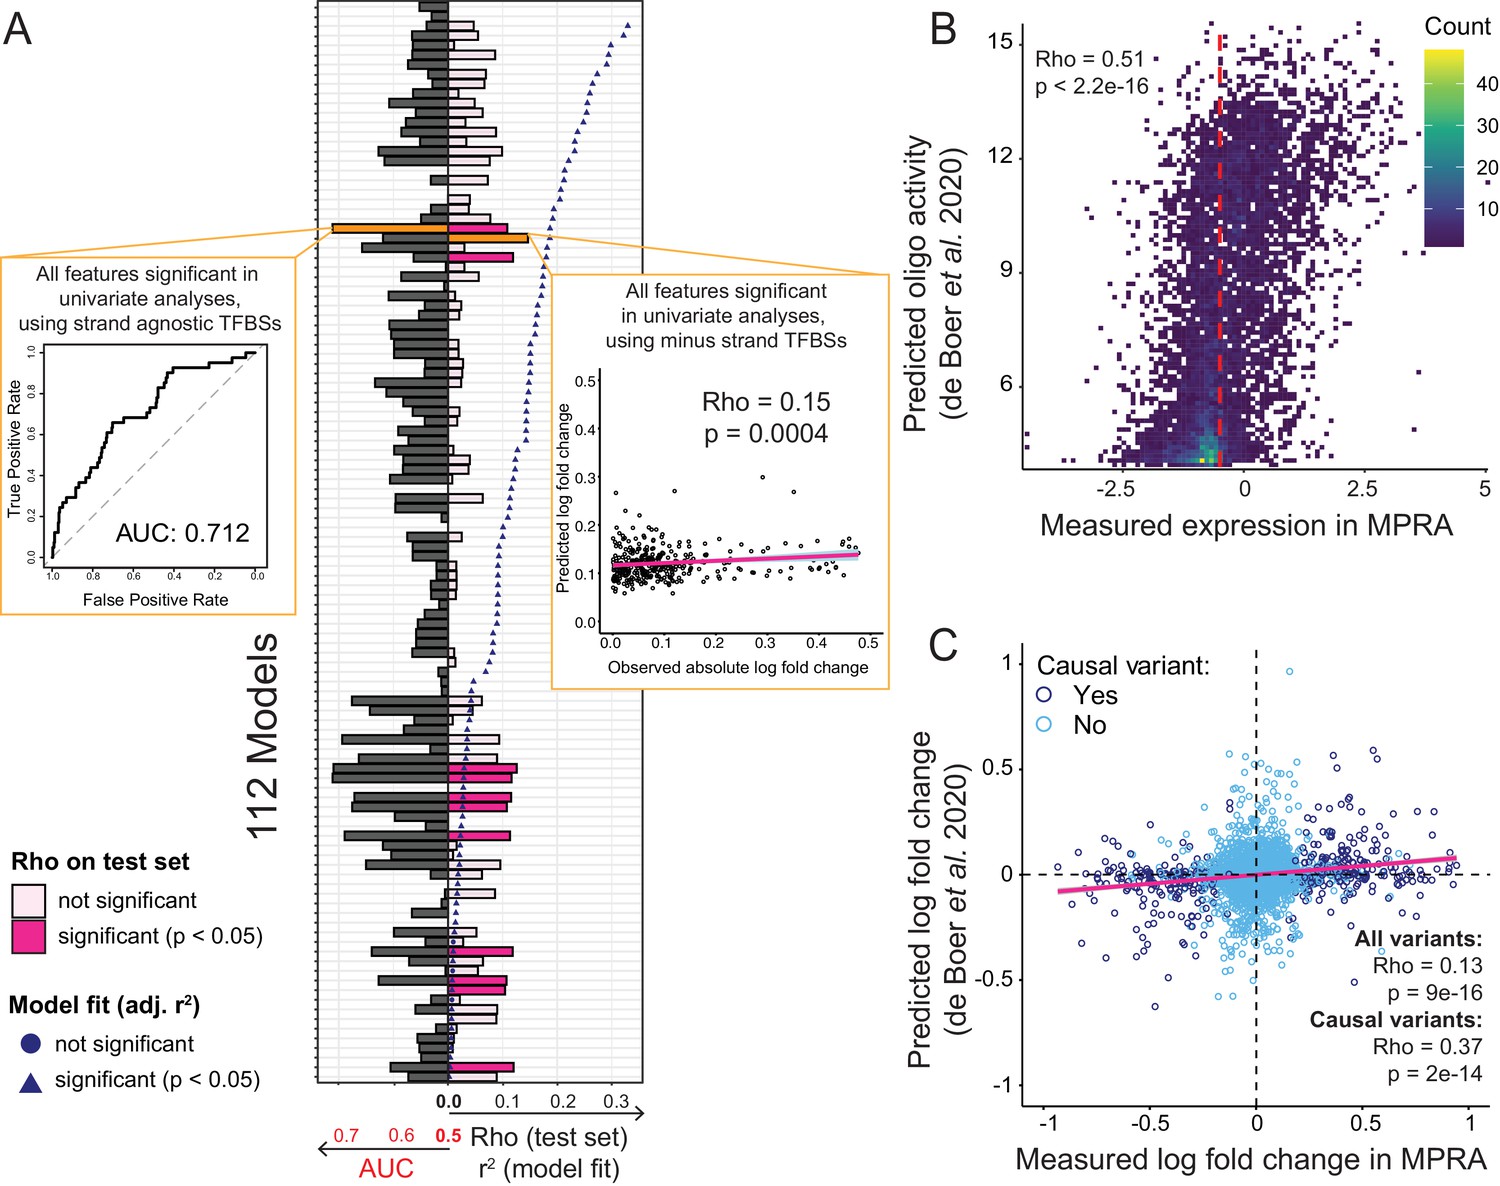
Prediction of causal variants and variant effects.
(A) Prediction results for 112 models. On the left, the plot shows the performance of binomial classifiers on the 10% test as black bars. On the right, the plot shows the performance of the linear predictors of variant effects as spearman correlation coefficients (rho) between actual and predicted log-fold changes in expression as pink bars. Blue symbols show r2 values for each model when fit to the entire dataset. The best classifier and linear model are indicated by orange bars and shown as insets. (B) Measured expression driven by each oligo versus expression predicted by the de Boer model. The dashed red line denotes the median measured expression level. (C) Observed fold-changes of individual variants measured in our MPRA versus fold-changes predicted by the de Boer model. The pink line shows the linear regression fit for all variants.
-
Figure 6—source data 1
Multiple-feature regression analyses of causal variants.
Logistic and linear regression (to predict log-fold change) are in separate worksheets.
- https://cdn.elifesciences.org/articles/62669/elife-62669-fig6-data1-v2.xlsx
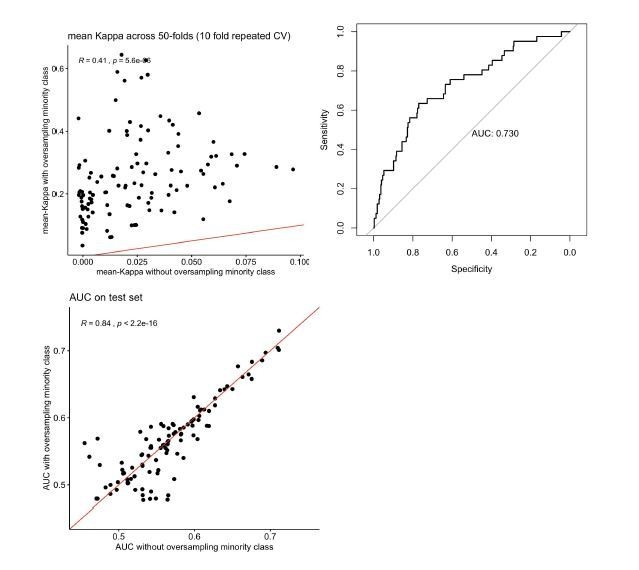
Author response image 1
Tables
Table 1
Library design and representation in experiments.
| Library | TSS | Upstream |
|---|---|---|
| Designed oligos | 7211 | 9882 |
| Variants in design | 3645 | 4547 |
| Genes in design | 2172 | 1918 |
| Oligos in finished library | 6565 | 9646 |
| Barcodes | 9.2 million | 20 million |
| Median barcodes per oligo | 590 | 1008 |
| Variants with data | 2427 | 4467 |
| Genes with data | 1429 | 1824 |
| Number of replicates | 12 | 6 |
-
Table 1—source data 1
Information on replicate samples.
- https://cdn.elifesciences.org/articles/62669/elife-62669-table1-data1-v2.xlsx
Key resources table
| Reagent type (species) or resource | Designation | Source or reference | Identifiers | Additional information |
|---|---|---|---|---|
| Strain, strain background (Saccharomyces cerevisiae) | BY4741 | Albert et al., 2018 (doi:10.7554/eLife.35471) | ||
| Recombinant DNA reagent | RCP83 plasmid | This paper; (Addgene plasmid #163466) | Plasmid backbone | |
| Recombinant DNA reagent | SurePrint Oligonucleotide Libraries | Agilent | Custom DNA oligo library | |
| Gene (Aequorea victoria) | yEGFP | pKT0127 (Addgene plasmid #8728) | Reporter gene | |
| Software, algorithm | R version 3.5.0 | https://www.r-project.org | Data analysis |
Author response table 1
| Library | Fisher’s exact test (odds ratio) | Fisher’s exact test (p-value) | Correlation w/ number significant ASE datasets (rho) | Correlation w/ number significant ASE datasets (p-value) | Correlation with ASE magnitude (rho) | Correlation with ASE magnitude (p-value) |
|---|---|---|---|---|---|---|
| TSS | 3.1 | 3e-7 | 0.18 | 2e-8 | 0.11 | 0.0009 |
| Upstream | 2.8 | 6e-10 | 0.21 | 3e-12 | 0.13 | 0.00001 |
Additional files
-
Supplementary file 1
Oligo design.
- https://cdn.elifesciences.org/articles/62669/elife-62669-supp1-v2.xlsx
-
Supplementary file 2
Oligo counts per replicate.
- https://cdn.elifesciences.org/articles/62669/elife-62669-supp2-v2.xls
-
Supplementary file 3
Non-TF features for each variant, along with statistical results for each variant.
- https://cdn.elifesciences.org/articles/62669/elife-62669-supp3-v2.xlsx
-
Supplementary file 4
All features used in variant annotation, including TFBS.
(gzipped text file).
- https://cdn.elifesciences.org/articles/62669/elife-62669-supp4-v2.txt.gz
-
Supplementary file 5
Primers sequences and sequences of various components of the reporter gene construct.
- https://cdn.elifesciences.org/articles/62669/elife-62669-supp5-v2.xlsx
-
Supplementary file 6
BY/RM sequence variants used in MPRA design (gzipped vcf file).
- https://cdn.elifesciences.org/articles/62669/elife-62669-supp6-v2.vcf.gz
-
Supplementary file 7
Sequence and map of a plasmid in the library after completed library construction.
In place of the library, the sequence contains an example promoter fragment.
- https://cdn.elifesciences.org/articles/62669/elife-62669-supp7-v2.gb.txt
-
Transparent reporting form
- https://cdn.elifesciences.org/articles/62669/elife-62669-transrepform-v2.docx
Download links
A two-part list of links to download the article, or parts of the article, in various formats.
Downloads (link to download the article as PDF)
Open citations (links to open the citations from this article in various online reference manager services)
Cite this article (links to download the citations from this article in formats compatible with various reference manager tools)
Systematic identification of cis-regulatory variants that cause gene expression differences in a yeast cross
eLife 9:e62669.
https://doi.org/10.7554/eLife.62669


